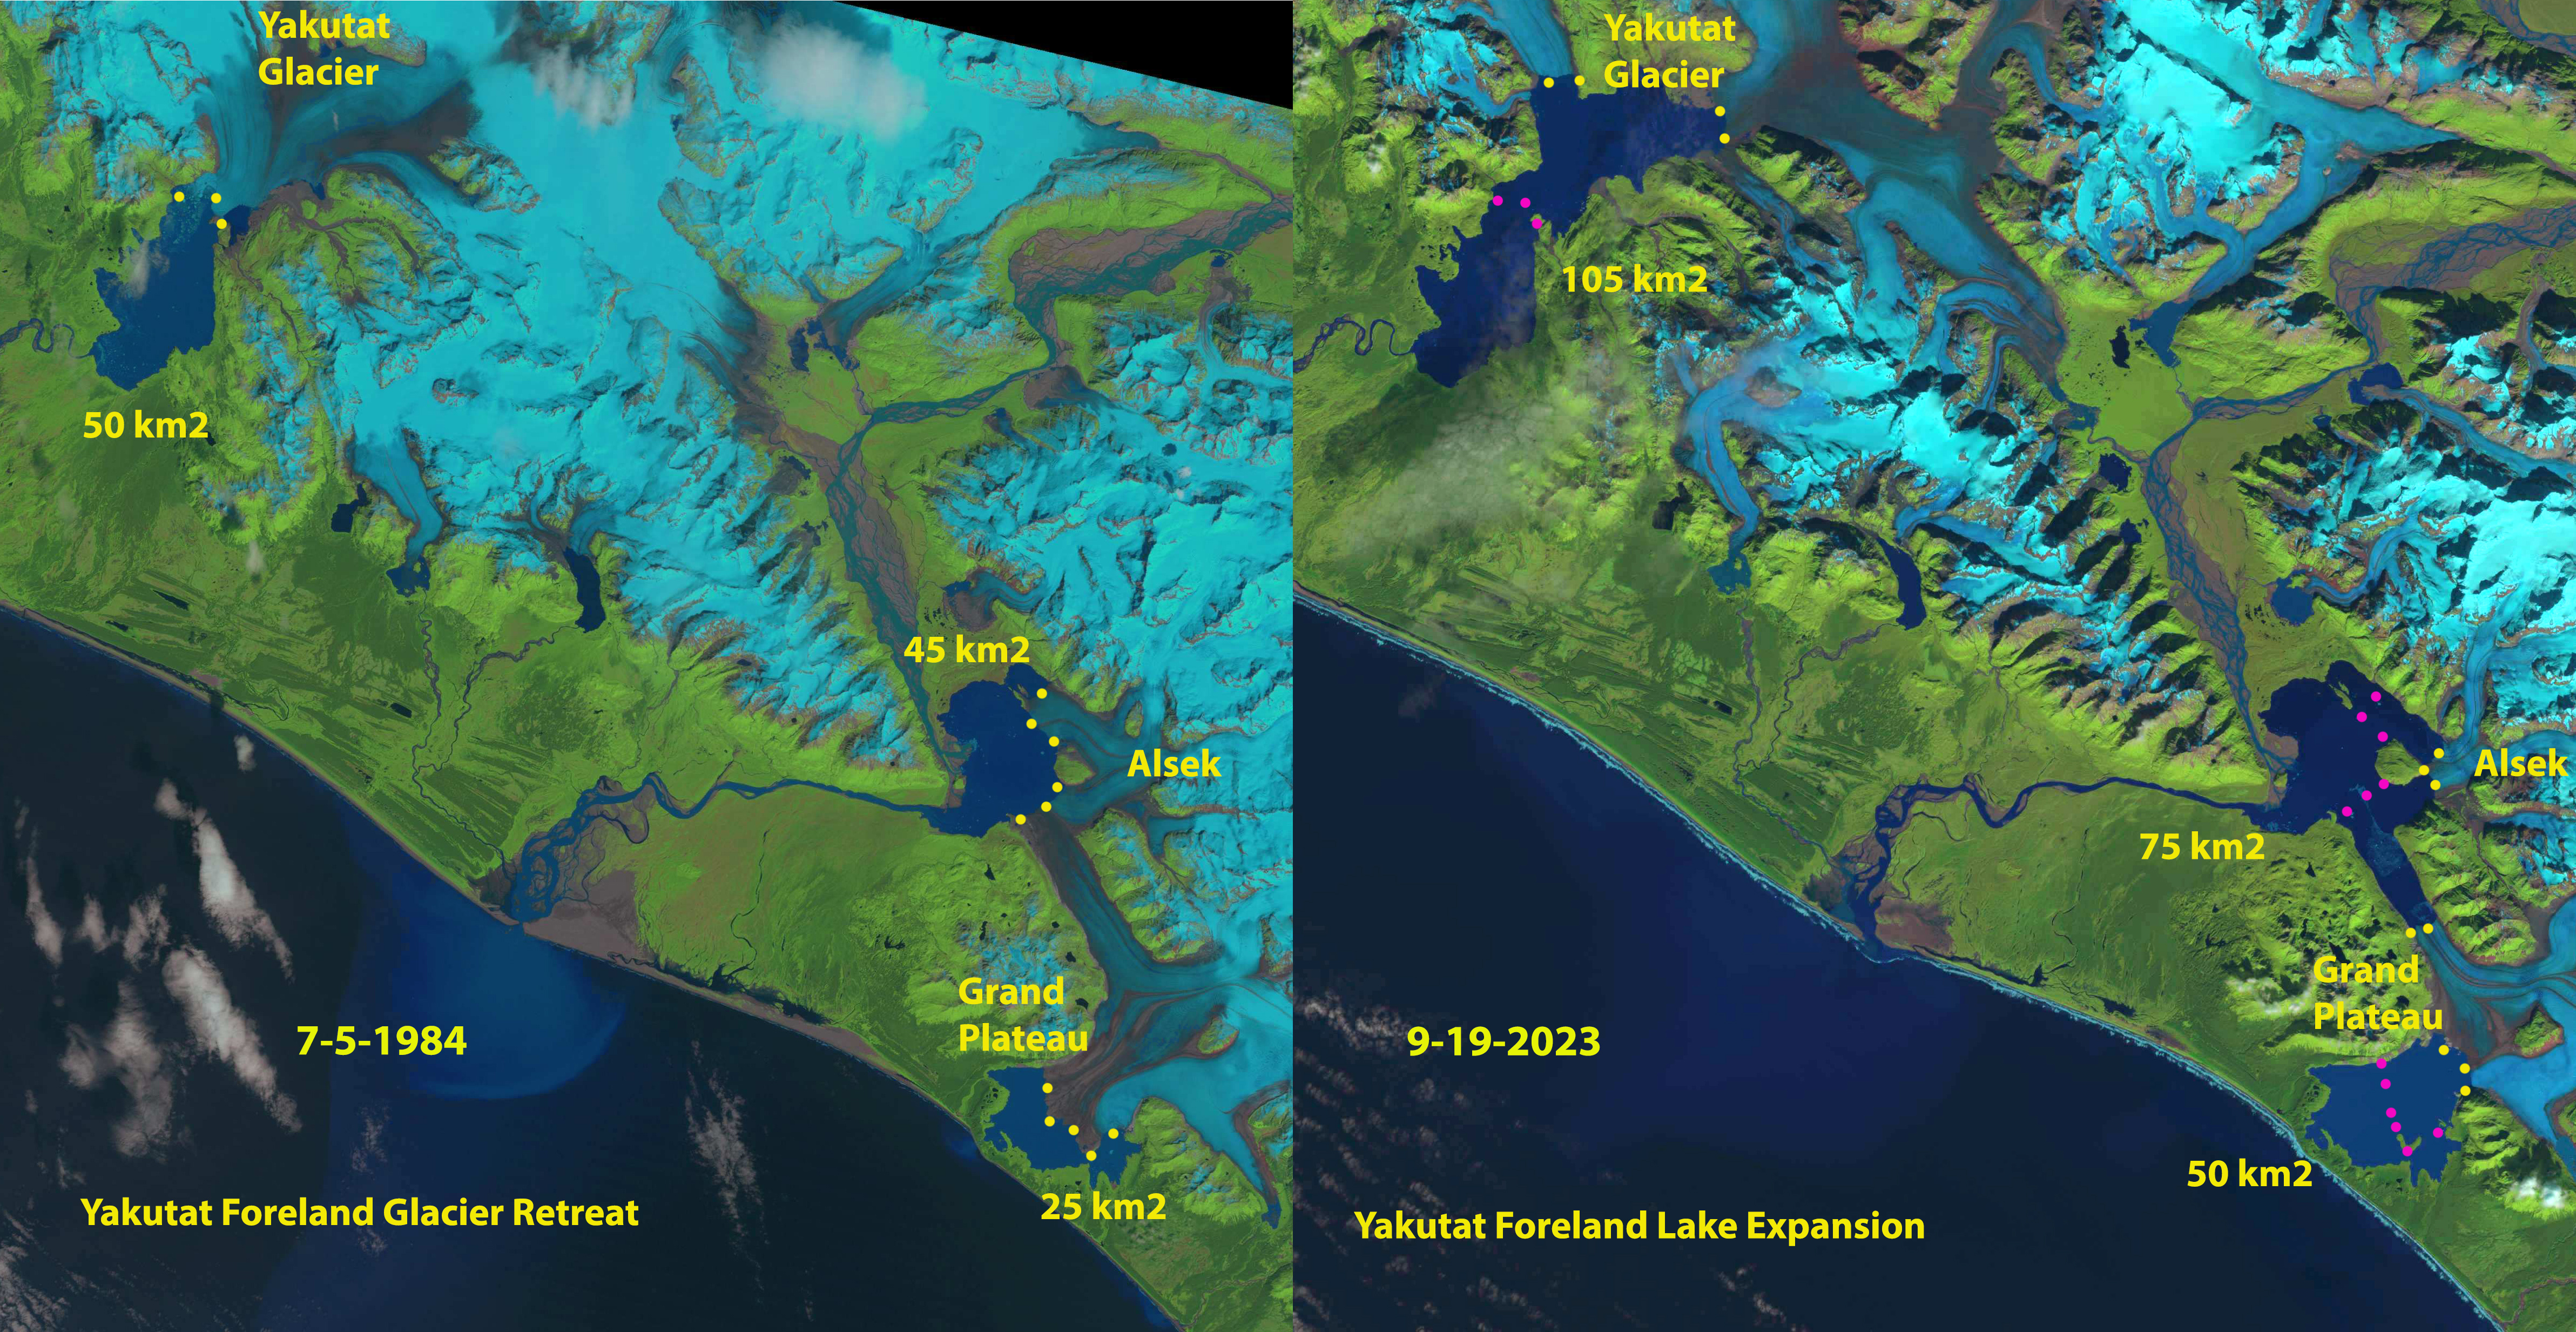
Three adjacent glaciers terminating on the coastal plain near Yakutat, Alaska have had a spectacular retreat in the last 40 years leading to rapid lake growth; Yakutat Glacier, Alsek Glacier and Grand Plateau Glacier. This is the story of the most rapid area of lake growth in the United States this century.
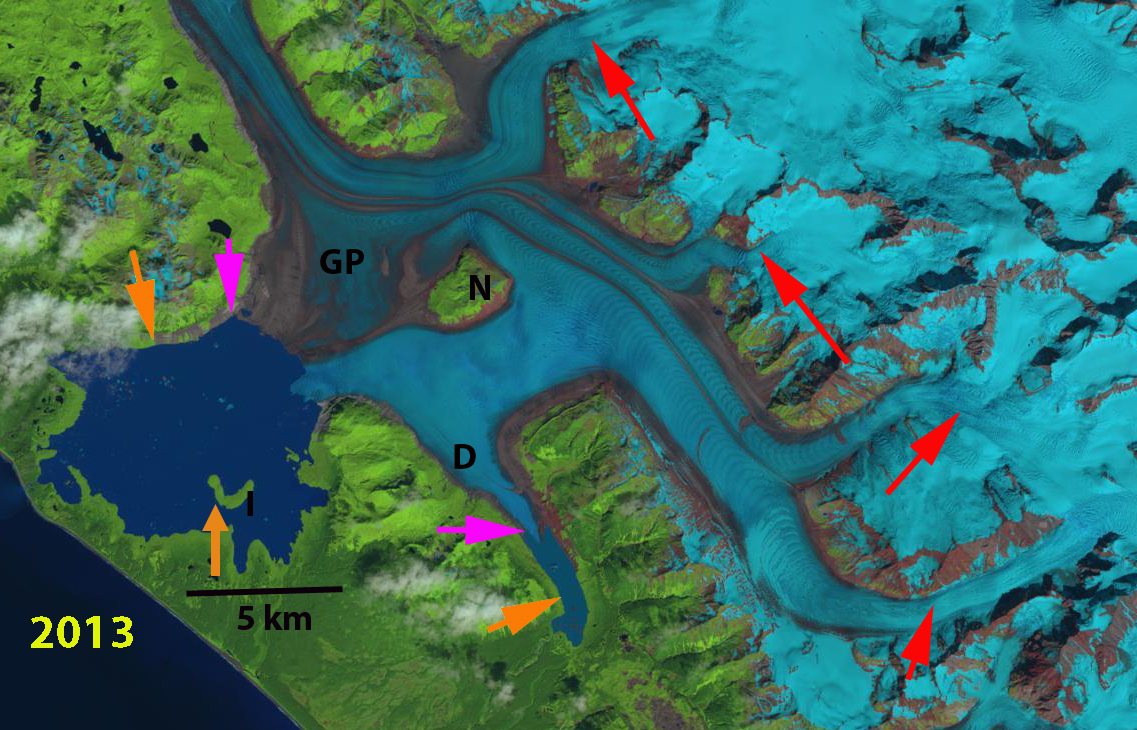
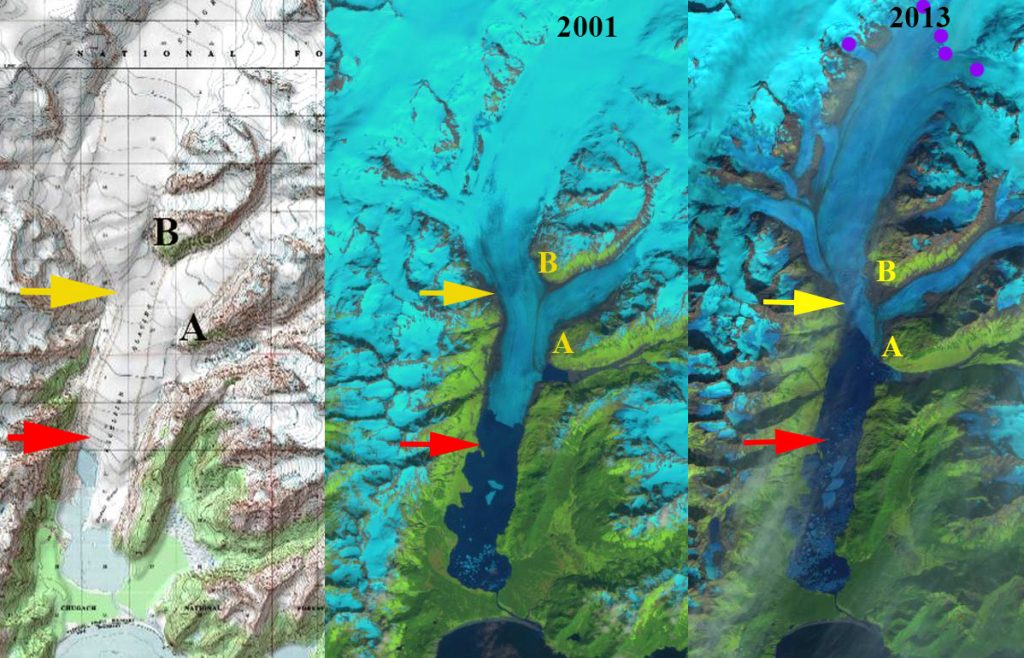
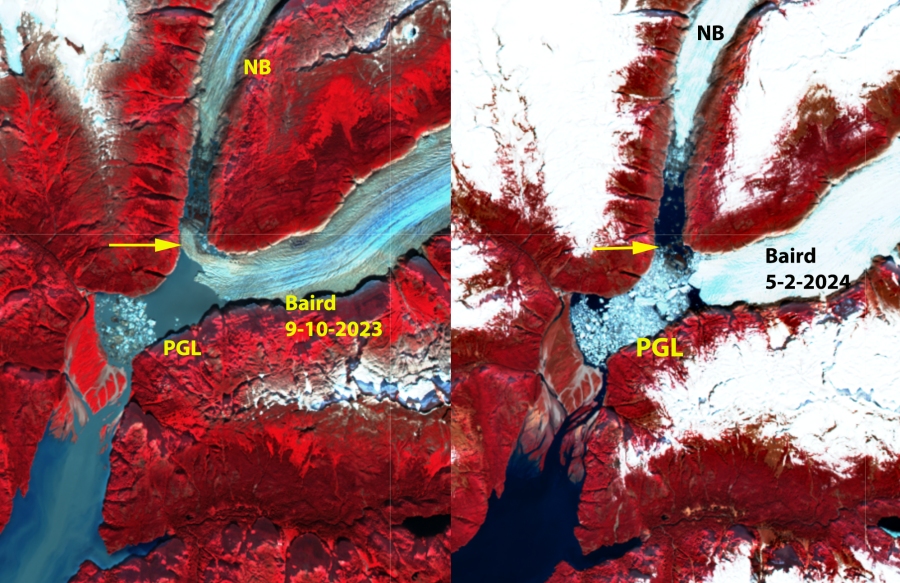
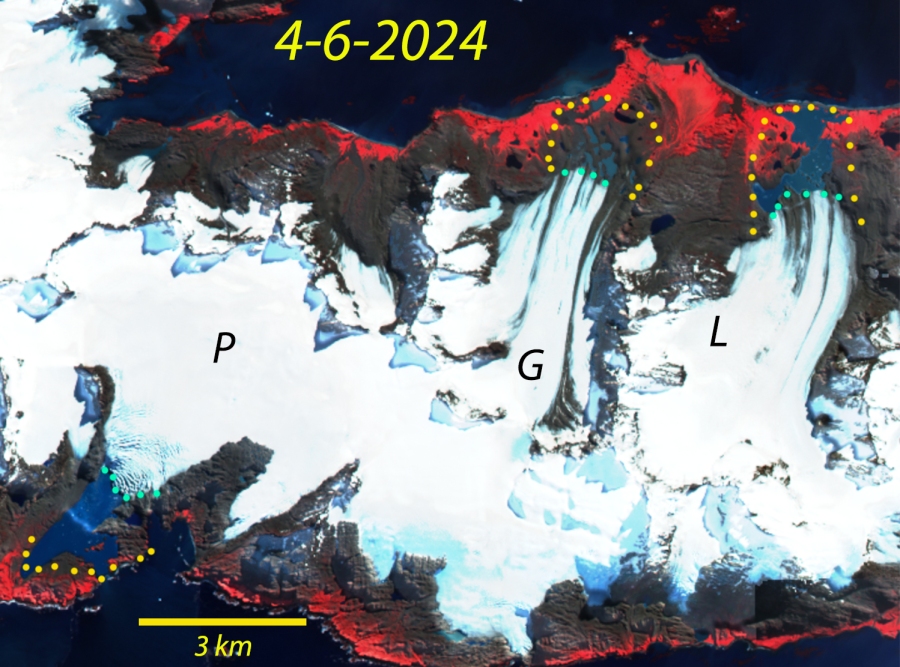
Alsek Glacier descends from the Fairweather Range terminating in Alsek Lake on the coastal plain. In the early part of the 20th century the glacier terminated at Gateway Knob (G) near the outlet of Alsek River from Alsek Lake, with just a small fringing lake present (Molnia, 2005). At that time it had a joint terminus with Grand Plateau Glacier. In 1960 the glacier had a single terminus downstream of an unnamed island in Alsek Lake, that Austin Post (USGS Glaciologisst) told me reminded him of a boats prow. This “Prow Knob” (P) much like Gateway Knob a century ago stabilized the terminus (Pelto, 2017). The glacier retreated 5-6 km by 1984 from Gateway Knob with the lake growing to an area of 45 km2. From 1984-2024 the retreat has been: 5.3 km for the northern terminus, 5.5 km for the southern terminus and 7.8 km for the northern arm of Grand Plateau Glacier. Alsek Lake has grown from 45 km2 to 75 km2 since 1984. In Octobrer 2024 there remains a narrow connection to Prow Knob that will not survive another year.
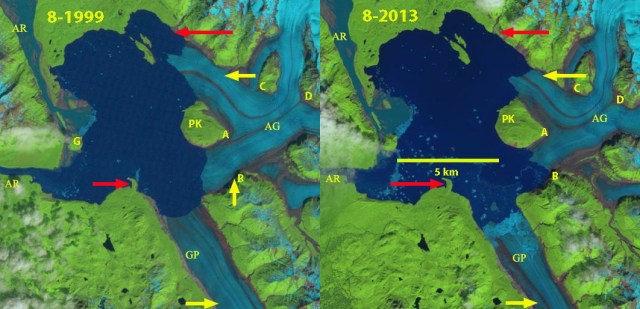
Alsek Glacier retreat from 1999-2013 in Landsat images. Red arrows mark the 1984 terminus location, yellow arrows the 2022 terminus location, AR=Alsek River, GP=Grand Plateau, PK=Prow Knob, G=Gateway Knob, A=glacier junction, B=tributary separation, C=tributary separation, D=tributary confluence.
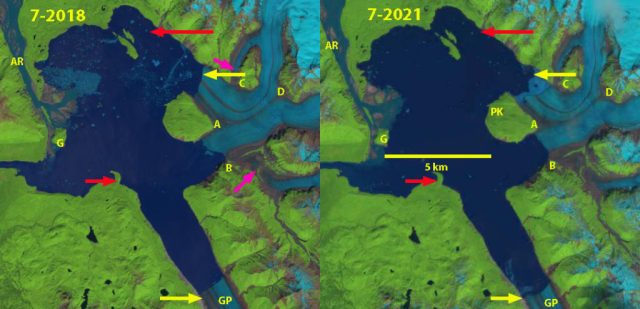
Alsek Glacier retreat from 2018-2021 in Landsat images. Red arrows mark the 1984 terminus location, yellow arrows the 2022 terminus location, pink arrows indicate tributary separation, AR=Alsek River, GP=Grand Plateau, PK=Prow Knob, G=Gateway Knob, A=glacier junction, B=tributary separation, C=tributary separation, D=tributary confluence.
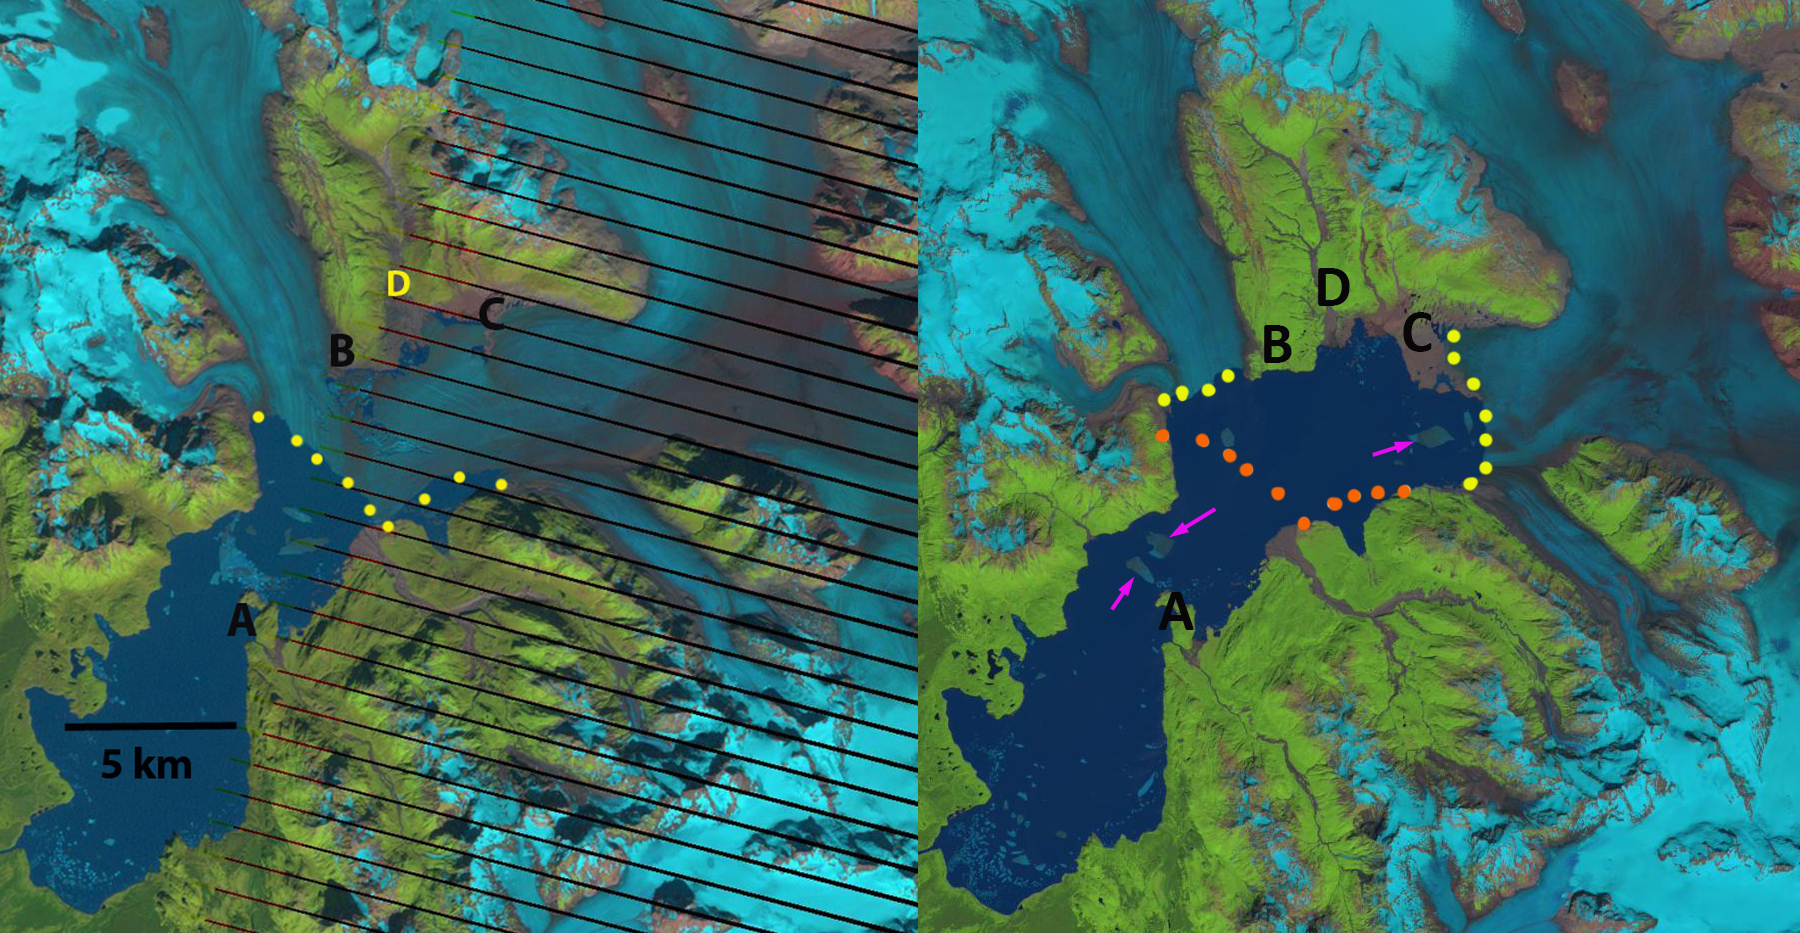
Yakutat Glacier, Alaska experienced a spectacular retreat losing 45 km² from 2010-2018, as a result of rising ELA leading to rapid thinning of the lower glacier (Truessel et al, 2013). The Yakutat Glacier during the 1894-1895 Alaskan Boundary Survey ended near a terminal moraine on a flat coastal outwash plain. By 1906 the glacier had retreated from the moraine and a new lake was forming, Harlequin Lake. By 1984 the lake had expanded to an area of 50 km2. The 2018 image compares the 2010 position (yellow dots) with 2018 (orange dots), indicating an area of 45 km² lost in less than a decade (NASA EO, 2018). There are some small icebergs in 2018. By 2024 further retreat has expanded the total lake area to 105 km2. The main terminus retreated 7 km. The ability to produce icebergs as large as in 2015 has been lost as the calving front has been restricted by the Peninsula which is now 3 km long, leaving less than a 3 km wide calving front. The narrower calving front and reduced water depth should in the short term reduce retreat. Truessel et al (2015) modelling indicated a reduced rate of retreat from 2020-2030, which supports the expected reduced calving. Their model also indicates the glacier will disappear between 2070 and 2110 depending on the warming scenario.
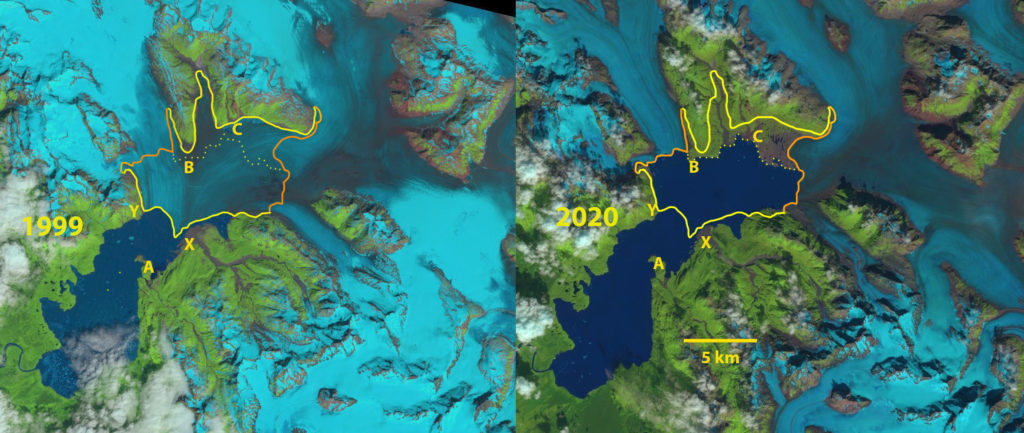
Grand Plateau Glacier drains southwest from Mount Fairweather in southeast Alaska. The glacier advanced during the Little Ice age to the Alaskan coastline. Early maps from 1908 show no lake at the terminus of the glacier. The 1948 map (below) shows three small distinct lakes at the terminus of the main glacier and a just developing lake at the terminus of the southern distributary terminus (D). The distance from the Nunatak (N) to the terminus was 11 km in 1948. The lake at D is 400 m wide.In 2024 the lake area has grown further to 49 km2, as a result of a retreat of 8 km since 1948 and 5.5 km since 1984. Today a second island is emerging at the terminus, Point A. The distributary tongue to the southeast now terminates in a lake that is now 5.2 km long, a 4.8 km retreat since 1948 and 2.6 km since 1984. The combination of higher snowlines and increased calving into the terminus lake will continue to lead to retreat of this still mighty river of ice (Pelto, 2024).
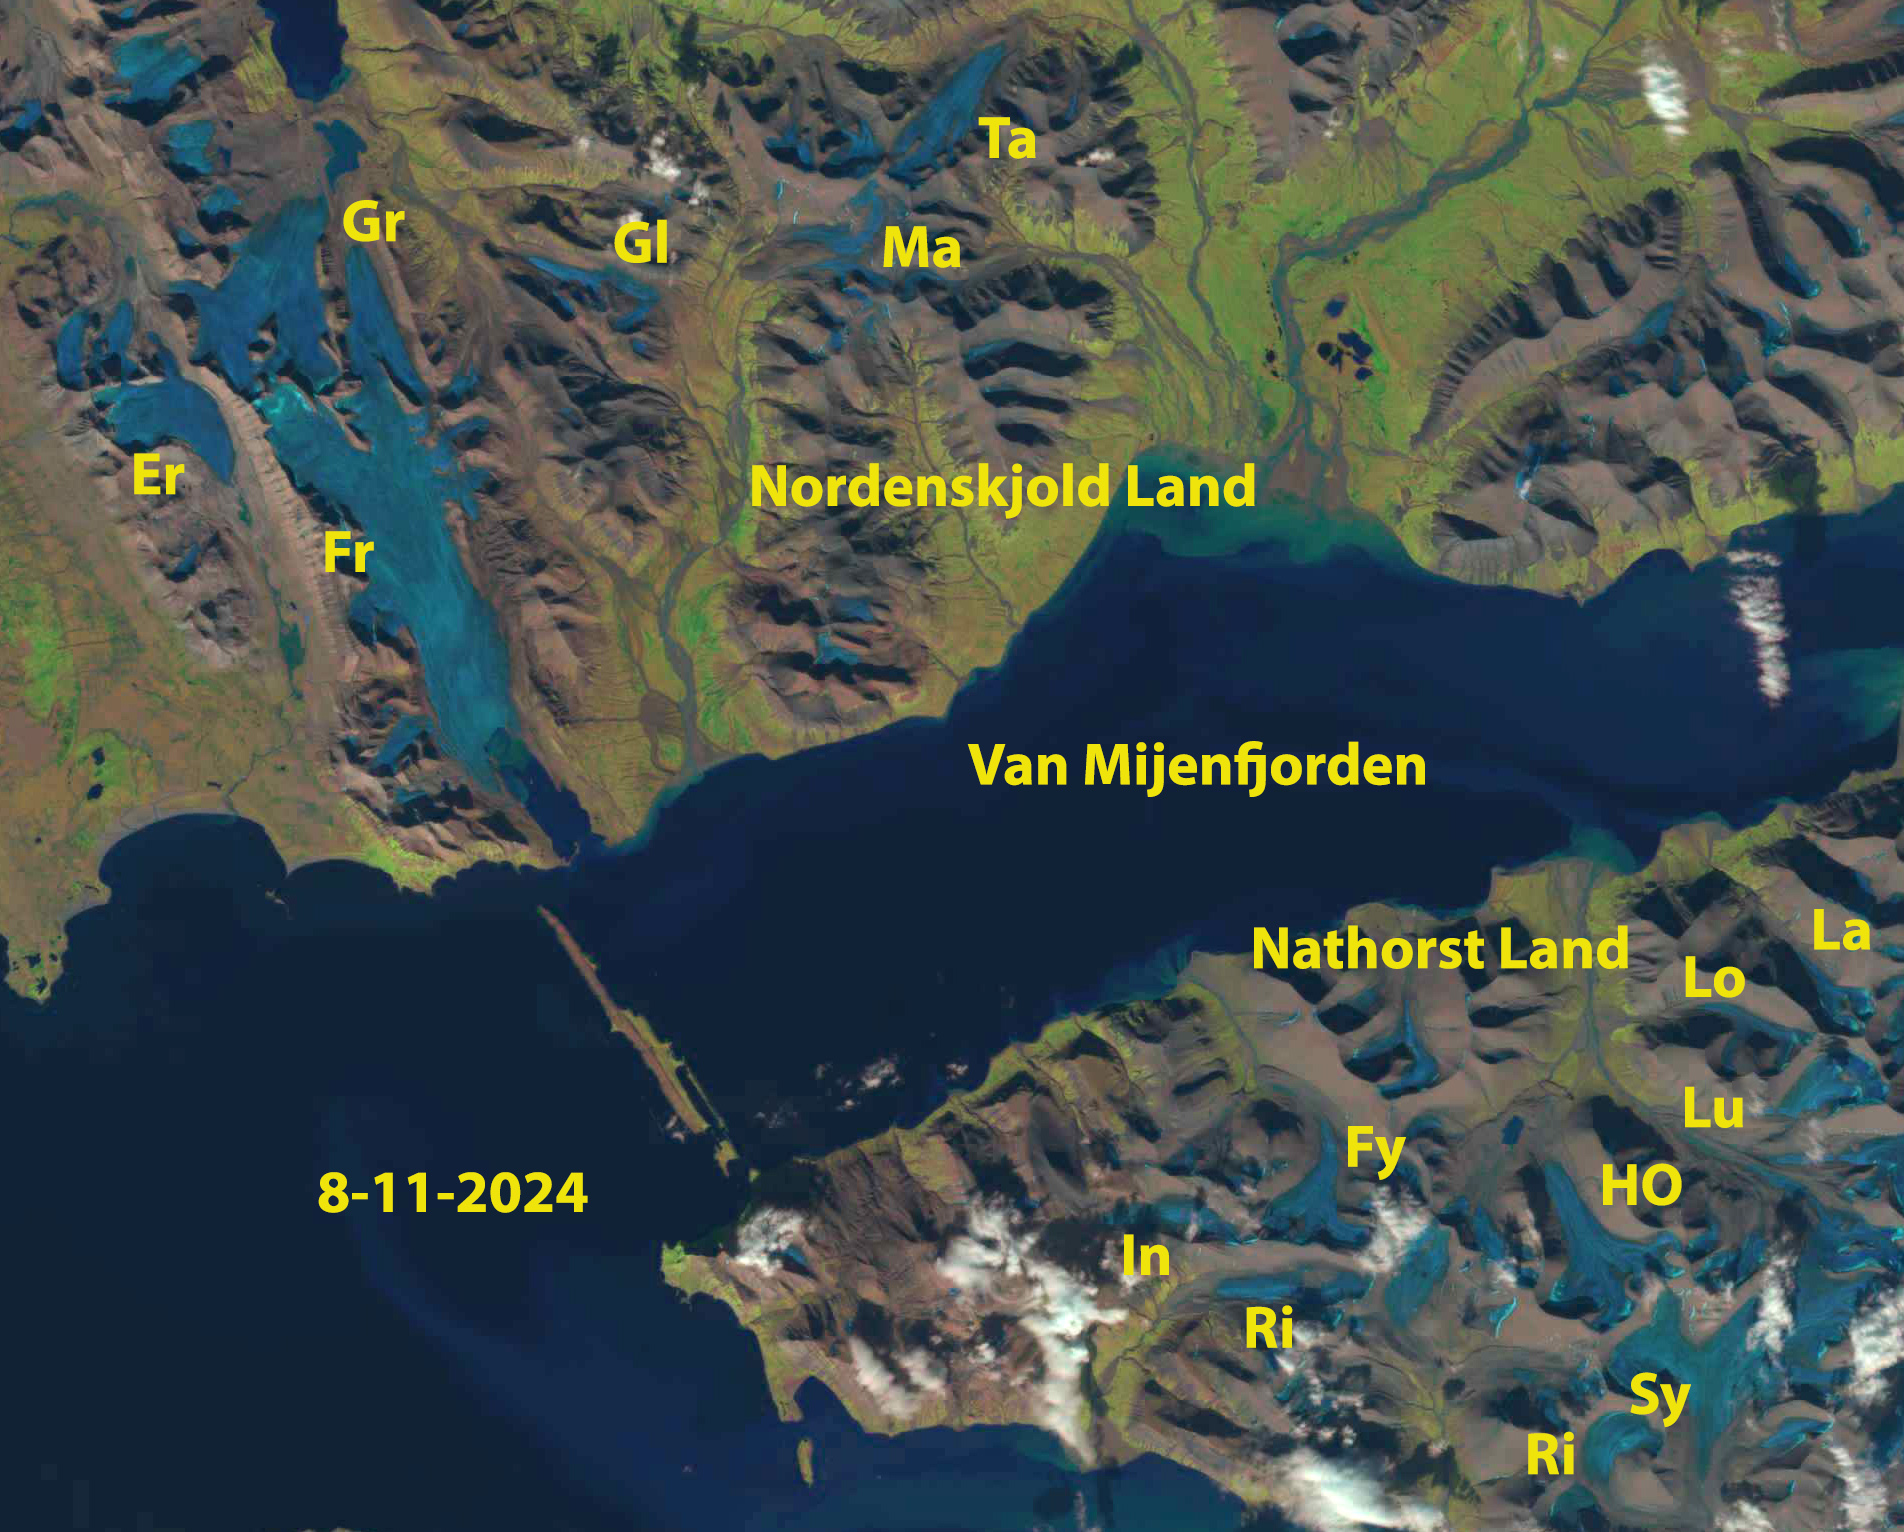
There will be continued glacier retreat and lake expansion in 2025, as the new lake district continues to expand as a result of climate change. Loso et al (2021) note that retreat of Grand Plateau Glacier will change the outlet of Alsek Lake from Dry Bay to the Grand Plateau Lake, creating one larger lake.