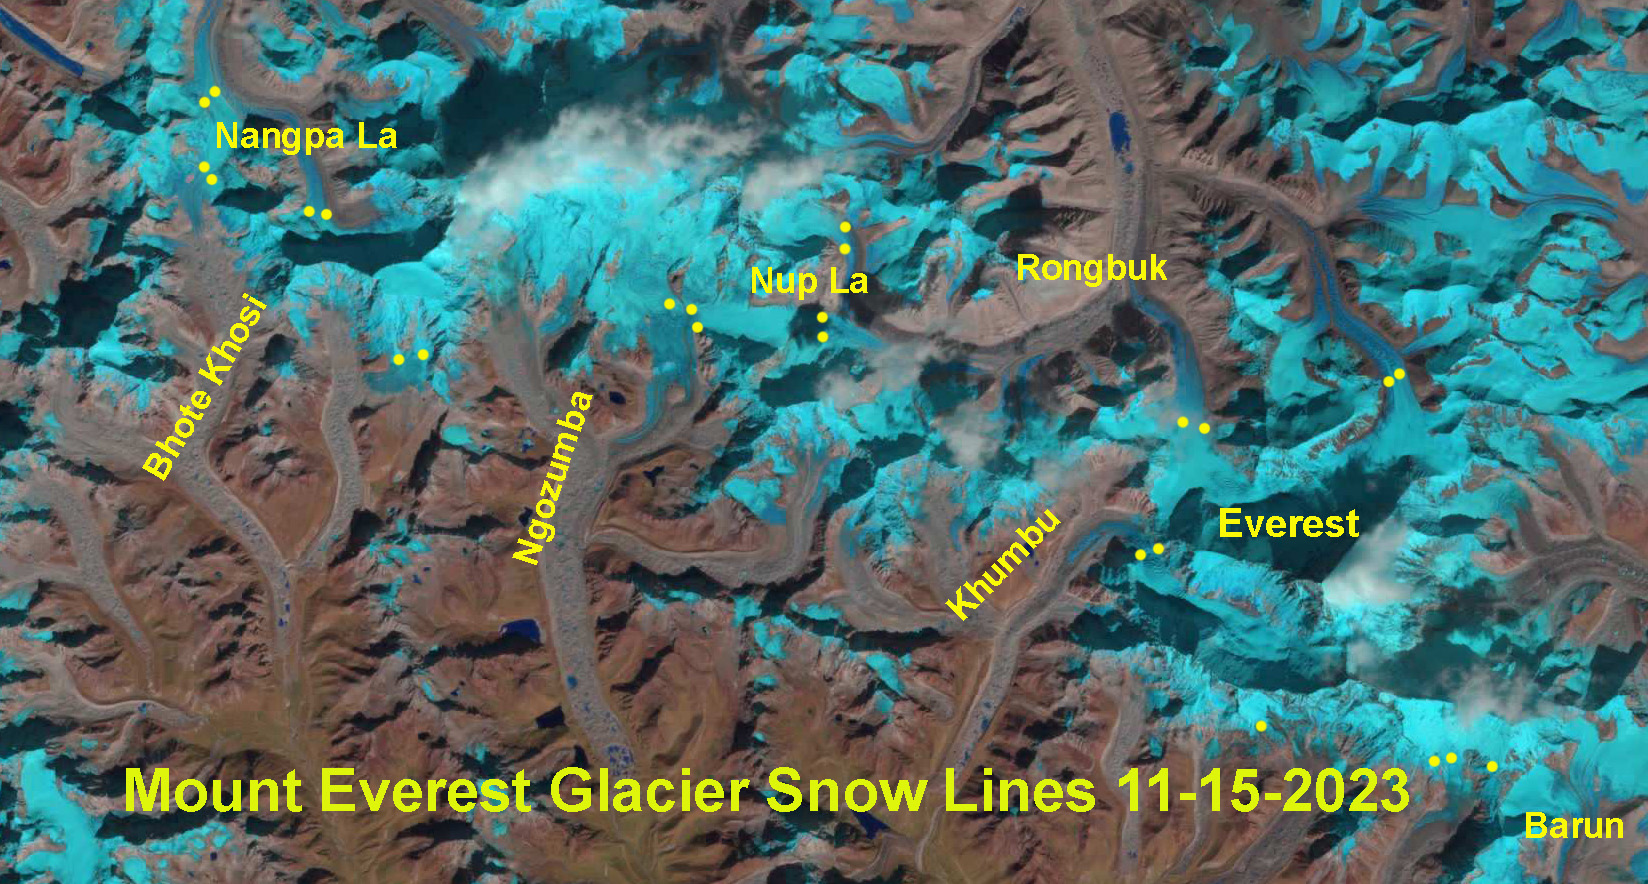
The snow line on Mount Everest Region glaciers on May 1,, 2024 indicated by yellow dots on the Landsat image. Note that Nangpa La and Nup La-two high passes (5800-5900 m) are both snow free. The average snow line is 6050 m.
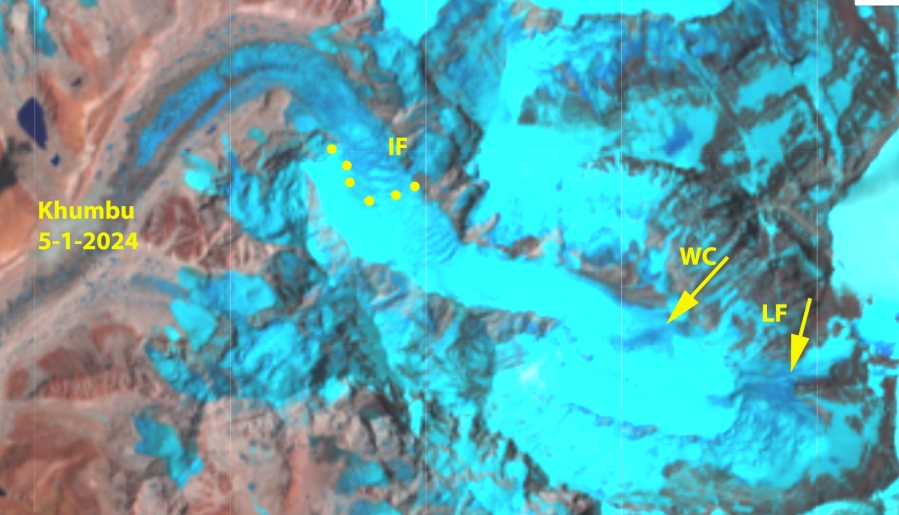
This is a update to a previous post examining high snow lines through the winter on Mount Everest Region glaciers. Here we examine imagery from October 2023 through early May 2024 illustrating the rise in snow line into January and the continue high elevation into the pre-monsoon season. The persistent high snow line over the last six months, indicates a lack of snow accumulation during the winter season. This is a dry season, yet typically leads to extensive, though not particularly deep snow cover. There were a few smaller snow events, but the snow cover did not persist indicating that ablation has continued even above 6000 m on Mount Everest. The lack of snow leads to less infilling of crevasses on Khumbu Glacier, which are further opened by persistent ablation. On May 1 there is evident blue ice and firn areas in the Western Cwm, above the Khumbu Icefall and on the Lhotse Face above the Western Cwm at the head of the Khumbu Glacier. The relatively bare slopes above the Western Cwm also cannot generate as much avalanches that would then accumulate snow in that basin. These same slopes will yield more rock fall, with more exposed unburied rock.
In the Khumbu Icefall velocities indicates by NASA ITS LIVE are ~1m/day which leads to considerable crevasse development in the six months from November into May with very limited snow accumulation and evident ablation, image below. This season is different than the high snow lines i 2020/21 that resulted from extraordinary January heat wave. Snow cover did develop at the end of the winter/early spring (Pelto et al 2021).
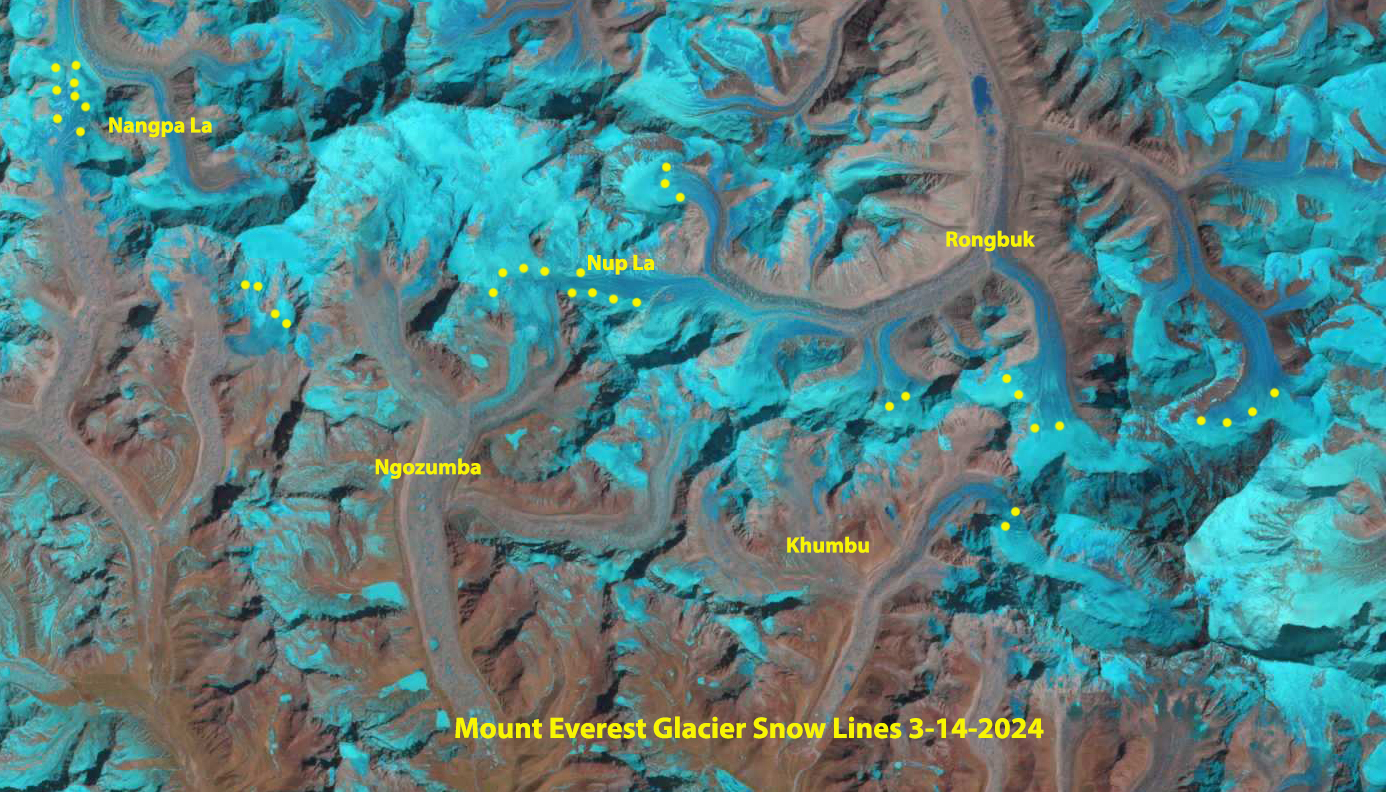
The snow line on Khumbu Glacier on May 1,, 2024 indicated by yellow dots on the Landsat image. Note that there are bare ice areas in the Western Cwm (WC) and on the Lhotse Face (LF).The snow line on Mount Everest Region glaciers on March 14, 2024 indicated by yellow dots on the Landsat image. Note that Nangpa La and Nup La-two high passes (5800-5900 m) are both snow free. The average snow line is 5950 m.
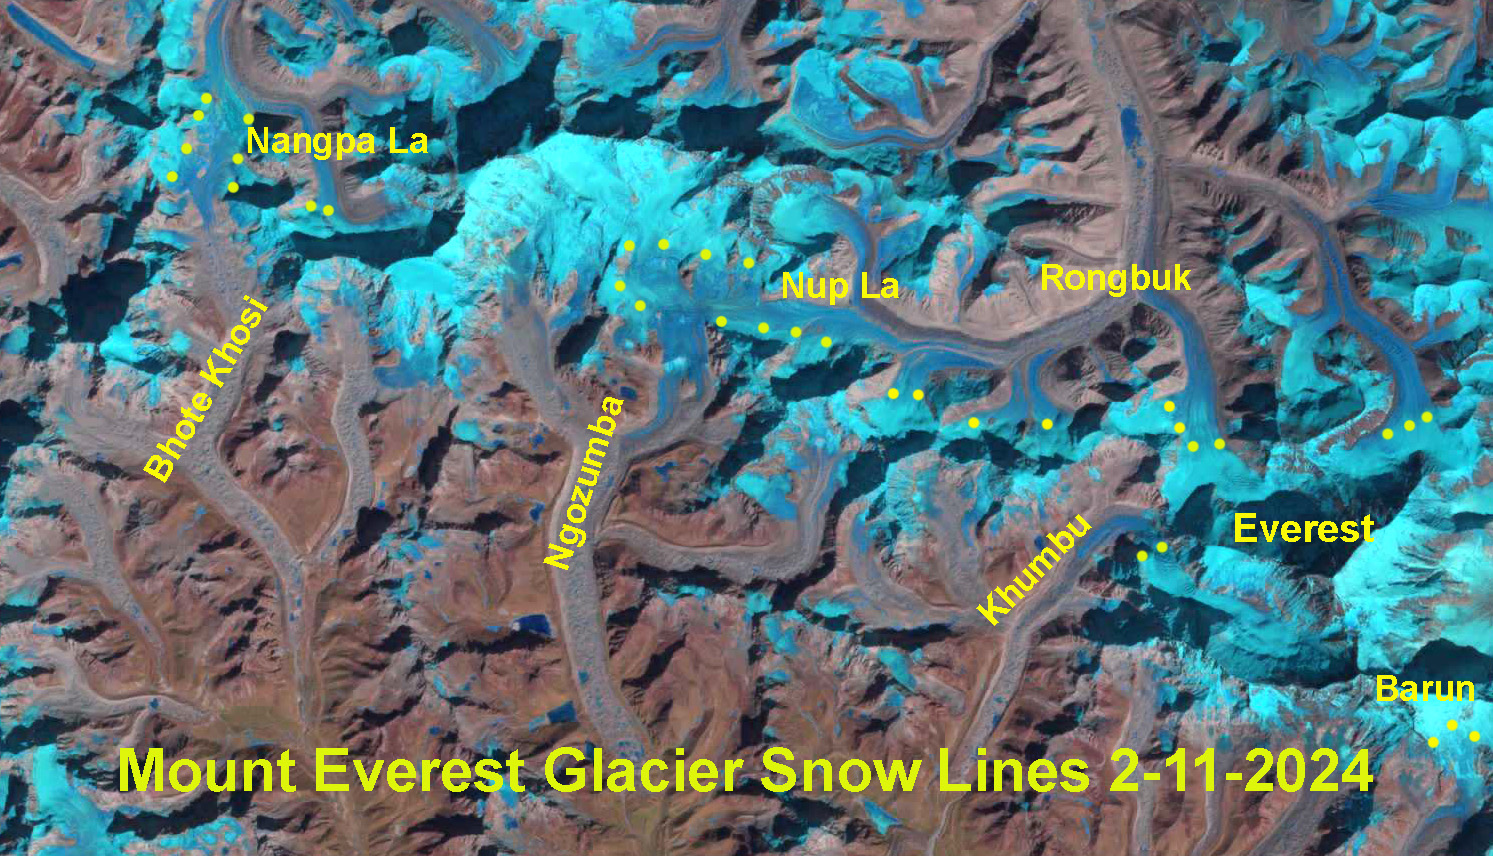
The snow line on Mount Everest Region glaciers on Feb. 11, 2024 indicated by yellow dots on the Landsat image. Note that Nangpa La and Nup La-two high passes (5800-5900 m) are both snow free. The average snow line is 6000 m.
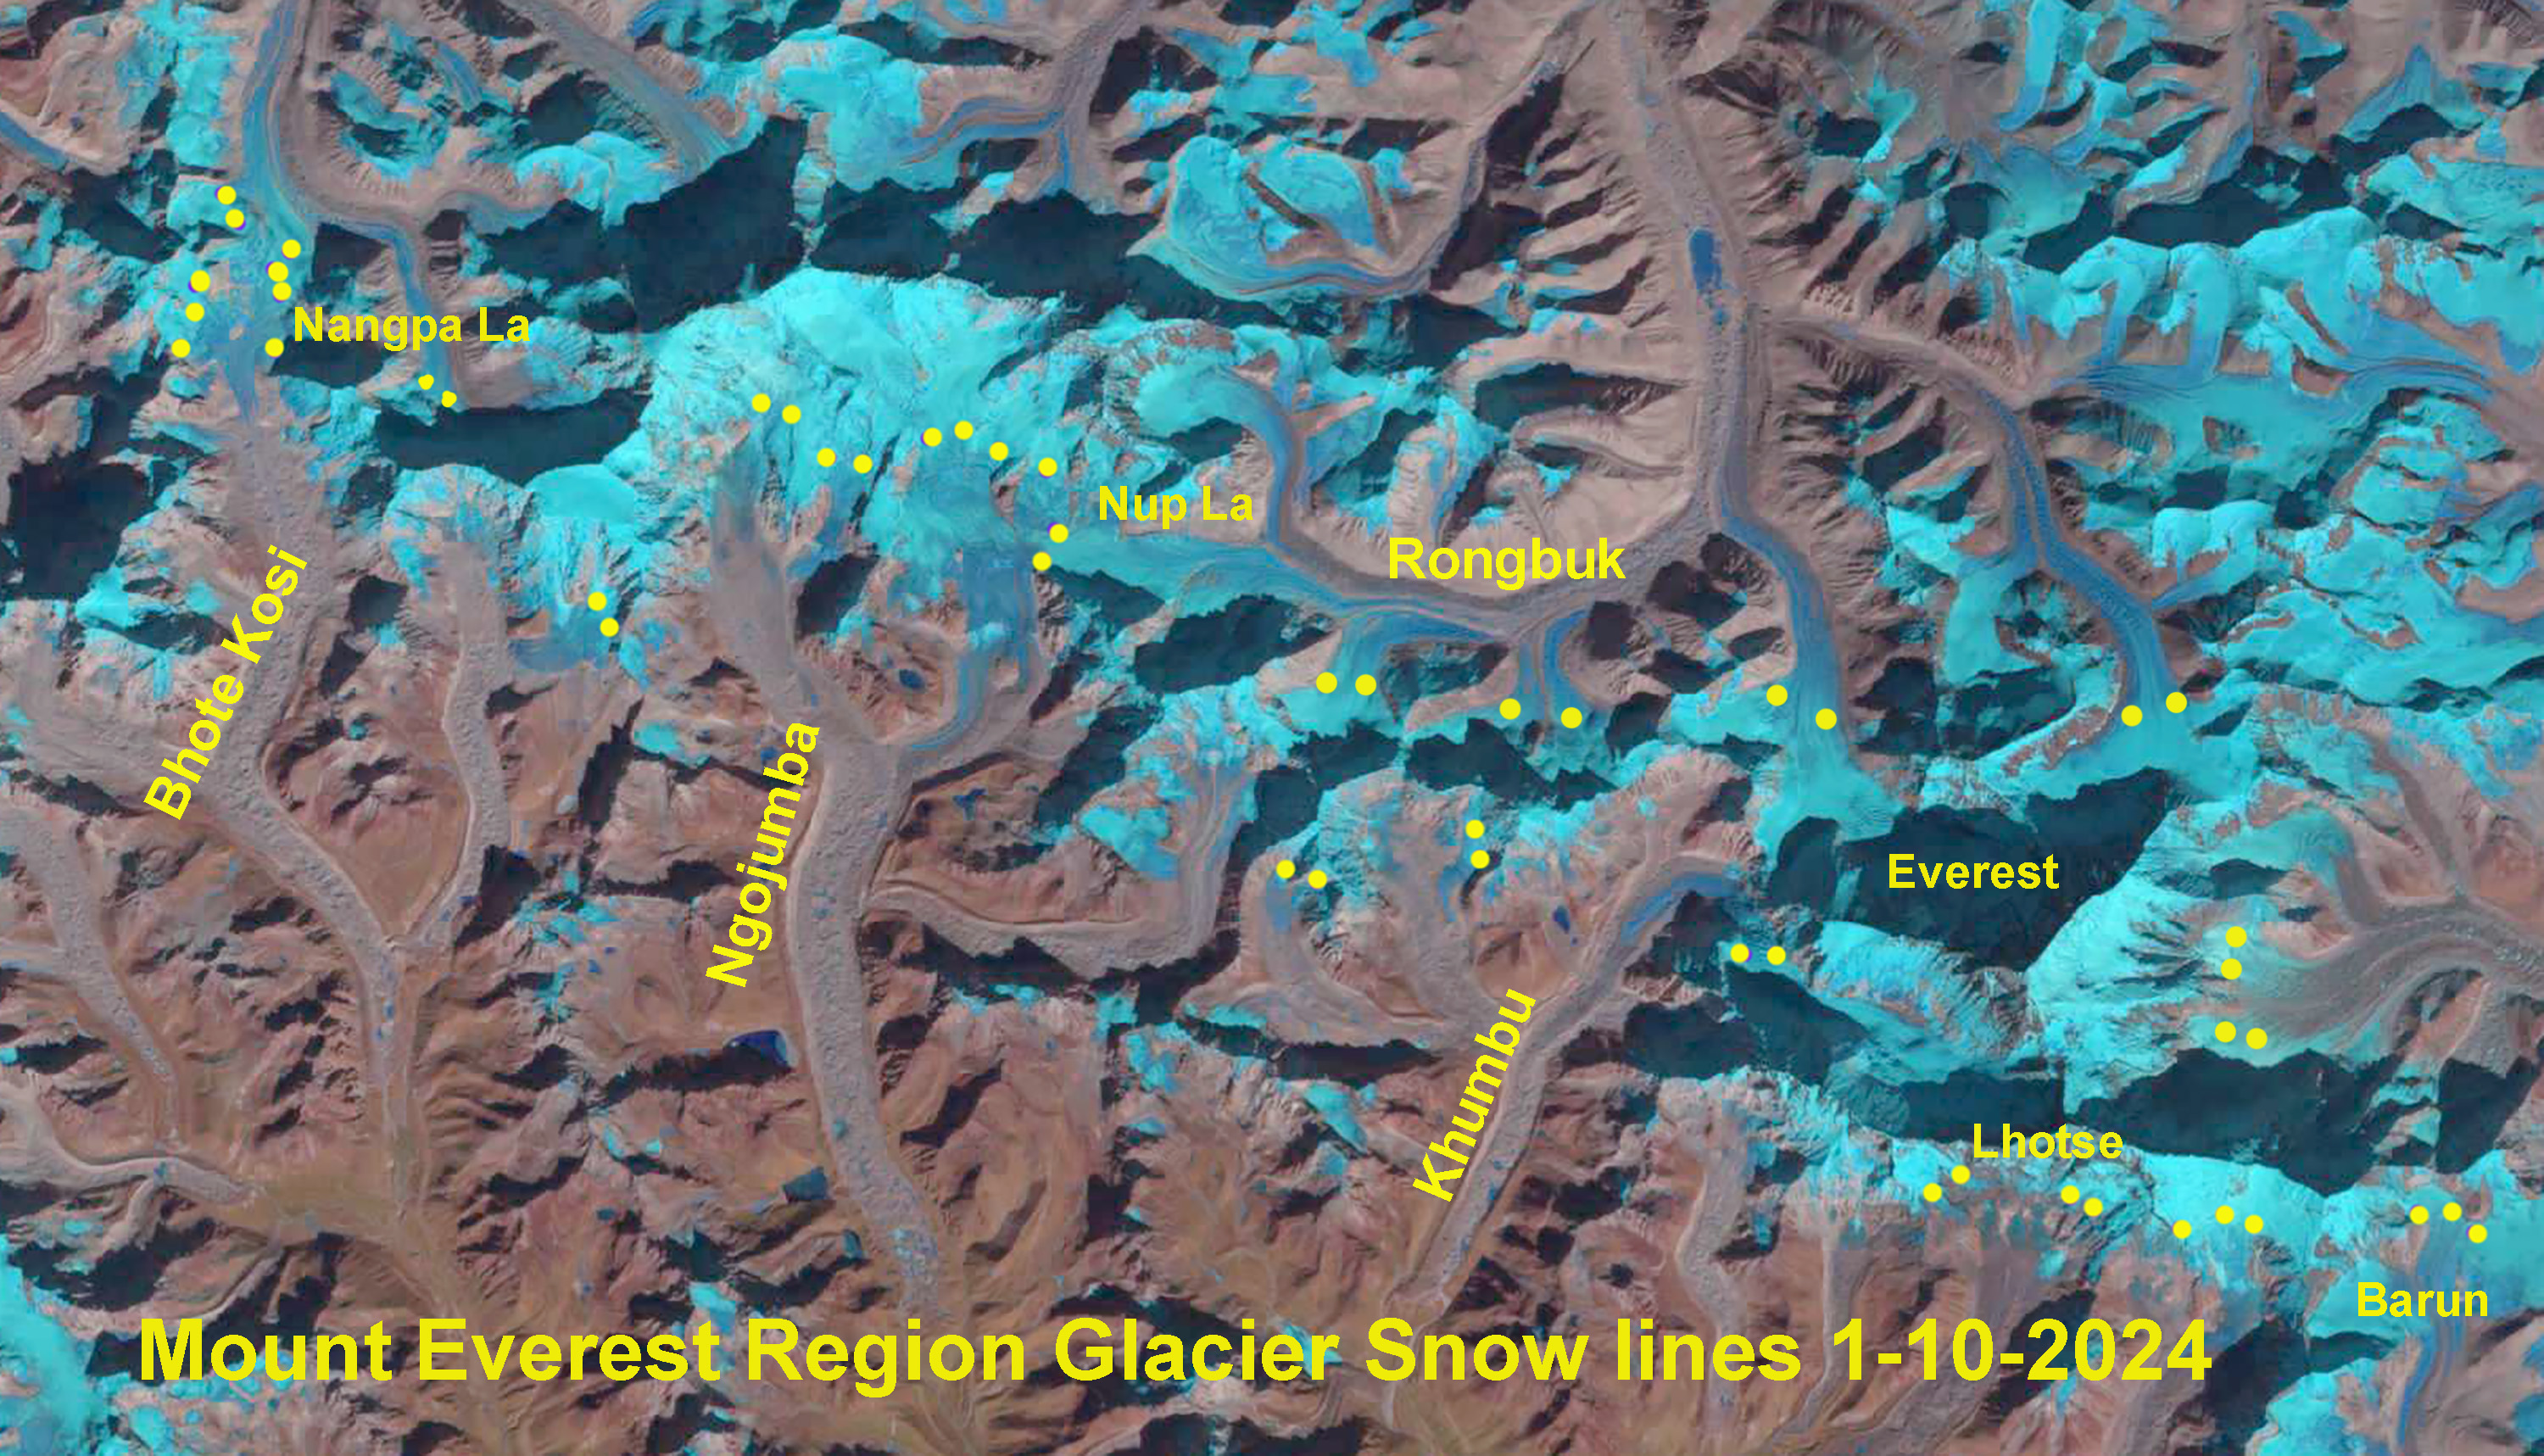
The snow line on Mount Everest Region glaciers on Jan. 10, 2024 indicated by yellow dots on the Landsat image. Note that Nangpa La and Nup La-two high passes are both snow free. The average snow line is 5950 mKhumbu Glacier on Feb. 11, 2024 in Landsat image illustrating snow line near top of icefall at 6000 m, yellow dots. There is some blue ice showing on north side of Western Cwm (WC), Lhotse face too shadowed to see well, but some blue ice evident.The snow line on Mount Everest Region glaciers on Nov. 15, 2023 indicated by yellow dots on the Landsat image. Note that Nangpa La and Nup La-two high passes are both snow covered. The average snow line is 5800 m.The snow line on Mount Everest Region glaciers on Oct. 30, 2023 indicated by yellow dots on the Landsat image. Note that Nangpa La and Nup La-two high passes are both snow covered. The average snow line is 5700 m.Khumbu Glacier Icefall velocity from NASA ITS LIVE. Green arrows indicate primary rangeEverest Base Camp Precipitation from the National Geographic Perpetual Planet station.
Baird Glacier terminus tongue gone in April 26, 2024 Landsat image. Red arrow indicates now joined 5 km2 proglacial lake. Yellow dots terminus of Baird and North Baird Glacier
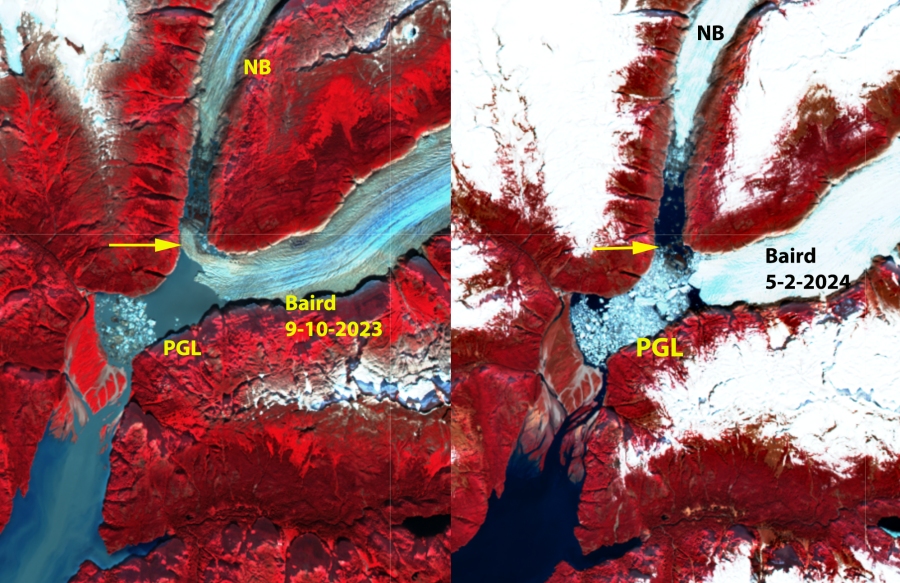
Baird Glacier drains the west side of the Stikine Icefield in southeast Alaska. It is the only glacier of the Stikine Iceifield that did not retreat significantly from 1960-2010. Pelto et al (2013) predicted the onset of significant retreat of this glacier, which like Brady Glacier had been slow to begin retreat despite thinning that was evident when I visited the glacier in 1984. The proglacial lake that has emerged with retreat has an area of 3.25 km2 and the glacier retreat is 2800 m from 1990-2024. The North Baird Glacier separated from Baird Glacier in 2019, with a proglacial lake extending downvalley to the tongue of Baird Glacier that separated this lake from the Baird Glacier proglacial lake until April 2024.
Baird Glacier in Landsat images from 1990 and 2023 illustrating retreat and proglacial lake expansion.Baird Glacier in false color Sentinel images from September 10 2023 and May 2 2024. Proglacial lake (PGL) expanded from 3.2 to 5.1 km². Tongue extending upvalley toward North Baird Glacier (NB) broke up in late April, yellow arrow.
Baird Glacier in false color Sentinel images from July 2022 and July 2023. Proglacial lake (PGL) expanded from 3.00 to 3.25 km² width of tongue extending upvalley toward North Baird Glacier (NB) has declined from 700 m to 400 m.
In 1990 the Baird Glacier was sitting on an outwash plain, with no lake at the terminus. The North Baird Glacier was 1 km wide where it joined the Baird Glacier. By 2015 the glacier has retreated 750 m and the lake (PGL) has an area of ~1 km². In 2022 the glacier has retreated leading to a lake expansion to 3.00 km². In July 2023 the tongue of ice extending across the front of the North Baird Glacier valley has thinned 40% since July 2022. The tongue remained throughout 2023 into April of 2024 before breaking up. This leaves the main terminus of the glacier more vulnerable to further rapid calving retreat. Baird Glacier is catching up to the rest of the Stikine Icefield that has experienced significant retreat, Dawes Glacier, Patterson Glacier and Great Glacier. With Sawyer Glacier retreating from tidewater in 2023.
Steffen Glacier in 2024 False Color Sentinel images illustrating calving events yielding bergs A,B,X and Y that have a combined area of 1.5 km2.Green arrow is Dec. 2023 terminus and yellow arrow April 2024 terminus. Each berg has consistent notation.
Steffen Glacier is the largest south flowing outlet of the 4000 km2 Northern Patagonia Icefield (NPI). Several key research papers have reported on the spectacular retreat of this glacier in recent years. Glasser et al (2016) reported that Steffen Glacier proglacial lake area expanded from 12.1 km2 to 20.6 km2 from 1987 to 2015, due in part to a 100 m snowline rise. Dussaillant et al (2018) determined annual mass loss of NPI at ~-1 m/year for the 2000-2012 period, with Steffen Glacier at -1.2-1.6 m/year. The result Steffen Glacier retreat from 1987-2019 was 4.4 km, ~137 m/year (Pelto, 2019).
On December Dec. 6, 2023 the terminus tongue has a narrow unsupported section that appears poised to calve (C). By Dec. 26, 2023 the glacier has calved berg C (0.4km2 ), joining other large bergs remaining from previous years D, E and F. Two more pieces A and B appear poised to calve. By Feb. 9 2024 berg B has calved, and by Feb. 24 berg A has calved, together they are 0.3 km2.
On April 14 two more large bergs X and Y have calved from the terminus. Berg X is the largest of the year at 0.6 km2, berg Y is 0.2 km2 . Terminus retreat from Dec. 2023-April 2024 is 1.5 km. The terminus tongue is again narrow and unsupported as the winter season begins, indicating that more large icebergs should be expected in the 2025 summer season. Millan et al (2019) indicate the area of tributary glacier convergence near the northwest terminus and above the glacier is 700 m thick, and that the glacier has been retreating along an area where the glacier bed is below sea level, though the terminus now is close to sea level.
Steffen Glacier in Dec. 2023 False Color Sentinel images illustrating calving event yielding berg C.Green arrow is Dec. 2023 terminus and yellow arrow April 2024 terminus.
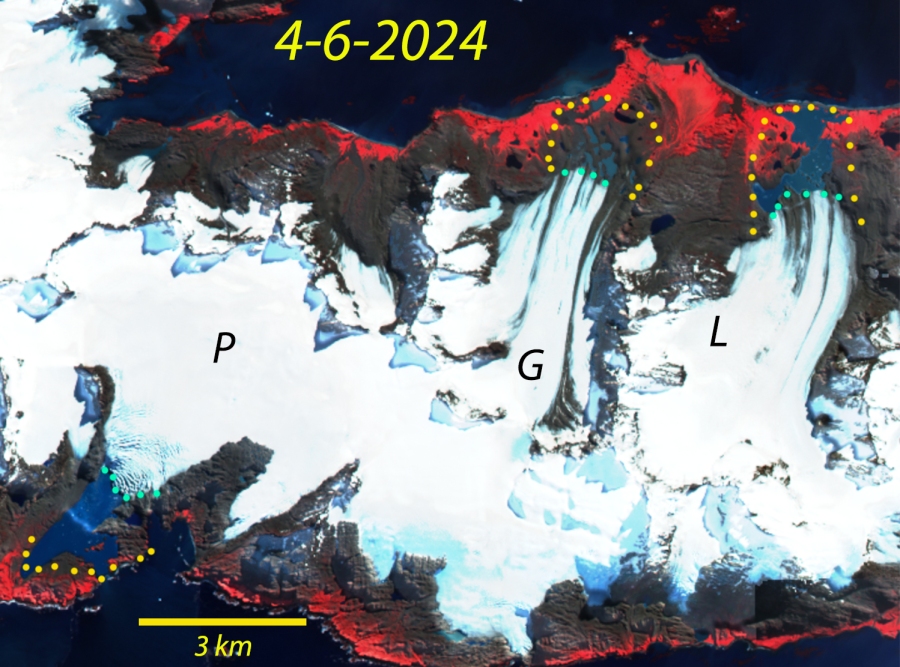
Grace (G), Lucas (L) and Price (P) Glacier’s in 4-6-2024 Sentinel image top, yellow dots mark the 1987 terminus position when all reached tidewater, blue dots indicate 2024 terminus. Below is the South Georgia GIS with terminus observations from the BAS shown.
In 1987 Grace, Lucas and Price Glacier on the northern end of South Georgia Island each reached tidewater. Each had retreated less than 100 m since 1976. This is a very cloudy region and clear satellite image views limited. Here we examine Landsat images from 2000 and 2016, and a Sentinel image from 2024 to identify changes. Gordon et al., (2008) observed that larger tidewater and sea-calving valley and outlet glaciers generally remained in relatively advanced positions until the 1980’s. After 1980 most glaciers receded; many of these retreats have been dramatic including Twitcher, Herz, Ross, Hindle, Konig and Neumayer Glacier (Pelto, 2017).
By 2002 a Landsat image reveals that Grace and Lucas Glacier have retreated from the coast with new proglacial lakes forming between the terminus and the coast. Price Glacier main terminus is still filling most of a narrow bay, and the east side of the terminus is still reachig the coast. By 2016 Grace Glacier retreat has led to the formation of several small proglacial alkes, while Lucas Glacier retreat has generated one larger proglacial lake. Price Glacier has begun to retreat up a narrow embayment and the east side has almost lost connection with tidewater.
In 2024 Grace Glacier has retreated 1200 m, ~20% of its length in 1987. Lucas Glacier has retreated 1400 m, ~20% of its length. Price Glacier now only terminates in a narrow embayment ,has retreated 1700 m, ~23% of its length. Each glacier has limited area above 500 m, indicating that below this elevation glacier mass balance has been significantly negative over the last 35 years. The retreat here is similar to that of Konig and Turnback that have retreated from tidewater exposing new coastal regions that are being occupied by flora and fauna.
Grace (G), Lucas (L) and Price (P) Glaciers in 2002 and 2016 Landsat images as they retreat from tidewater.
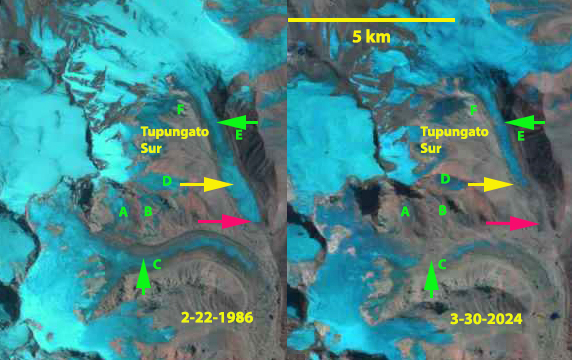
Volcan Overo Glaciers at the end of the 2024 melt season in a false color Sentinel image from 3-30-2024. There is no sigificant area of snowcover remaining for the 3rd consecutive summer. The lake that had formed at Point A since 2018 has now drained. Fragmentation at point B, C, and D continue, while thinning at top of glacier is apparent with expanding bedrock knob at Point E.
Volcan Overo is a 4619 m high Andean mountain in Argentina with a relatively low sloped broad volcanic summit region above 4000 m that hosts a glacier complex that is shrinking and fragmenting. La Quesne et al (2009) observed significant annual thinning in the latter half of the 20th century on nearby glaciers in Argentina and Chile. A sharp increase in mass loss on Central Andean glaciers after 2009, including the Volcan Overo region, was reported by Ferri et al (2020). Here we examine Landsat images from 1986-2022 to identify longer term changes of the glacier and Sentinel images from 2018-2024 illustrating the persistent lack of an accumulation zone leading to recent changes, including the impact of the January 2023 heat wave (Washington Post, 2022). The persistent lack of an accumulation zone during the 2018-2024 period, highlighted in images below, in which no snow was retained as firn, indicates the glacier cannot survive (Pelto, 2010).
Volcan Overo in Landsat images from 1986-2022 illustrating area loss and fragmentation.
In 1986 there are four discrete glaciers around the caldera, covering ~12 km2 the largest E around the summit ranges in elevation from 4200-4500 m. D is an isolated area at 4000-4100 m. A,B and C is a single glacier extending from 3900-4300 m. F is an area of rapidly diminishing glacier ice.
In the early February image snowcover is good across all ice areas except F. In 2003 there is limited evident change with good snowcover across all except D. By 2013 A, B and C have fragmented into three separate glaciers and F is nearly gone. Only E has significant snowcover.
In 2022 C and D in the Landsat images have declined to less than 50% of their 1986 area, the overall Volcan Overo glaciated area has declined to ~8.1 km2. It is not quite mid-summer on January 8, 2022 yet all snowcover has been lost from the glaciers of Volcan Overo. The glacier remnants at F are now gone.
Volcan Overo Glaciers at the end of the 2018 melt season in a false color Sentinel image from 3-17-2018. There is no sigificant area of snowcover remaining. A lake is forming at Point A . At Point B this is a single glacier. At Point C an expanding ridge is still narrow and segmented. At Point D three glaciers areas are just losing contact and at Point E a small knob has emerged from ice cap.Volcan Overo Glaciers at the end of the 2020melt season in a false color Sentinel image from 3-11-2020. There is no sigificant area of snowcover remaining. A lake has formed at Point A . At Point D three glaciers areas are clearly separated.Volcan Overo Glaciers at the end of the 2022 melt season in a false color Sentinel image from 3-09-2022. There is no sigificant area of snowcover remaining. The lake at Point A is expanding . At Point B the glacier is separating into two parts.. At Point C an expanding ridge is now continuous segmented. Volcan Overo Glaciers at the end of the 2023 melt season in a false color Sentinel image from 3-09-2023. There is no sigificant area of snowcover remaining for the 2nd consecutive summer. The lake that had formed at Point A has expanded further. Fragmentation at point B, C, and D continue.
The impact of heat waves in 2022 and 2023 has taken its toll on the glacier.
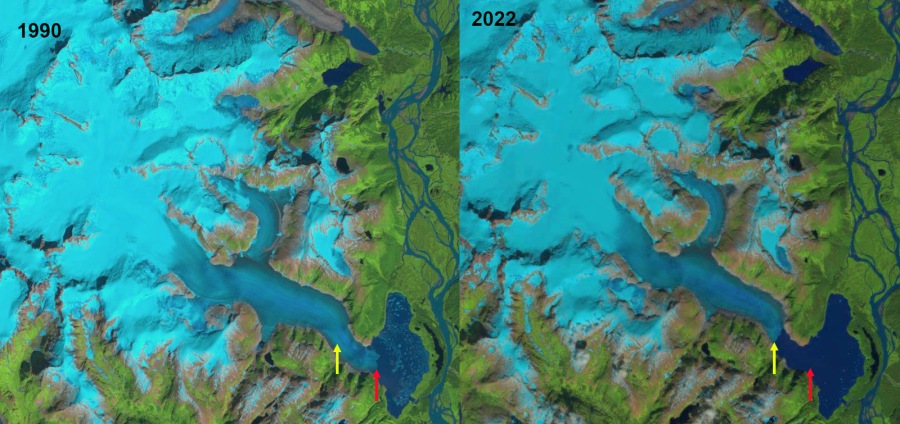
Great Glacier terminus change from 1986-2022 illustrating lake expansion. Red arrow=1986 terminus location, Yellow arrow=2022 terminus location.Terminus has retreated 2.1 km during this time with the lake growing 15 km2.
Great Glacier is the largest outlet glacier of the Stikine Icefield feeding the Stikine River. The name came from the large expanse of the glacier in the lowlands of the Stikine River during the late 19th and early 20th century, that has now become a large lake. In 2023 I worked on a signage project for the Great Glacier Provincial Park with Hailey Smith, BC Park Ranger, documenting the changes in this glacier particularly since 1914.
The glacier filled what is now a large lake at the terminus of the glacier pushing the Stikine River to the east side of the valley. The Tahltan nation oral history relates when the glacier bridged the Stikine River and meet Choquette Glacier. In 1914 the glacier was easy to ascend from the banks of the Stikine River, the picture above is from the National Railroad Archive. By 1965 the new lake had formed, but the glacier still reached the far side of the lake in several places as indicated by the 1965 Canadian Topographic Map below. R. Patterson (Writer and Canadian Explorer 1898-1984) noted that Great Glacier came down onto the river flats, and displayed a 7 km front visible from the Stikine River.
Map of Great Glacier in 1965 illustrating the fringing lake.
Landsat images from 1990 and 2022, illustrating changes in the glacier and lake. The transient snowline is at ~900 m in both images.
A comparison of 1986, 1990, 2011 and 2022 illustrates the retreat. By 1986 the new lake had largely developed, and the glacier was beginning to retreat into the mountain valley above the lake. Retreat from the moraines of the late 19th century was 3200 m. By 2011 the glacier had retreated further into valley, 900 m retreat from 1986-2011. From 2011 to 2022 the glacier retreated another 1200 m. The lake has expanded to an area of 15 km2
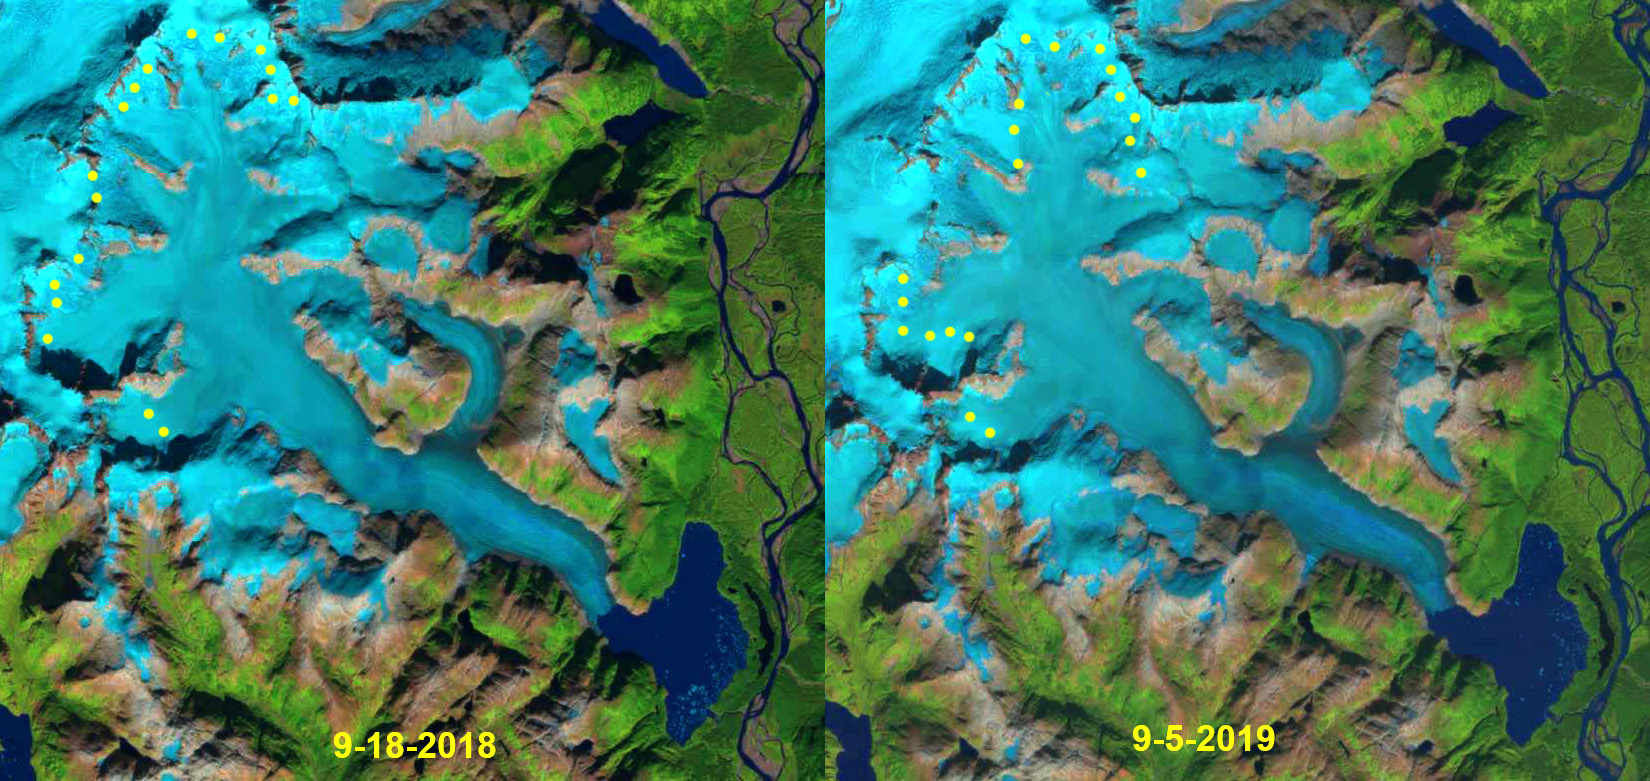
A view of the glacier from across the lake today indicates the distance to the now valley confined glacier, and the trimlines of the former ice surface, yellow arrows in middle image The Great Glacier has one major tributary on the northeast tributary that is very low in elevation with a top elevation of 800 m. Given the regional snowline of 1100-1200 meters in the 1980s (Pelto, 1987) this is too low to retain snowcover through the summer and will lead to rapid progressive thinning. In 2018 and 2019 the highest observed snowlines in the region occurred, the snowline averaged 1500 m, leaving just 10% of the Great Glacier snowcovered. This is instead of the 60% needed to maintain equilibrium. Stikine Icefield outlet glaciers are all undergoing substantial retreats including Sawyer Glacier,Baird Glacier and Dawes Glacier.
Great Glacier snowline end of summer in 2018 and 2019 reached the highest levels observed at 1500-1600 m.
Eagle Island Ice Cap has 65% snowcover on Feb. 27, 2024 in Sentinel images. After 5 of the next 10 days reached at least 9 C at Esperanza Base the snowcover is just 8% on March 8, 2024.
On February 27, 2024 Eagle Island had ~65% snowcover, by March 8, 2024 this had diminished to just 8% snowcover. This matches last year for the lowest observed snowcover of this ice cap. On February 19, 2023 Eagle Island Ice Cap, Antarctica has less than 10% snowcover. This is less snowcover than observed even after the period of record warm weather over the Antarctic Peninsula in February 2020. The repeat loss of snowcover has stripped the ice cap of firn exposing bare glacier ice that is darker and melt faster, enhancing melt losses. Temperature when the all time Antartica temperature record was set at Esperenza Base. Eagle Island Ice Cap (63.65 S 55.50W) is 40 km from Esperanza, with the summit of the ice cap is at 250-300 m and it has an area of 21 km².
In March the temperature reached 9 C on March 4, 6, 7 and 8.
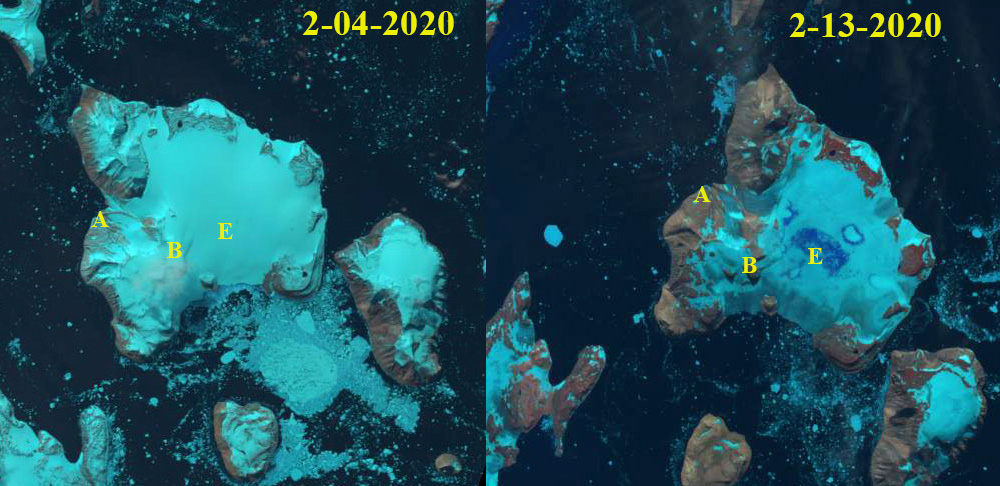
In 2020 we observed blue ice areas (BI) and saturated snow areas (SS) rapidly developed from a snow covered ice cap during the heat wave (NASA EO, 2020). The impact of short term melt events like this on an ice cap like this, is visible and significant for annual mass balance, but not large in terms of long term glacier mass balance (volume change) and area. That year also led to record melt and ponding on the George VI Ice Shelf (Banwell et al, 2021). In 2022 a similar patter of blue ice developed, but no saturated snow. In 2023 the loss of snowcover was nearly complete exposing a more extensive bare ice and firn surface area that melts more rapidly. This was the result not of a heat wave but of a consistenly warm summer.
Eagle Island Ice Cap rapid snow melt and resultant melt ponds during record warmth in Feb. 2020seen in Landsat images.Eagle Island Ice Cap in Sentinel image illustrating 8-10% snowcover on 2-19-2023.
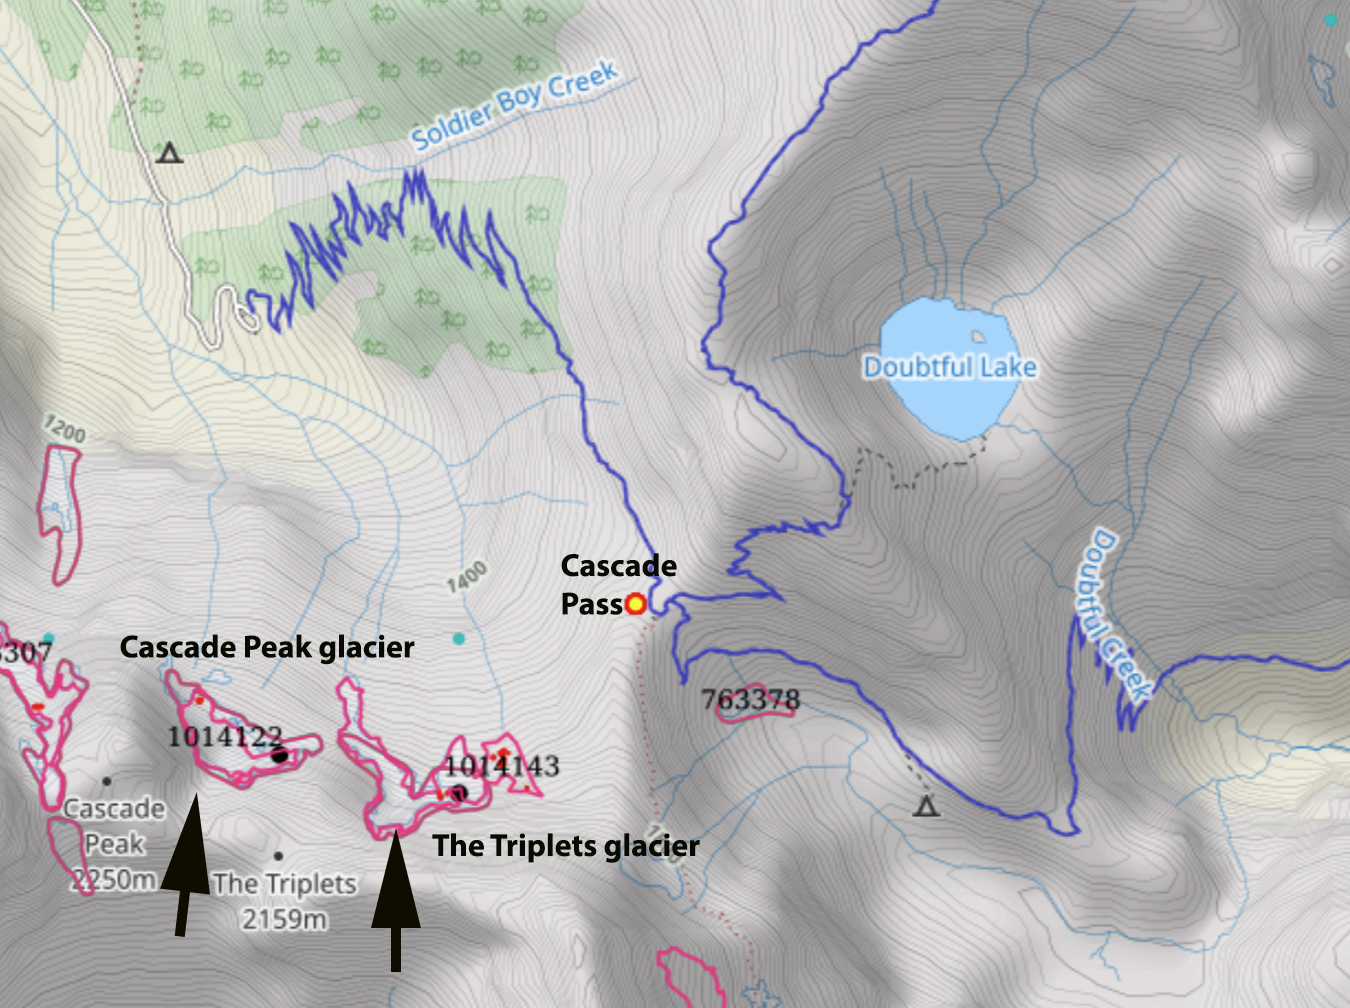
The Triplets and Cascade Peak glacier in GLIMS glacier viewer with the red outlines of the 1958 and 2015 margins and the black dot indicating they are now extinct.
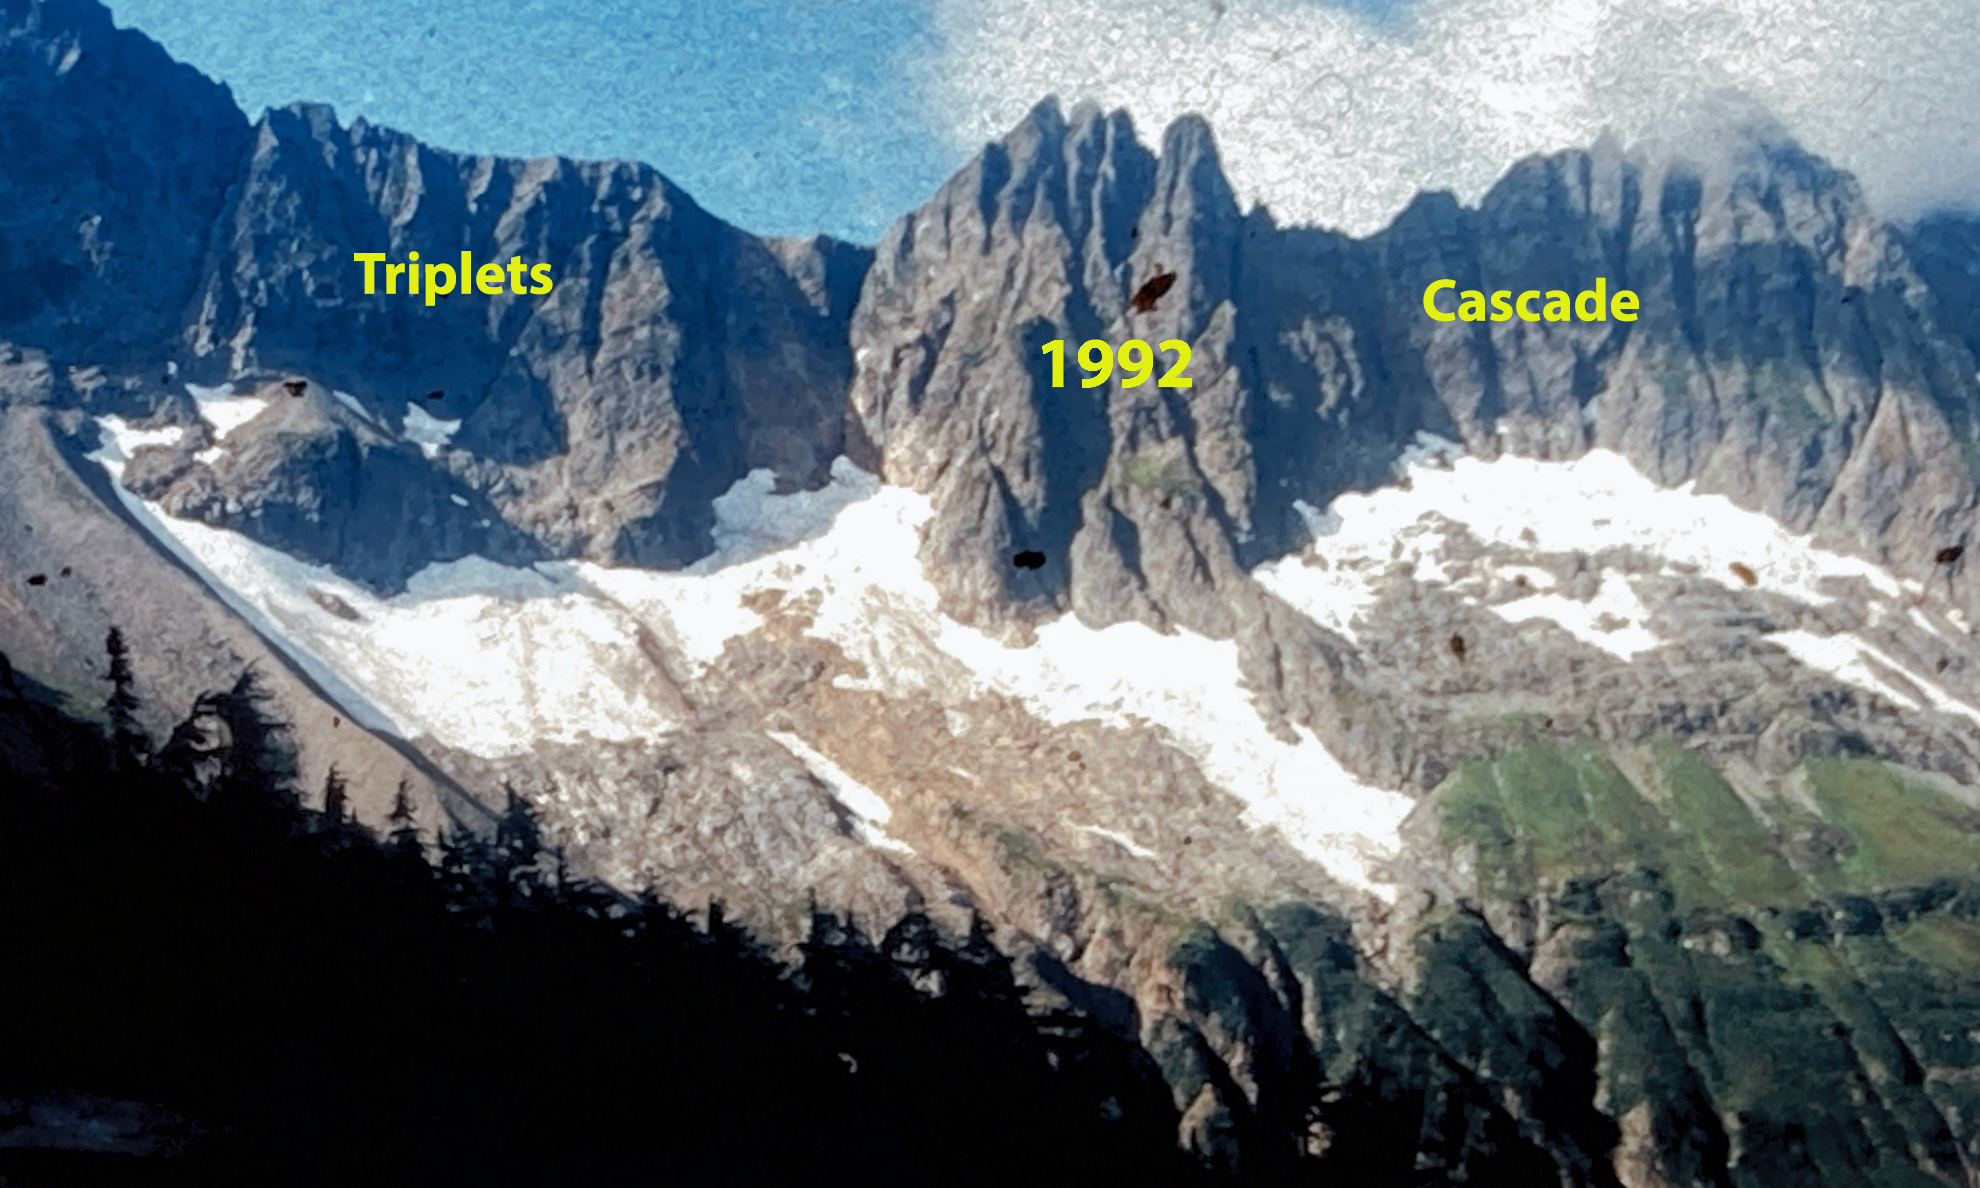
In a 1993 Washington Geology article I noted that “In the Cascade Pass area two small glaciers in Torment Basin and two beneath the Triplets Peak and Cascade Peak have altitude ranges of less than 150 m. These glaciers in 1985, 1987 and 1992 were entirely in the ablation zone if present conditions persists they will disappear.” This is an update on the glaciers below The Triplets and Cascade Peak. The threshold for a glacier to exist in terms of area is typically 50,000 m² or 10,000 m², there must also be motion which is increasingly rare as area drops below 50,000 m² (Leigh et al 2019). Motion is typically determined by active crevassing, which does not include relict crevasses reaching bedrock (Fountain et al 2023). To survive a glacier must have a persistent accumulation zone, the lack of this leads to thinning of the glacier even in its upper accumulation area (Pelto, 2010).
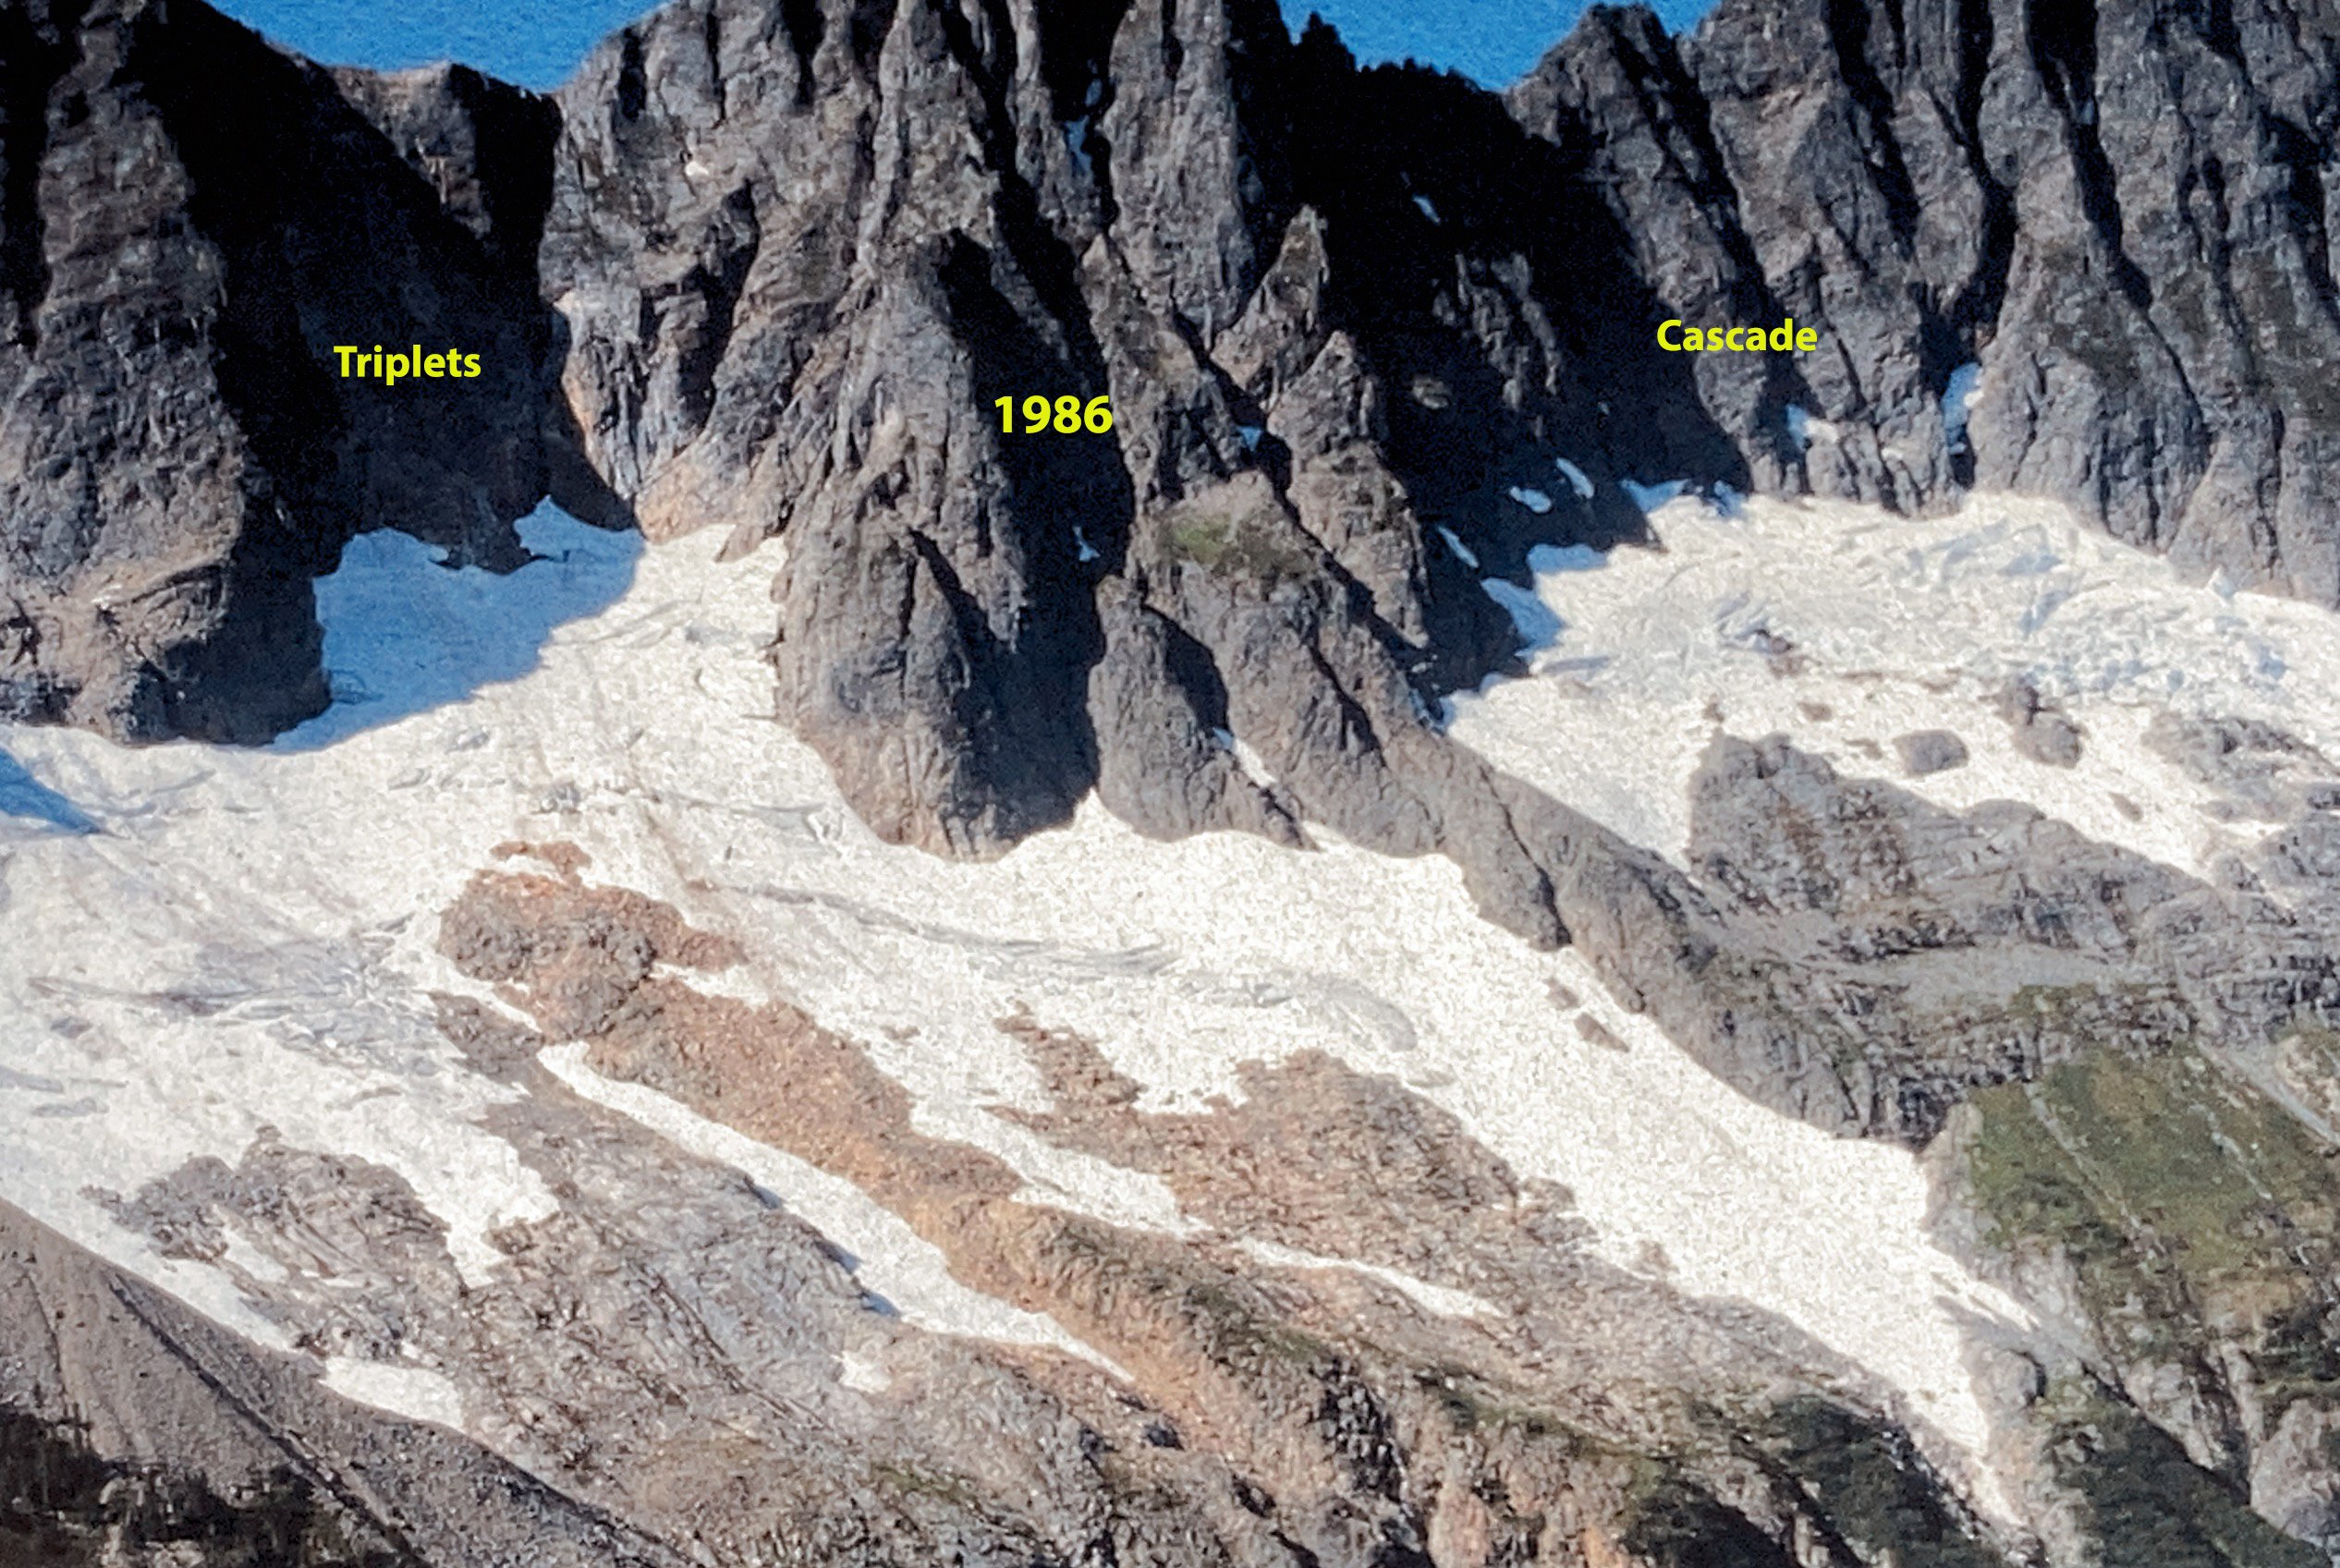
The Triplets and Cascade Peak glacierwith plentiful active crevassing in 1986 image I took from near Cascade Pass.
The Triplets and Cascade Peak glacier with significant retained snowcover in 1990 image I took from near Cascade Pass.
In 1986 I first walked on the two glaciers below The Triplets and Cascade Peak. They were crevassed glaciers fed on north facing benches below the peaks providing good radiational shading and fed by avalanches. The glaciers are also steep enough to shed avalanches. In 1992 these two glaciers did not retain significant snowpack and we noticed some crevasses within 50 m of the ice front reaching bedrock. Of more import was that several sections of glacier with bedrock reaching crevasses had slid detaching from the glacier on the steep smooth bedrock glacier bed.This process of melt driven thinning leading to detachment of small glacier sections is what prompted me to think these glaciers would not last. This type of detachment is evident in the 1998 Google Earth image, lower right of Cascade Peak Glacier.
The Triplets and Cascade Peak glacier with limited snowcover on Triplets glacier even in early August 1992. We were on route to the glacier when I took this picture.
Crevasse on Triplet Glacier that reaches bedrock near terminus in 1996.
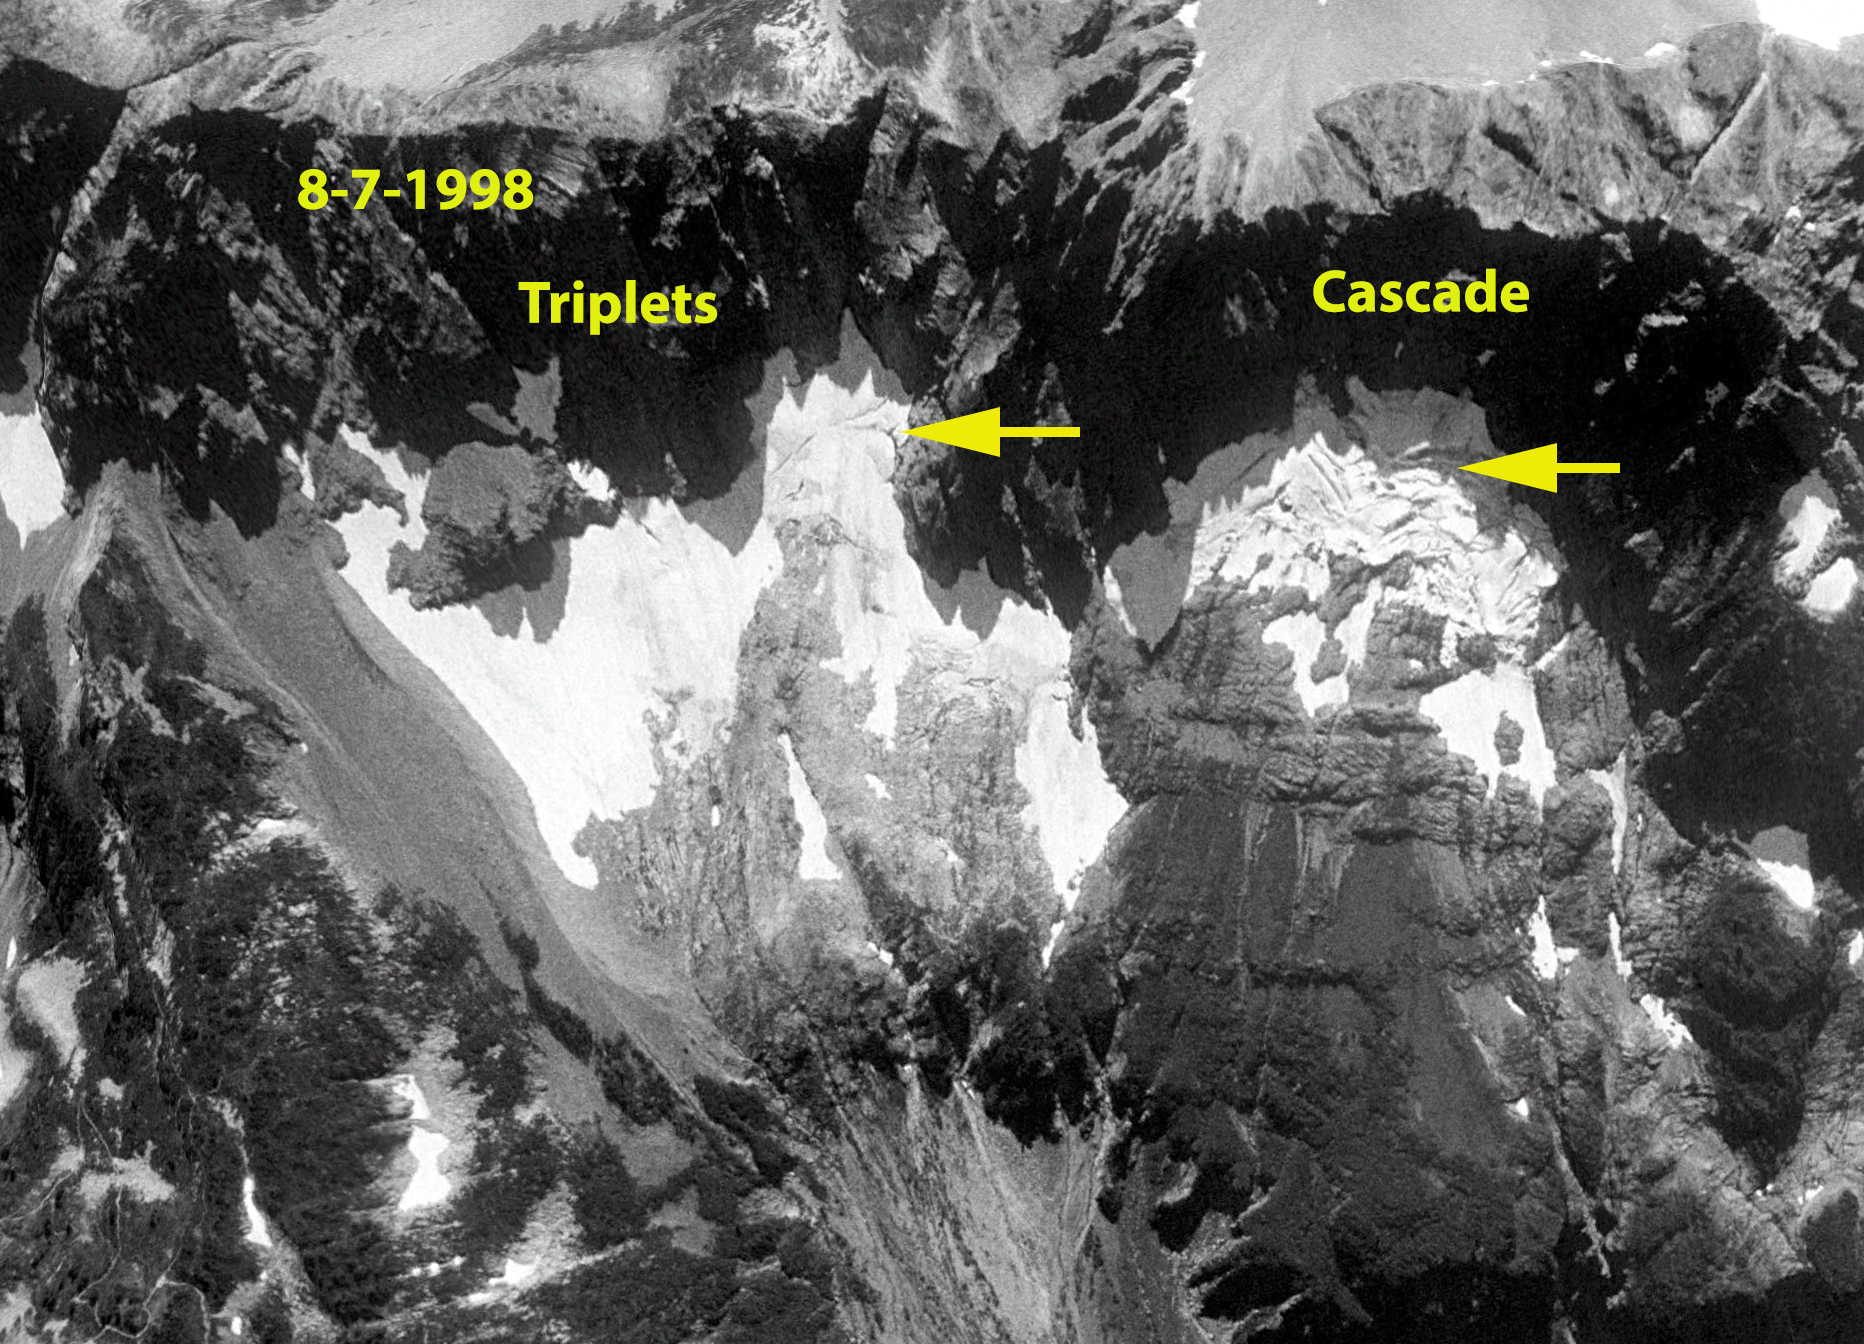
The Triplets and Cascade Peak glacier with active crevassing in 1998 Google Earth image (yellow arrows). Some of these crevasses reached bedrock and led to detachments, note lower right on Cascade Peak glacier.
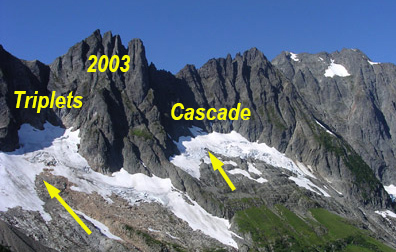
The Triplets and Cascade Peak glacier with active crevassing in 2003 with developing separation between east and west sections at yellow arrows.
The Triplets and Cascade Peak glacier with active crevassing only on Cascade Peak glacier in 2016 Google Earth image (yellow arrow).
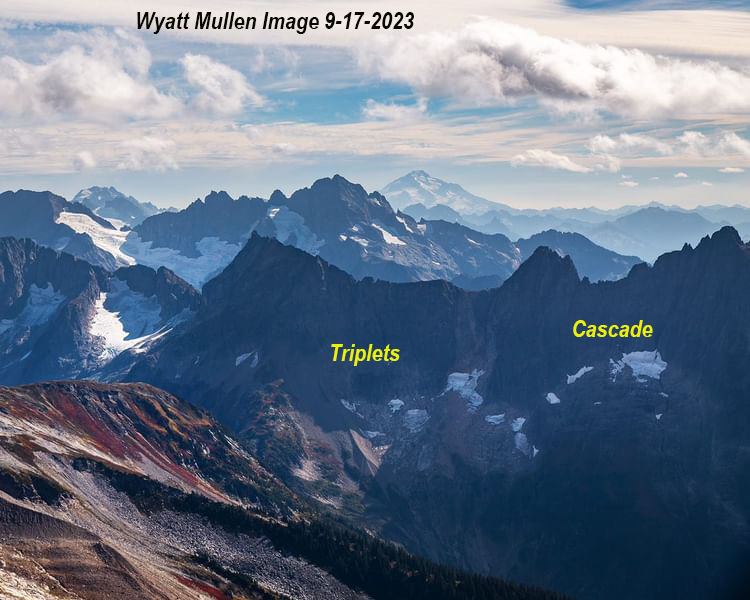
In Sept 2023 The Triplets is now six fragments Cascade Peak glacier is three fragments. Image from Wyatt Mullen, who shares spectacular images on Instagram daily.
From 2003-2005 each summer these two glaciers failed to retain much snowpack and continued to thin and lose area. The Global Land Ice Measurements from Space (GLIMS) assessed the The Triplets and Cascade Peak glaciers with an areas of respectively 55,000 m² and 60,000 m², respectively this area was updated with a 2015 area assessment of 70,000 m² and 32,000 m² respectively. In 2019, 2021, 2022 and 2023 glaciers in the North Cascades experienced a sequence of years that left most glaciers in the range largely snow free for the last 4-6 weeks of the melt season leading to exceptional mass loss and consequently area loss. The area of the largest contiguous area of ice of the two glaciers declined from 51,000 m² and 31,000 m² in 2019, to 37,000 m² and 26,000 m² in 2021 and 18,000 m² and 15,000 m² in 2023. By 2023 neither glacier exhibited active crevassing as both approached the lower threshold for glacier existence. Thirty years after my initial assessment both The Triplets and Cascade Peak glaciers no longer exist. This is shown in the GLIMS glacier viewer which illustrates extinct glaciers as black dots. These two are in the list of 34 extinct glaciers in the North Cascades that I have measured since 1984 that are now gone, and are in this GLIMS extinct glacier layer. The sustained mass balance loss of North Cascade glaciers is what is leading to significant volume declines of all glaciers and loss of glaciers that were thin (Pelto, 2018).
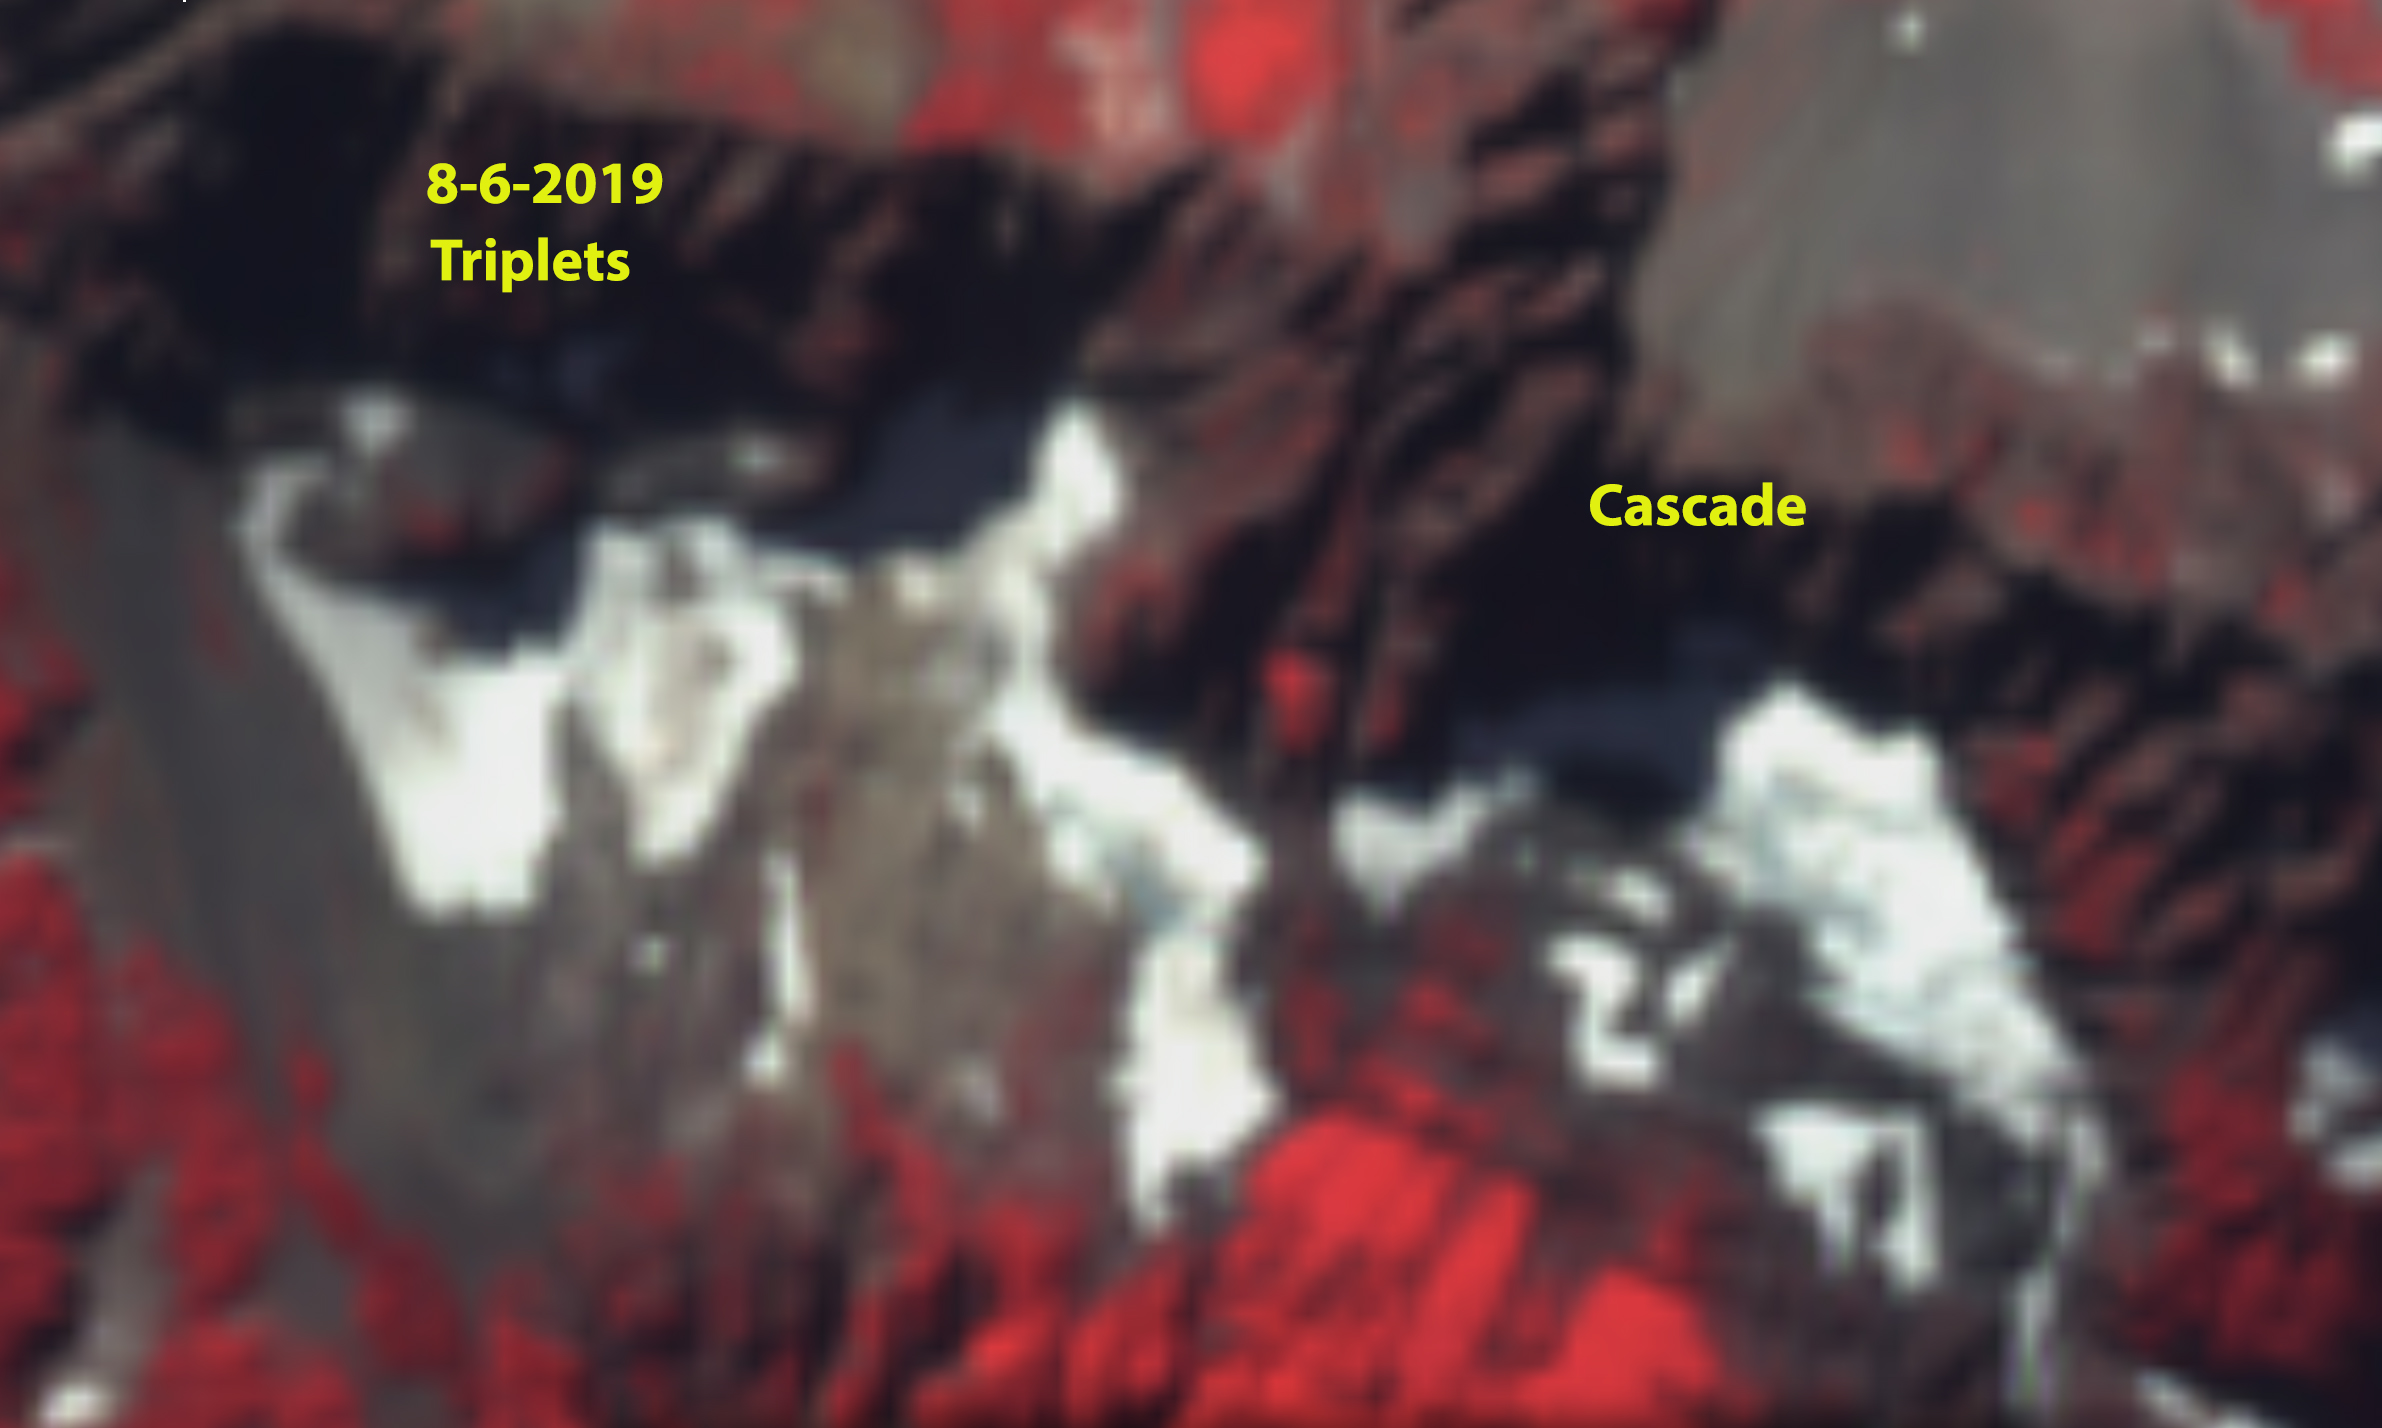
The Triplets and Cascade Peak glacier in August 2019 Sentinel false color image. Area of The Triplets glacier =51,000 m²: Cascade Peak glacier=31,000 m²
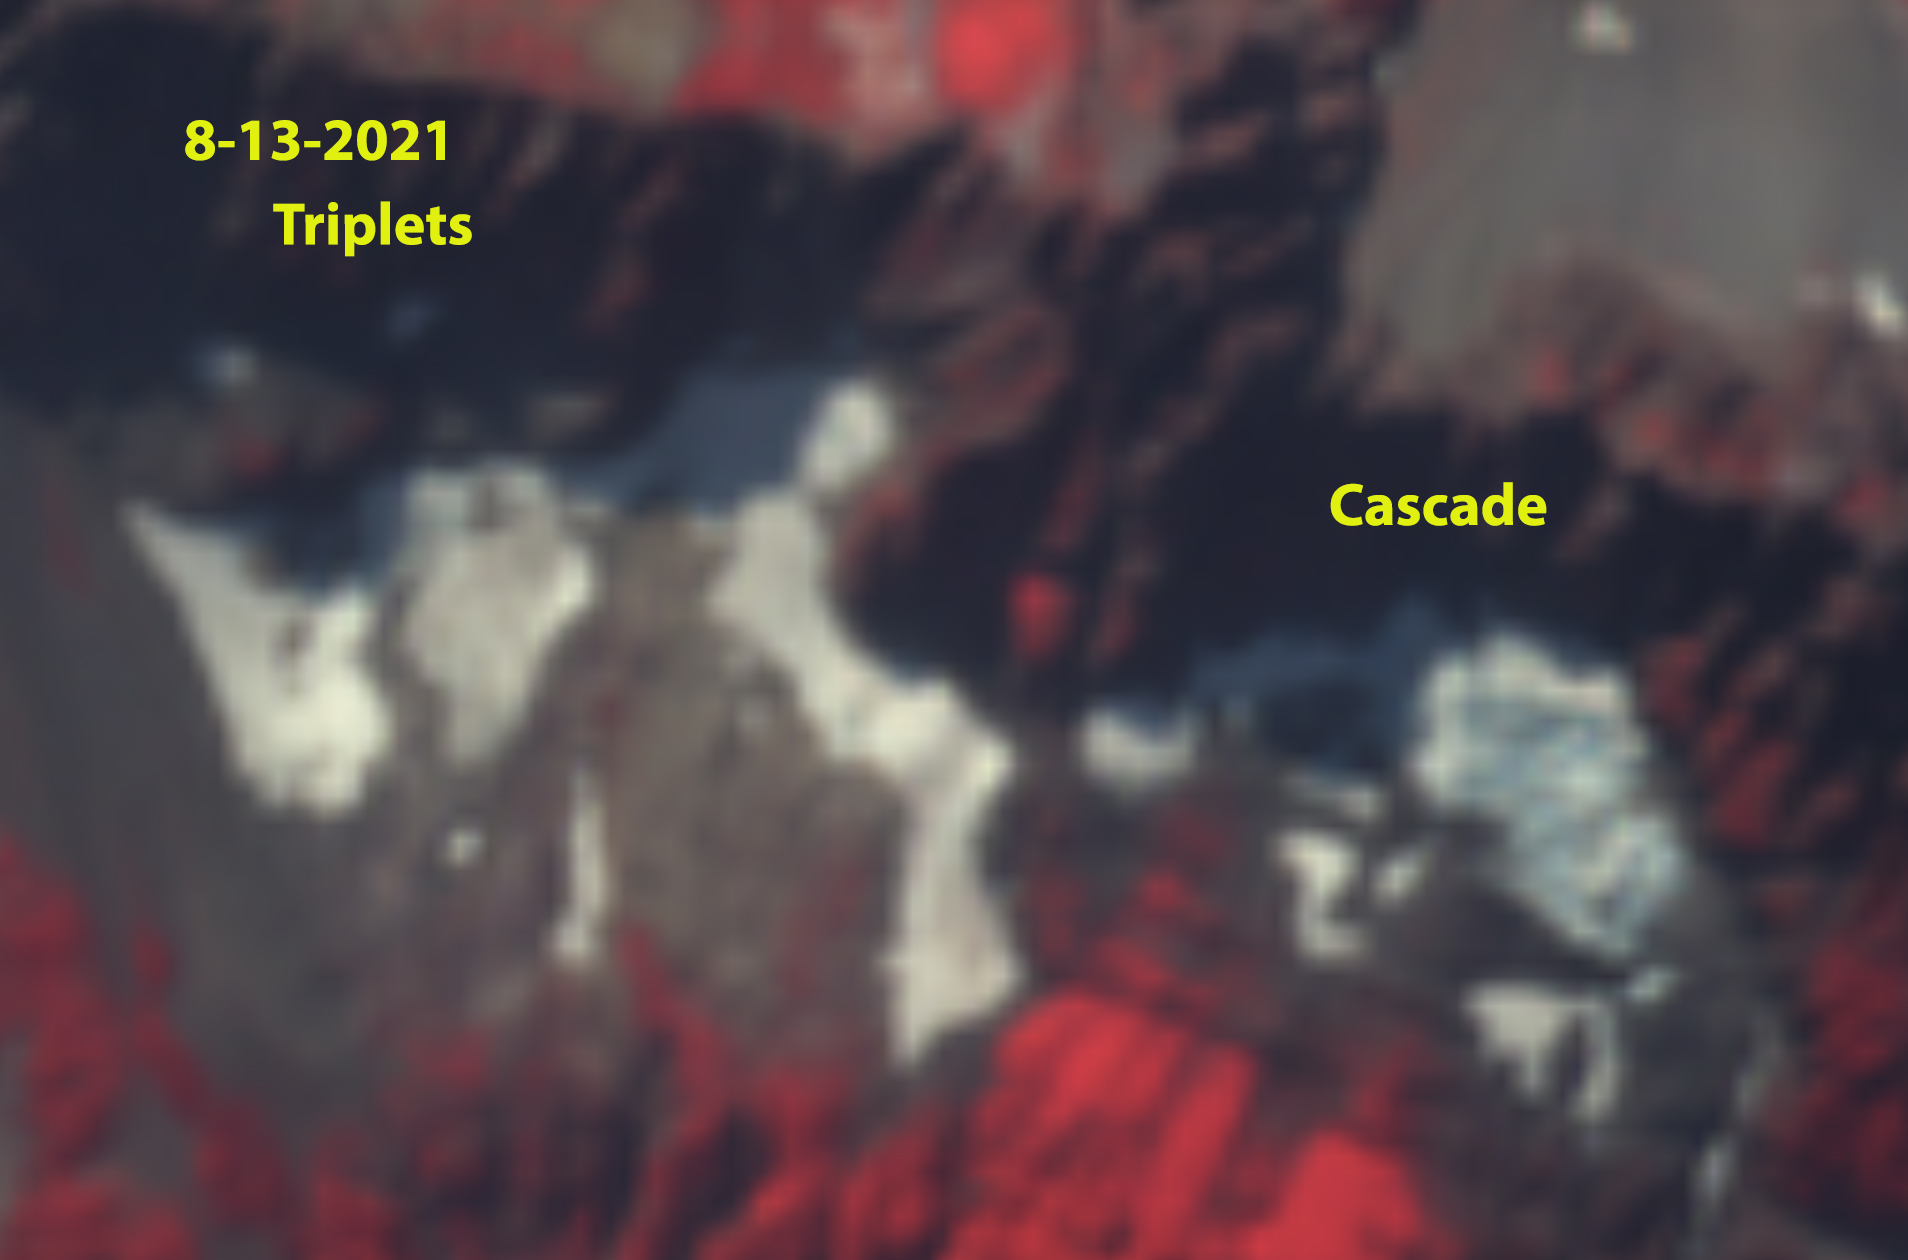
The Triplets and Cascade Peak glacier in August 2021 Sentinel false color image. Area of The Triplets glacier =37,000 m²: Cascade Peak glacier=26,000 m²
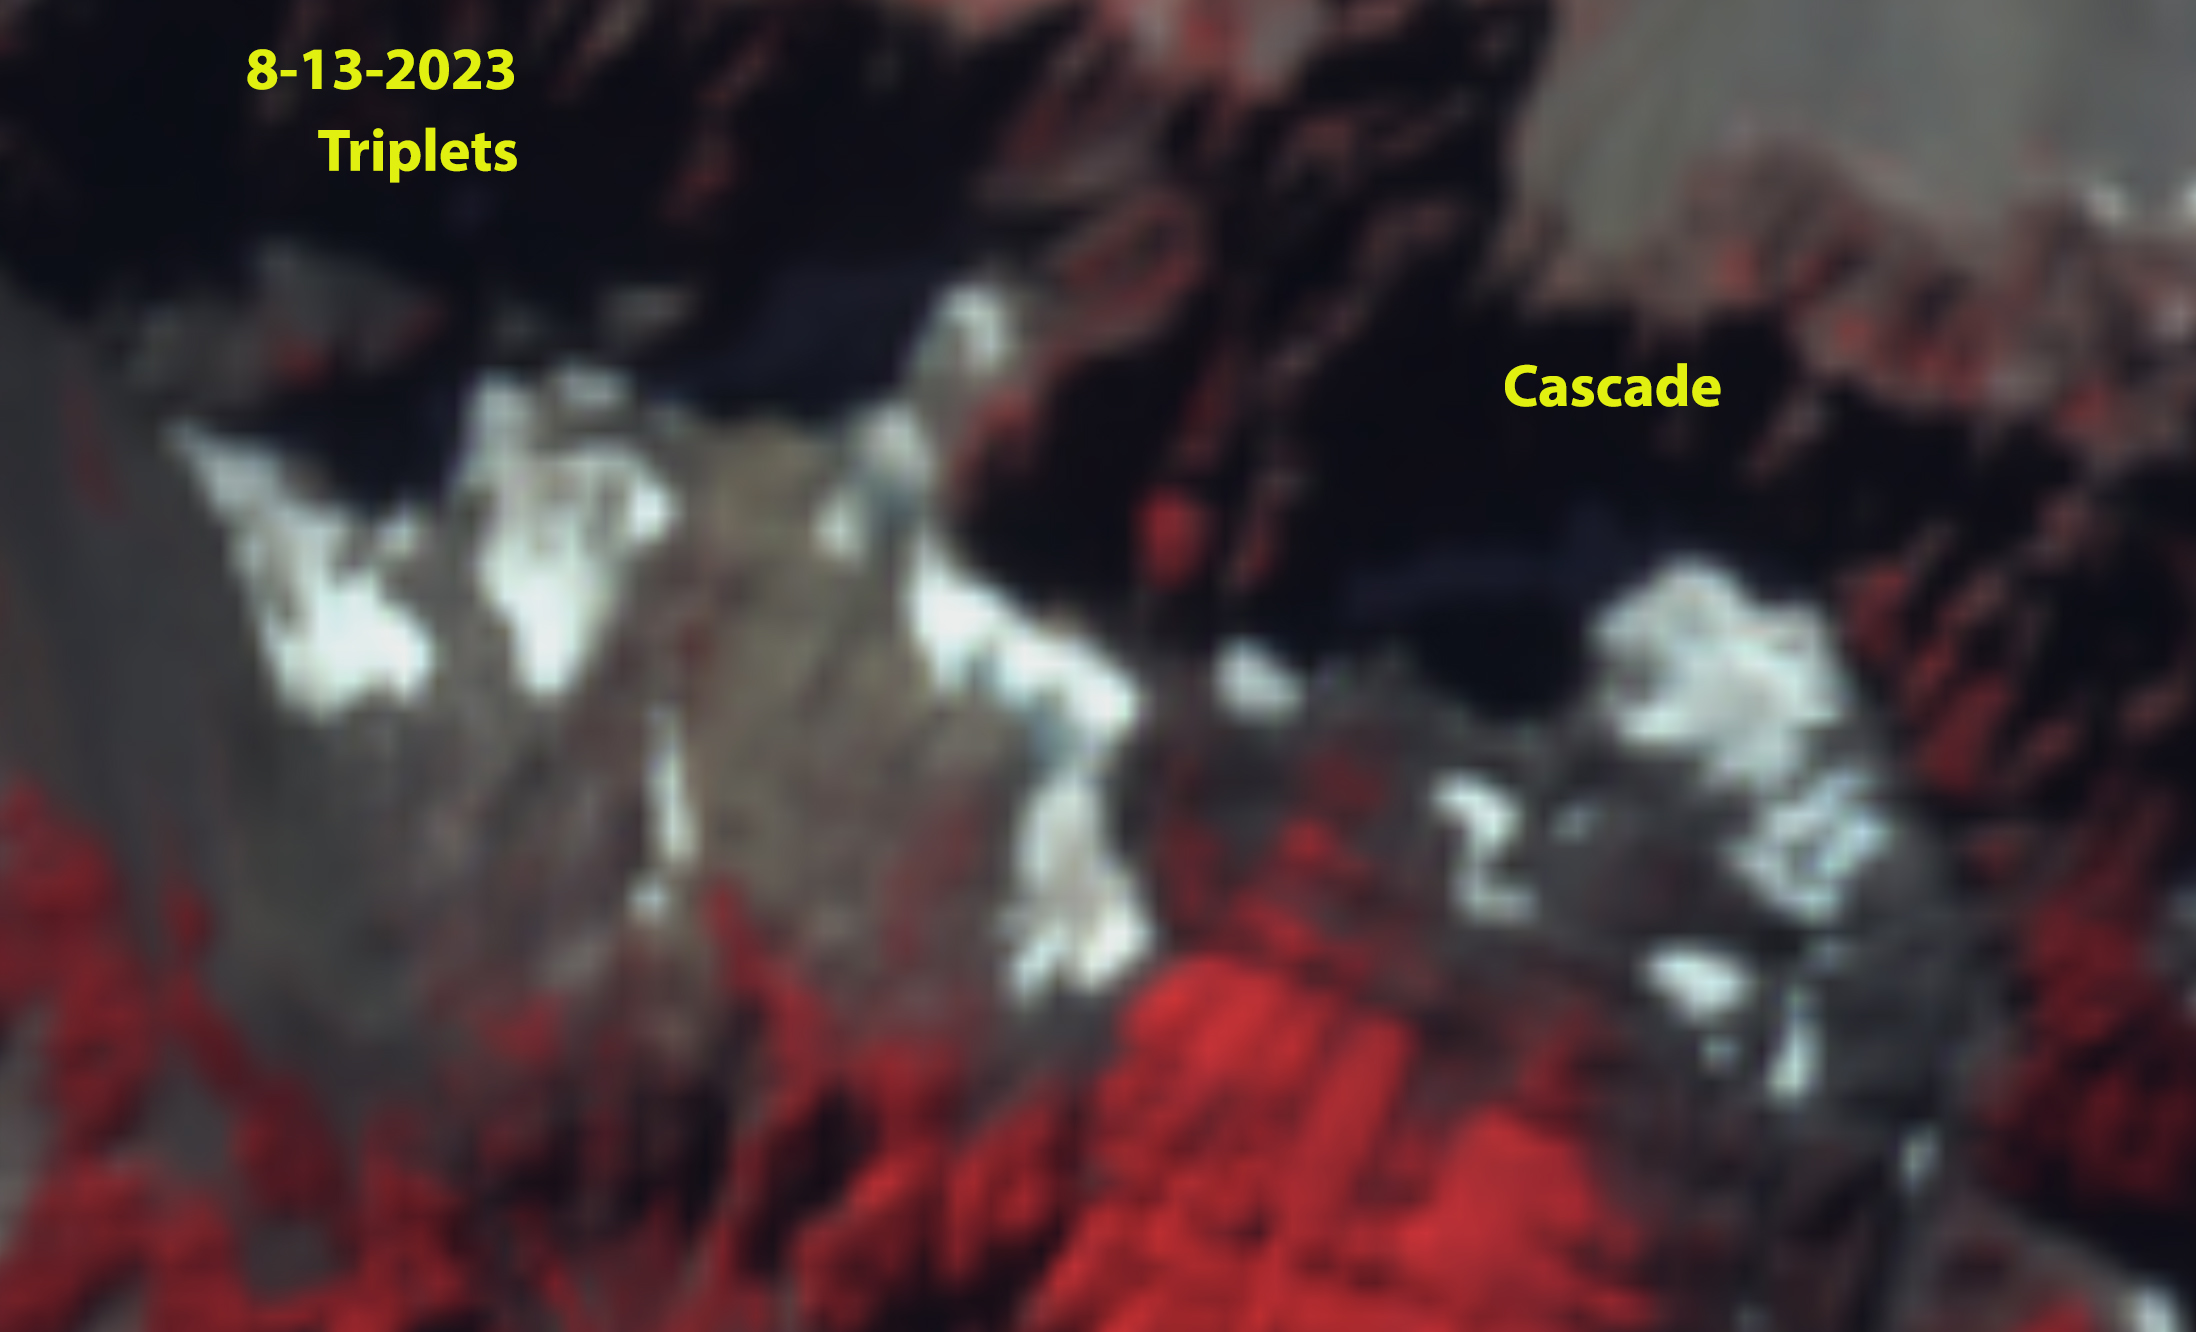
The Triplets and Cascade Peak glacier in August 2023 Sentinel false color image. Area of The Triplets glacier =18,000 m²: Cascade Peak glacier=15,000 m²
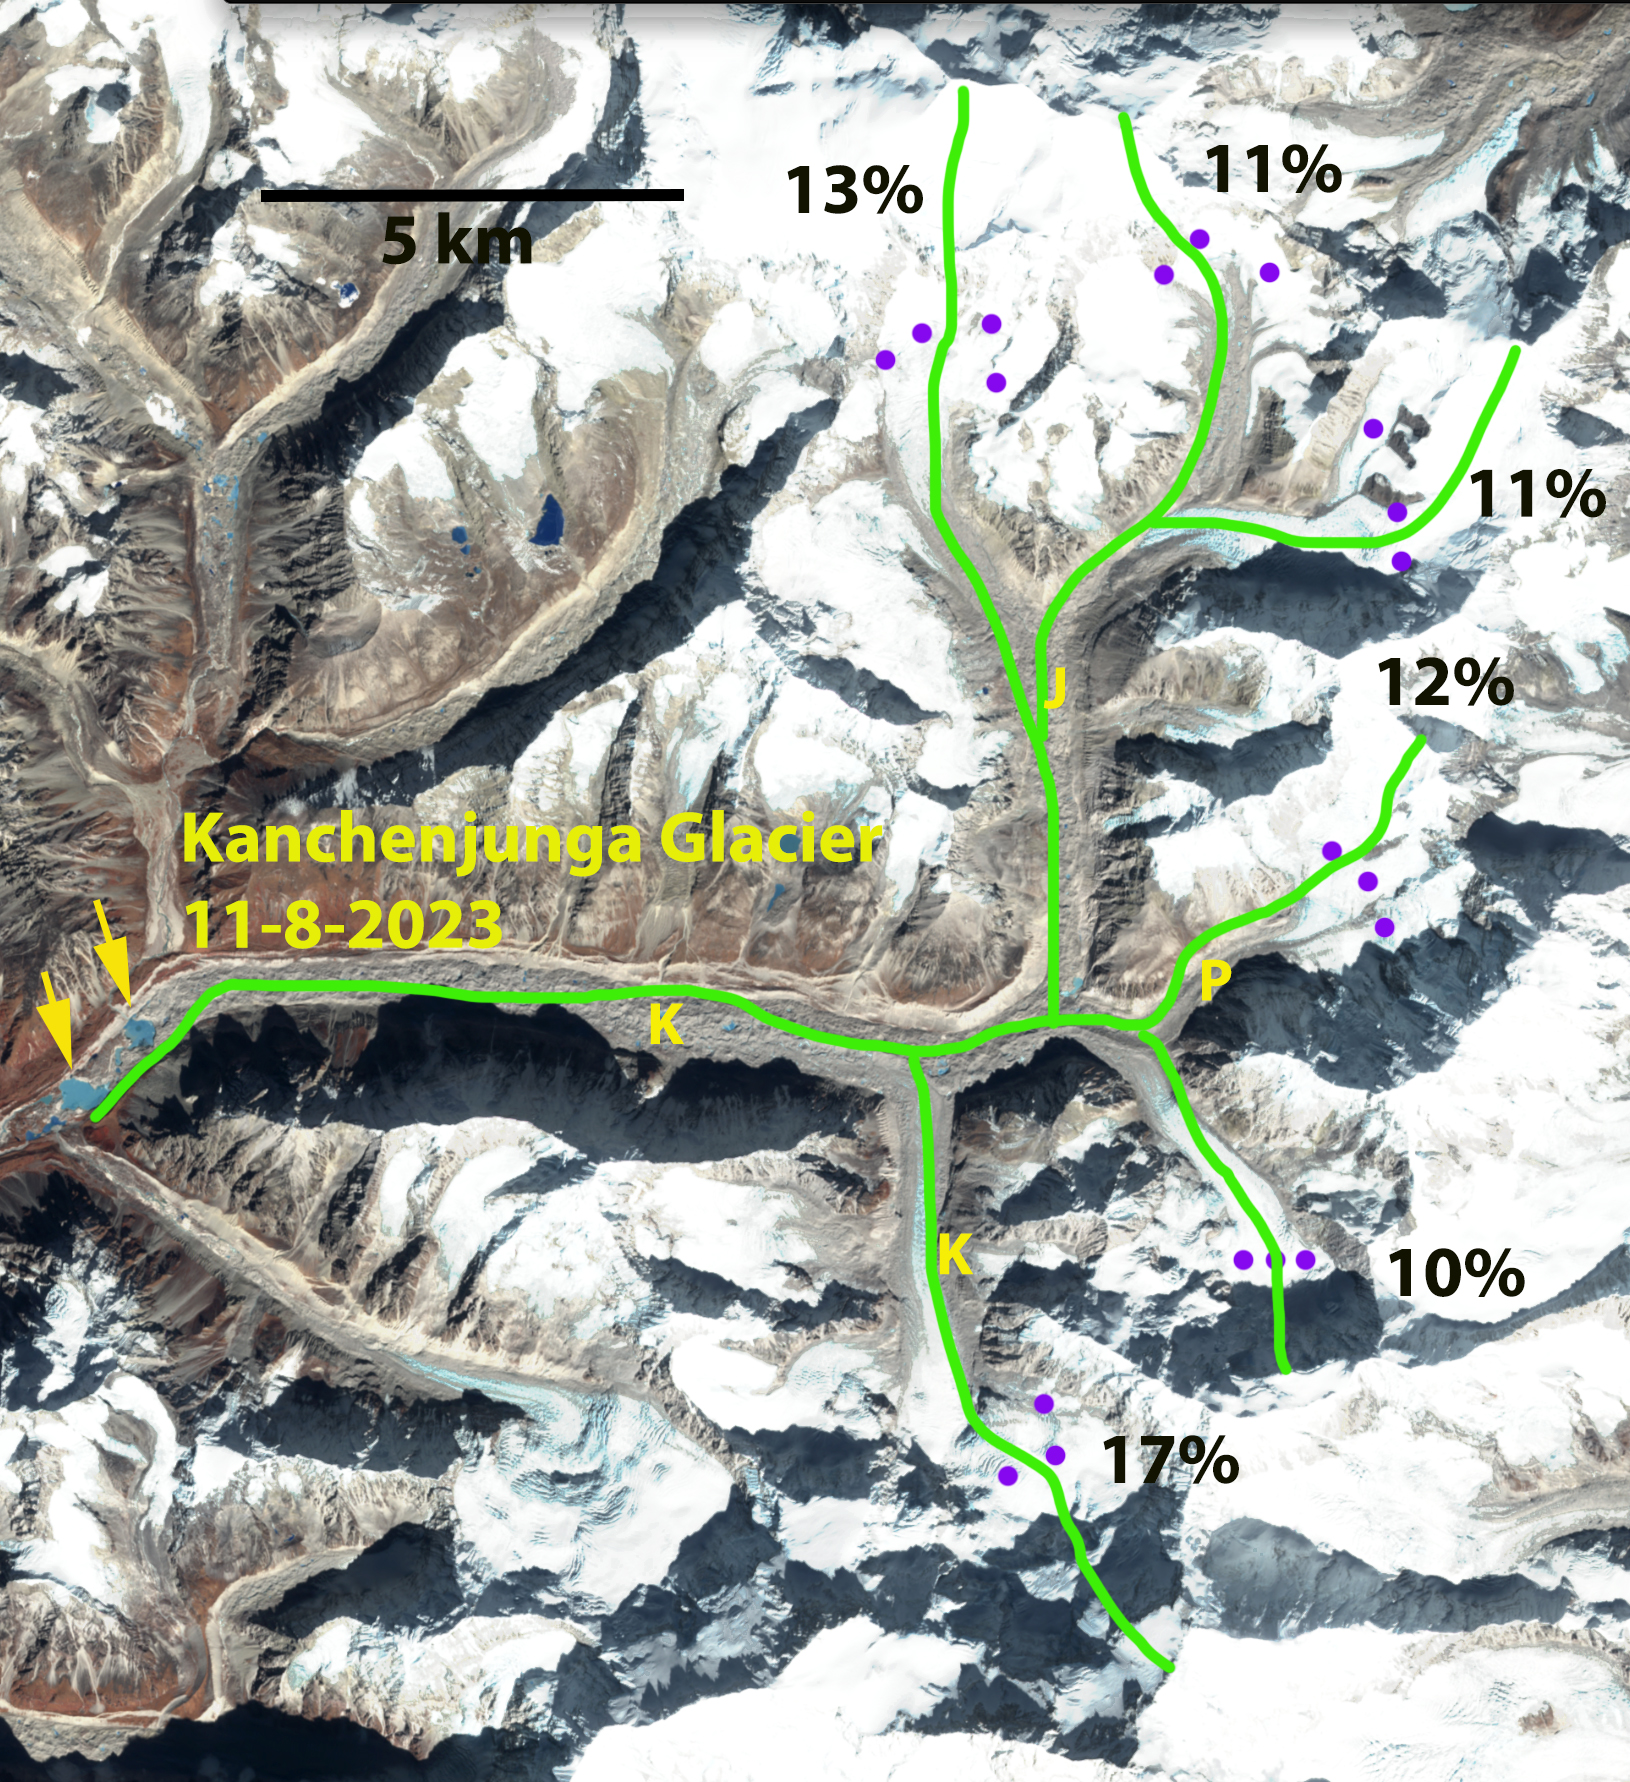
Kanchenjunga Glacier in Nov. 8, 2023 false color Sentinel image. The flowlines of the six tributaries shown in green with the snowline on each at the purple dots. Percentage of glacier length above the snowline for each tributary shown as percentage. Two rapidly expanding supraglacial lakes shown at yellow arrows.
Kanchenjunga Glacier is the main glacier draining west from Kanchenjunga Peak draining into the Ghunsa River. Lamsal et al (2017). report a loss of -0.18 m/year from 1975-2010. They noted an increase in supraglacial ponds and that the glacier had decreased in thickness mainly between the terminus and 5500 m, with some thickness increases above 5850 m. The Kanchenjunga Region has produced 6 to 8 GLOF’s since the late 1960’s, but none from the Kanchenjunga Glacier which had lacked substantial proglacial or supraglacial lakes until now (Byers et al 2020). Here we examine Sentinel imagery indicating the high snowline in November 2020, January 2021 and November 2023.
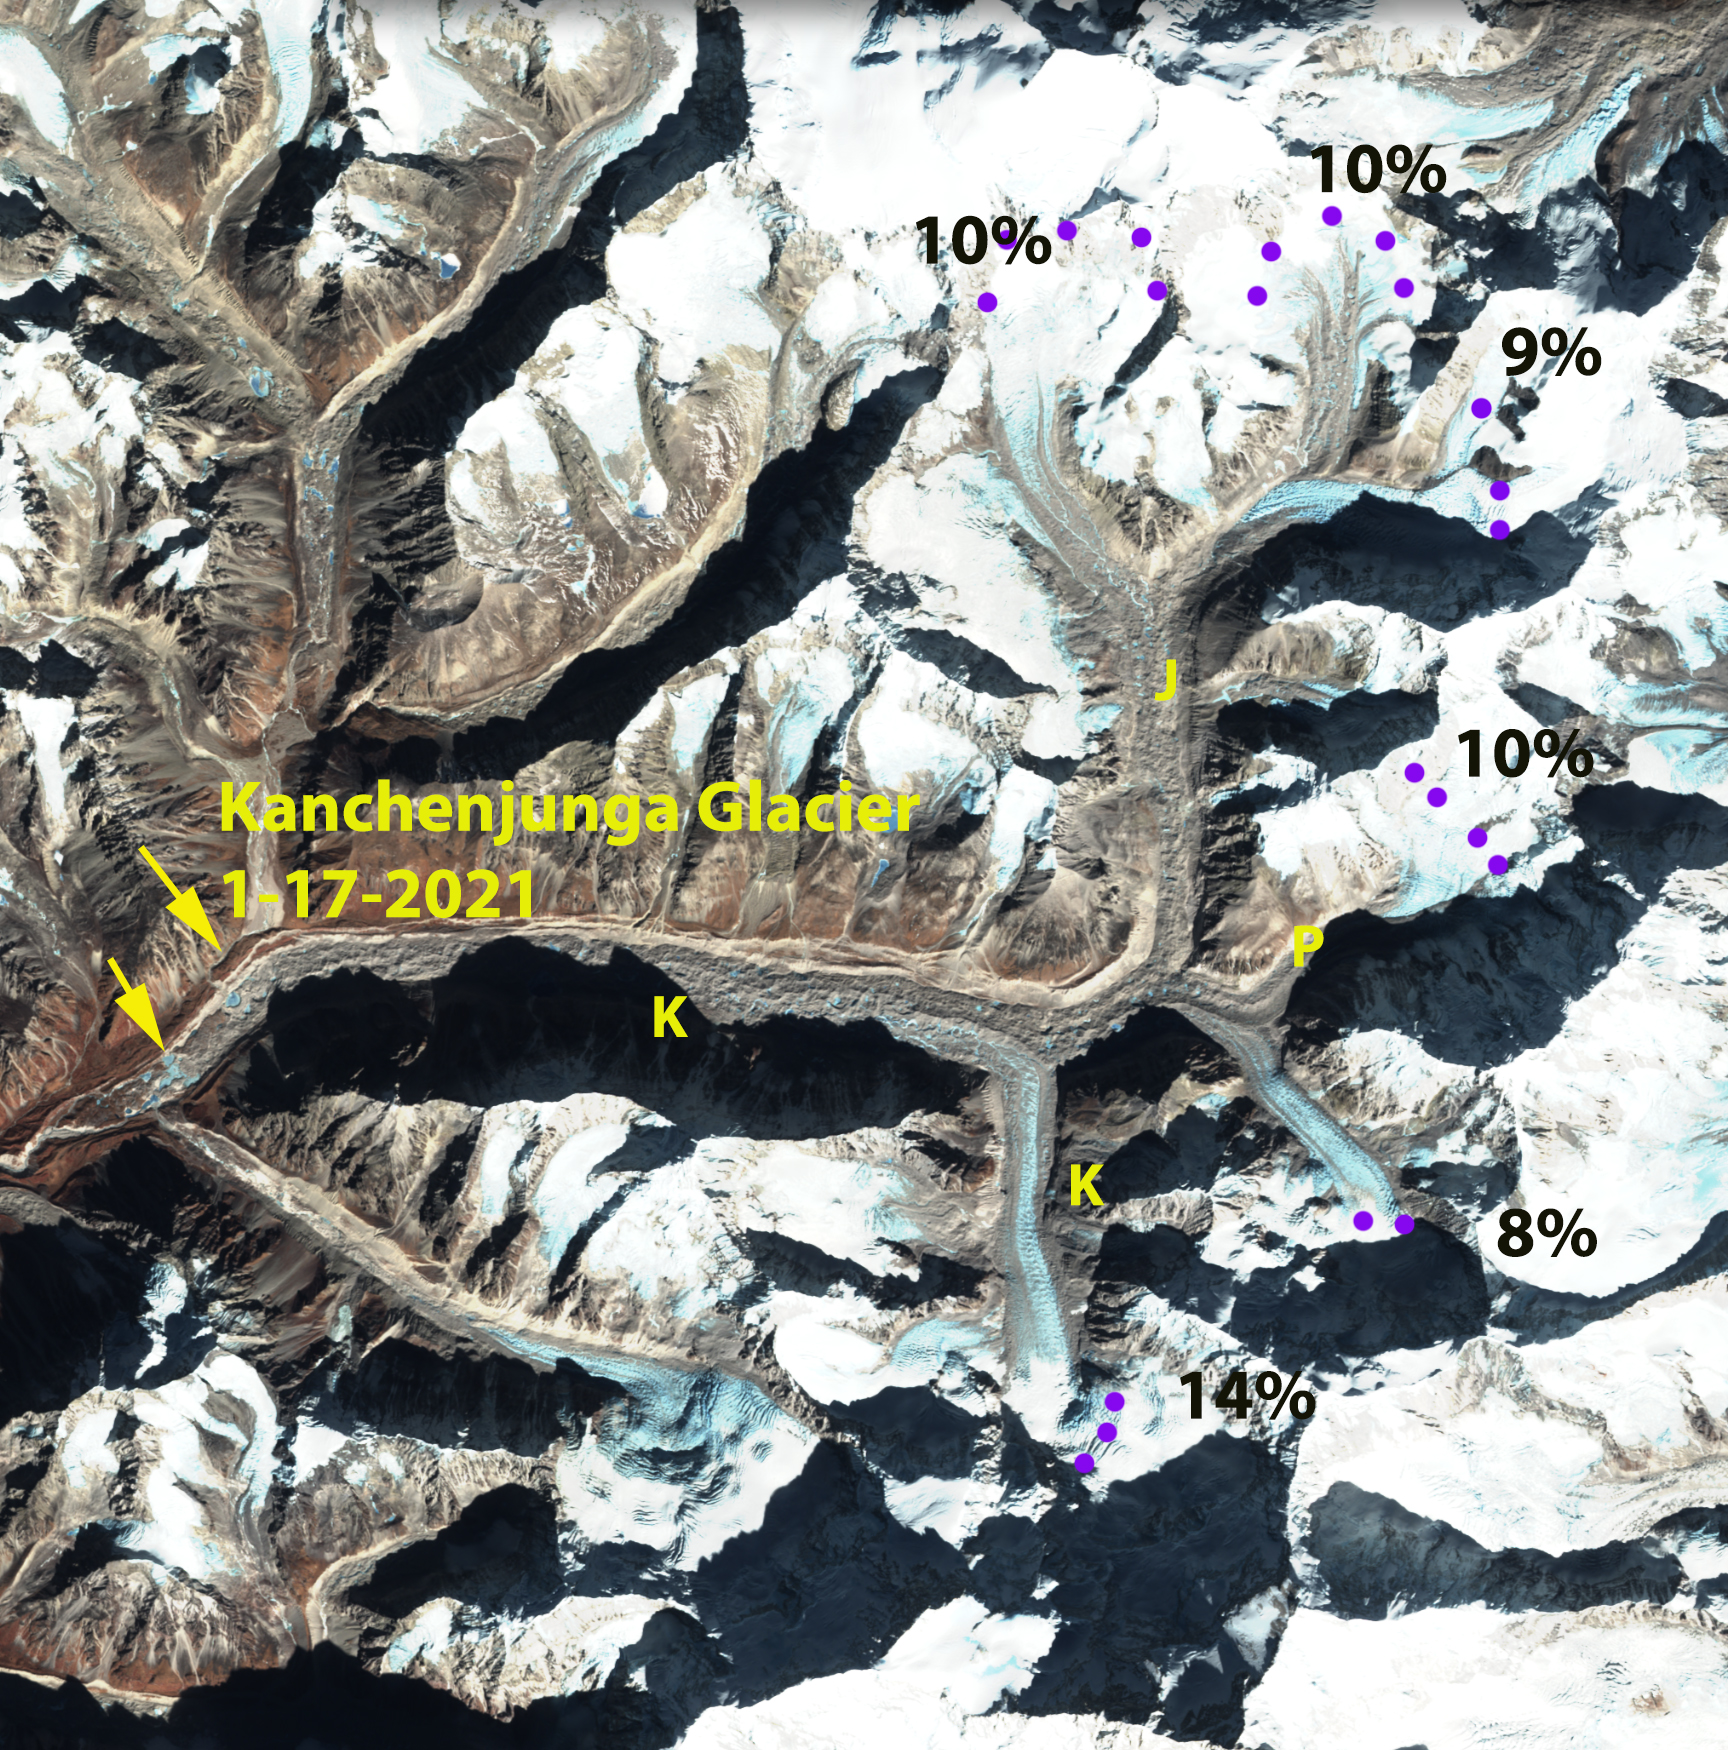
Kanchenjunga Glacier in Jan,. 17, 2021 false color Sentinel image. The snowline on each at the purple dots. Percentage of glacier length above the snowline for each tributary shown as percentage. Two rapidly expanding supraglacial lakes shown at yellow arrows.
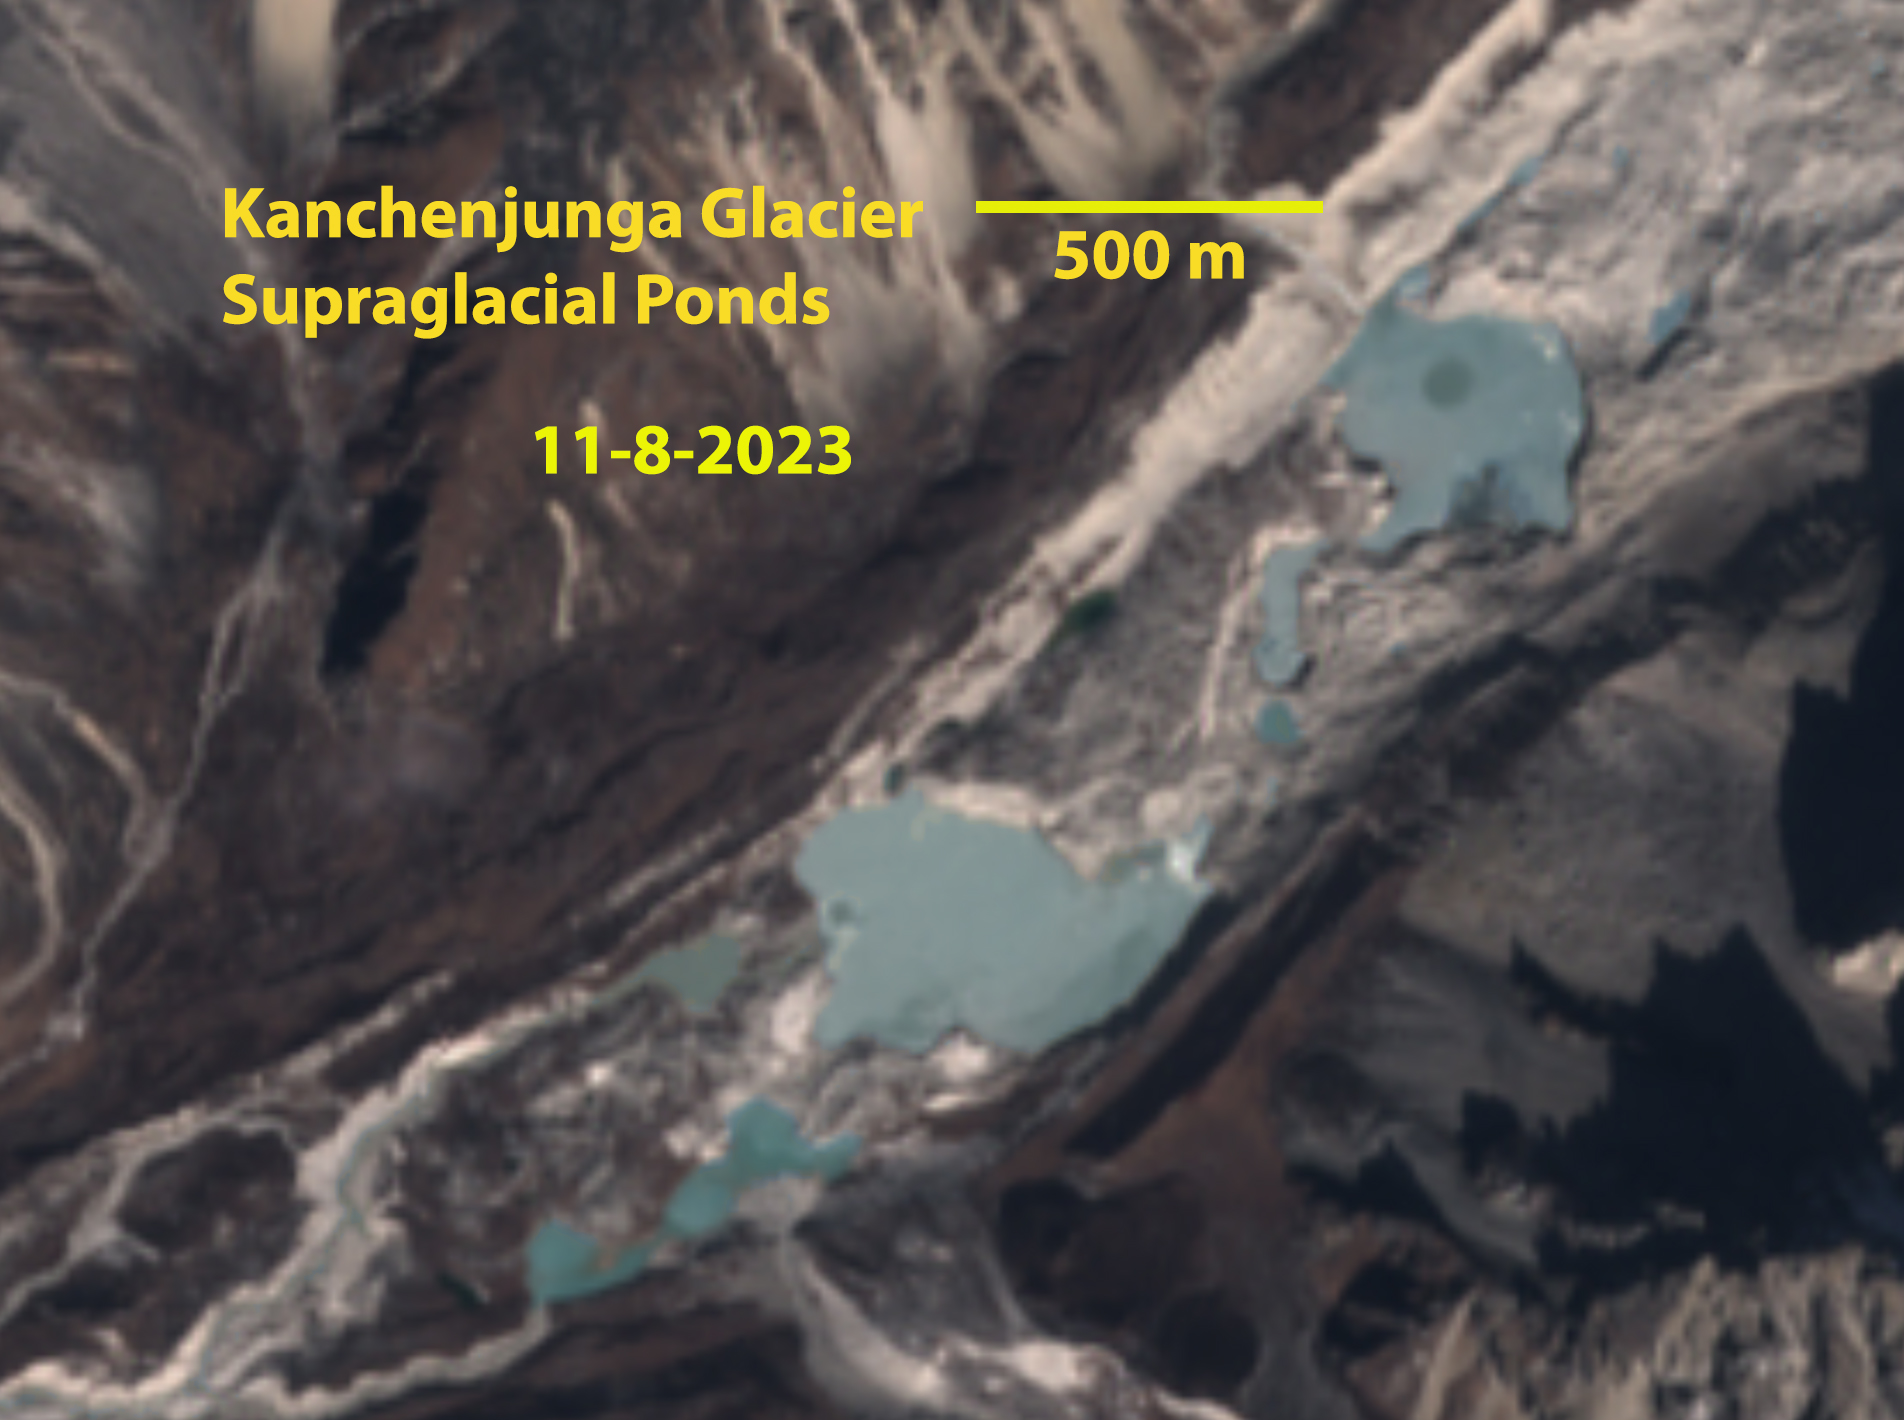
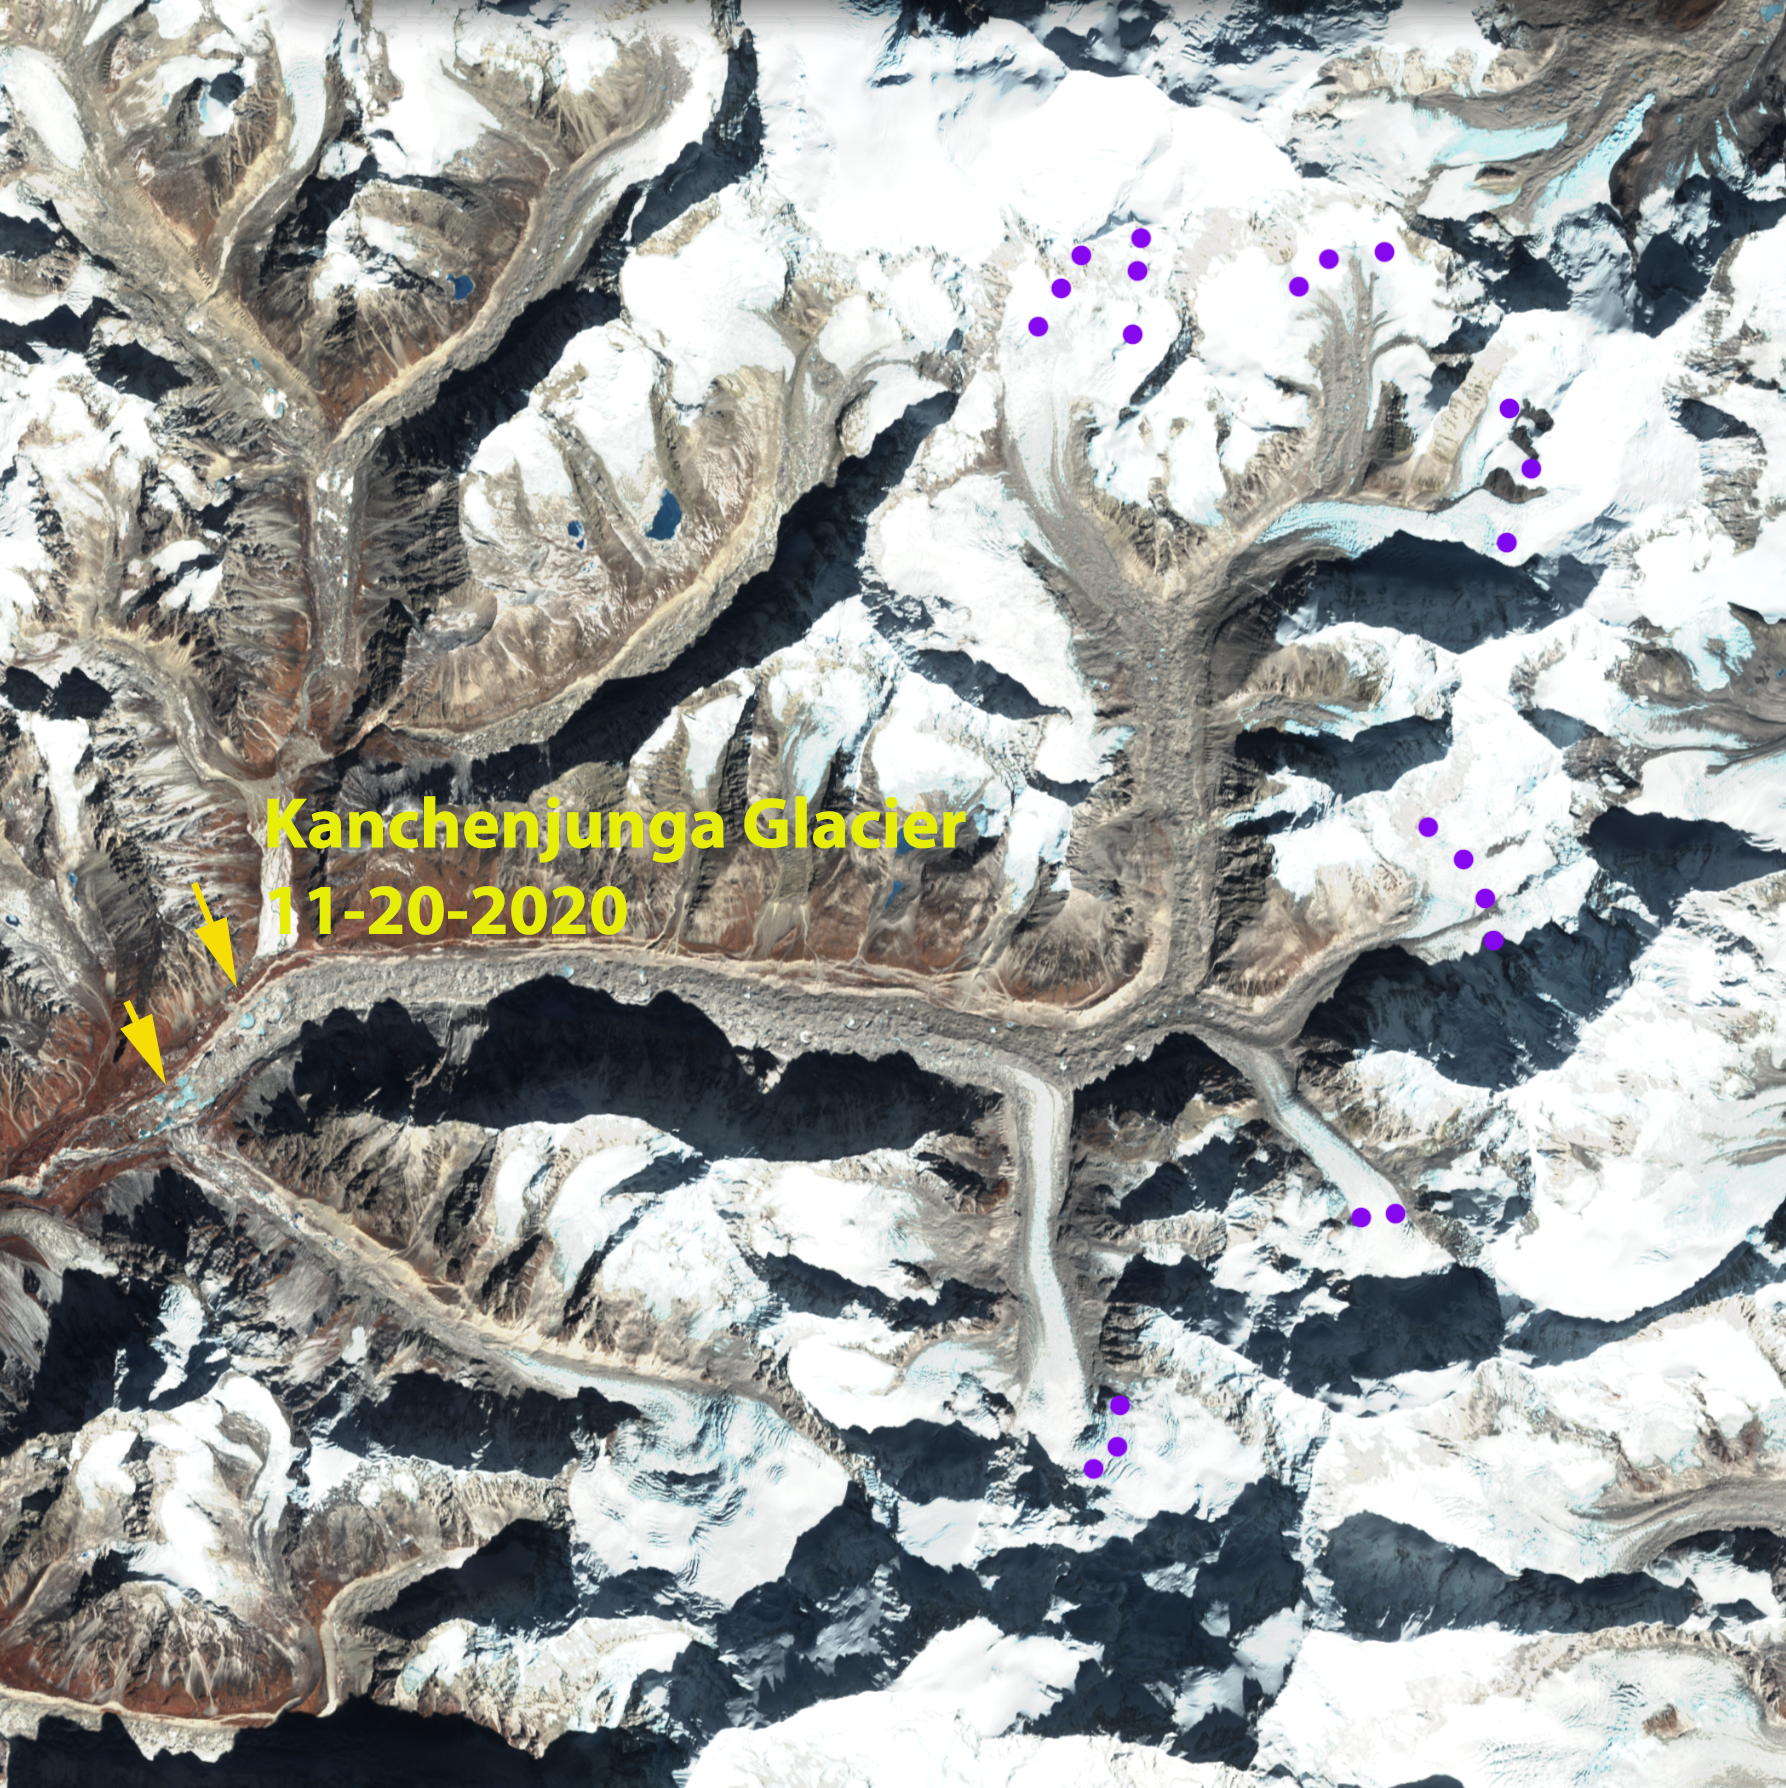
A glacier needs a majority of its area to be in the accumulation zone to maintain its mass balance. In November 2020 the transient snow line averages 5800 m. By January 17, 2021 the snowline has risen to an average of 5950 m. Measuring the distance from the terminus to top of the glacier along the six main tributaries, and determining the percentage of this length above the snowline in the accumulation area, from 8-14% of the length is the accumulation area. This leaves a limited accumulation area. The January 2021 period had an unusually high snowline due to heat wave in January, that led to high snowlines on Mount Everest as well (Pelto et al 2021). In November 2023 the snowline averages 5900 m across the six tributaries, ranging from 10-17% of the length of the tributaries being above the snowline, mcuh too little to maintain equilibrium. The yellow arrows indicate one noteworthy change near the terminus the growth of new supraglacial ponds. The upper pond expanded from 20,000 m² in Nov. 2020 to 80,000 m² in Nov. 2023, the lower pond consisted of three discrete segments with an area of 50,000 m² in Nov. 2020 to 120,000 m² in Nov. 2023. These are the largest supraglacial lakes to appear on this glacier in the last several decades at least. These two ponds have a greater combined area than all ponds on the glacier in 2010 which Lamsal et al (2017) reported as 0.16 km². At that time the largest pond was 30,000 m².
Screenshot
Kanchenjunga Glacier terminus area supraglacial ponds in Nov. 8, 2023 false color Sentinel image. Each has more than doubled in size in last three years, with areas of 80,000 and 120,000 m².
Screenshot
Kanchenjunga Glacier in Nov. 10, 2020 false color Sentinel image. The snowline on each at the purple dots. Two rapidly expanding supraglacial lakes shown at yellow arrows.
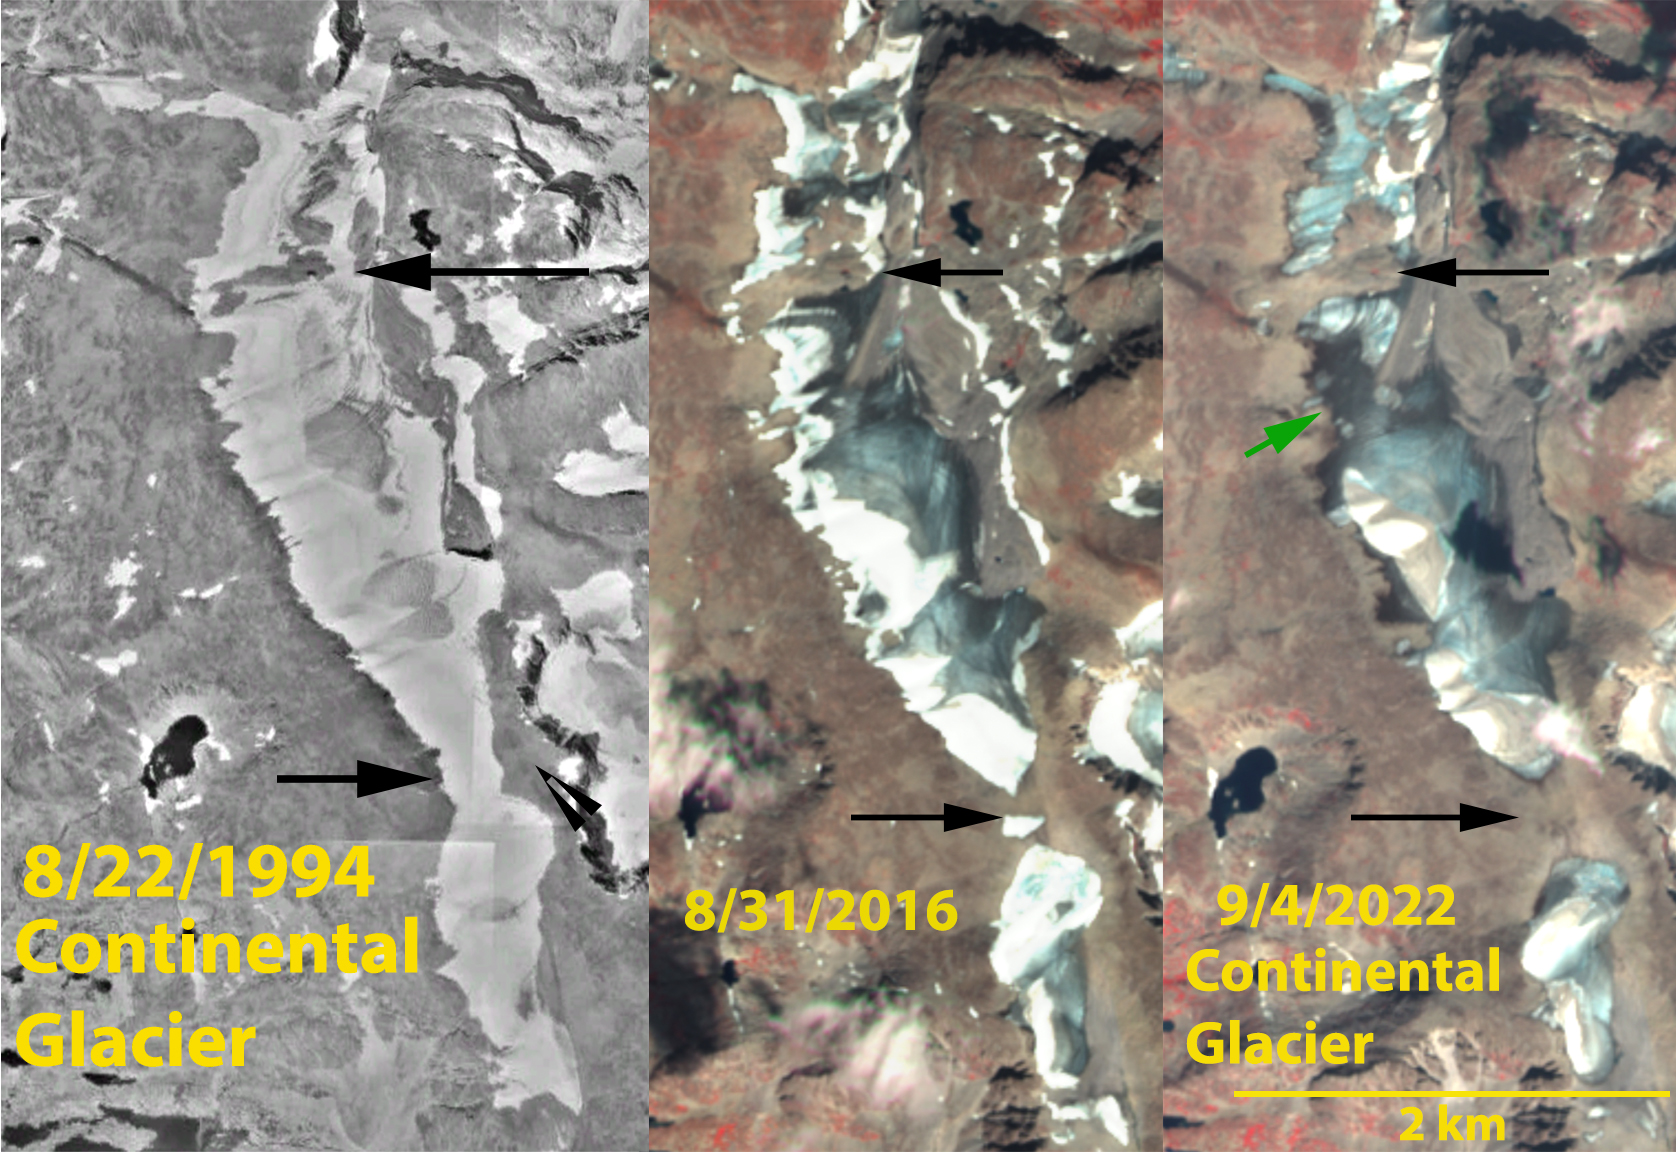
Continental Glacier in 1994 Google Earth and 2016 and 2022 Sentinel images, illustrating the separation at the black arrows, into the northern middle and southern parts, with an impending separation at green arrow.
Continental Glacier is a long plateau glacier draped along the continental divide in the Wind River Range, Wyoming. It drains into Torrey Creek and then the Wind River. In 1994 this glacier extended 5 km from south to north with an area of 2.4 km². In 2012 Van Looy et al (2013) used GPR to determine ice thickness and project how long the glacier could last. They found 59% of the glacier was less than 40 m thick, with two cirque depressions filled with deeper ice exceeding 150 m. They found a thinning rate of 0.3 m/year for the 1966-2012 period. They did not include the southern part of the glacier in their study.
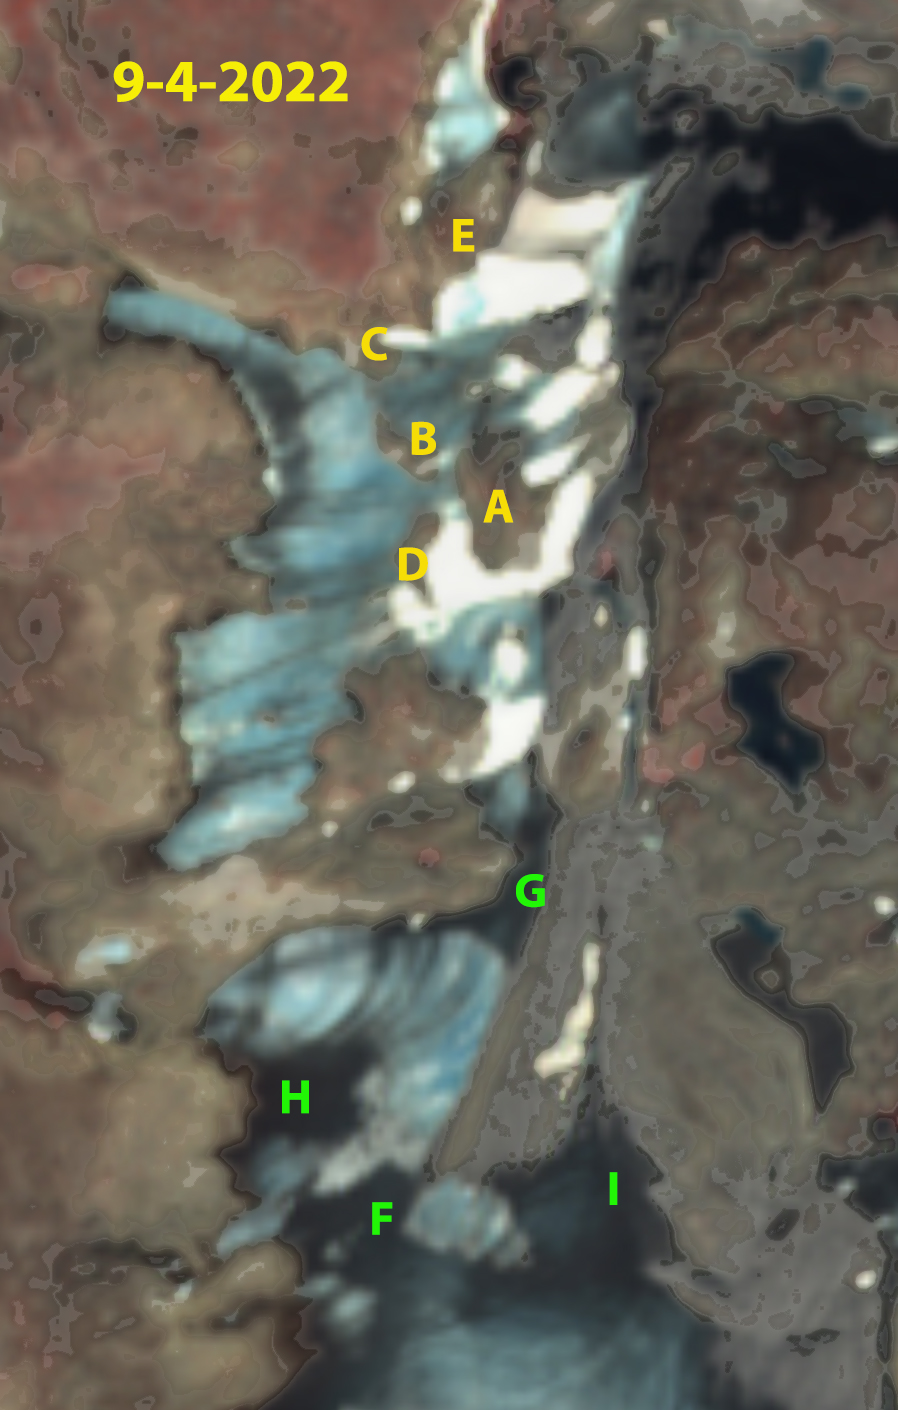
In 2016 the glacier is in three parts and glacier area has been reduced to 1.9 km². By 2022 additional fragmentation at the green arrow in the middle segment is imminent. The northern and southern parts are wasting away rapidly. A closeup of the northern section of the glacier in 2022 illustrates how thin, fragmented, and stagnant the ice has become. Point A-E indicate bedrock areas emerging amidst northern part. Point F-I indicate very thin, old, dark ice in the middle part. This glacier is following a similar path to the Grasshopper Glacier just to the south. Van Looy et al (2013) noted that in the next century the volume would be reduced by 43% and the glacier would be lost in 300-400 years. The pace of loss has increased significantly with volume loss of ~2% per year since 2013, which will lead to loss of all areas with less than 40 m of ice in 2012 being lost by 2040. The two areas of deep ice will persist much longer. This same trend has led to the loss of Heap Steep Glacier, Harrower Glacier and Twins Glacier in the Wind River Range since 2015.
Screenshot
Continental Glacier in 9-4-2022 false colar Sentinel image. Point A-E are bare rock areas amidst northern part of glacier. Point F-I dark, old thin ice in the middle part.
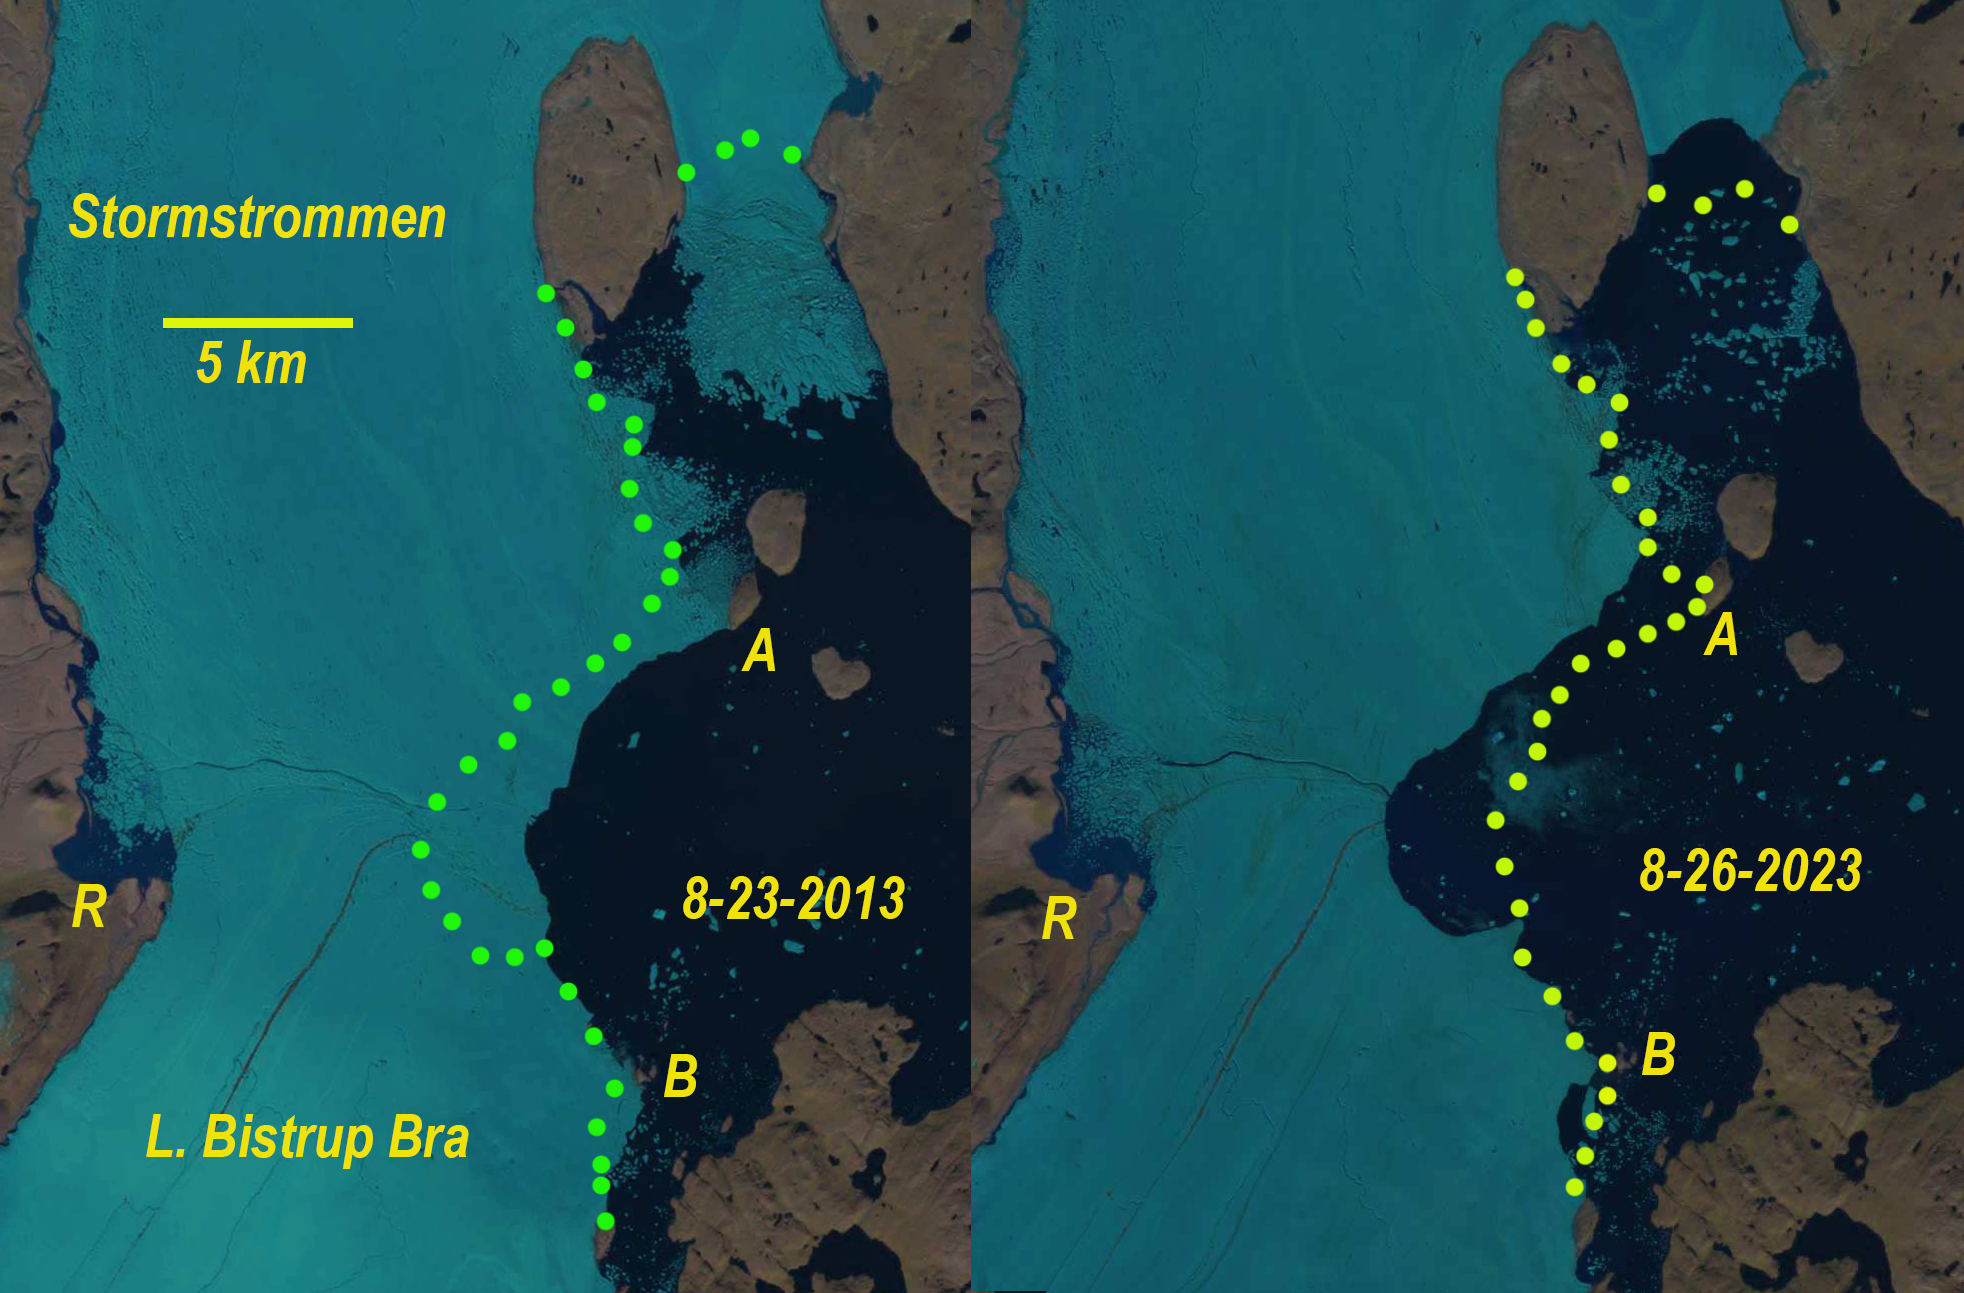
Storstrømmen and L. Bistrup Brae in Landsat imagery from 8-23-2013 and 8-26-2023. Green dots on 2013 image is the 2023 margin. Yellow dots on 2023 image is the 2013 margin. Island A and Island B are at the glacier front in 2013 and are fully separated by 2023. R=Randsoen proglacial lake.
Storstrømmen and L. Bistrup Brae are large outlet glaciers in northeast Greenland that join at their terminus. The calving front is long and has numerous island pinning points. They comprise a large relatively flat low lying terminus region, the southernmost floating ice tongue in East Greenland. Rignot et al (2022) radio echo soundings in August 2020 reveal a seabed at 350–400 m depth the ice shelf front, with shallower terrain (<100 m) over a 30-km wide region to the east that blocks the access of warm, salty, subsurface Atlantic Intermediate Water. This water would accelerate ice shelf bottom melting. They note a ~23 m thinning near the grounding line on Storstrømmen from 1999-2014. They also report a 1.1 km retreat of the grounding line from 2017-2021. Storstrømmen is a surging glacier fed by the NEGIS, that surged 3 times during the 20th century and is in a quiescent phase. The last surge was in 1978-1982. Mouginot et al (2018) indicate the differential between inland thickening and terminus thinning will yield pre-surge conditions by 2027-2030, this transition in elevation change occurs ~50 km inland of terminus. Grinsted et al (2022) point out that the NEGIS has accelerated and expanded laterally, above a point ~200 km inland, between 1985 and 2018, Storstrømmen terminus area is still slowing. Will these inland changes in the NEGIS impact the next surge cycle?
The thinning of the floating ice is leading to retreat and the release of new islands from the glacier. Here we examine Landsat images from 2013 and 2023 to illustrate. Island A is at the front of Storstrømmen in 2023 is 2.1 km from the ice edge. Island B is at the front of L. Bistrup Brae in 2013 and by 2023 is 0.9 km from the ice edge. The other notable change is the expansion of the Randsøen proglacial lake (Point R). The glacier width between Randsøen and the ice front has narrowed from 10 km to 7 km from 2013-2023, with 2.3 km retreat of the main terminus in the embayment. This embayment with a narrow connection between the two glaciers developed in the early 1970’s, but the two glaciers did remain connected (Mouginot et al 2018). There is substantial rifting in this section suggesting the next few years will see significant additional rifting. The supraglacial stream that drains Randsøen, flows along the boundary between Storstrømmen and Bistrup. The flow of this stream parts the sea ice in the Aug. 30, 2023 Sentinel image below. Will the glaciers separate in the next decade and how would that impact the next surge cycle? This post is an update to the 2013 post indicating that Storstrømmen is susceptible to rapid retreat
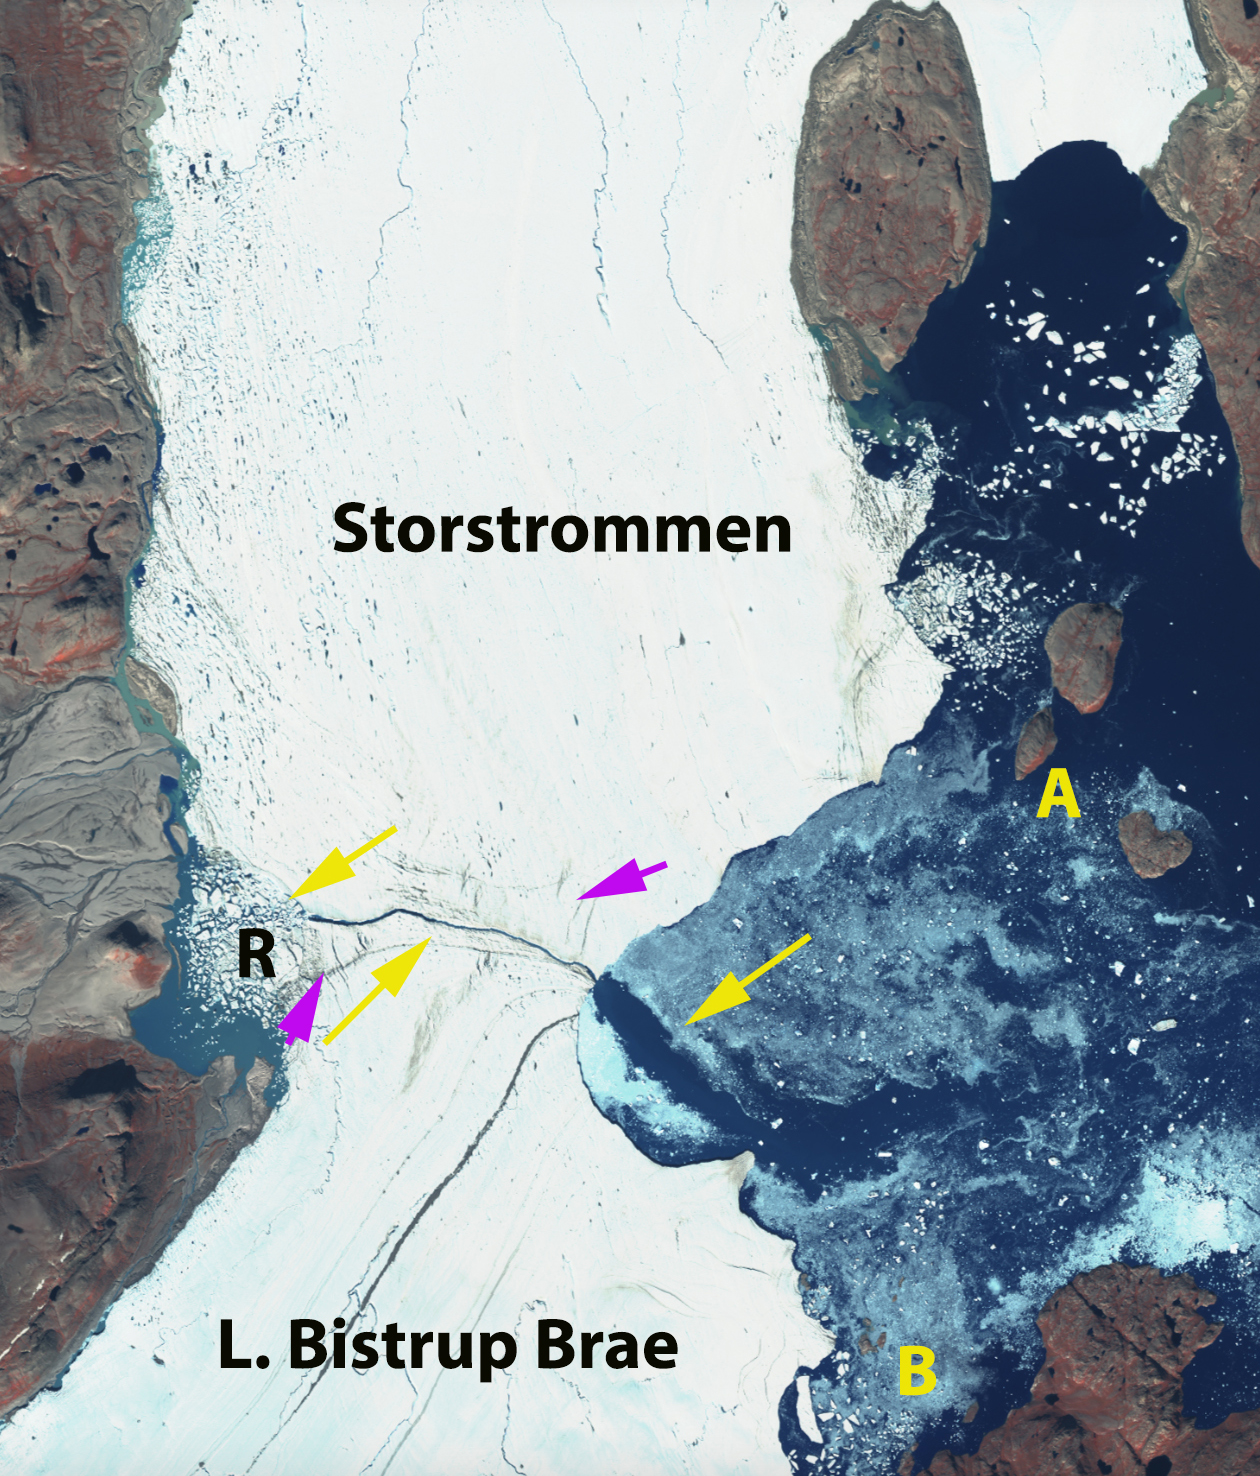
Storstrømmen and L. Bistrup Brae in Sentinel image from 8-30-2023. Island A and Island B that were at the glacier front in 2013 are fully separated by 2023. R=Randsoen proglacial lake with the yellow arrows indicating surpaglacial stream draining this lake across the glacier and then making a channel through the sea ice and icebergs. Pink arrows indicate rifts that indicate areas prone to calving in next few years.


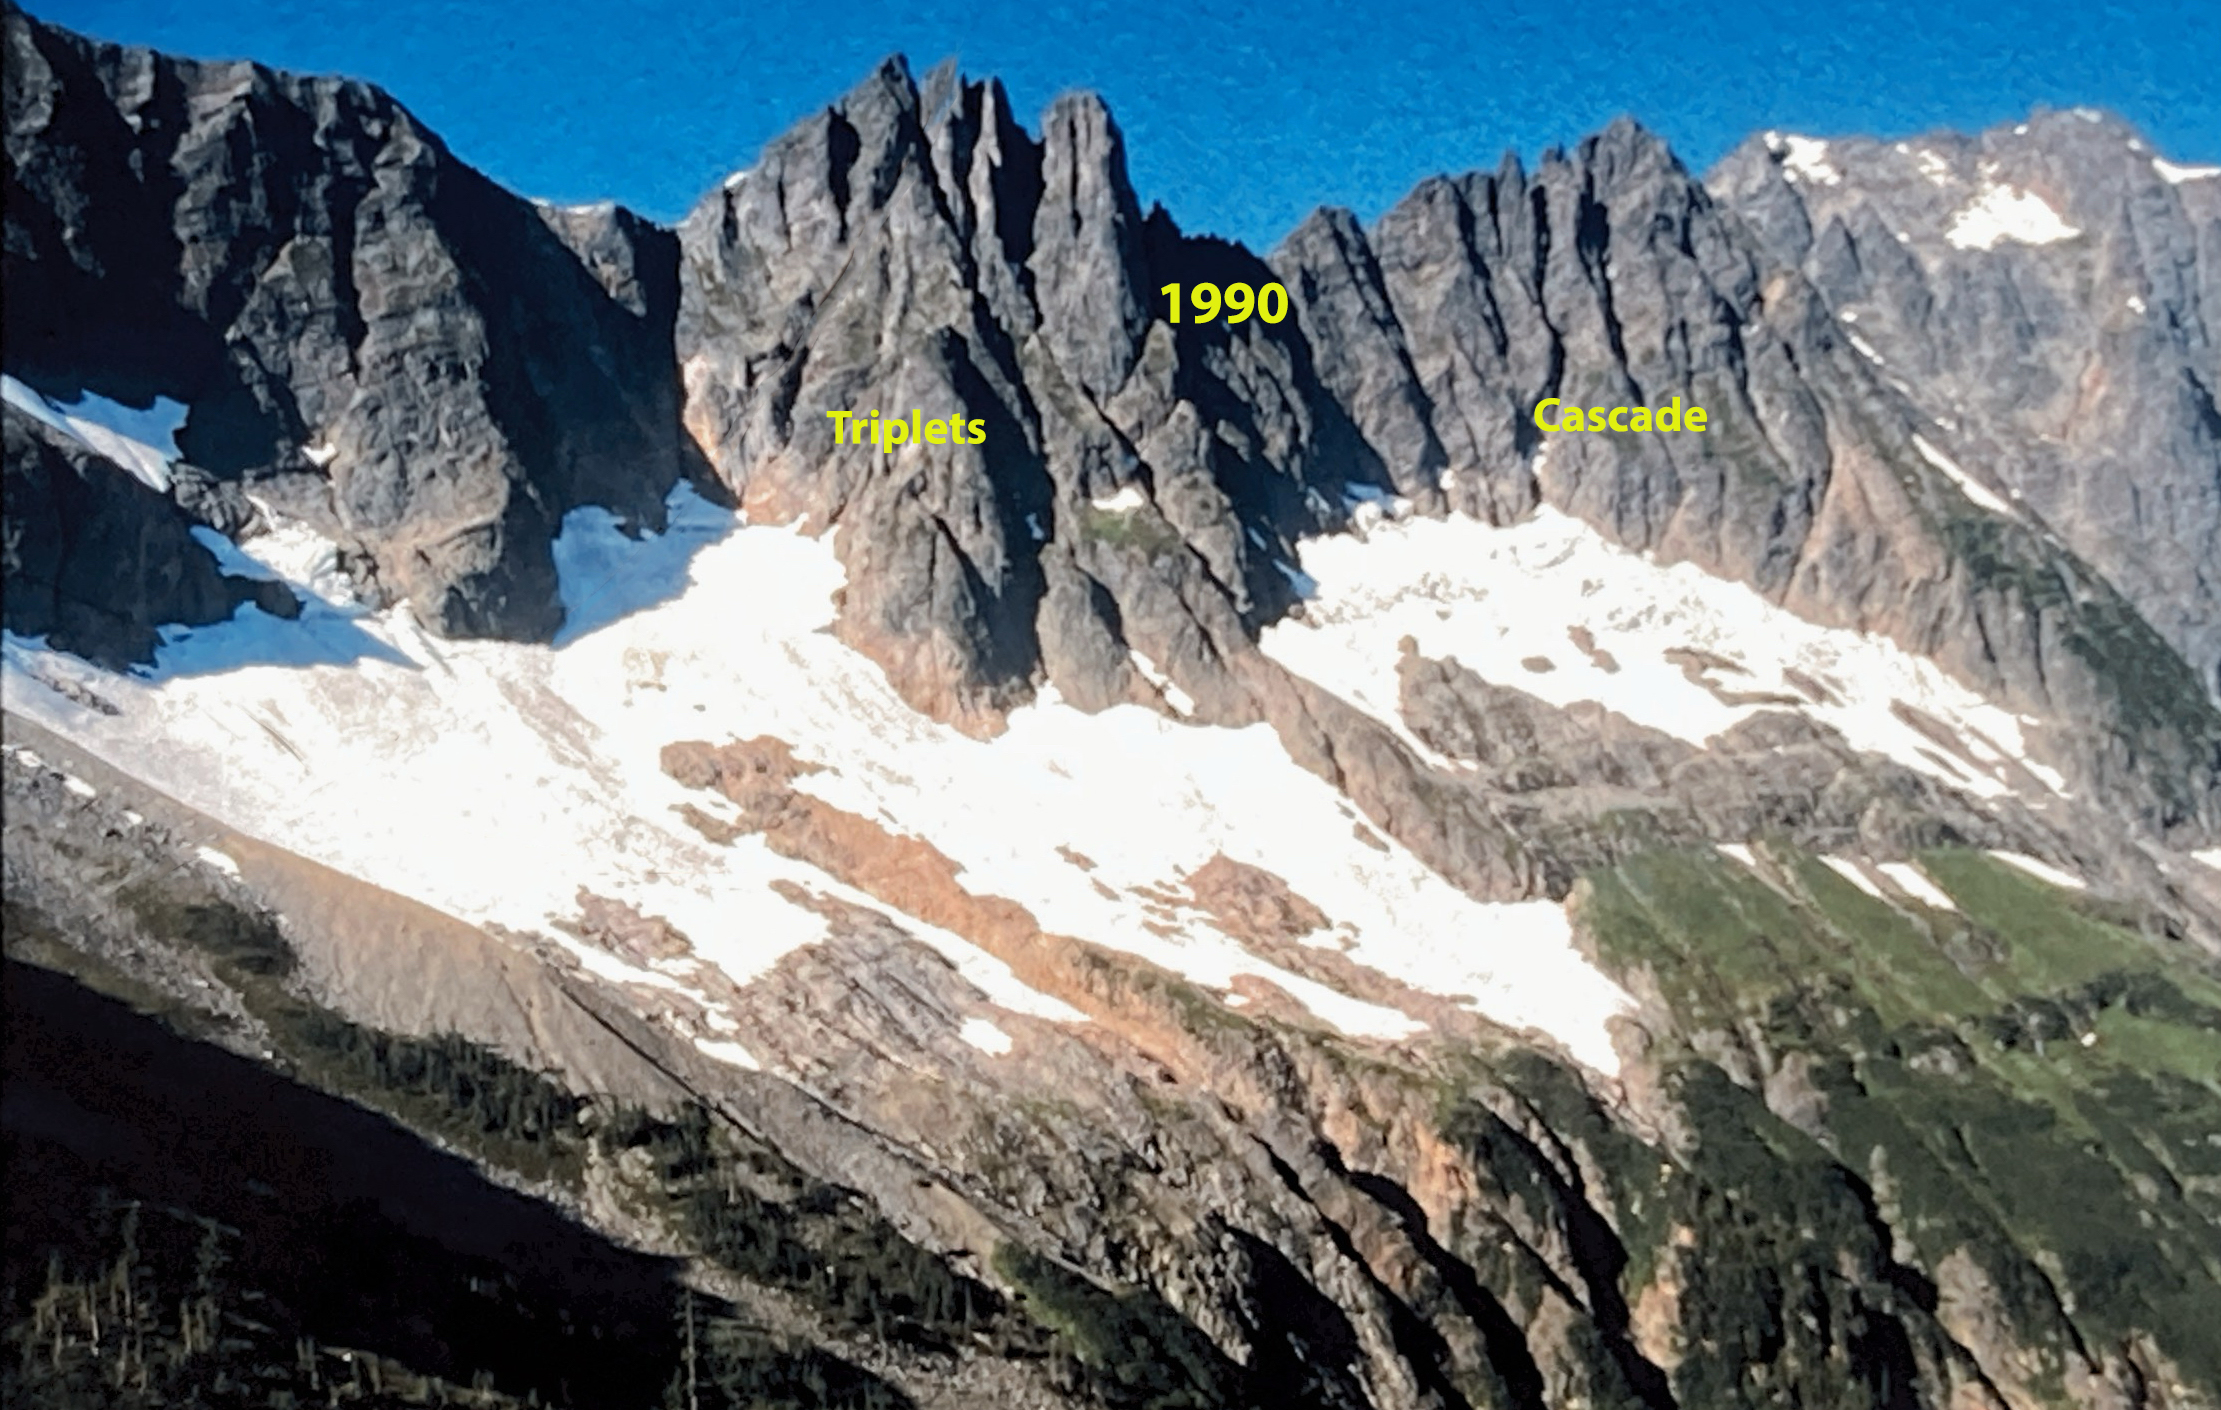 The Triplets and Cascade Peak glacier with significant retained snowcover in 1990 image I took from near Cascade Pass.