From a Glaciologists Perspective AGU Day 1

The theme changes from a glaciers to a glaciologists perspective with a focus on selected work at the AGU 2017. The research discussed here is from the Poster Paper sessions the most interactive part of the convention.  The following are some interesting snapshots of the breadth and depth of ongoing research.  The most compelling figure from each poster is used.

Richard Forster, U of Utah team presented work on the firn aquifer in Greenland.  A feature we did not even know existed until 2011. They have conducted four field seasons,  using ground penetrating radar  and magnetic resonance soundings to map water table elevation, thickness and volume in several areas.  They found the aquifer thickness has a typical thickness of 10-30 m.  Further they found that firn aquifers have existed since at least 1993 and have expanded and shifted with time see above image.

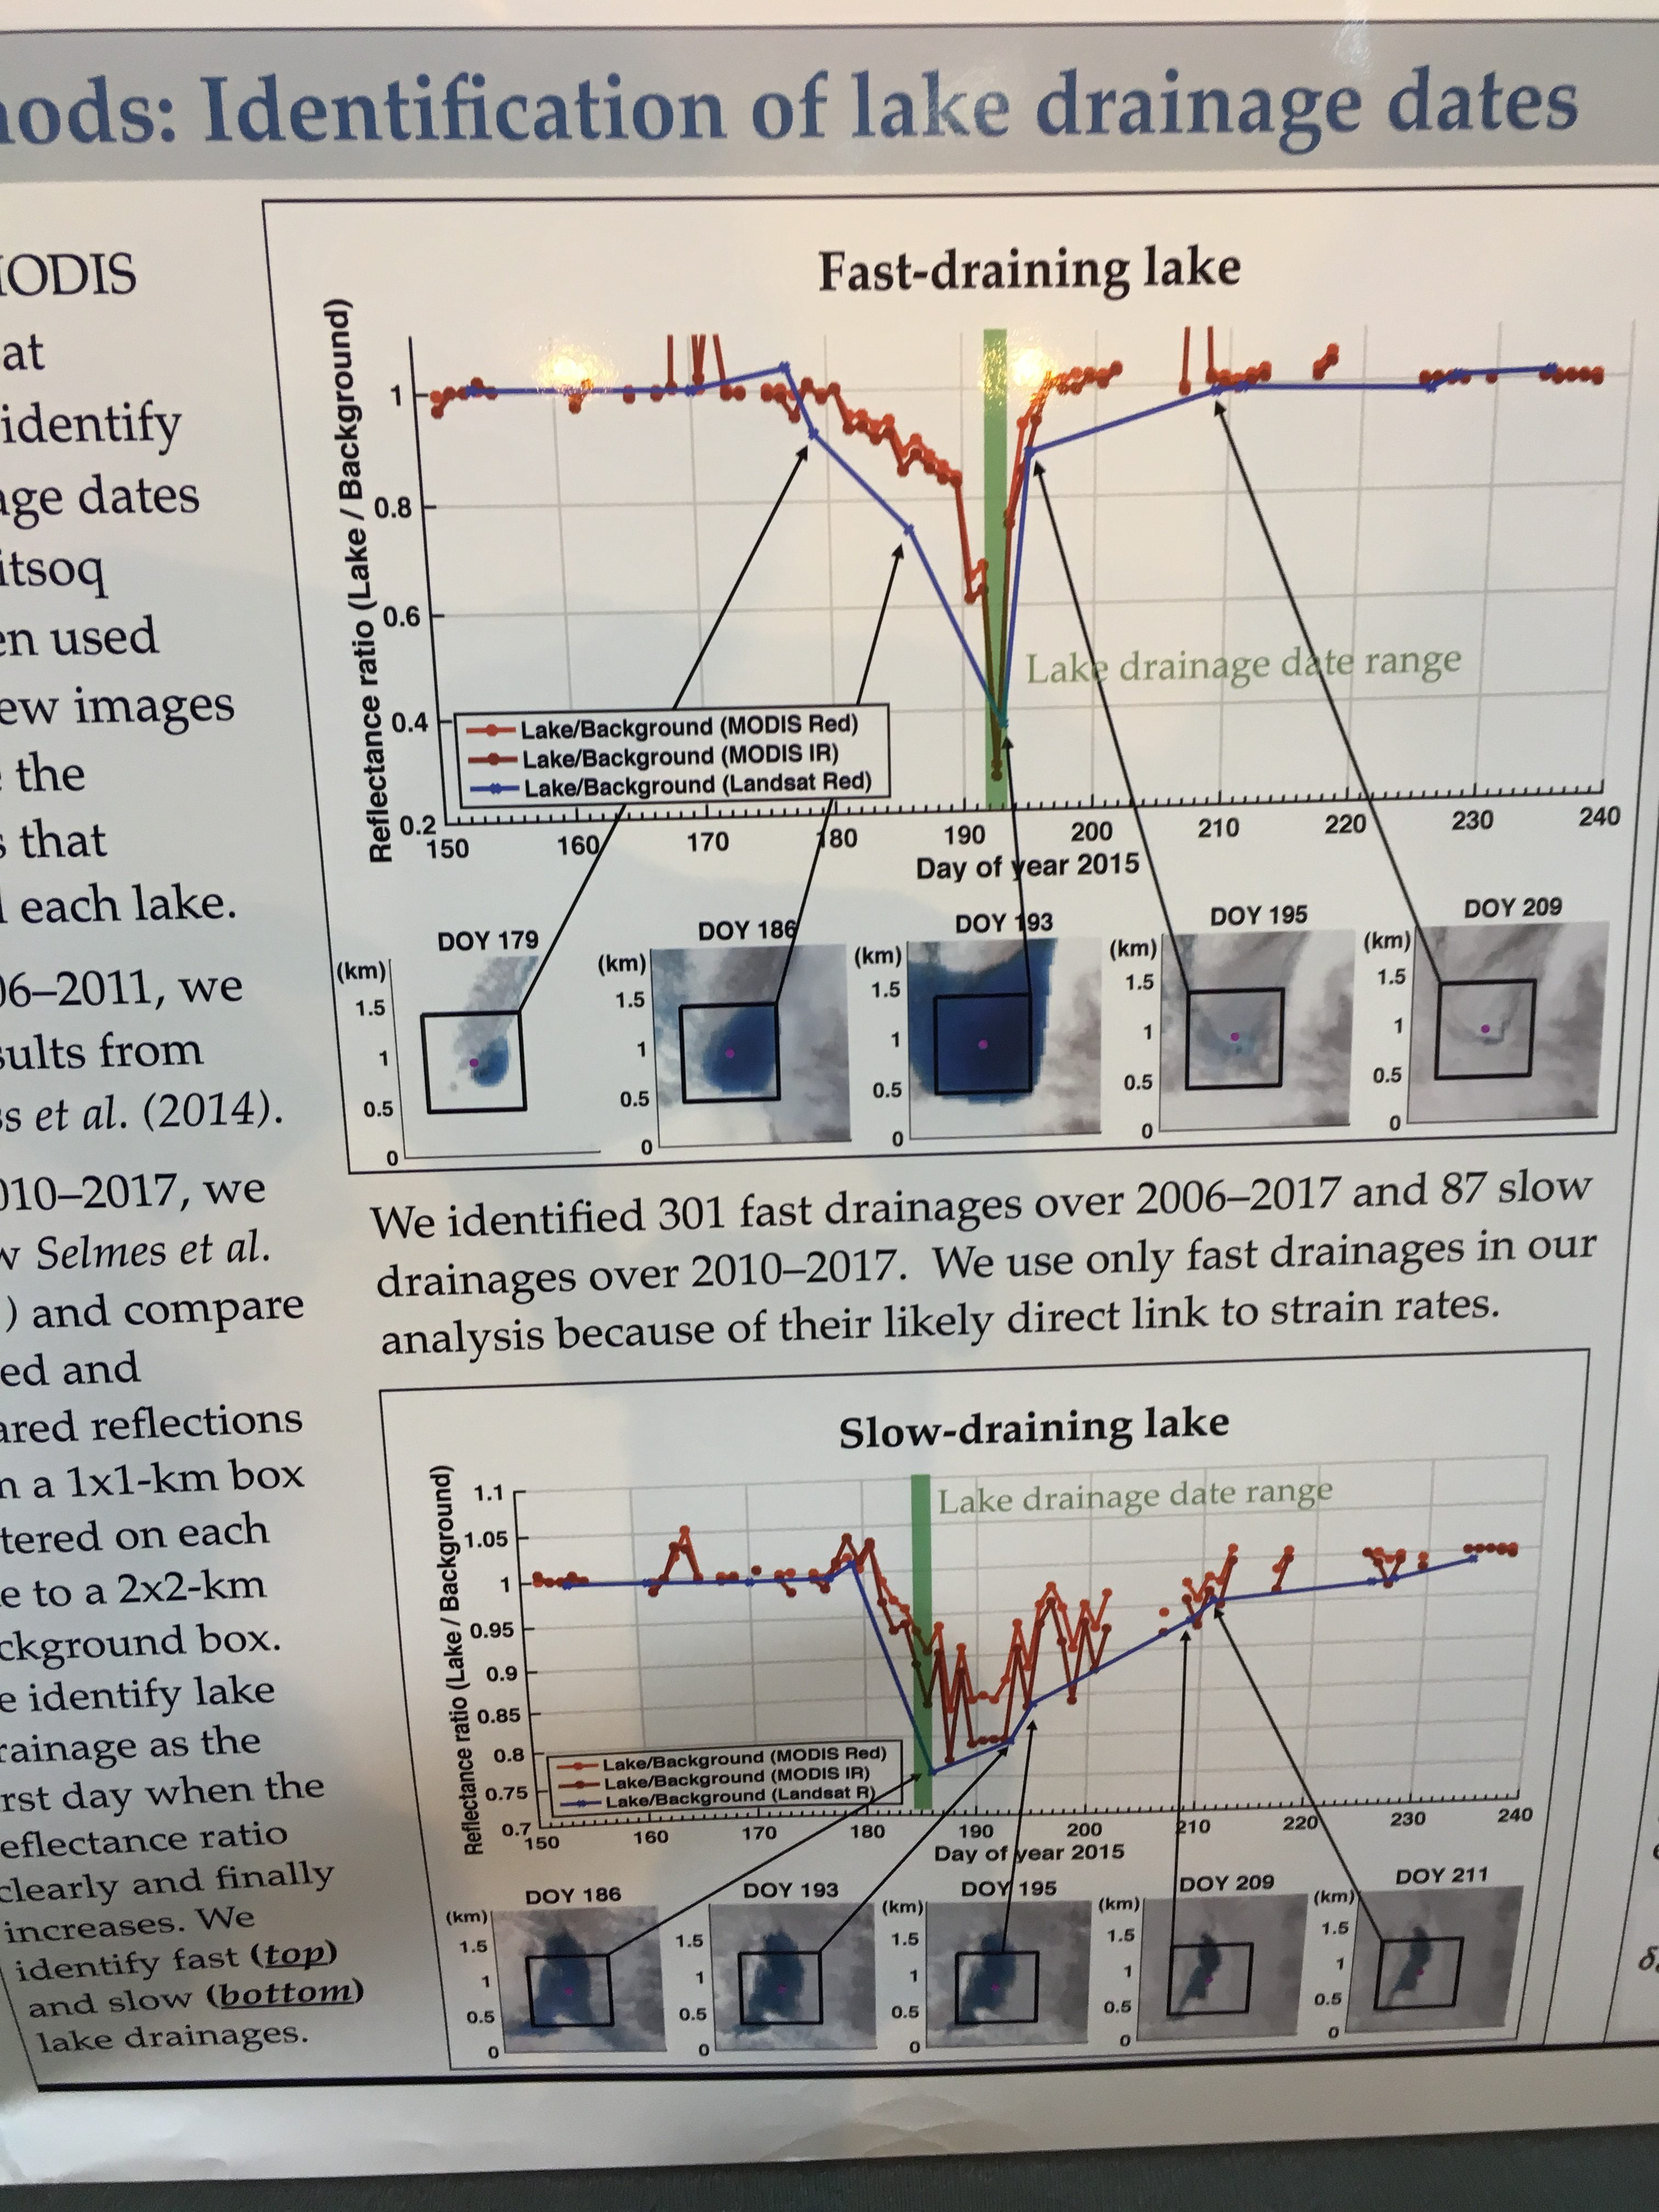
Kristin Poinar, NASA GSFC team examined the drainage of supraglacial lakes in Greenland. They investigated factors that control when and where the lakes drain to the ice sheet base. They observed  359 lake drainage events in a west Greenland region and compare the dates of these drainage events to strain rates calculated from satellite data. They noted both slow draining and fast draining lakes, the faster drainages occurring later in the summer on average. They found that strain rates did not satisfactorily predict lake drainage date.  

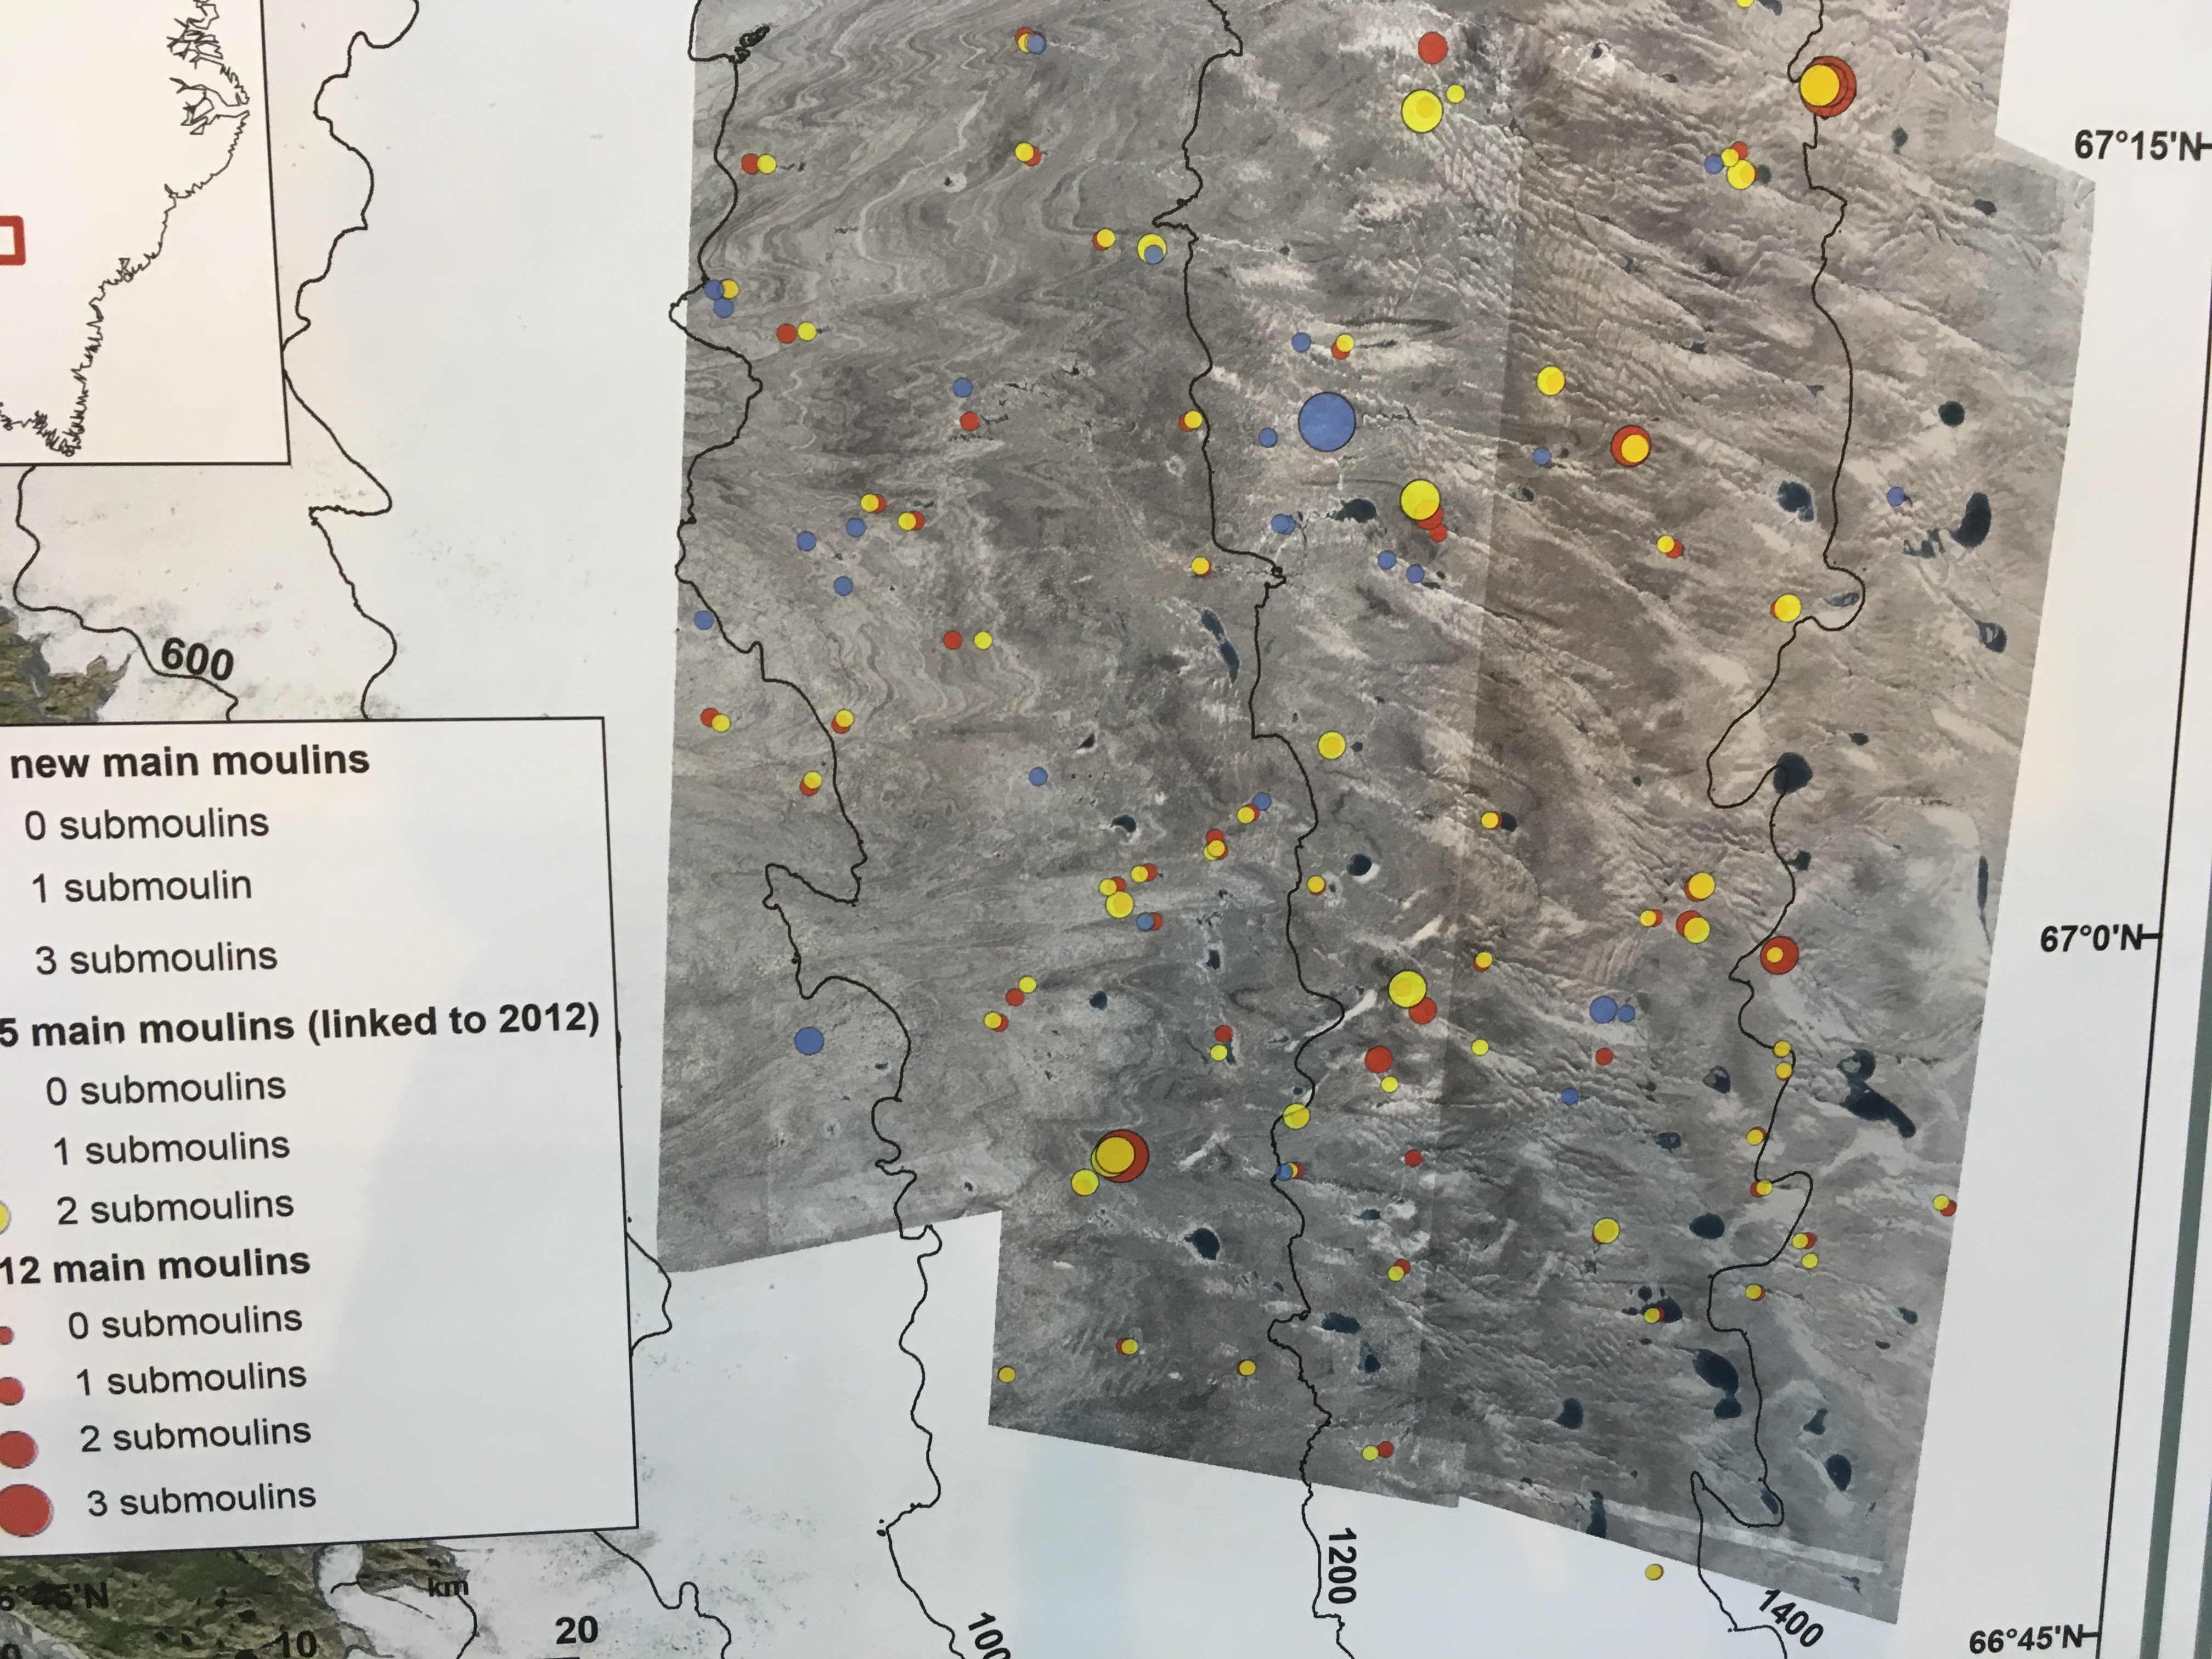
Vena Chu at UC-Santa Barbara’s team mapped river networks On Russell Glacier that terminate into moulins which connect surface melt to englacial and subglacial drainage networks. They used WorldView imagery to show development of molins and their migration between 2012 and 2015.   The majority of moulins they mapped in 2015 were  moulins in 2012. New moulins most commonly formed in crevassed, thinner ice areas near the ice margin, and a lesser but significant quantity at higher elevations above 1300 m.

Rohi Muthyala, Rutgers University team measured the discharge of supraglacial streams for three months, constructing rating curves.  They compared air temperature and discharge in the upper and lower basin.  The upper basin was more related to the daily air temperature. The stream system feeds into a moulin system.

Mariah Radue, University of Maine’s team mapped and dated the moraines and erratics adjacent to Potanin Glacier in the Mongolian Altai (49°N, 88°E). They used 10Be surface-exposure chronology to date glacial landforms mapped using satellite and Drone imagery. Based on our glacial reconstruction, we estimate changes in atmospheric temperature from the Last Glacial Maximum to the Late Holocene using snowline reconstruction techniques. Mongolia is a unique location because it is isolated from oceanic influences and a climate could provide insight into the roles of local radiation forcing from earth orbital changes, greenhouse gases, and a Asian climate dynamics.

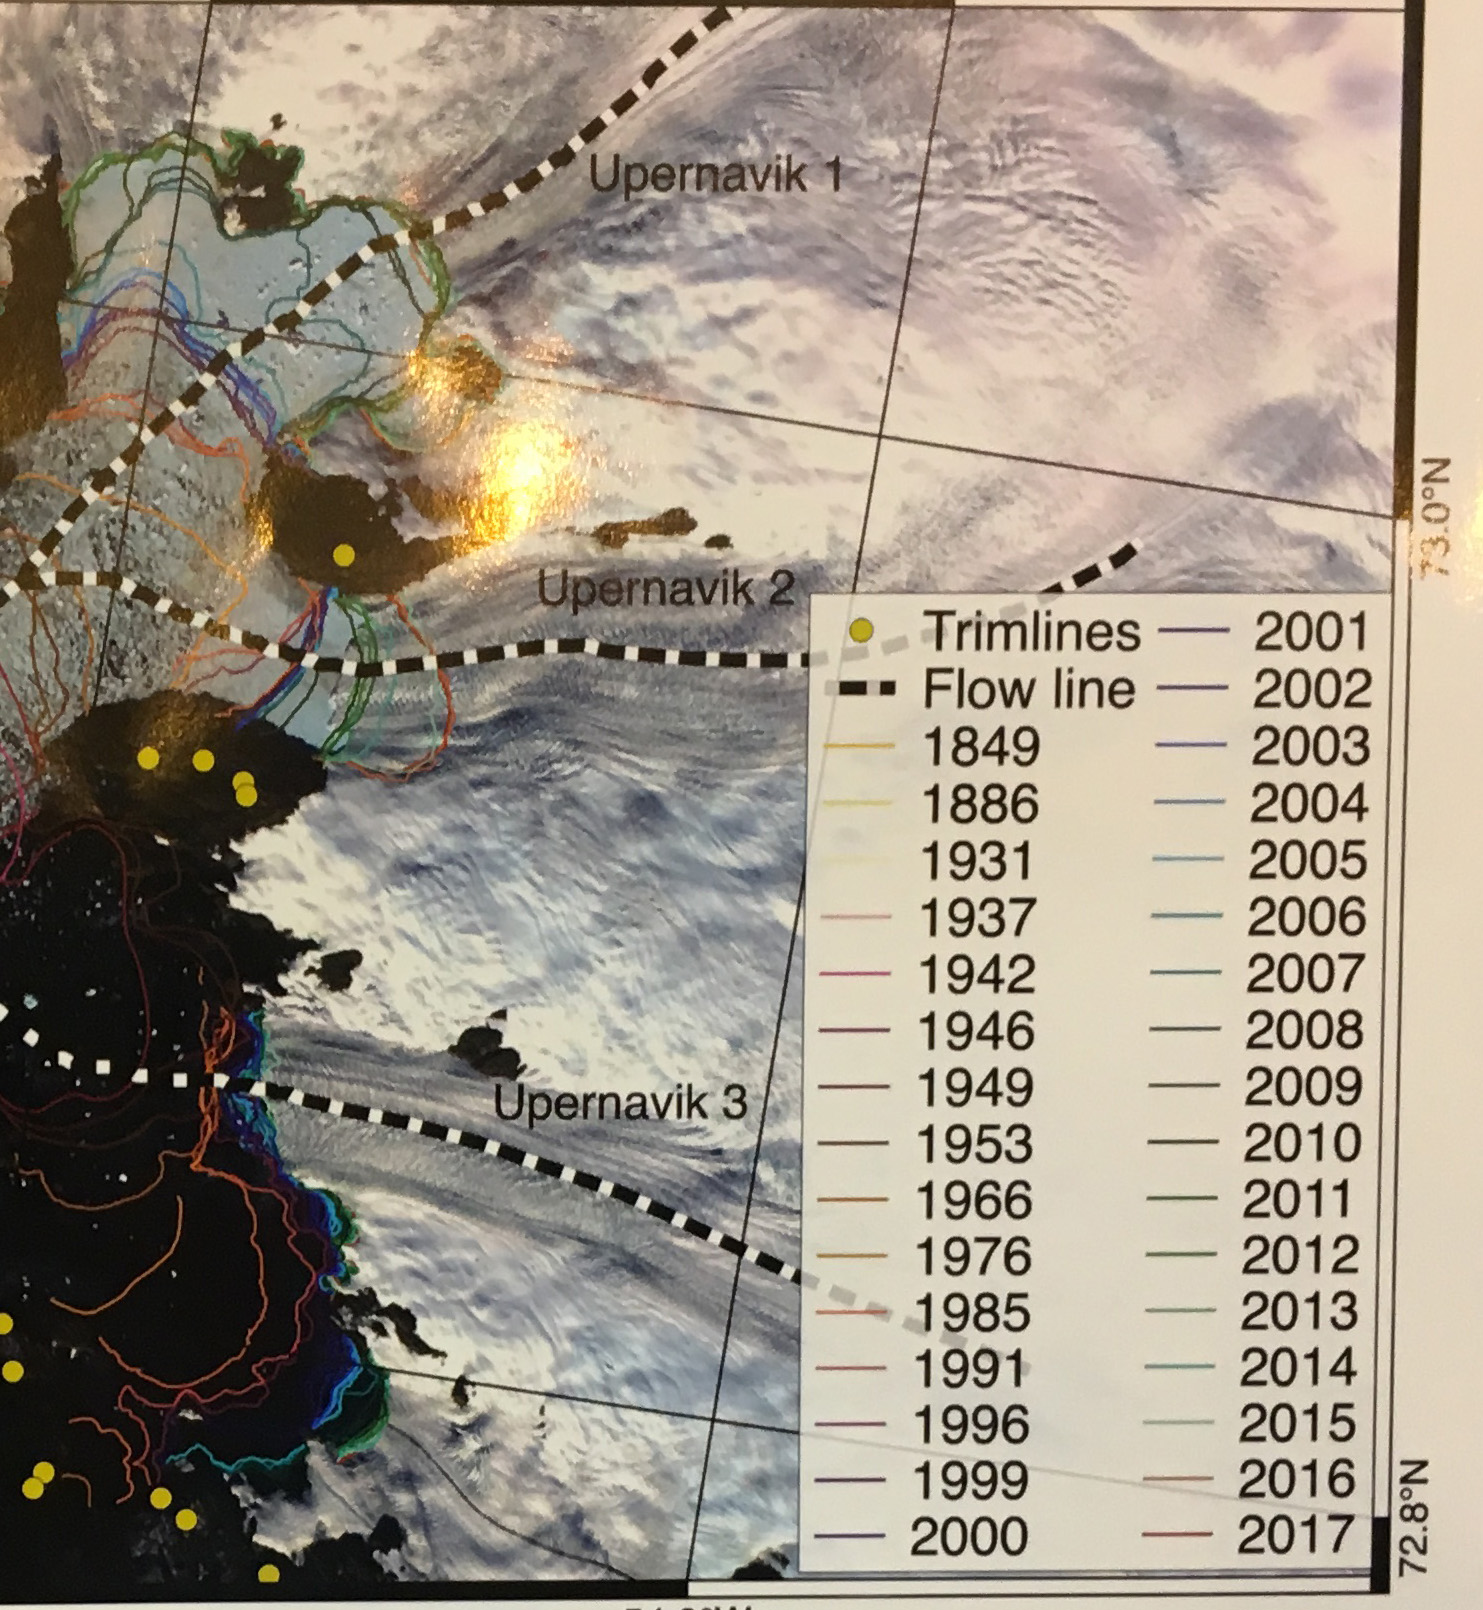
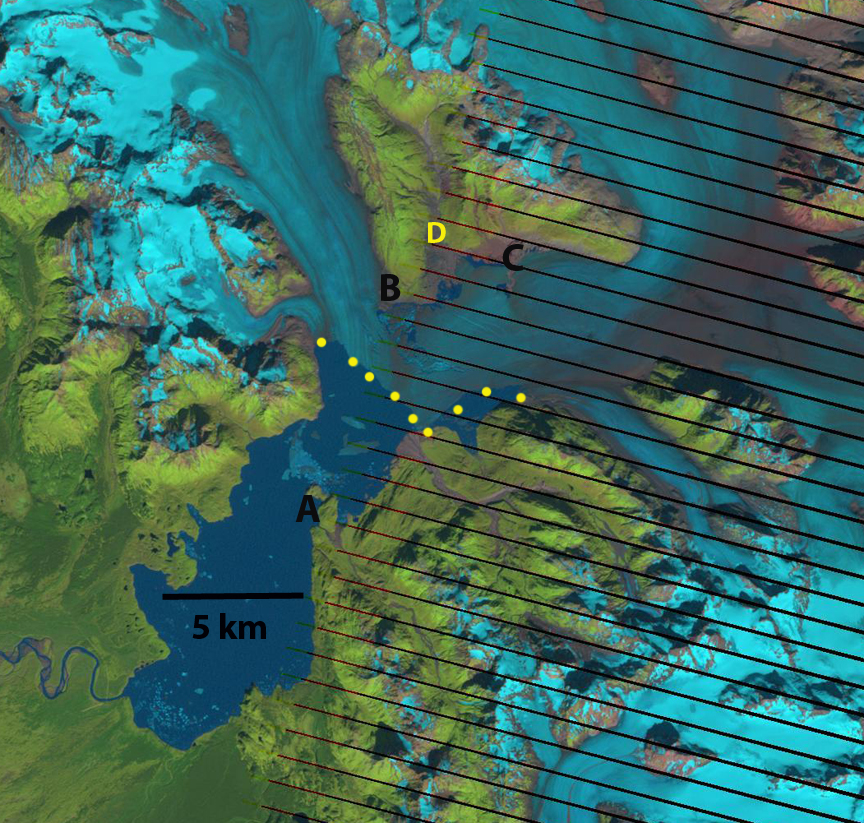
Konstanz Haubner, with a team from GEUS in Denmark provided a model simulating velocity and ice thickness change at Upernavik Glacier, Greenland from 1849-2017. In the image above the retreat is illustrated, separating into three separate glaciers with a more bedrock pinning points to stabilize.  They noted  a changing contribution to Upernavik’s ice mass loss from surface melt and ice dynamics in different time periods.


Recent Climate Change Impacts on Mountain Glaciers – Volume

fig10-1

Landsat Image of glaciers examined in the Himalaya Range: Chapter 10 that straddles a portion of Sikkim, Nepal and Tibet, China. Notice the number that end in expanding proglacial lakes. 

This January a book I authored has been published by Wiley. The goal of this volume is to tell the story, glacier by glacier, of response to climate change from 1984-2015. Of the 165 glaciers examined in 10 different alpine regions, 162 have retreated significantly. It is evident that the changes are significant, not happening at a “glacial” pace, and are profoundly affecting alpine regions. There is a consistent result that reverberates from mountain range to mountain range, which emphasizes that although regional glacier and climate feedbacks differ, global changes are driving the response. This book considers ten different glaciated regions around the individual glaciers, and offers a different tune to the same chorus of glacier volume loss in the face of climate change. There are 107 side by side Landsat image comparisons illustrating glacier response.  Several examples are below: in each image red arrows indicate terminus positions from the 1985-1990 period and yellow arrows terminus positions for the 2013-2015 period, and purple arrows upglacier thinning.

[ngg_images source=”galleries” container_ids=”17″ display_type=”photocrati-nextgen_basic_imagebrowser” ajax_pagination=”1″ template=”/nas/wp/www/sites/blogsorg/wp-content/plugins/nextgen-gallery/products/photocrati_nextgen/modules/ngglegacy/view/imagebrowser-caption.php” order_by=”sortorder” order_direction=”ASC” returns=”included” maximum_entity_count=”500″]

There are chapters on: Alaska, Patagonia, Svalbard, South Georgia, New Zealand, Alps, British Columbia, Washington, Himalaya, and Novaya Zemlya. If you are a frequent reader of this blog you will recognize many of the locations. This updates each glacier to the same time frame. The book features 100 side by side Landsat image pairs illustrated using the same methods to illustrate change of each glacier. The combined efforts of the USGS and NASA in obtaining and making available these images is critical to examining glacier response to climate change. The World Glacier Monitoring Service inventory of field observations of terminus and mass balance on alpine glaciers is the another vital resource.  The key indicators that glaciers have been and are being significantly impacted by climate change are the global mass balance losses for 35 consecutive years documented by the WGMS.  The unprecendented global retreat that is increasing even after significant retreat has occurred in the last few decades (Zemp et al, 2015).  Last, the decline in area covered by glaciers in every alpine region of the world that is documented by mapping inventories such as the Randolph Glacier inventory and GLIMS ( Kargel et al 2014)

fig6-2

Landsat Image of glaciers examined in the Svalbard: Hornsund Fjord Region: Chapter 6.

fig5-1

Landsat Image of glaciers examined in the South Georgia Island: Chapter 5.

fig8-9

Landsat Image of Mount Baker glaciers examined in the North Cascades, Washington:  Chapter 8.

fig11-1

Landsat Image of glaciers examined in the Southern Alps of New Zealand S: Chapter 11.


Sittakanay Glacier Retreat, British Columbia

Sittankanay Glacier drains the north side of the small icefield that feeds the retreating Wright, Speel and West Speel Glacier. The 10 km long glacier is the headwaters of the Sittkanay River, a tributary to the Taku River. Here we utilize Landsat images from 1984-2013 to identify the recent changes in the glacier. The glacier begins at 2000 m and ends in a lake at 250 m, the terminus has heavy debris cover, which is unusual for this area. The Canadian Topographic map indicates a lake that is 400 m long.
sittikanay map
Canada Topographic map

sittakany westge
Google Earth Image

In 1984 the terminus of the glacier, red arrow is at the base of a steep gulch, yellow arrow marks the 2013 terminus. The lake has expanded to 600 m in length. The purple dots indicate the snowline is at 1500 m, which leaves limited snowpack for sustaining the glacier. In 1996 and 1999 the snowline was also at 1500 m, indicating negative mass balances that underlie the retreat. By 2013 the glacier the lake had expanded to 1700 m in length. The glacier has retreated 1100 m since 1984. The snowline is at 1400 m in the mid-August image, and will rise above 1500 m by the end of the melt season. A close up view of the terminus indicates the heavy debris cover has large uncrevassed sections that appear nearly stagnant, pink arrows. There is one feature in the 2006 Google Earth image that is 1.0 km from the terminus, a circular depression-red arrow, with concentric crevasses that indicates a subglacial lake that partially buoys the glacier. This also indicates that rapid retreat will continue. The retreat is enhanced by calving, but it is the insufficient size of the accumulation zone that is driving the retreat of this glacier and its neighbors.

sittakanay 1984
1984 Landsat image

sittakanay 1996
1996 Landsat image

sittakanay 1999
1999 Landsat image

sittakanay 2013
2013 Landsat image

sittakanay terminus
Google Earth image

Boulder Glacier Retreat, Mount Baker

Boulder Glacier flows down the west side of Mount Baker a strato volcano in the North Cascades of Washington. This steep glacier responds quickly to climate change and after retreating more than 2 kilometers from its Little Ice Age Maximum, it began to advance in the 1950’s as observed by William Long. The glacier advance had ceased by 1979. From 1988-2008 we (NCGCP) have visited this glacier at least every five years recording its changes. In 1988 the glacier had retreated only 25 meters from its furthest advance of the 1950-1979 period. By 1993 the glacier had retreated 100 m from this position. At this time the lower 500 meters of the glacier was clearly stagnant. By 2003 the glacier had retreated an additional 300 m. In 2008 the glacier had retreated 490 meters from its 1980 advance position, a rate of 16 meters per year. The glacier as seen in 2008 despite the steep slope has few crevasses in the debris covered lower 400 meters of the glacier. This indicates this section of the glacier is stagnant and will continue to melt away. The transition to active ice in at the base of the icefall on the right-north side of the glacier. Below is the glacier in 1993 note the darkened cliff at adjacent to and right of the terminus. The picture below that is from 1998 again note cliff, than in 2003 from the same location as the 1993. Than an image from 2008 of the terminus from further upvalley, as it is not clearly in view from the previous location. And a picture from Asahel Curtis taken in 1908. This glacier after 25 years of retreat is still not approaching equilibrium and will continue to retreat. This is a reflection of continued negative mass balance as measured on the adjacent Easton Glacier. It does respond fast to climate change, and the climate has not been good for this glacier. The glacier does have a consistent accumulation zone and can survive current climate.Picture from August, 1993 of the terminus of Boulder Glacier Picture from August 1998 of the terminus of Boulder GlacierPicture from August 2003 of the terminus of Boulder Glacier.Boulder Glacier in August 2008. Boulder Glacier in 1908 viewed across the glacier at the present terminus location during a Mountaineers trip taken by Asahel Curtis. A satellite image from 2009 (green=2009, brown=2006, purple=1993 yellow=1984), shows additional retreat now at 515 meters from 1984 to 2009, 20 meters per year. An examination of the same view of the terminus in 1993 and 2009 indicates the extent of the retreat and the reduction in crevassing below the icefall. (boulder terminus change

For 30 years the North Cascade Glacier Climate Project has focused on observing the response of glaciers to climate change.

Yakutat Glacier Rapid Retreat, Alaska

The Yakutat Glacier during the 1894-1895 Alaskan Boundary Survey ended near a terminal moraine on a flat coastal outwash plain. By 1906 the glacier had retreated from the moraine and a new lake was forming. Harlequin Lake. Surveys of the terminus of the glacier indicated a retreat of 1 kilometer in that decade. From 1906-1948 the glacier retreated an additional 5 km. From 1948-1958 the glacier retreated 3.6 km. The retreat is evident in comparing the Yakutat B-3 quadrangle, from 1958 photography, and Landsat imagery from 1984, 2010 and 2013. Points A-D are the same in each image and the yellow dots are the terminus. In 1984 the terminus was just retreating from a peninsula marked A, the valley at D was filled with ice, there was no break in the surface at C and B was well inland of the terminus. By 2010 the glacier had retreated from A, the valley at D was deglaciated, a small strip of bedrock-sediment was exposed at C from what had been beneath the glacier, and B was still well inland of the terminus. By 2013 the northern arm of the glacier had retreated 6.4 km from the peninsula at A toward the peninsula at B. The central arm of the glacier toward C had retreated 7.5 km and the retreat on the southern edge of the glacier was 6.5 km. The glacier had retreated on average more than 6.6 km in 30 years, a rate of 220 m/year. The retreat was most rapid from 2010-2013, when the glacier retreated 3 km.yakutat map
Yakutat terminus map

yakutat 1987
1987 Landsat image

yakutat 20102010 Landsat image

yakutat 2013
2013 Landsat image.

Today the glacier is the focus of a study by the University of Alaska, led my Roman Motyka, Martin Truffer and Chris Larsen
They have set up a time lapse camera to record frontal changes. The goal is to understand the controls on calving into Harlequin Lake of this glacier. More amazing than the retreat has been the observed thinning of the glacier. The glacier has thinned by more 200 m on average according to the preliminary thickness change maps from the UAF project (Truessel et al 2013). The Yakutat Glacier does not have a high accumulation zone and the recent increase in the snowline elevation and thinning of the glacier have led to a substantial shrinking of the accumulation zone and thinning of the glacier in the accumulation (Truessel et al 2013). This glacier does not have a persistent significant accumulation zone and cannot survive (Pelto, 2010). For a calving glacier to be in equilibrium it needs to have at least 60 % of its area snowcovered at the end of the summer. The glacier is in the midst of a large ongoing retreat. The retreat rate and calving mechanism is similar to that of Grand Plateau Glacier, Bear Lake Glacier and Gilkey Glacier. However, unlike these Yakutat Glacier lacks an accumulation zone, a better analog is East Novatak Glacier, which also has a lower elevation accumulation zone.

Zemu Glacier, Sikkim Thinning and Retreat

Zemu Glacier is a 26 km long glacier draining the east side of Kanchenjunga the world’s third highest mountain. The importance of the glacier is that it is a key water source for the Teetsa River. The glacier acts as a natural reservoir releasing water due to melting. The Teetsa River is the focus of a hydropower development project being undertaken by the Government of Sikkim. To date 510 mw of the proposed 3500 mw potential are operating. This is a run of the river project, with the water extracted from the river without a dam, run along the valley wall and dropped back to the river through a series of turbines. Run of river is much less expensive than a dam in this remote, earthquake prone, mountainous valley. Zemu Glacier has received little attention, and hence we will have to rely on Digital Globe imagery to observe its changes. The glacier has been observed to retreat at 27 m per year from 1967-1984. Given the length of the glacier the retreat was fairly slow. The glacier has a heavy debris cover on most of its length, insulating it from ablation, and leading to know detectable retreat of the main terminus from 2000 to 2013 Basnett et al (2013). A view of the lower glacier indicates this heavy debris cover, with some scattered small glacial lakes on its surface.
lower zemu glacier

The newly devegetated zone beyond retreating glaciers is small, indicating the slow retreat. Thinning has been significant. The lateral moraine ridges on either side of the main glacier average 150 feet above the main glacier surface. These were built during the Little Ice Age advance. Lateral moraines do not reach above the glacier surface that built them. Thus, the lower glacier has thinned by approximately 150 feet in the last century or so.
A view of a portion of the upper glacier indicates one issue for the glacier. upper zemu glacierzemu start 
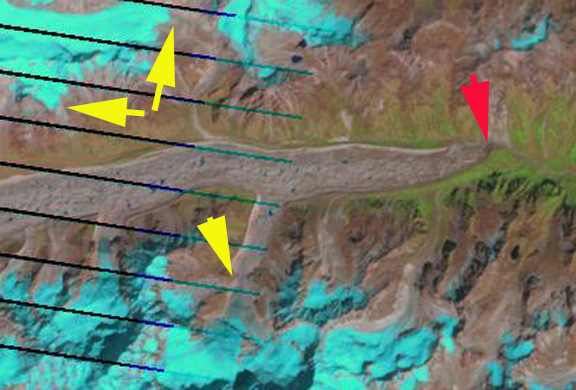
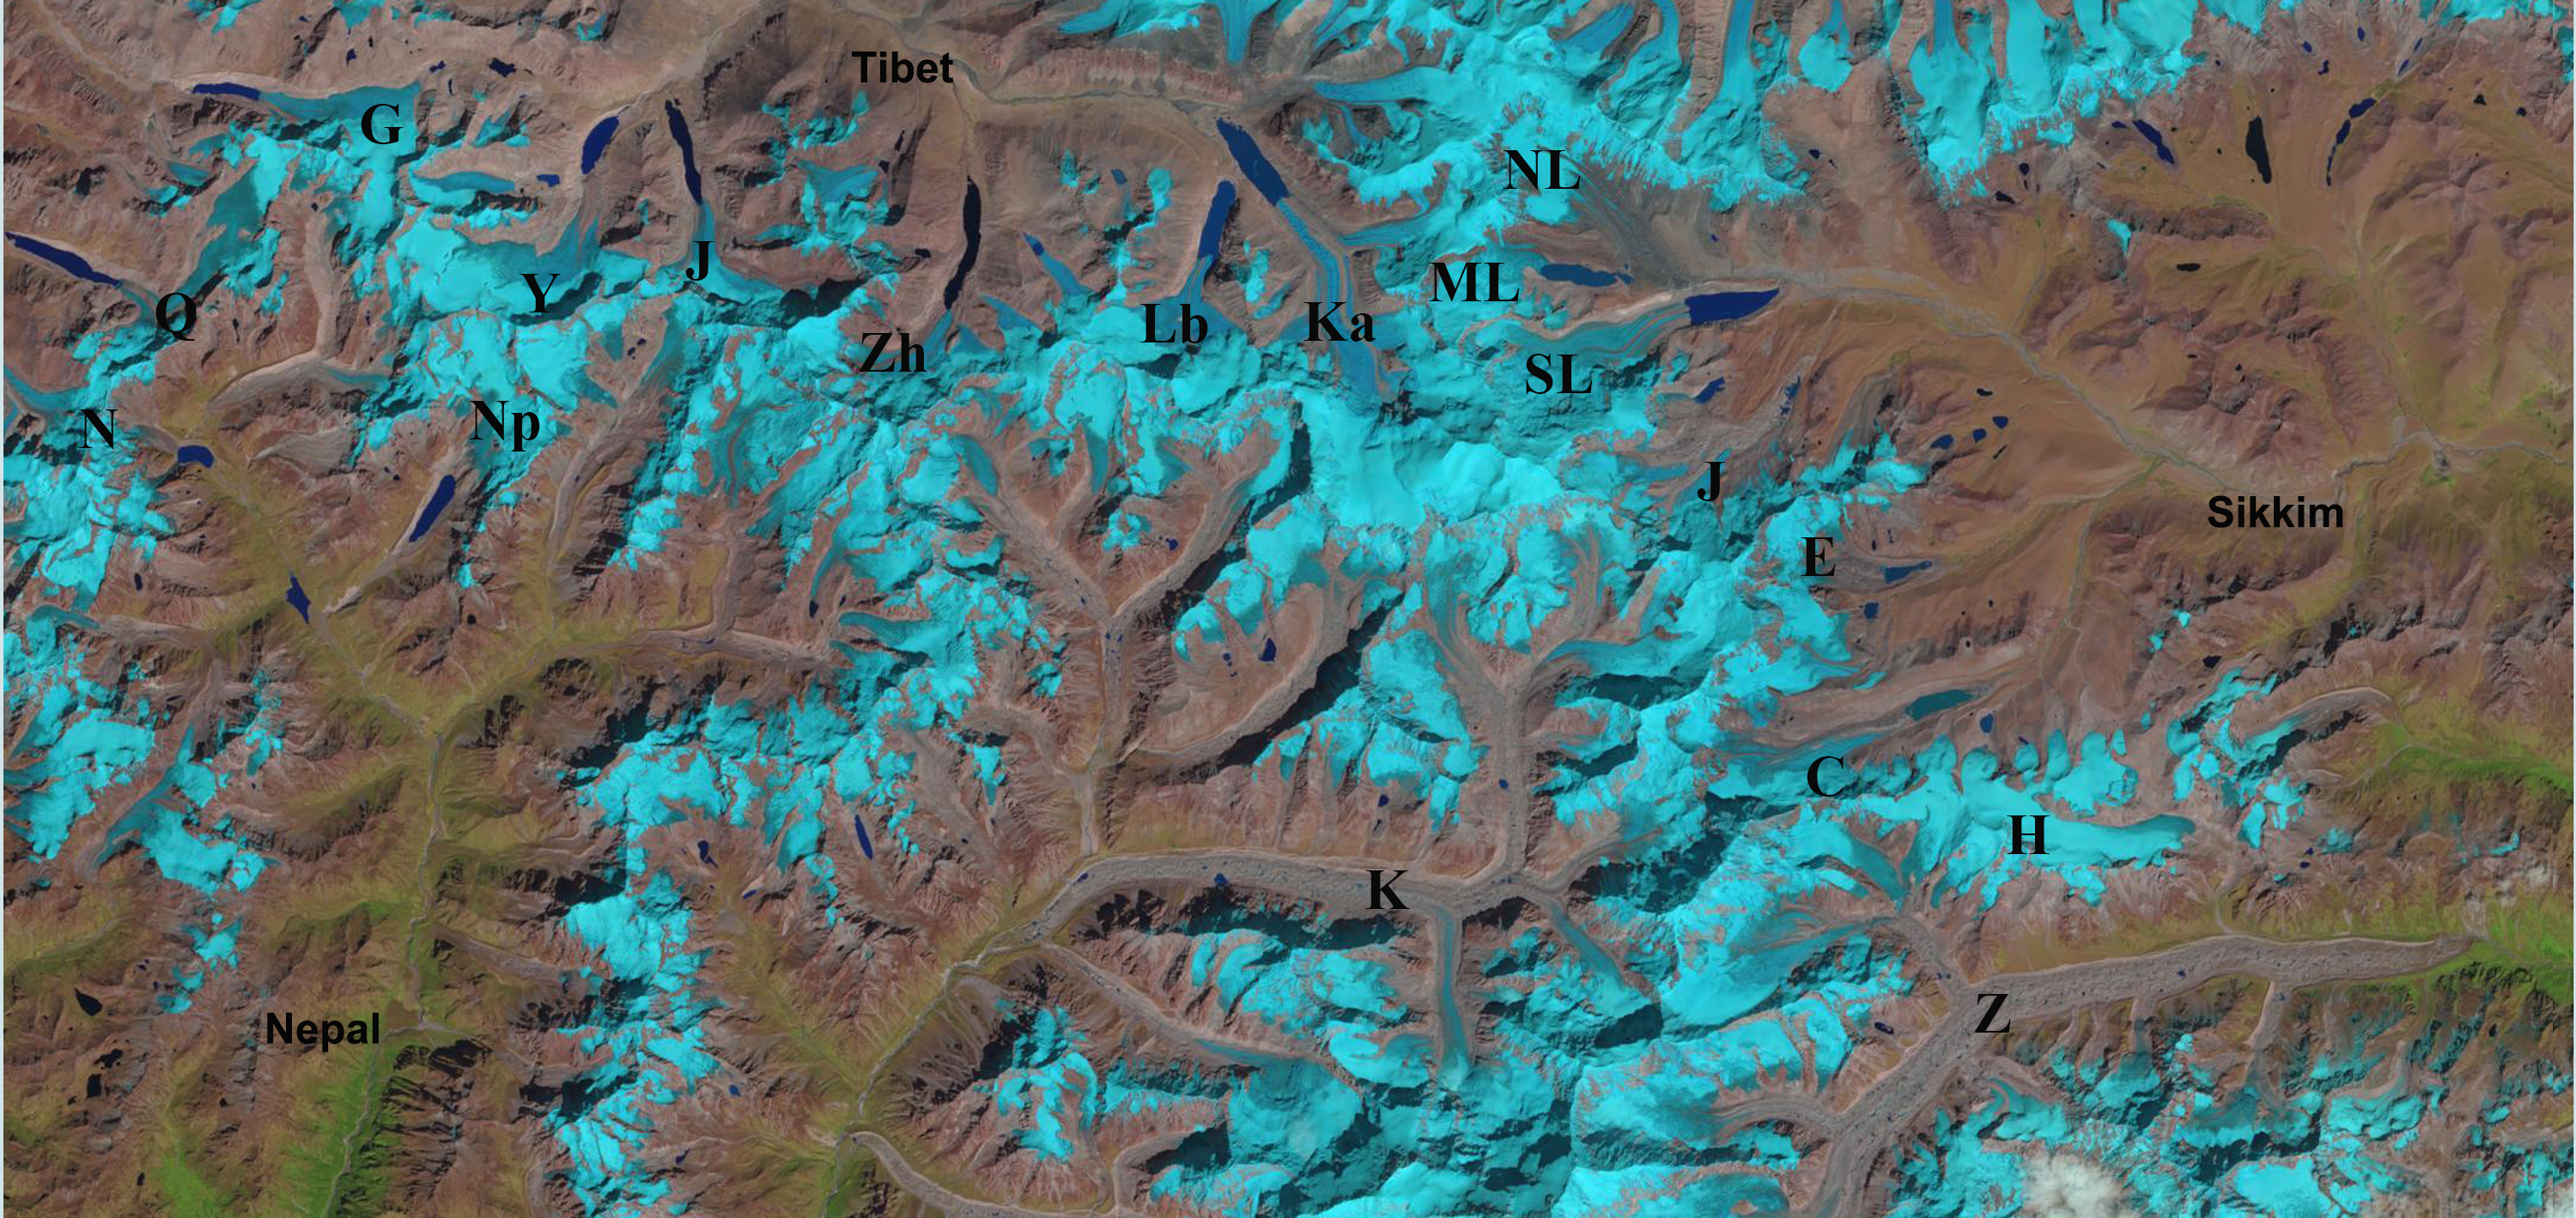
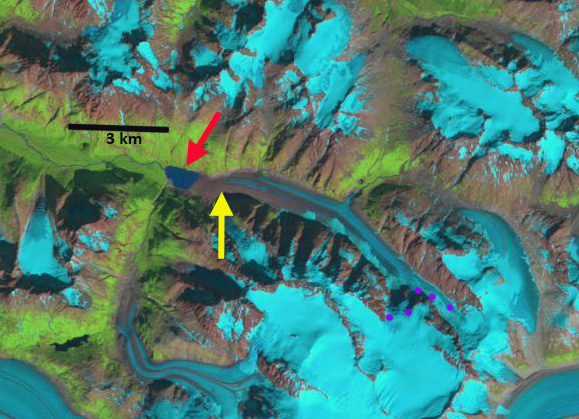
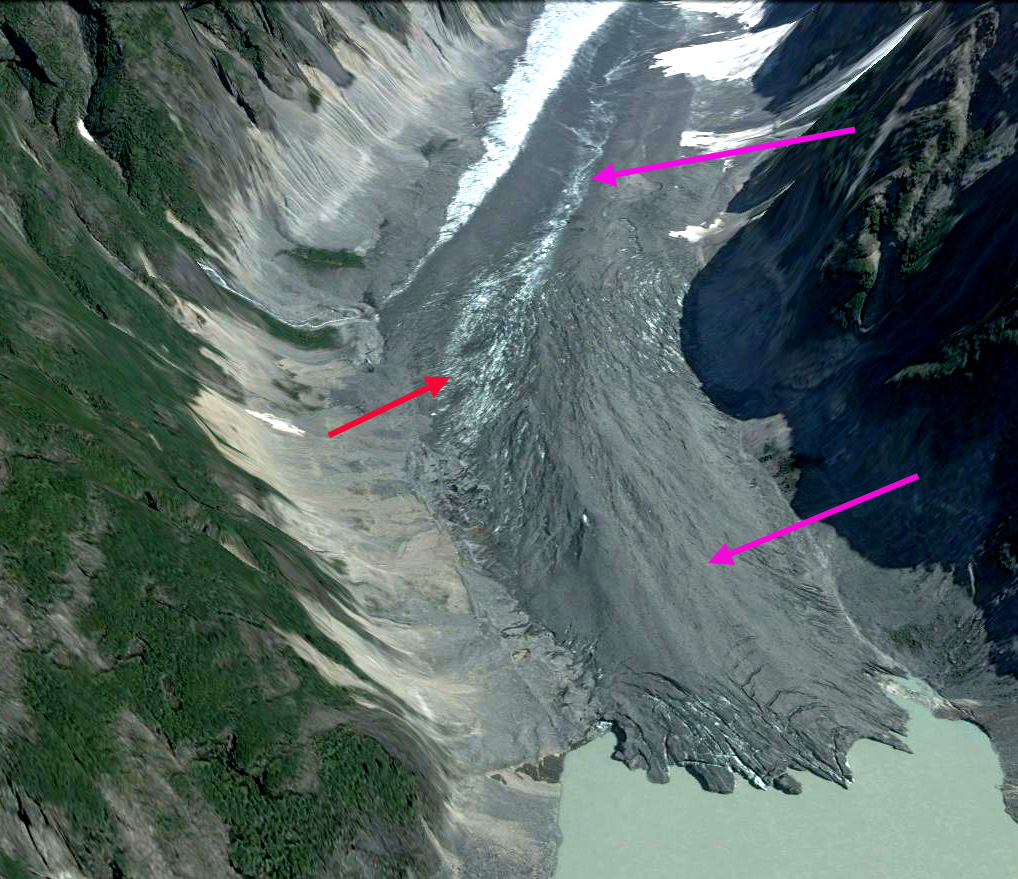
Several of the tributaries no longer join the Zemu, depriving it of a portion of a portion of its former accumulation sources. Near the head of the glacier the walls of Kanchenjunga delivers the debris and large amounts of snow in the form of avalanches to the glacier basin at 5900 to 5200 m. The lower 18 km of the glacier is in the ablation zone where melt dominates. A comparison of 2000 and 2013 Landsat images indicates the lack of change in location of main terminus, red arrows, but recession of surrounding glaciers in the Zemu Basin, yellow arrows.
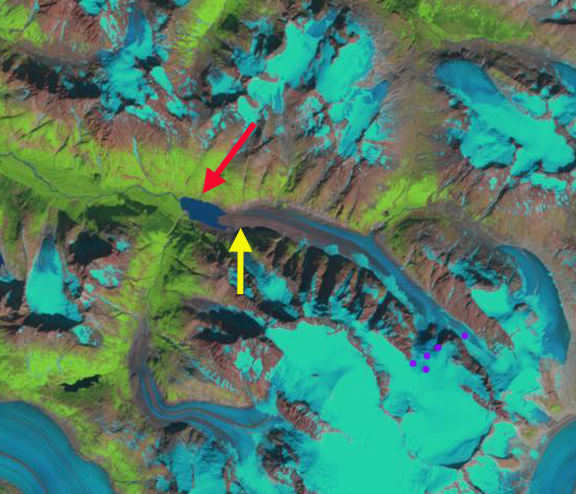
zemu 2000
Landsat 2000

zemu 2013
Landsat 2013

This area from 5200 m to the 4200 m terminus would quickly melt away without the natural debris cover. The glacier receives considerable snow input from up to 8000 m via avalanches, which are deposited in this region between 5200 m and 5900 m. This glacier will continue to be a large water source for the Teetsa River for the foreseeable future. The glacier has not been retreating as fast or developing a proglacial lake as has happened to Southh Lhonak Glacier, Middle Lhonak Glacier and Changsang Glacier to the north, this should be anticipated in the near future.