Looking Inside a Glacier

Here we provide a visual look inside a glacier in the North Cascades of Washington.  Glaciers are not all the same, but the key internal ingredients in summer typically are in varied ratios: ice, meltwater, sediment and biologic material.  In this case there are torrents of water pouring through the interior of the glacier, generated at the surface the day we are filming.  We do measure the discharge and velocity of these streams.  Once they drain englacially they are much slower as there are numerous plunge pools.  There are also plenty of water filled crevasses. Some of the streams have considerable sediment in them, usually large clasts given the high velocity and low bed friction.  In this case there are also a great many ice worms clinging to the walls of a water filled crevasse, and the walls of the stream channels.  All of this water than merges by the terminus into an outlet stream.  This again we measure.  On the glacier we are measuring melt and at the end of the glacier runoff provides an independent measure of this melt as well. The water then heads downstream supplying many types of fish enroute to the ocean.

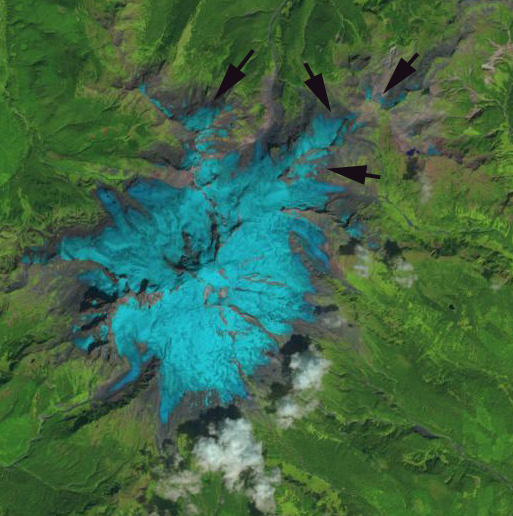
The last three years have led to considerable mass loss of glaciers in the area.  This means less snowcover at the surface, which leaves less room for the ice worms to live and forces them into the meltwater regions.  This also leads to more supraglacial stream channels, which develop and deepen.  In many cases the streams deepen to the point that they become englacial. The increased ice area also should stress glacier ice worms as they live on algae, which resides largely in snow, which is less extensive and persistent in recent summers.

Visualizing Glacier Melt Impacts

Key questions emerge from the summer of 2015 in the Pacific Northwest glacier basins. That can both be visualized and quantified.

With record temperatures and minimum flows in most rivers in the Cascade Range during July and August of 2015, a key question was how much did glaciers contribute in basins that are glaciated?  Note the water pouring off the glacier and the lack of snowcover in the first few minutes of the video.

You can examine flow per unit watershed area as a first order observation. In the unglaciated South Fork discharge was 0.5 cfs/square mile, rising to 0.7 cfs/square mile in the lightly glaciated Skykomish River and 4.3 cfs/square mile in the heavily glaciated North Fork Nooksack.   For a more direct measure we measured ablation from July 29 to August 17th in the North Fork Nooksack and Skykomish River basin.  With the Nooksack Tribe we also measured discharge below glaciers in the North Fork but those recorders are still deployed in the field.

Because the glaciers had mostly ice, not snow at the surface, melting was enhanced.  We found in the Skykomish Basin that glacier runoff was 45 CFS versus a mean discharge of 375 CFS , this is 12% of the total flow despite covering only 1.3 % of the basin.  In the North Fork Nooksack glacier runoff was 340 CFS versus total flow of  460 CFS, this is 74% of the total flow though only 6.1 % of the basin has glacier cover. In both cases the glaciers contributed a river flow percentage 12 times greater than the percent of basin area they cover.  With a substantial loss in glacier area occurring this summer, next year glacier runoff for the given climate conditions will be reduced. Given this higher flow the glacier fed streams offer less stressful conditions this summer to salmon.

How much did glacier runoff water temperature amelioration?

In the South Fork Nooksack without glaciers stream temperature was above 20 C on eight days between Aug.1 and Aug. 20. In the North Fork Nooksack with glacier contribution, the stream temperature peaked at 13-14 C.

With the early loss of snowcover and exposure of the underlying ice, how are glacier ice worms impacted?  In the video note ice worms featured in the first minute in a glacier filled crevasse.

These worms live on snow algae primarily, which would seem to be in short supply in a summer with limited snowpack on the glaciers.  How well can they survive being on the glacier ice for extended periods?  For the 21st year we conducted ice worm population surveys.  The numbers were the lowest we have seen at 175-250 ice worms per square meter, but it should be next year when the full impact would be evident.

How much glacier area will be lost?  Note the visual of terminus retreat.
The summer is not over, but our observations indicate a 5-7 % volume loss will occur.  This should be approximately equaled by area loss.  Hopefully good satellite imagery in September will provide a specific answer.  The Aug. 17th Landsat image is excellent. Retreat just this summer has been 40 m on Easton Glacier, 32 meters on Columbia Glacier, 25 meters on Sholes Glacier and 30 meters on Lower Curtis Glacier.

mount baker 9172015


Aug. 17 Landsat image.  Arrows indicate areas where we observed rapid area loss of glacier ice this summer. 

Glacier Ice Worms in Action

On glaciers in the coastal ranges of the Pacific Northwest glacier ice worms thrive. Their diet as far as we have seen from looking in their gut is algae. They cannot survive during daylight hours on the surface of the snow with even indirect solar radiation. They can survive on the surface of glacier ice if bathed in meltwater. When we leave the edge of a glacier and cross onto a snowfield that persists in many years, the number of ice worms plummets from 100-400 worms/square meter to zero within 20 m. This suggests that ice worms do not tend to roam off glaciers. There movement is relatively vertical, so they cannot migrate around a glacier to remain on a snowcovered section. Since their diet is largely algae, which can thrive in snowpack, what happens to this diet when the snowpack is lost and they have to exist on the glacier ice? If this period of existence on the ice is expanded due to earlier snow melt, is this a significant stress? This latter question is what I was pondering while observing and filming the ice worms on the surface of Sholes Glacier on August 11th, 2014. The snowpack had been lost and yet there was still at least 7 weeks left in the melt season. The snowpack had been lost in 2013 in early August as well. In 2014 monitoring the ice worm population in the same location as every year, the numbers were the lowest we had seen since 2005 also a low snowpack year following a low snowpack year. The population did rebound in 2007 and 2008 with better snowpack. The data does not answer the question, but is suggestive that repeated low snowpack occurring with significant periods left in the melts season may reduce glacier ice worm populations. You may think why does that matter, but in fact on Sholes Glacier the population of glacier ice worms based on our surveys is approximately 200 million. The process of answering this question will continue.

This is the best video of ice worm motion that I have captured.

This is an overall assessment of ice worms.

Suiattle Glacier Retreat and Outcrop Emergence, North Cascades

C.E. Rusk in 1906 hiked right to the terminus of Suiattle Glacier, which is labelled Lion’s Paw in Rusk (1924). The glacier had retreated 1400 m since its Little Ice Age maximum and based on the lack of reported brush below the glacier, this retreat had occurred primarily in the previous 30 years. By 1940 the glacier had retreated another 900 m back to within 120 m of its current position. Suiattle Glacier retreated more from its LIA maximum than any other glacier in the area, probably due to the low slope of the Suiattle Valley, from 1550-1700 m, down which the glacier had advanced. Rusk, noted the lack of any terminal moraine near the end of this glacier, this was unusual in his experience. In other words typically in this period a terminal moraine was not too distant from the current termini position. This glacier had already retreated so far that the terminal moraine was not only well down valley, but buried by aggrading sediments from the glacial stream. This retreat continued until 1967, below is a 1967 photograph of the glacier from Austin Post (USGS).
Between 1967 and 1979 Suiattle Glacier stopped retreating and began a small advance. Suiattle Glacier advanced 15-20 m during the 1970’s. Our visit in 1988 to the glacier indicated retreat had just begun, and by 1995 the glacier had retreated only 28 m from 1988 to 1995 (top image). The retreat than accelerated with another 150 m of retreat by by our 2002 survey. The terminus remained crevassed steep and convex through 1995 forcing us to the eastern margin to reach the terminus. By 2002 (second and third image) the terminus was no longer that steep or crevassed and we could walk right down the middle. The overall retreat of this glacier as seen in the Google Earth imagery sequence of 1998, 2006, 2009 and 2011 indicate the retreat with the brown line being the 1985 terminus, the green line the 1998 terminus, the orange line the 2006 terminus and the red line the 2009 terminus. Total retreat from the advance moraine of the 1970’s is 270 m. What is a more important reflection of the is glaciers current state is the thinning that is apparent. Outcrops of rock are emerging as the glacier thins even well above the terminus (A-E). The majority of the outcrops are on the eastern side of the glacier. Even after a year of good positive mass balance for the glaciers in 2011, the outcrops remain exposed. The upper portion of the glacier appears robust still. Unlike its counterpart over the glacier gap on its western margin where the west arm of the Whitechuck Glacier melted away.
On Suiattle Glacier in 2002 we undertook a detailed ice worm study, setting up six square meter plots and counting the ice worms. The recorded mean density was 1800 to 2600 ice worms per square meter in 2002. With an area of 2.7 square kilometers, this represents 5-7 BILLION ice worms on this glacier! This is comparable to the earth’s entire human population on just one glacier. Good thing they do not use many natural resources each. This is also the highest population we have identified in the North Cascades. The picture below is from this survey, the quality is tough because they only come out in low light and this was prior to having a digital camera.