Chickamin Glacier, Alaska Retreat Generates Separation and Lake Expansion

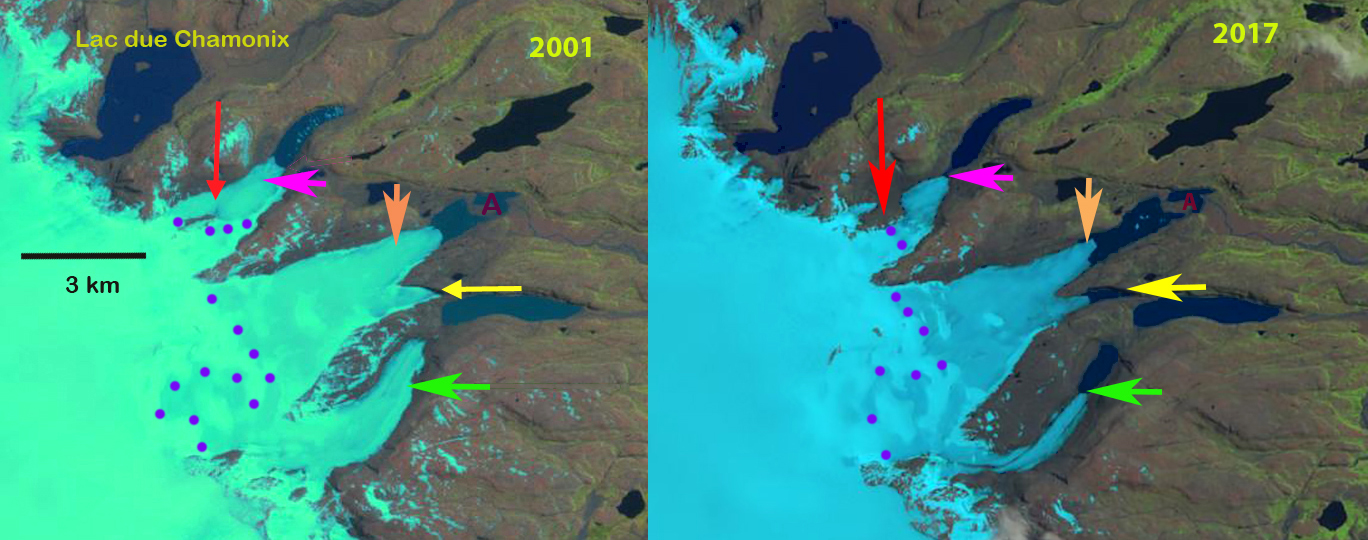
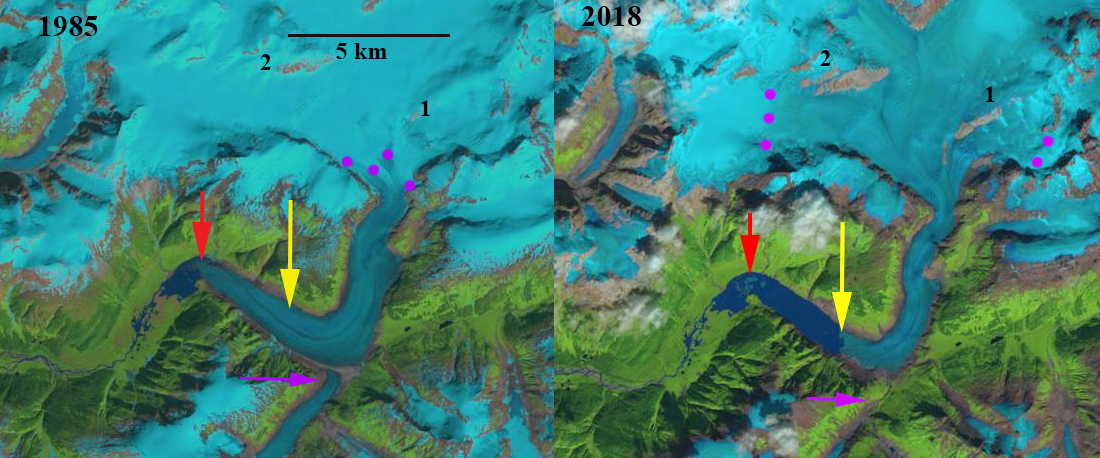
Chickamin Glacier, Alaska in 1985 and 2018 Landsat images indicating the 3.5 km retreat and associated lake expansion. Red arrow is 1985 terminus location, yellow arrow is the 2018 terminus location, pink arrow is former junction area with Through Glacier.  The purple dots indicate the snowline.  Point 1 and 2 are locations of bedrock expansion above the equilibrium line altitude. 

Chickamin Glacier in southeast Alaska glacier drains south from an icefield near Portland Canal and straddling the border with British Columbia. The glacier ended on an outwash plain in 1955 at an elevation of 250 meters.  Shortly thereafter a lake began to form, and by 1979 a Landsat image indicates a lake that is 1300 meters long and a retreat of ~2.5 km from 1902-1979 (Molnia, 2008). The glacier at that time was fed by a substantial tributary entering from the south ~5 km above the terminus, Through Glacier-pink arrow. Here we examine Landsat images from 1985-2018 to identify the response to climate change.

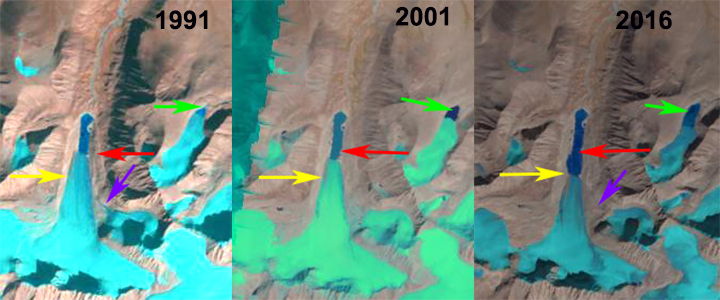
In 1985 the glacier terminated at an elbow in the lake where the lake both narrows temporarily and turns east, red arrow. The glacier had terminated close to this location for 30 years. The snowline is at 1150 m, and Through Glacier still connects to Chickamin Glacier.  At point 1 and 2 the area of exposed bedrock is limited. In 1994, the glacier has retreated 500 m from the elbow.  Through Glacier has separated from Chickamin Glacier. The snowline in 1994 is at 1125 m.  In 2013, Through Glacier has retreated 1600 m from Chickamin Glacier. Chickamin Glacier has retreated 2 km since 1985 and the snowline is at 1250 m.  By 2018 Chickamin Glacier has retreated 3.5 km since 1985 a rate of just over ~100 m/year, yellow arrow. The terminus is currently at a point where the lake narrows, which should reduce the retreat rate.  In 2018, the snowline reached 1525 m, leaving only 10-15% of the glacier in the accumulation zone.  The exceptionally high  snowline in 2018 was also noted at Taku Glacier. The snowline from 2014-2018 has persistently been above 1350 m, which indicates substantial negative mass balance for the glacier that will drive continued retreat. The persistent snowline elevation above 1250 m is indicated by the expansion of bedrock areas at Point 1 and 2 from 1985 to 2018, which both are located in what was the typical accumulation zone prior to that time.

The sustained mass balance losses follow that of Lemon Creek Glacier, which has a a long term record from 1953-2018 indicating a loss of  ~-0.5 m/year (Pelto et al. 2013).  The retreat and lake expansion has become a chorus with more than 20 coastal Alaskan glaciers having at least a 2 km lake expansion due to retreat since 1984, documented individually in previous posts at this blog.

Chickamin Glacier, Alaska in 1994 and 2013 Landsat images indicating the 3.5 retreat and associated lake expansion. Red arrow is 1985 terminus location, yellow arrow is the 2018 terminus location, pink arrow is former junction area with Through Glacier.  The purple dots indicate the snowline.  Point 1 and 2 are locations of bedrock expansion above the equilibrium line altitude. 

USGS map of Chickamin Glacier based on 1948 aerial photographs

West Ganglung Glacier, Tibet Glacier Loses 20% of Length

Landsat image comparison from 1991, 2001 and 2016 of West Ganglung Glacier, red arrow is the 1991 terminus, yellow arrow the 2016 terminus, green arrow the eastern glacier proglacial terminus lake and purple arrow expanding zone between a former tributary and West Ganglung Glacier

West Ganglung Glacier is on the China-India border 6 km west of Ganglun Grangri Peak meltwater enters the Sultej River and then Mapam Tso.  the glacier terminates in a proglacial lake at 5200 m with its head on the border at 5750 m. This region is part of the Indus Basin, the second China glacier inventory noted a 23% decline in glacier area from 1970 to 2007 (Guo et al 2015) Assessing the sensitivity of the Sutlej River basin to climate change Miller et al (2012) noted that with a warmer climate melt contributions from lower parts are reduced because of decreased snow cover and a shorter melting season.  Significant glacier area loss will also lead to less runoff despite an increase in rate. Singh et al (2012) noted a decline in runoff from the Sutlej basin after 2000, whereas there had been a rise before that. 

Here we examine teh unnamed West Ganglung Glacier change from 1991 to 2016 in a series of Landsat images. In 1991 the glacier terminates at the red arrow, and the lake is 1050 m long. At the glacier just to the east there is a small proglacial lake 200 m long. By 2001 glacier retreat had led to lake expansion to 1400 m long. The proglacial lake at the end of the eastern glacier is now 350 m long. By 2016 the proglacial lake at the terminus had expanded to a length of 1850 m, a retreat of 800 m in 27 years.  The proglacial lake at the terminus of the eastern glacier in 2016 is 650 m long, indicating a retreat of 450 m.  In both case the retreat is a significant loss of overall glacier length, ~20%.  The purple arrow indicates the increasing separation between a tributary and the West Ganglung Glacier glacier.

Google Earth image of West Ganglung Glacier, red arrow is the 1991 terminus, yellow arrow the 2016 terminus, green arrow the eastern glacier proglacil terminus lake and purple arrow expanding zone between a former tributary and West Ganglung Glacier


Landsat image from2014 of West Ganglung Glacier, red arrow is the 1991 terminus, yellow arrow the 2016 terminus, and green arrow the eastern glacier proglacial terminus lake.

Cook Ice Cap Outlet Glacier Retreat Lake Fromation, Kerguelen 2001-17


Comparison of eastern outlet glaciers of the Cook Ice Cap in 2001 and 2017 Landsat images.  Red arrow indicates a location of tributary separation. Pink arrow the 2017 terminus location of the northernmost glacier. Orange arrow the 2017 terminus location of the middle glacier.  Yellow arrow tip the 2001 terminus position of glacier ending in newly formed lake.  Green arrow the southernmost glacier 2017 terminus location. 

On the east side of the Cook Ice Cap on Kerguelen Island a series of outlet glaciers have retreated expanding and forming a new group of lakes.  Here we examine the changes from 2001-2017 along using Landsat imagery. Retreat of glacier in the region was examined by Berthier et al (2009) and is exemplified by the retreat of Ampere Glacier.  Verfaillie et al (2016) examined the surface mass balance using MODIS data, field data, and models.  They identified that accelerating glacier wastage on Kerguelen Island is due to reduced net accumulation and resulting rise in the transient snowline since the 1970s, when a significant warming began.

In 2001 at the red arrow is where the north tributary of a glacier ending in the northern most lake joins the main glacier.  In the second lake is a peninsula, marked with point A that the glacier terminus is 1 km from. The next two glaciers terminating at the yellow arrow and beyond the green arrow do not have lakes at their termini.  By 2014 the northern tributary has lost its connection with the main glacier terminating in the lake. The distance from the island for the middle glacier has increased.  A lake is forming at the yellow arrow. For the third glacier a lake has formed at the green arrow. In 2017 the northern glacier has retreated to the pink arrow a distance of  750 m and is no longer terminating in the lake. The terminus at the orange arrow has retreated  main terminus has retreated 900 m, expanding the lake it terminates in.   The glacier at the yellow arrow has retreated into a new lake basin, with a retreat of 850 m since 2001. The terminus is thin and in the Google Earth image indicates some substantial thin icebergs have separated from the glacier. The green arrow marks the 2017 terminus of the southern most lake. This glacier has retreated 950 m leading to the continued expansion of a new lake.  In just a decade we see the formation of two new lakes and the expansion of two others at the terminus of the eastern outlet glaciers of Cook Ice Cap, rapid landscape change driven by climate change.

2014 Landsat image of the eastern outlet glaciers of Cook Ice Cap.Red arrow indicates a location of tributary separation. Pink arrow the 2017 terminus location of the northernmost glacier. Orange arrow the 2017 terminus location of the middle glacier.  Yellow arrow tip the 2001 terminus position of glacier ending in newly formed lake.  Green arrow the southernmost glacier 2017 terminus location. 

Terminus of three outlet glaciers from left to right the green arrow, yellow arrow and orange arrow terminus glacier on the Landsat images.  The green arrows indicate places where the terminus or icebergs illustrates how thin the glacier ice is.