36th Annual North Cascade Glacier Climate Project Field Season Begins

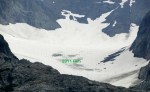
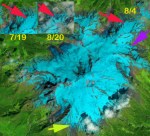
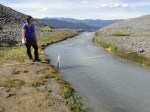
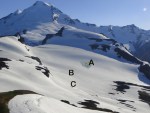
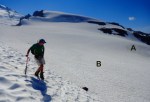
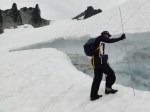
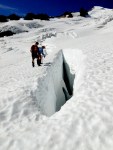
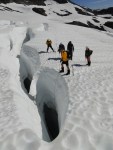
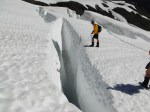
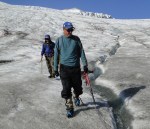
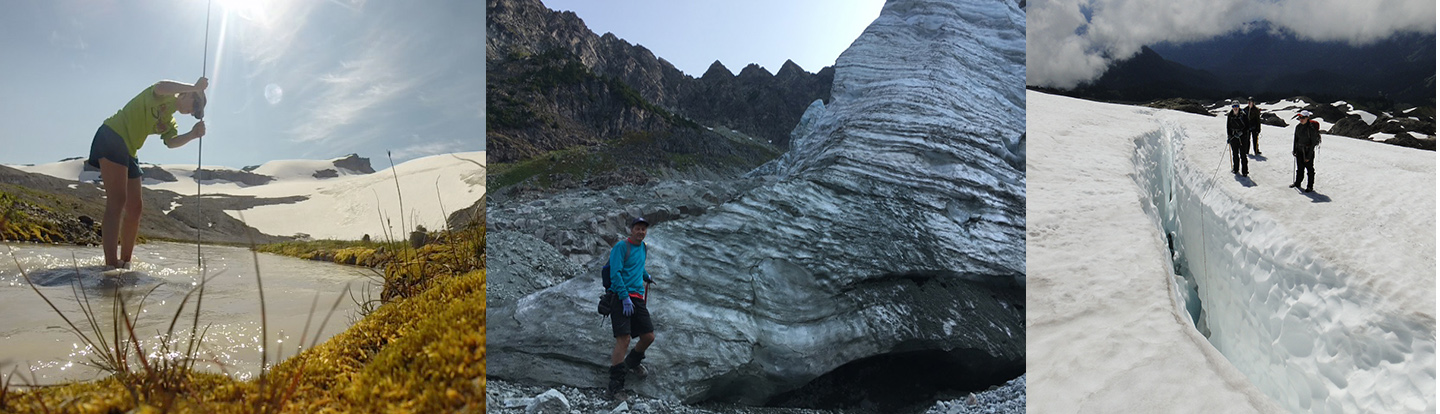
Fieldwork includes terminus surveys, glacier runoff measurement and mass balance measurements

Field Season Begins August 1

Who we are? The North Cascade Glacier Climate Project (NCGCP) was founded in 1983 to identify the response of North Cascade glaciers to regional climate change, particularly changes in mass balance, glacier runoff and terminus behavior.   This was prompted by the  National Academy of Sciences listing this as a high priority and a personal appeal from Stephen Schneider. NCGCP is a field project that has a broader interdisciplinary scope and is the most extensive glacier mass balance field program in the United States.  Two of the 41 reference glaciers in the world are in our network, and as of next year that will become three glaciers.  We do this research cost effectively relying on no permanent camps, helicopter support or salary for the director. The field season includes no days off and each day is spent completing measurements on glaciers.  The focus is on glacier mapping, mass balance measurement, terminus observations and glacier runoff monitoring.  Each year we utilize several field assistants to complete the annual glacier surveys, with 2019 being the 36th field season.  Our goal in choosing assistants is not to pick the most experienced, but the individuals who are capable and can benefit the most.  We are a self-contained unit. Recently Hakai Magazine described our process well.

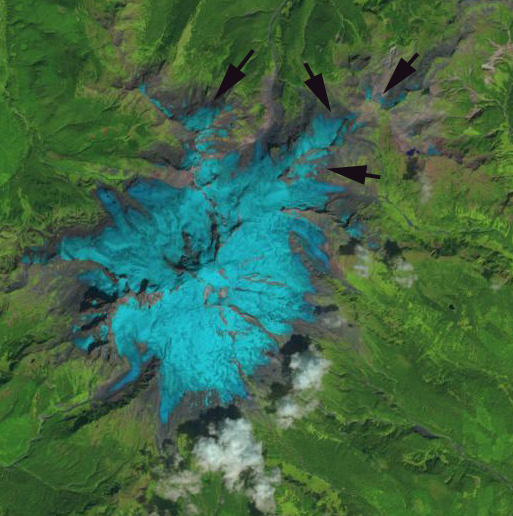
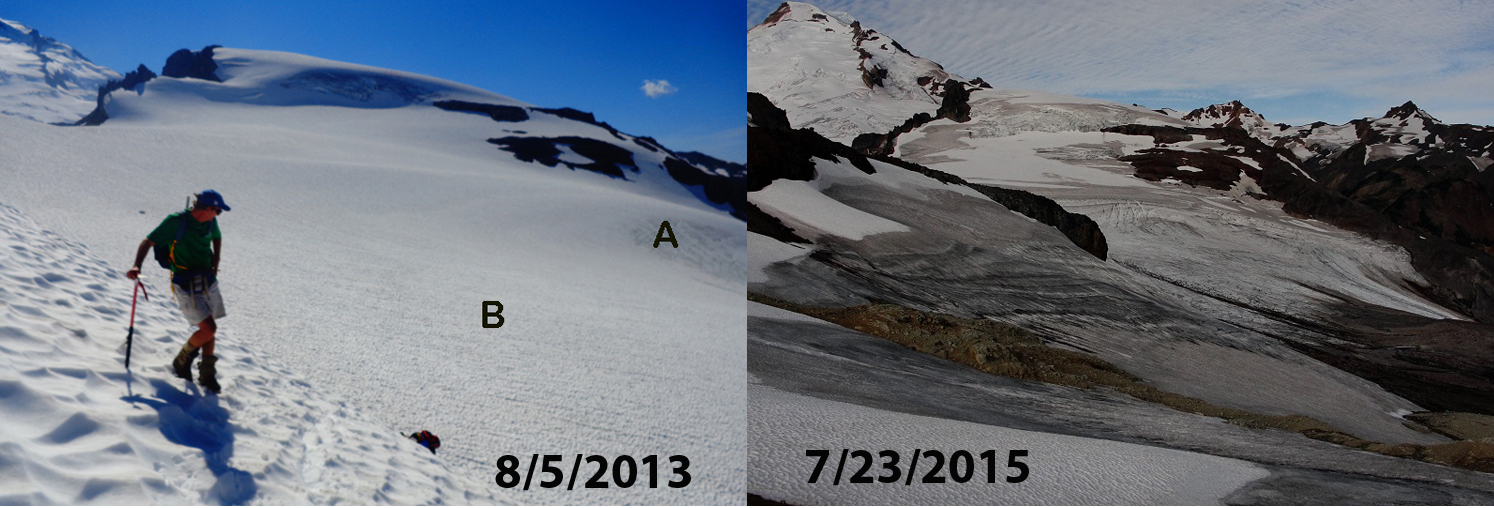
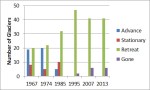
Why study glaciers in the North Cascades? Glaciers are one of the world’s best climate monitors and are a critical water resource to many populated glaciated regions. This is particularly true in the North Cascades where 700 glaciers yield 200 billion gallons of summer runoff and glaciers have lost 30 % of their area since 1980. These glaciers have lost 25-30% of their volume during the course of our study, three of our primary study glaciers have disappeared. We also monitor ice worms and mountain goats since we are in the same locations at the same time each year.

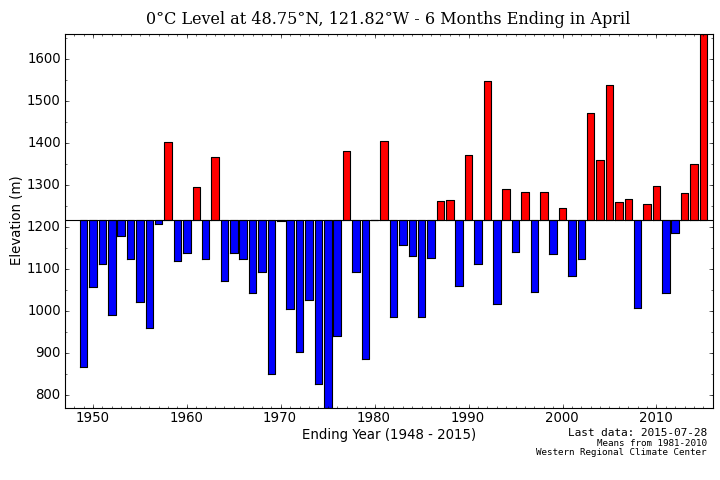
2019 Outlook: For North Cascade glaciers the accumulation season provides that layer of snow, that must then last through the melt season.  A thin layer sets the glaciers up for a mass balance loss, much like a bear with a limited fat layer would lose more mass than ideal during hibernation. The 2019 winter season in the North Cascade Range, Washington has been unusual.  On April 1 the retained snow water equivalent in snowpack across the range at the six long SNOTEL sites is 0.72 m, which is ~70% of average.  This is the fifth lowest since 1984.  The unusual part is that freezing levels were well above normal in January, in the 95% percentile at 1532 m, then were the lowest level, 372 m of any February since the freezing level record began in 1948.  March returned to above normal freezing levels.  As is typical periods of cold weather in the regions are associated with reduced snowfall in the mountains and more snowfall at low elevations.  In the Seattle metropolitan area February was the snowiest month in 50 years, 0.51 m of snow fell, but in the North Cascades snowfall in the month was well below average. From Feb. 1 to April 1, snowpack SWE at Lyman Lake, the SNOTEL site closest to a North Cascade glacier, usually increases from 0.99 m to 1.47 m, this year SWE increased from 0.83 m to 1.01 m during this period. The melt season from May-Mid-July has also been warmer than average.  This combination will lead to significant glacier mass loss in 2019, in one month we will report back on our measurements that will indicate just how negative.

2019 Field Team:

Clara Deck: is an earth scientist from Chicago with a passion for science communication, education, and outreach. She completed a B.A. in geology at the College of Wooster in Wooster, Ohio, where she began a journey in climatological research which led to a love for the cryosphere. In the summer of 2018, Clara contributed to glacial field work in the eastern Alaska Range, and was fascinated by the dynamic day-to-day changes in glacial features she was tasked with measuring. At the University of Maine, she is wrapping up her M.S. focused on numerical modeling of Antarctic ice shelf instabilities, but Clara’s favorite part of her college career has been sharing science with students as a teaching assistant. During her first visit to the North Cascades, she is excited to learn about ongoing glacial change and to explore accessible ways to share the findings with public audiences.

Abby Hudak is a native Floridian that has always had a deep calling to the mountains and frozen landscapes. Her passions revolve around understanding our changing climate and natural world which led her to attain a B.S. in Biological Sciences from the University of Central Florida. After starting her M.S. in Biological Sciences at Washington State University, she immediately indulged in snow sports and mountaineering in the Cascade Range. The beauty and vulnerability of these landscapes have driven her to expand her research interests to understanding aspects of the changing cryosphere. She is eager to intertwine her love for the Cascade Range and her desire to pursue scientific questions pertaining to climate impacts on alpine glaciers by working with the North Cascade Glacier Climate Project this summer.

Ann Hill, ever since she was a young child growing up in Minneapolis, Ann has been fascinated by ice and snow, however it wasn’t until her Sophomore year studying Geosciences at Skidmore College that she realized she could study ice as a career path. Consequently, during her junior year she traveled to Svalbard to gain hands-on experience studying and exploring glaciers. Determined to learn more, Ann spent a summer with the Juneau Icefield Research Program, which exposed her to glaciers that looked and behaved differently. In the fall, Ann will begin her M.S. in Earth and Climate Sciences at the University of Maine. Ann is thrilled to study the North Cascade glaciers to understand how their movement and characteristics compare to those she previously observed in Svalbard and Alaska.

Jill Pelto is an artist and scientist from New England who grew up loving winter sports and trips to the mountains. She incorporates scientific research and data into paintings and prints to communicate environmental changes. Her multi-disciplinary work weaves visual narratives that reveal the reality of human impacts on this planet. She completed both her B.A. degrees in Studio Art and Earth and Climate Sciences and her M.S. focused on studying the stability of the Antarctic Ice Sheet at the University of Maine. She spent two field seasons at a remote camp in the southern Transantarctic Mountains to map glacial deposits and collect samples from them for dating. Jill will be joining the project for her 11th field season. She is excited about continuing to document the change in North Cascade glaciers that she has witnessed each of the last ten years — through science and art.

Mauri Pelto has directed the project since its founding in 1984, spending more than 700 nights camped out adjacent to these glaciers. He is the United States representative to the World Glacier Monitoring Service, author of the AGU blog “From a Glacier’s Perspective”, and associate editor for three science journals.  His primary job is Dean of Academic Affairs at Nichols College, where he has been a professor since 1989.

Schedule

Aug. 1:  Arrive Hike into Easton Glacier

Aug. 2:  Easton Glacier survey

Aug. 3:  Easton Glacier survey

Aug. 4:  Hike out  Hike in Lower Curtis Glacier

Aug. 5:  Lower Curtis Glacier Survey

Aug. 6:  Hike out Lower Curtis Glacier Hike in Ptarmigan Ridge

Aug. 7:  Sholes Glacier

Aug. 8:  Rainbow Glacier

Aug. 9:  Hike out- Coleman Glacier survey

Aug. 10:  Hike in Columbia Glacier

Aug. 11:  Columbia Glacier survey

Aug. 12:  Columbia Glacier survey

Aug. 13:  Hike out Columbia Hike in Mount Daniels

Aug. 14:  Ice Worm Glacier survey

Aug. 15:  Lynch and Daniels Glacier survey

Aug. 16:  Hike out

Visualizing Glacier Melt Impacts

Key questions emerge from the summer of 2015 in the Pacific Northwest glacier basins. That can both be visualized and quantified.

With record temperatures and minimum flows in most rivers in the Cascade Range during July and August of 2015, a key question was how much did glaciers contribute in basins that are glaciated?  Note the water pouring off the glacier and the lack of snowcover in the first few minutes of the video.

You can examine flow per unit watershed area as a first order observation. In the unglaciated South Fork discharge was 0.5 cfs/square mile, rising to 0.7 cfs/square mile in the lightly glaciated Skykomish River and 4.3 cfs/square mile in the heavily glaciated North Fork Nooksack.   For a more direct measure we measured ablation from July 29 to August 17th in the North Fork Nooksack and Skykomish River basin.  With the Nooksack Tribe we also measured discharge below glaciers in the North Fork but those recorders are still deployed in the field.

Because the glaciers had mostly ice, not snow at the surface, melting was enhanced.  We found in the Skykomish Basin that glacier runoff was 45 CFS versus a mean discharge of 375 CFS , this is 12% of the total flow despite covering only 1.3 % of the basin.  In the North Fork Nooksack glacier runoff was 340 CFS versus total flow of  460 CFS, this is 74% of the total flow though only 6.1 % of the basin has glacier cover. In both cases the glaciers contributed a river flow percentage 12 times greater than the percent of basin area they cover.  With a substantial loss in glacier area occurring this summer, next year glacier runoff for the given climate conditions will be reduced. Given this higher flow the glacier fed streams offer less stressful conditions this summer to salmon.

How much did glacier runoff water temperature amelioration?

In the South Fork Nooksack without glaciers stream temperature was above 20 C on eight days between Aug.1 and Aug. 20. In the North Fork Nooksack with glacier contribution, the stream temperature peaked at 13-14 C.

With the early loss of snowcover and exposure of the underlying ice, how are glacier ice worms impacted?  In the video note ice worms featured in the first minute in a glacier filled crevasse.

These worms live on snow algae primarily, which would seem to be in short supply in a summer with limited snowpack on the glaciers.  How well can they survive being on the glacier ice for extended periods?  For the 21st year we conducted ice worm population surveys.  The numbers were the lowest we have seen at 175-250 ice worms per square meter, but it should be next year when the full impact would be evident.

How much glacier area will be lost?  Note the visual of terminus retreat.
The summer is not over, but our observations indicate a 5-7 % volume loss will occur.  This should be approximately equaled by area loss.  Hopefully good satellite imagery in September will provide a specific answer.  The Aug. 17th Landsat image is excellent. Retreat just this summer has been 40 m on Easton Glacier, 32 meters on Columbia Glacier, 25 meters on Sholes Glacier and 30 meters on Lower Curtis Glacier.

mount baker 9172015


Aug. 17 Landsat image.  Arrows indicate areas where we observed rapid area loss of glacier ice this summer. 

Embarking on the 32nd Annual North Cascade Glacier Climate Project


sholes compare
Sholes Glacier snowcover Aug. 5, 2013 (Jill Pelto) and Sholes Glacier July 23, 2015 (Oliver Grah)

For the 32nd straight summer we will be investigating North Cascade glaciers and their response to climate change over the next three weeks (that means no new posts until Aug. 20).  In 1984 the program was initiated to study the impacts of climate change across an entire mountain range, instead of on just one glacier.  This had been a high priority of the National Academy of Science, I felt I could address.  The glaciers in the North Cascades provide water resources for irrigation, hydropower, salmon and municipal supply.  During our 32 years we have seen the loss of 25% of the entire glacier volume of the range.  Unfortunately 2015 is almost certainly going to be the worst year during this period.  We will likely lose over 5% of the volume of these glaciers in one year.  The problem has been high freezing elevations in the winter, note the difference from other years below.  Because of the drought conditions glaciers are even more crucial to runoff, note the daily spike in flow due to glacier melt in the Nooksack River in July, black arrows.  Blue arrow indicates rain storm.

winter 2015nooksack

Freezing levels on Mount Baker during winter 2015 versus previous winters.  Nooksack River discharge from the USGS in July.

This has been followed by the warmest June and now July the region has seen. This has led to record low streamflow from either rain, groundwater or snowpack from non-glacier areas.  The result is that in glacier fed basins glacier runoff which is above normal because of the warm temperatures is even more important.  We are measuring flow below glaciers and melting on glaciers to quantify the percent of total flow contributed by glaciers.  In 2014 in the North Fork Nooksack River glaciers contributed more than 40% of total stream discharge in the river on 21 days, all in August and September. We again with the Nooksack Indian Tribe will be examining the issue, particularly at Sholes Glacier. We will also be measuring the mass balance, terminus change and mapping ten glaciers we visit every year, including Columbia Glacier seen below.

columiba compare

Terminus of Columbia Glacier and accumulation zone looking bare in 2005, the lowest snowpack year of the last 32 until this year

The glaciers are all in Wilderness areas which means no motorized vehicles or equipment, we have to hike everything in.  This has provided the opportunity to spend over 600 nights in a tent examining the glaciers, hiking/skiing over 3000 miles across the glaciers, and eating oatmeal each morning for breakfast.  It has also provided the opportunity to train and work with more than 60 different scientists.  This year the field team consists of Erica Nied from the University of Colorado, Tyler Sullivan from the University of Maine, Jill Pelto from the University of Maine for the seventh year and myself for the 32nd year.  We will be joined at times by Justin Wright, Oregon State, Tom Hammond, University of Washington, Ben Pelto University of Northern British Columbia, Oliver Grah and Jezra Beaulieu of the Nooksack Indian Tribe. Below are three videos from last year that illustrate: 1: Visual report on initial 2015 findings 2: How and why we measure mass balance.3. The Nooksack Indian Tribe perspective on threats of glacier runoff and our measurements of it.


North Cascade Glacier Climate Project 2013 Field Report

The 2013 winter season provided close to average snowpack in the North Cascades as indicated by the average SWE at SNOtel stations in the range. The summer melt season has proved to be long, warm and dry. The May-August mean temperature at the station closest to a glacier, Lyman Lake, has been tied for the 2nd warmest in the last 25 years with 2009 and only 2004 warmer. The summer has lacked record periods of warmth and has featured sustained warm temperatures and higher than average humidity, reducing the number of nights when the glacier surface has frozen. The average minimum temperatures at Lyman Lake are the highest in the last 25 years for July and August. The humidity was the strikingly high during our field season, note diagram from a Cliff Mass article on the topic. The net result will be significant negative glacier mass balances in the North Cascades. There is one month left in the melt season most glaciers are close to an equilibrium balance already.

The field team included Stewart Willis and Matt Holland, Western Washington University, Jill Pelto, U of Maine, Ben Pelto, UMass,-Amherst, Jezra Beaulieu and Oliver Grah, Nooksack Indian Tribe research scientists And Tom Hammond, North Cascade Conservation Council. Alan Kearney, Photographer worked with us for the first week capturing time lapse imagery of our work.

After a month of perfect summer weather we arrived to a foggy and wet conditions on the Columbia Glacier. The Columbia Glacier terminus was exposed and has retreated 85 m since 1990. The glacier had a substantial area of blue beginning 200 m above the terminus and extending along the western side of the basin for 400 m. The area of blue ice on August 1 was 50,000 square meters, by Aug. 21 the area had expanded to 200,000 square meters, the shift of the 2013 winter snowline during this period indicates a melt of m during the three weeks.


The Lower Curtis Glacier terminus was exposed early in the summer resulting in a continued retreat of 20 m since 2011, the area of thick seraced terminus lost since 1990 has been 60,000 square meters. The lateral retreat and terminus retreat since 1990 are both in the 125-150 meter range depending on location.
We spent a week observing ablation and resulting glacier runoff on Sholes Glacier. With Oliver Grah and Jezra Beaulieu who work for the water resources section of the Nooksack Indian Tribe we emplaced a stream gage right below Sholes Glacier and one on Bagley Creek which is snowmelt dominated. With the water level gages in we all began work on a rating curve for the Sholes Glacier site directly measuring discharge on 14 occasions, kayak socks helped reduce the impact of cold water. Average ablation during the week was 8.25 cm/day of snowpack or 5 cm of water, discharge measurements identified a mean of 5.2 cm/day of from the glacier during this period. The agreement between ablation and discharge was a nice result. Discharge became notably more turbid after 1 pm, peaking in turbidity around 5 pm. Of equal interest was the change in snowcovered area. On July 19th a Landsat image indicated 100% snowcover for Sholes Glacier. On Aug. 4th our surface measurements indicates a blue ice area of 12,500 square meters, which is also evident in a Landsat image from that day. By Aug. 20th a satellite image indicates that the blue ice area had expanded to an area of square meters. This coincided with the area where snowdepth was observed to be less than 1.2 m on Aug.4. This represents a volume loss of 592,000 cubic meters of water in 16 days.
We measured the mass balance on Rainbow and Sholes Glacier during this period. The snowpack was poor on both, especially above 1900 meters on Rainbow Glacier. Typical depths are over 5-6 m, this year 3.75-4.5 m. The poor snow depths were also noted on the Easton Glacier above 2000 m in crevasse stratigraphy measurements. Each crevasse is approached probing to ensure it is safe and then assessed to make sure the crevasse is vertically walled, this enables a safe but also accurate measure. In some cases layers from mulitple years can be assessed. IN the Lynch Glacier crevasse the 2013 layer will be lost to melt before end of the summer. Easton Glacier had a terminus that was fully exposed by the start of August. The terminus slope has thinned markedly in the last three years as retreat has continued. The retreat of Easton Glacier has averaged 10 m/year from 2009-2013. This year the retreat will exceed that with two months of exposure. The Deming Glacier retreat has been exceptional over the last 12 months with at least 30 m of retreat. The snowline on Easton Glacier was at 1850 m on Aug. 10th. By the end of August the snowline had risen to 1980 m, where snow depths had been 1.5 m three weeks previous. The mass balance of Sholes, Rainbow and Easton Glacier will all be close to – 1 meters water equivalent, that is losing a slice of glacier 1.1-1.2 m thick. Mount Daniels had the best snowpack of any location in the North Cascades. On the small and dying Ice Worm Glacier ablation and runoff were assessed simultaneously. The expansion of the area where 2013 has all melted expanded rapidly from 8/13 to 8/21. The glaciers lower section had is often avalanche buried, this year the snowpack was gone on much of the lower section. However, snowpack averaged 1.7 m across the entire glacier on August 14th. With daily ablation of 7-8 cm/day this will be gone by early September. This will lead to a substantial negative mass balance this year. Lynch and Daniels Glacier both had limited exposed blue ice and firn, and snowpack values that were slightly above average. Both glaciers will have small negative mass balances this year. On Lynch Glacier a large crevasse at exposed the retained snowpack of the last three years, from 2010-2012 5 m of firn remains. ice worm 2013

ice worm 821upelto team
Ben in his 9th year, Jill her 5th year and Mauri 30th year of glacier work in the North Cascades

Colonial Glacier Retreat and Hydropower

Colonial Glacier is on the southwest side of Colonial Peak in the Skagit River Watershed, North Cascades of Washington. The North Cascade Glacier Climate Project has made six visits to this glacier over the last 25 years. Meltwater from this glacier enters Diablo Lake above Diablo Dam and then flows through Gorge Lake and Gorge Dam. These two Seattle City Light hydropower projects yield 360 MW of power. As this glacier shrinks the amount of runoff it provides during the summer for hydropower is reduced. In 1979 the glacier was clearly thinning, having a concave shape in the lower cirque, but still filled its cirque, there is no evidence of a lake in this image from Austin Post (USGS). The glacier had retreated 80 meters since 1955. In 1985 my first visit to the glacier there was no lake at the terminus. In 1991 the lake had begun to form, second image, but was less than 30 m across. The upper glacier was a smooth expanse of snow. By 1996 the lake was evident, and was 75 meters long. In 2001 the lake had expanded to a length of 125 meters. By 2006 the lake was 215 m in length, and had some thin icebergs broken off from the glacier front. Runoff to the Skagit River is impacted directly by the climate change and the resultant retreat of the glaciers. Three notable changes in North Cascade streamflow have occurred.
1) Alpine runoff throughout the North Cascades is increasing in the winter (Nov.-Mar.), as more frequent rain on snow events enhance melting and reduce snow storage Streamflow has risen 18% in Newhalem Creek and 19% in Thunder Creek despite only a slight decrease, 1% in winter precipitation at Diablo Dam, within 5 km of both basins. These basins are on either side of Colonial Glacier.
2)Spring runoff (April-June) has increased in both basins by 5-10% due to earlier alpine snowpack melting.
3)Summer runoff has decreased markedly, 27%, in the non-glacier Newhalem basin with the earlier melt of reduced winter snowpack. In Thunder basin runoff has in contrast increased negligibly, 4%. The difference is accounted for in part by enhanced glacier melting. The observed net loss of -0.52 meters per year in glacier mass spread over the melt season is equivalent to 2.45 cubic meters per second in Thunder Basin, 10% of the mean summer streamflow. This trend of enhanced summer streamflow by reduction in glacier volume will not continue as the extent of glaciers continues to decline.

The lower portion of Colonial Glacier is not moving. GPS readings on both rockpiles on the lower glacier indicated no movement from 1996-2006. In the picture above the lake is still small in 1996, lower right corner and the lower rock pile distant from the terminus. The first two images below are from 2006, the lower rock pile is near the terminus and the last image is 2007 the lake has expanded back to the lower rockpile. Additional rock outcrops have appeared in the midst of the upper glacier that were not present in 1991, indicating this glacier does not have a persistent accumulation zone and will not survive current climate.