Each year since 2008 I have been responsible for summarizing the global alpine glacier status for each specific year in the Bulletin of the American Meteorological Society State of the Climate report. The 2025 report came out in early August. Below is the report with several added figures.
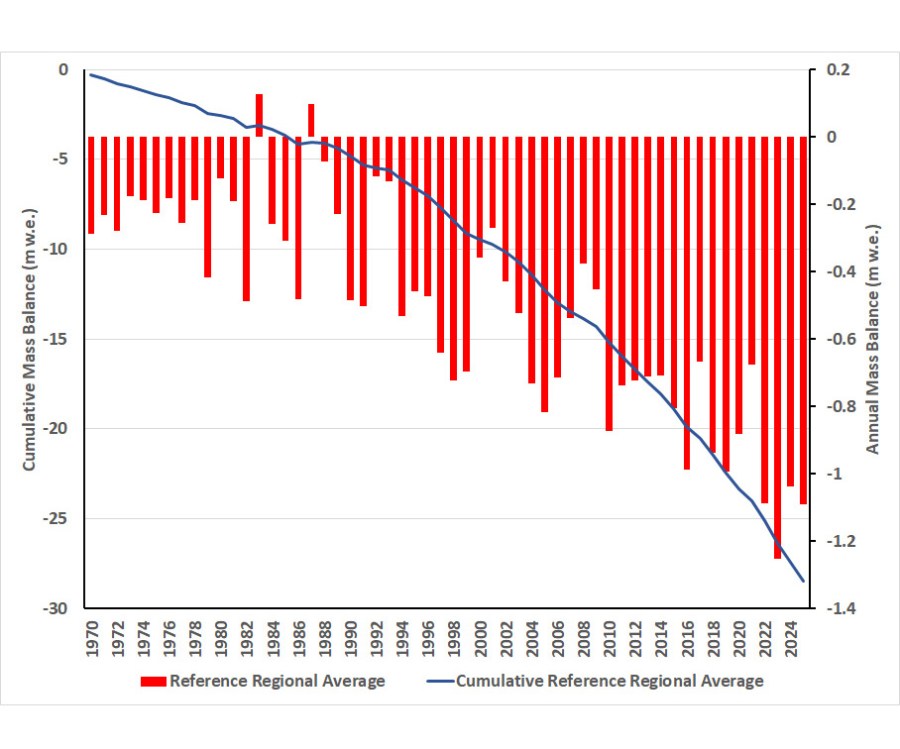
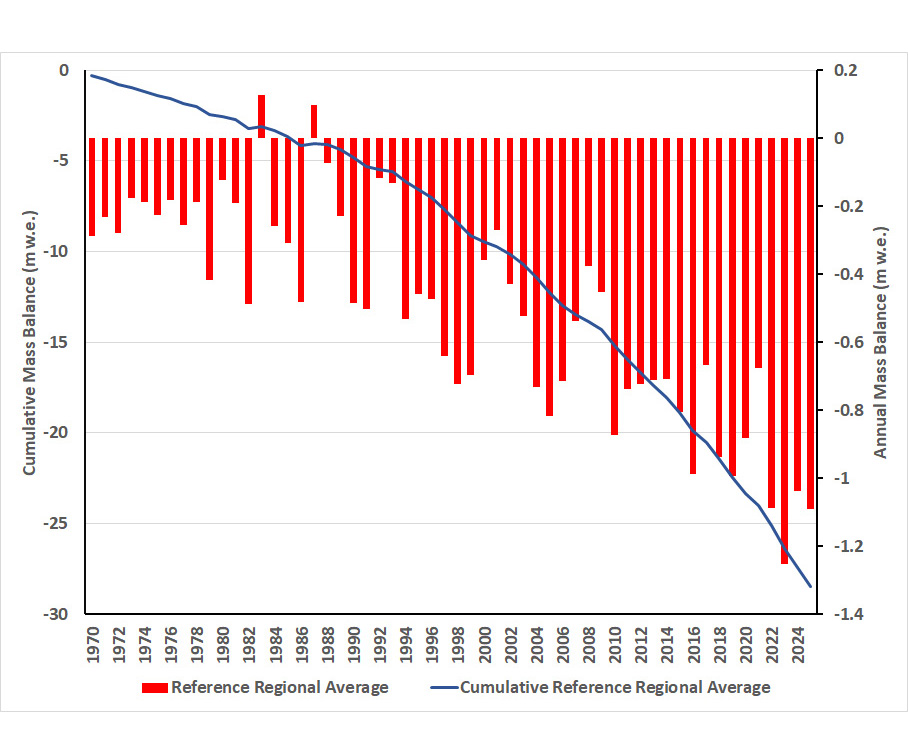
The 2025 World Glacier Monitoring Service (WGMS) dataset of annual glaciological mass balance observations includes 162 glaciers from six continents and 26 nations, 158 with a negative balance and four with a positive balance. In 2025, the mean annual mass balance of the 59 reporting global reference glaciers was –1.34 m w.e., and -1.34 m w.e. for all 162 reporting glaciers. The 2025 regionalized global average annual balance of –1.09 m w.e., is the fourth consecutive year with mass balance loss exceeding 1.0 m w.e., 2023 had the most negative -1.23 m w.e and 2024 was at 1.04 m w.e. Since 1976, mountain glaciers and ice caps have lost 9179+621 Gt of water, contributing 25.3+1.7 mm to the global mean sea level rise, with 41% of this loss occurring in the last decade (Dussaillant et al. 2025).
The mean annual balance of global reference glaciers was -1.34 m w.e., a similar result to 2023 and 2024 with a mean annual balance for global reference glaciers of -1.60 m w.e. and -1.37 m w.e., respectively. This makes 2025 the 38th consecutive year with a global alpine mass balance loss, the 16th consecutive year with a regionalized global mass balance below –0.5 m w.e. The significant acceleration of mass balance loss is evident in glaciological observations, geodetic observations, altimetry observations and gravimetric observations (The GlaMBIE Team, 2025). The acceleration of mass balance loss indicates glaciers are not approaching equilibrium and increasingly are disappearing. The Global Land Ice Measurement from Space inventory of global glaciers has now added an extinct glacier layer to record glaciers that have disappeared, that is populated by 181 glaciers that had existed in a previous inventory (Raup et al. 2025). In conjunction with 2025 being the UN International Year for Glaciers’ Preservation the Global Glacier Casualty List has been created to chronicle the story of specific glaciers being lost from each glaciated region (Boyer and Howe, 2025).
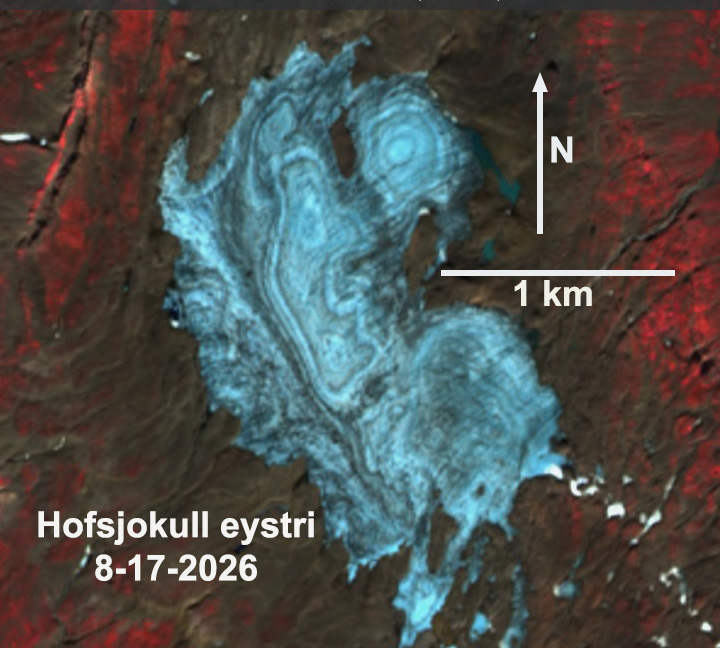
In the European Alps all 54 glaciers observed had negative balances, with 45 of the glaciers losing over 1 .0 m w.e. In Iceland (6) and Svalbard (9) all 15 glaciers observed lost over 1.0 m w.e. In Norway 8 of 10 glaciers had a negative balance, with two glaciers having a positive balance. In Sweden 3 of 4 glaciers had a negative balance.

In Asia all 23 glaciers across 7 nations had negative balances averaging 0.97 m w.e. In New Zealand the glaciers observed had a negative mass balance.
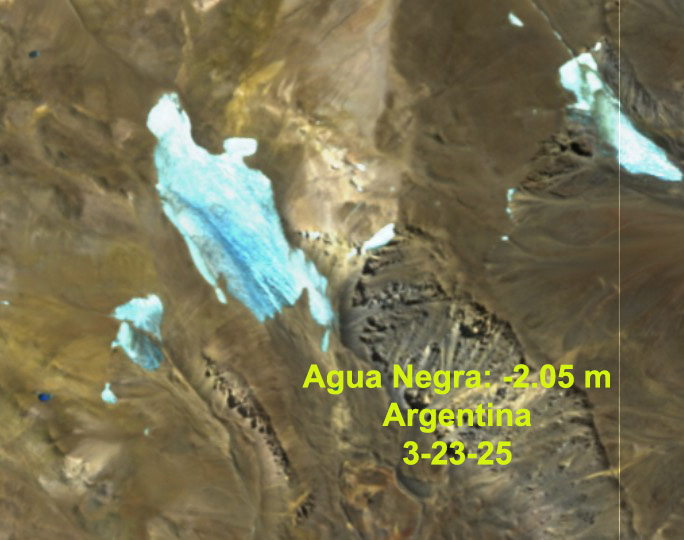
In the Andes Mountains of South America nine of ten, reporting from four nations, had negative balances, with an average balance of -0.92 m w.e.
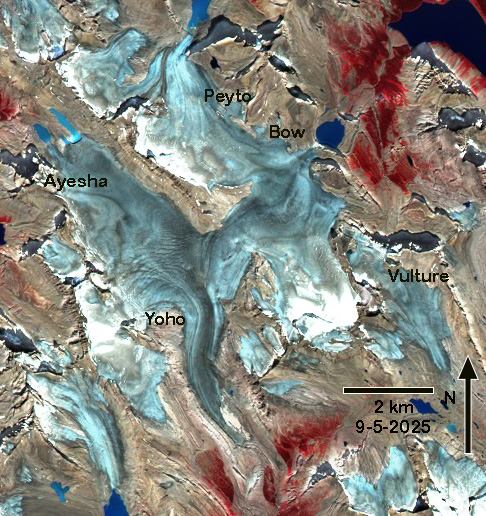
All 14 glaciers in Western North America, outside of Alaska, had mass balance below -1.0 m w.e. with an average of -2.24 m w.e. Peyto Glacier, Canada exemplifies the limited retained snow cover on alpine glaciers in Western North America in 2025, a glacier should be 50-60% snow covered at the end of summer to be in equilibrium (Fig X2). It is evident Peyto Glacier is representative of adjacent glaciers that also have limited retained snow cover. In Alaska 3 of 4 glaciers had negative balances. The five glaciers in Arctic Canada all had small negative balances averaging -0.16 m w.e.
Alpine annual mass balance glaciological observations are reported to the WGMS by National representatives with a December 1 annual submission deadline. WGMS reference glaciers (60) have at least thirty continuous years of mass balance observation. Benchmark glaciers (23) have at least a ten-year mass balance record and are in regions that lack sufficient reference glaciers. The combination of benchmark and reference glaciers are used to generate regional averages (WGMS, 2023). Global values are calculated using a single averaged value for each of 19 mountain regions, limiting bias from observed regions (WGMS, 2023). Expansion of this data set leads to reanalysis and updated values.
References
Boyer, D. and Howe, C. 2025. Communication efforts to educate the public about vanishing glaciers, 1958–2025. Annals of Glaciology, 67: e2. doi:10.1017/aog.2025.10033
Dussaillant, I., Hugonnet, R., Huss, M., Berthier, E., Bannwart, J., Paul, F., and Zemp, M. 2025: Annual mass change of the world’s glaciers from 1976 to 2024 by temporal downscaling of satellite data with in-situ observations. Earth System Science Data 17(5): 1977-2006, https://essd.copernicus.org/articles/17/1977/2025/.
Raup, B., Andreassen, L., Boyer, D., Howe, C., Pelto, M., and Rabatel, A. 2025: Tracking extinct glaciers in GLIMS. Annals of Glaciology, 66, e35, 1–6. https://doi.org/10.1017/aog.2025.10027
The GlaMBIE Team, 2025: Community estimate of global glacier mass changes from 2000 to 2023. Nature. https://doi.org/10.1038/s41586-024-08545-z.
WGMS 2023: Global Glacier Change Bulletin No. 5 (2020–2021). Zemp, M., Gärtner-Roer, I., Nussbaumer, S.U., Welty, E.Z., Dussaillant, I., and Bannwart, J. (eds.), ISC(WDS)/IUGG(IACS)/UNEP/UNESCO/WMO, World Glacier Monitoring Service, Zurich, Switzerland, 134 pp., publication based on database version: doi:10.5904/wgms-fog-2023-09. [NG5] [MP6]
Datasets used and their URLs
Dussaillant, I., Hugonnet, R., Huss, M., Berthier, E., Bannwart, J., Paul, F., and Zemp, M. (2025): Annual mass-change estimates for the world’s glaciers. Individual glacier time series and gridded data products. Digital media. https://doi.org/10.5904/wgms-amce-2025-02b[NG7] [MP8]





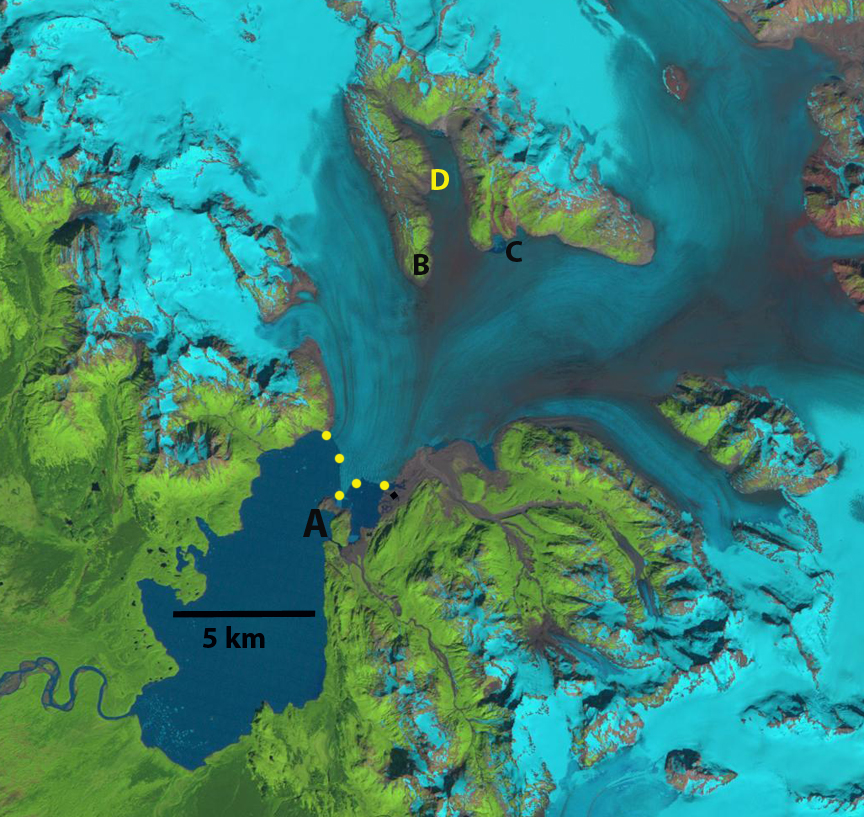
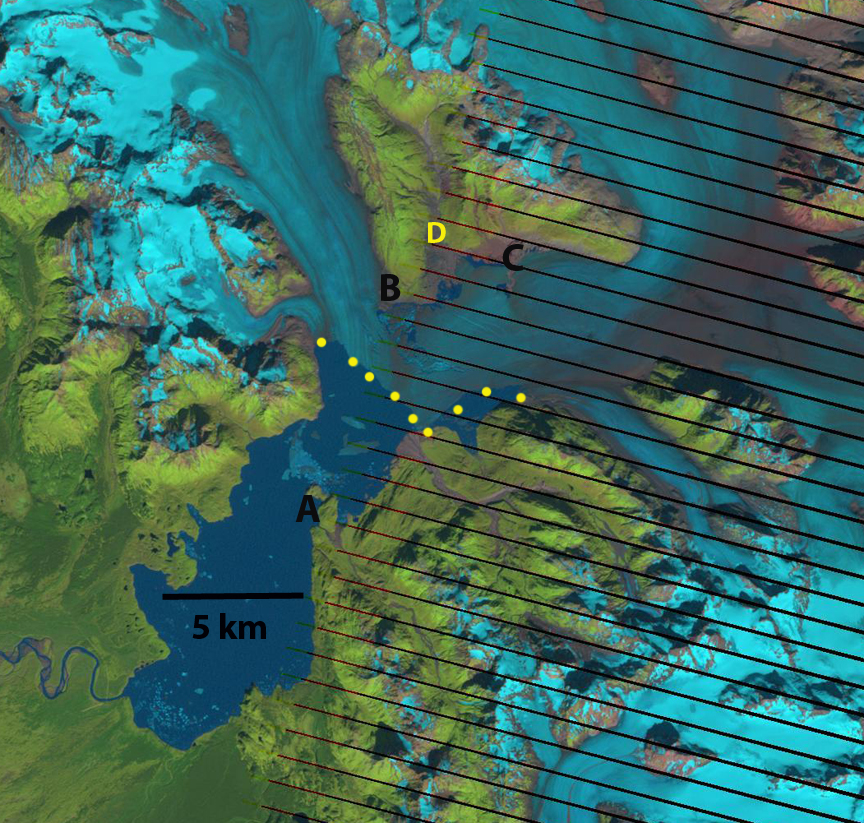

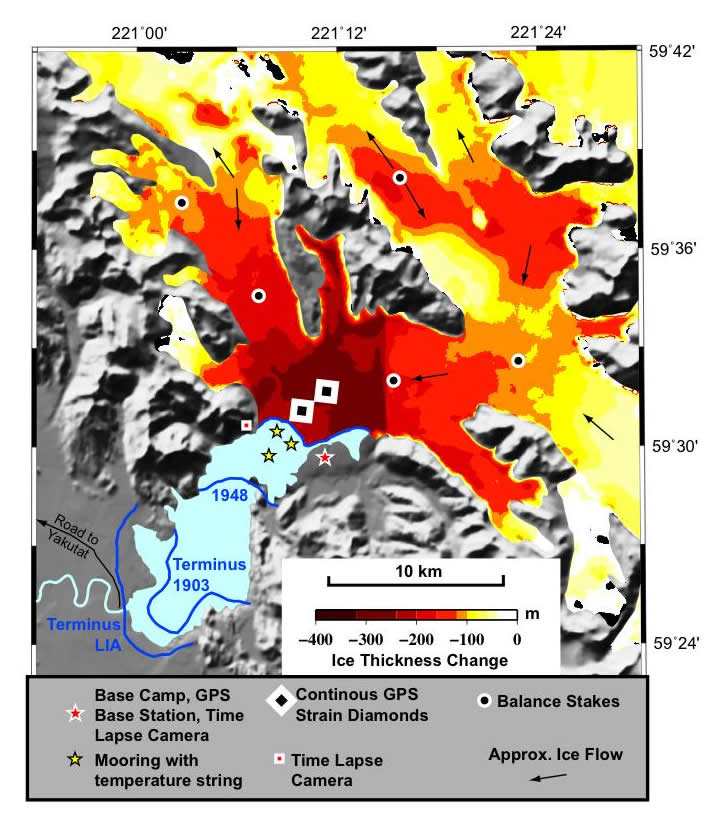

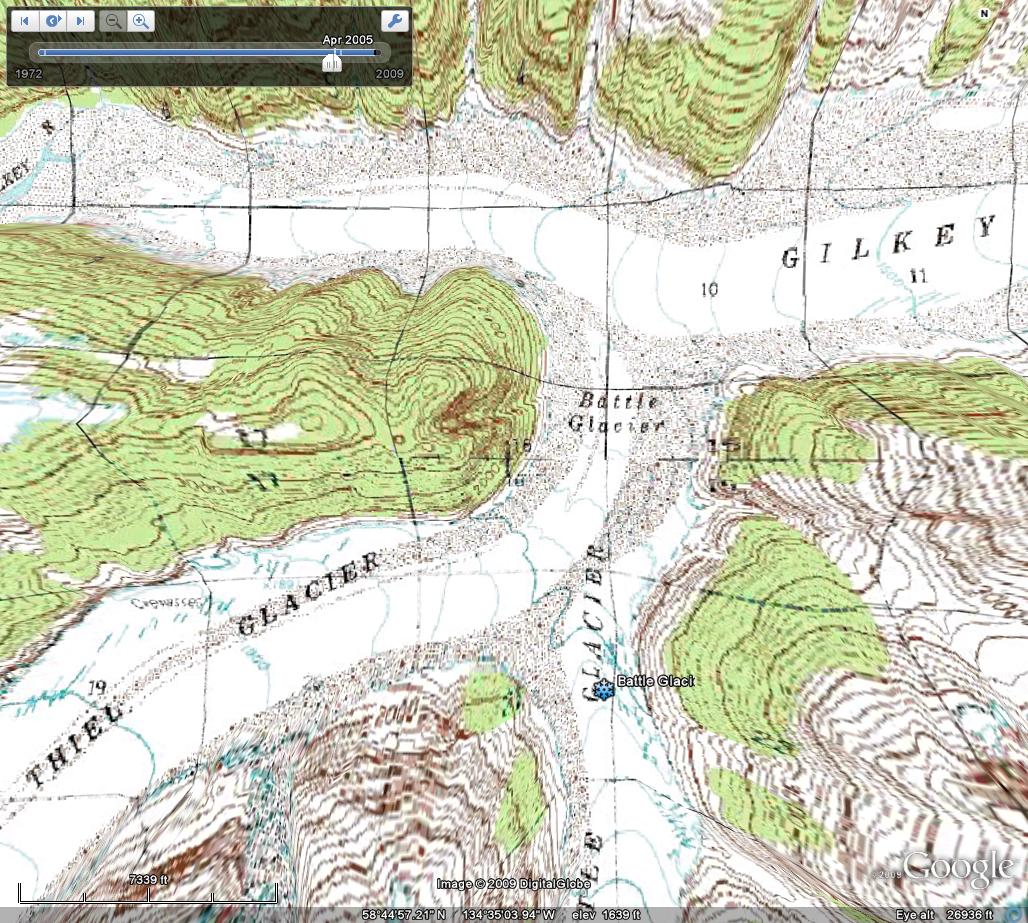 All three of these glaciers drain from the Juneau Iceifeld accumulation zone between 1500 and 2000 m, which maintain consistent snow cover. From 1948 to 1967 the Gilkey Glacier retreated 600 m and in 1961 a proglacial lake began to form. By 2005 Gilkey Glacier had retreated another 3200 m , generating a proglacial lake that is now 3.9 kilometers long, which is approximately the amount of retreat in the last 60 years as well.
 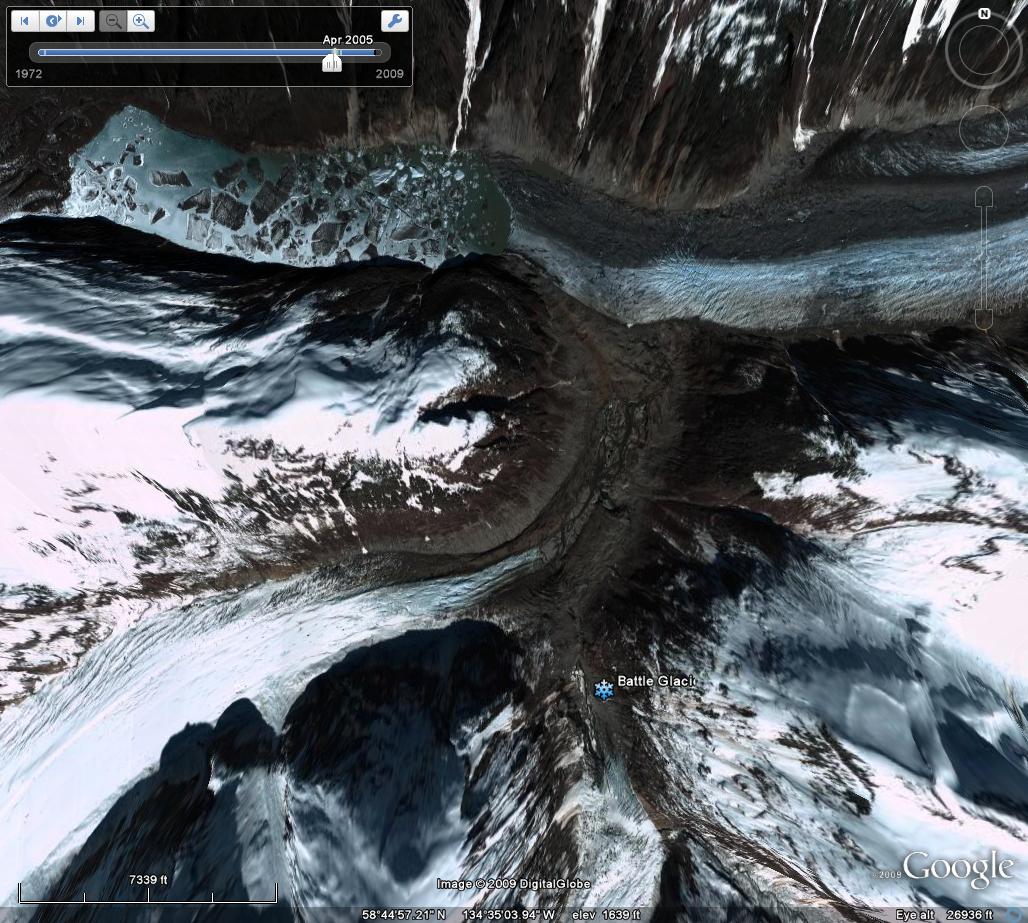 The lake is partly filled with large icebergs from disintegration of the, note below in an image from Scott McGee of JIRP,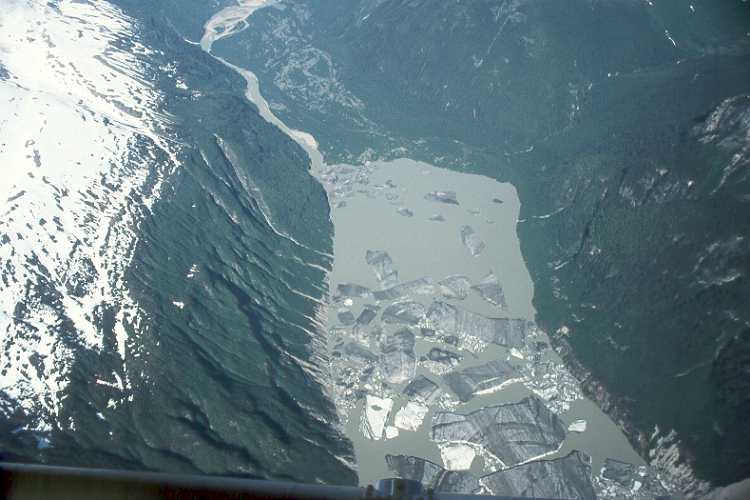

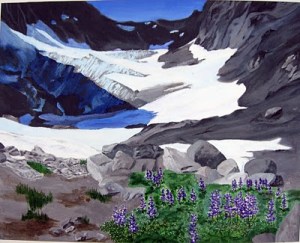 Despite the advantages of snow accumulation the glaciers mass balance since 1984 has average -0.5 m a year for a cumulative loss of 13 m. For a glacier that averages 60 m in thickness this is over 20% of its volume. Details of the
 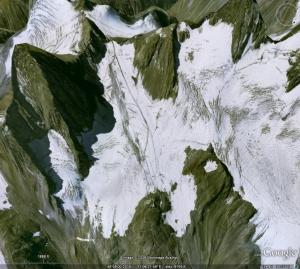 The Stubai Glacier has been retreating and thinning significantly as have most all glaciers in the Alps. Austria has a long term program monitoring the terminus position of over 100 glaciers. From 2000-2005 of the 115 glaciers observed and reported to the World Glacier Monitoring Service, all 115 experienced net retreat. The mass balance of Austrian glaciers, which represents volume loss, reported to the WGMS has been averaging a loss of more than 0.5 m per year since 1998. The loss of 5 m of ice in a decade on glaciers like the Stubai represents about 10% of their volume lost this decade. Stubai Glacier has experiences a 33% loss in its area since 1969 shrinking from 1.72 to 1.15 square kilometers
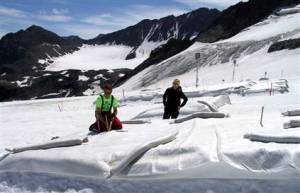 This technique reduced ablation by 60%. Is


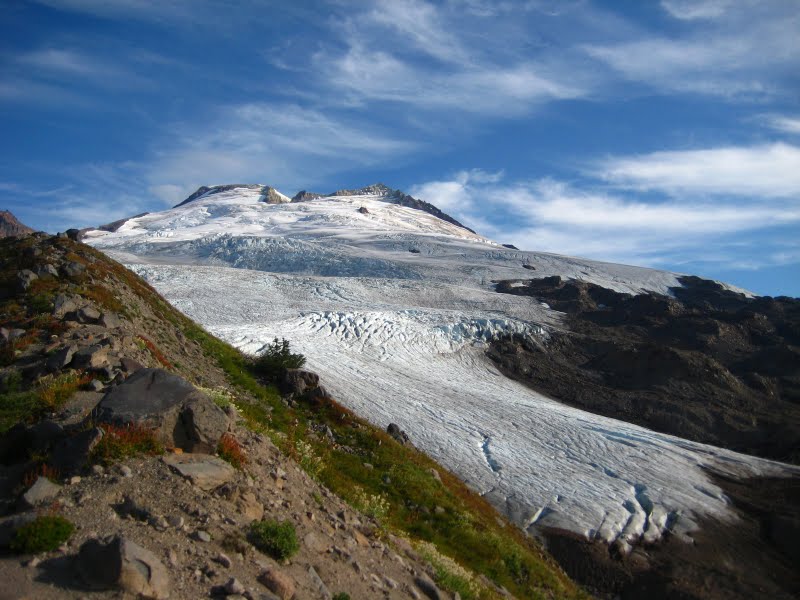
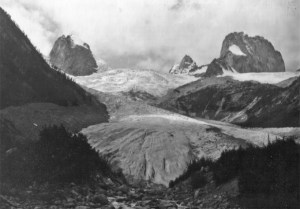 The glacier used to flow all the way to the valley bottom. The active front was both steep and crevassed By the early 1970’s the glacier had retreated from the valley bottom and had begun to retreat up the mountain slope adjacent to the Kain Hut. Snowpatch Spire is still surrounded by ice, but ice that is not as crevassed, indicating reduced thickness and velocity. The glacier than ended somewhat below where the ridge approached from the right of the glacier.
 In the ensuing 34 years the glacier has continued to retreat up the slope and is notably thinner coming down the final steep slope. The glacier ends at the termination of the ridge on the right of the glacier. The glacier has retreated 420 m since 1972.
  . The first view is nearly identical to the 1972 view and the second more similar to the 1910 view
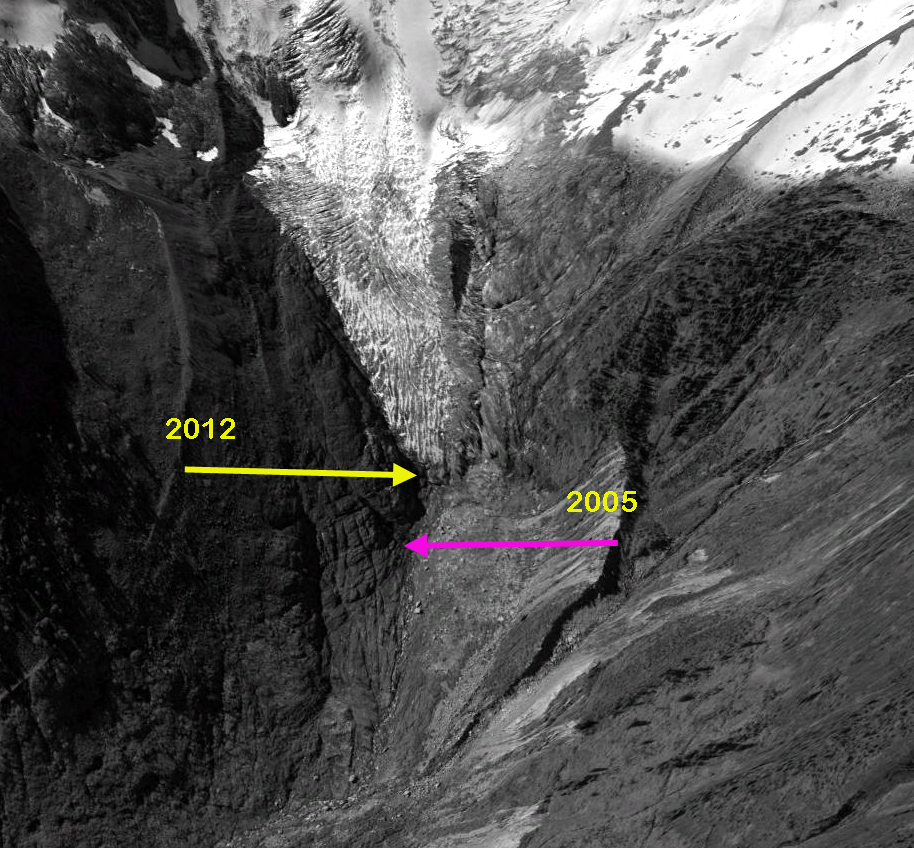
 A Google Earth image from 2005 of the terminus region indicates that the lower 700 meters of the current glacier is thin and lacks any crevasses indicating it nearly stagnant. By 2012 the terminus had retreated 80-90 m from 2005, yellow arrow indicates 2012 terminus, pink arrow 2005. This is in contrast to an active front, which indicates a healthy glacier, that would be thick and crevassed. A healthy glacier can still be retreating, the front was active at the time of my first visit to the glacier in 1984. The glacier is still 3.5 kilometers long and even after the retreat the glacier will still have a substantial length and area.
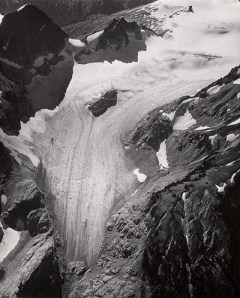 In 1995 we visited the margin of this lake, where the glacier ended in 1967 and took a photograph back to the glacier. As seen below retreat to this point was 400 m.
  A pair of images from Bill Arundell in 1973 and Lowell Skoog in 2006 indicate the scale of the retreat, these images do not show the actual terminus but do show the main nunatak-rock island and how much it has become exposed in the 33 years. This nunatak was hardly evident in 1960, and in a 1940 image of the glacier literally did not yet exist.
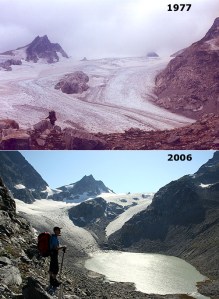 The terminus had retreated 400 m from the 1967 position to 1995. In 1987 a new lake began to form at the terminus of the glacier at 1680 m. The glacier is shown ending in this lake in 2002 from both the far end of the lake and the nunatak above the lake, the glacier had retreated 210 m since 1995. In 2006 the glacier retreated from the end of this lake. This is a shallow lake that may eventually be filled in by glacier sediments. The terminus is flat and stagnant ending at 1680 m in the lake. Thus, the rapid retreat will continue, the glacier is still not close to acheiving a post LIA equilibrium. Glacier retreat from 1940-1967 averaged 9 m/year. Retreat was minor between 1967 and 1979. The retreat rate since 1979 has been greater than 38 m/year, with a total retreat of 700 m. The nunatak in the middle of the glacier, which was beneath the ice in 1940 is now 90 m above the ice. The section of the glacier below the nunatak in 2002 is stagnant with no crevasses.
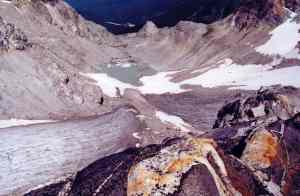 Indicating this glacier will retreat at least to the base of this rock knob, which will then no longer be a nunatak. A comparison of Google Earth Imagery from 1998 and 2009 illustrate the appearance of numerous new bedrock knobs in the area where there was an icefall in 1995.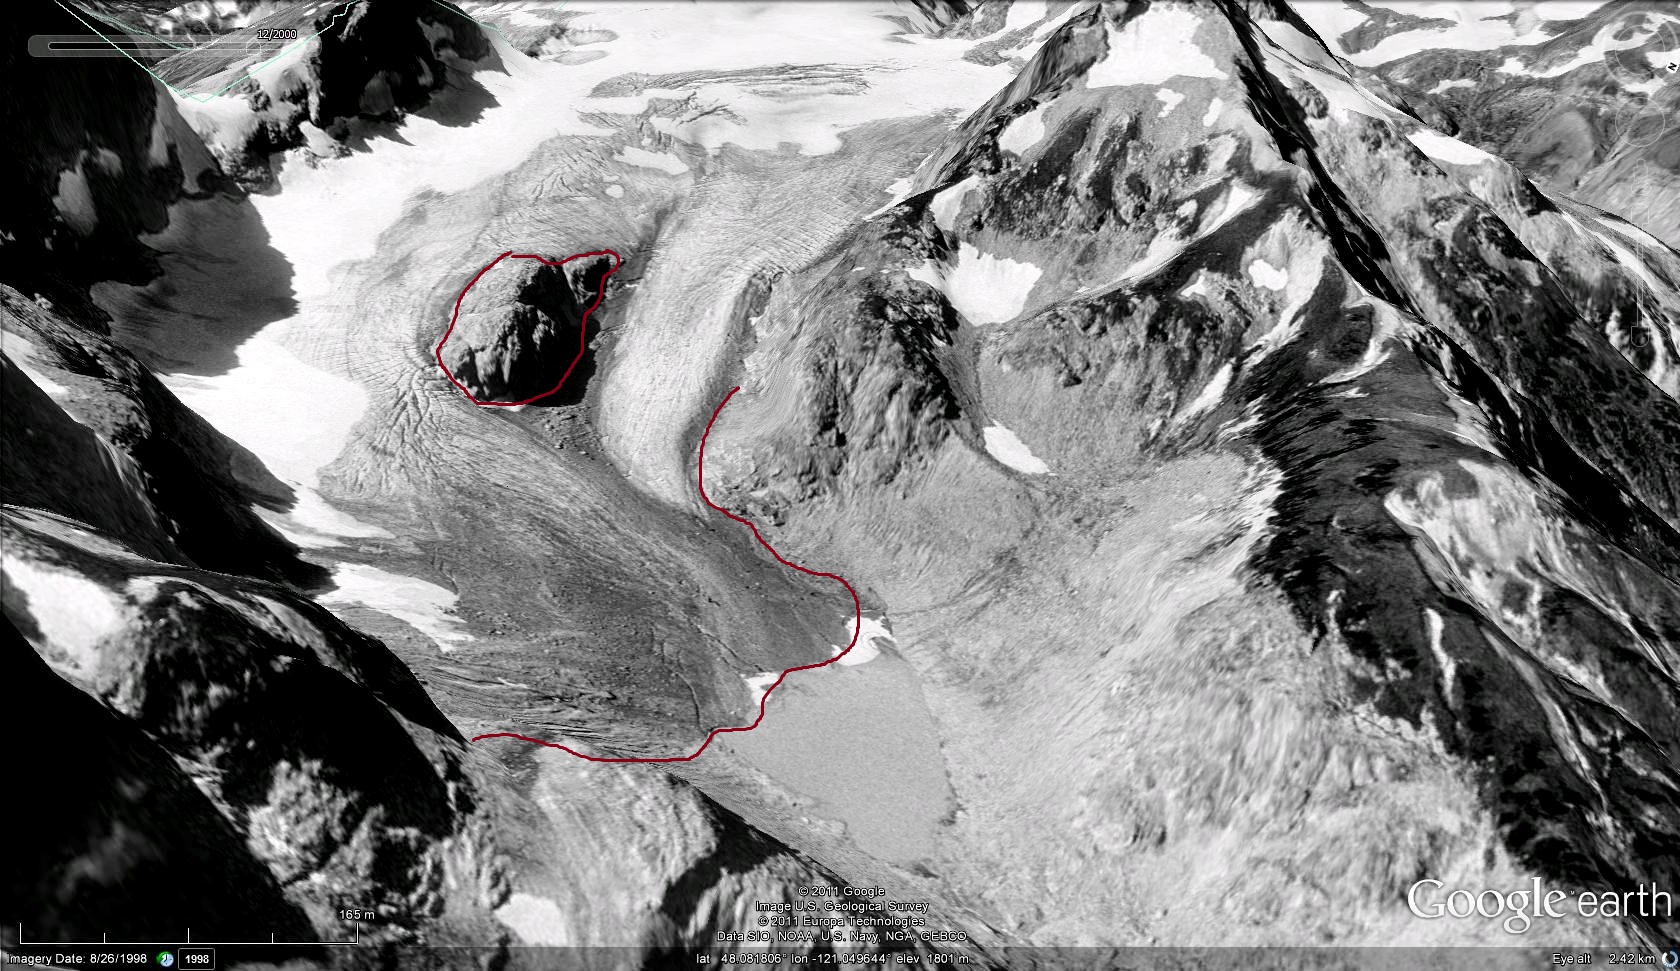


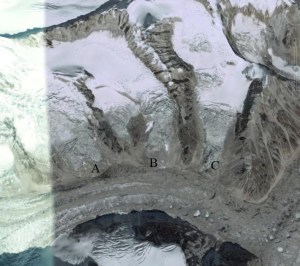
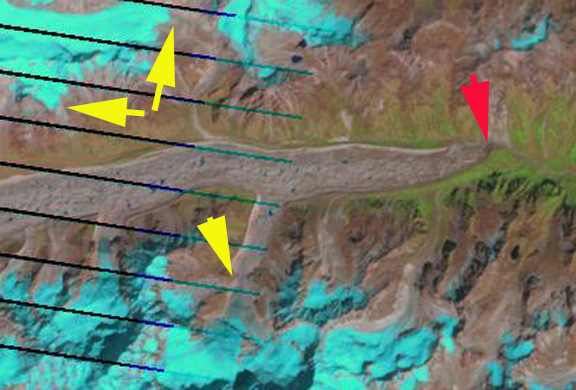
 Several of the tributaries no longer join the Zemu, depriving it of a portion of a portion of its former accumulation sources. Near the head of the glacier the walls of Kanchenjunga delivers the debris and large amounts of snow in the form of avalanches to the glacier basin at 5900 to 5200 m. The lower 18 km of the glacier is in the ablation zone where melt dominates. A comparison of 2000 and 2013 Landsat images indicates the lack of change in location of main terminus, red arrows, but recession of surrounding glaciers in the Zemu Basin, yellow arrows.