Kokthang Glacier Retreat, Sikkim Himalaya, India Doubles Lake Size

Kokthang Glacier in 1988 and Feb. 2018 Landsat imagery. The red arrow indicates the 1988 terminus and the yellow arrow the upstream end of the lake beyond which the glacier has retreated in 2018.  The purple dots indicate the snowline. 

Kokthang Glacier drains south from the Kokthang Peak a satellite peak on the south side of the Kanchenjunga Massif, Sikkim in India, the next valley south of East Rathong Glacier. This glacier drains into the Rangit River, which hosts a 60 MW run of river Rangit Hydropower project.  Here we examine changes in the glacier from 1988 to 2018. Glaciers draining east from Kanchenjunga have generally experienced substantial retreat and lake expansion (Govindha Raj et al 2013): Lhonak Glacier, Changsang Glacier etc.  The exception being Zemu Glacier which has been thinning, but not retreating substantially. NASA Earth Observatory posted an article based on this blog post.

In 1988 the debris covered terminus was in a 800 m long proglacial lake, after the two main tributaries joined.  The snowline was at 5500 m. In 2000 the lake has expanded significantly and only the western tributary is actively reaching the lake.  The snowline in 2000 is at 5400 m.  By 2005 glacier retreat of the stagnant tongue had led to a lake expansion to a length of 1300 m, Google Earth image on left below.  The snowline in 2005 is at 5500 m.  The eastern tributary no longer descended to the lake. By 2017 the lake had further expanded to a length of 1600 m.  The glacier retreat over the 30 year period being greater than the 800 m that represent a doubling of the proglacial lake size.  The glacier has now effectively retreated from the lake and only minor expansion will occur with ice cored moraine meltout. The snowline in October 2017 was at 5600 m. The snowline remained high from October to mid-winter as it had in most recent years, with the February 2018 snowline at 5600 m still.  This illustrates that ablation albeit, at a slow rate, is occurring from October-mid winter.

The persistent high snowline through much of the year leads to continued thinning and retreat of the lower glacier. The high snowlines have been seen in the Mount Everest area and on Gangotri Glacier.  The upper glacier continues to retain snowcover indicating the glacier can survive current climate.


Kokthang Glacier in 2000 and 2017 Landsat imagery. The red arrow indicates the 1988 terminus and the yellow arrow the upstream end of the lake beyond which the glacier has retreated in 2018.  The purple dots indicate the snowline. 

Google Earth imagery from 2005 and 2014 of Kokthang Glacier. 


Gurudongmar Glacier Retreat and Teesta River Hydropower, Sikkim

Gurudongmar Glacier draining ton Gurudongmar Lake B in Landsat images from 1996 and 1998 and Sentinel image from 2016.Red arrow is the 1996 terminus and yellow arrow the 2016 terminus.Point M indicates a terminal moraine belt, impounding the lake

Teesta Urja Limited is this month finishing the 1200 MW Teesta Stage III hydro power project on. The project is a run of the river scheme in the North Sikkim district. The dam is at the Chugthang Village just below the confluence of the Lachen River and Lachung River and the power house is 15 km downstream at Singhik. The project utilizes the fall of head in the River course, of about 800 meters between these two villages.  This project is a part of overall development of Teesta basin being undertaken by Sikkim Government. The project is run of the river designed to generate 5,214 Million kWh (units) annually in 90 per cent dependable year, as per the information provided. This project adds to the existing hydropower on the Teesta River, such as the  510 MW Teesta V, also highly dependent on glacier runoff.  The area of lake “B” in the Gurudongmar Cho Complex has increased nearly 4 times between 1965 and 1989. The significant increase in the areas of lakes “B” and adjacent “C” is a clear indicator of the glacier retreat/melt. Between 1989 and 2010, Gurudongmar Cho “B” has grown by one-sixth of its size in 1989 (Kumar and Prabhu, 2012). An inventory of Sikkim glacier lakes shows the existence of 320 glacial lakes,  85 are new ones in the study area compared to 2003 inventory, due to the ongoing retreat (Govindha Raj et al, 2012)

Like all glaciers in this region Gurudongmar Glacier is a summer accumulation type glacier. This means that the glacier receives most ~80% of its snowfall during the summer monsoon. This is also the period when ablation low on the glacier is highest. Following the summer monsoon which ends in early September there is a transition period with some colder storm events where the snowline drops. Than from November-February is the dry winter monsoon with limited precipitation. Thus, strange compared to most glaciers as winter proceeds often the lower glacier remains snow free.  Here we examine 1996 to 2016 Landsat and Sentinel images to identify change.  In 1996 the glacier terminates in the lake, just where the lake narrows significantly.  In 1998 the terminus remains at the same location, the shading better identifies the calving front.  Point M is the wide and stable moraine belt that impounds the lake.  This suggests a limited GLOF risk. By 2016 the terminus has retreated  600 m since 1987 through a narrow lake extension.  The glacier terminus based on the icefall that almost reaches the terminus, is nearing the upglacier end of the lake.  This should lead to a reduction in the retreat rate.  The retreat distance is substantial given the length of the glacier is 25% of the 1996 glacier length of 2.4 km.  The retreat of this glacier is similar to that of other glaciers in the basin such as Middle Lhonak Glacier, South Lhonak Glacier  and Changsang Glacier.

Google Earth image of Gurudongmar Glacier, indicating terminus location. Note icefall almost reaching shore.

Google Earth image from 2004 indicating s, terminus position in 2014 yellow arrow and icefall purple arrow.

Google Earth image from 2014 indicating glacier flow blue arrows, terminus position yellow arrow and icefall purple arrow.

Samudra Tapu Glacier, India Accelerated Retreat 1998-2016

samudra-tpa-compare

Landsat Comparison from 1998 and 2016 of Samudra Tapu Glacier, India.  Red arrow is the 1998 terminus, yellow arrow the 2016 terminus, green arrow a subsidiary glacier tongue, red line and dots the snowline and pink arrow an area indicating a water level decline in the lake. 

Samudra Tapu Glacier is one of the largest in the Chenab Basin, India. Maanya et al (2016) indicate the glacier terminates at 4150 m and is 16 km long and has an area of 62.5 square kilometers. In a glacier inventory in the basin by Kulkarni et al (2007) the 466 glaciers in the basin were observed to have lost 21% of their total area from 1962 to 2001. This study coordinated by the Space Applications Centre of the Indian Space Research Organization, has combined field observations of the glacier with remote sensing to observe the changes in area and length of the glaciers. The Chenab River also provides 690 MW of hydropower at the Salal Hydroelectric Project

In this post we use 1998, 2002 and 2016 Landsat imagery to examine the terminus of this glacier.  The terminus in 1998 is in an expanding proglacial lake and the snowline is at 5200 m.  In 2002 the glacier has retreated a short distance since 1998 and the snowline is at 5300 m.  Note that the smaller glacier tongue at the green arrow is disappearing. An October 2016 image indicates a further lake expansion and a glacier retreat of 600 m since 1998.  The lake level has also fallen as evident by the expansion of peninsula areas in the lake, pink arrow. A Sentinel 2 image from November 11, 2016 indicates the snowline is higher than in October or during the other years observed at 5400 m. The lower glacier is heavily debris covered, has a low slope and is essentially stagnant in its lowest 1 km, note image below from Anil Kulkarni. These factors will lead to continued retreat. There are some remarkably long supraglacial streams, the longest is 3.5 km long, that further illustrate the slow velocity of the lower glacier.  This is in a region where ice thickness is 100-200 m, see image below  Maanya et al (2016). Neither glacier is at the end of the melt season.   The glacier at the green arrow has retreated well upvalley from the green arrow.  This glacier is not calving into a lake and is retreating faster than Samudra Tapu.  This suggests that the debris cover is reducing melting more than the lake is enhancing melting. In November 2016 the snowline is at 5400 m.  An ELA of 5300+ meters leaves an accumulation area insufficient to maintain the current glacier size. In 1970 the ELA was at 4900 meters Kulkarni et al (2007) .  The retreat of Samudra Tapu is noted by Kulkarni (2006) as 20 meters/year during the 1962-2000 period. From 1998 to 2016 the glacier retreated nearly 600 m, closer to 30 meters/year. The retreat of this glacier is less than that of other large glaciers nearby Sara Umaga and Gangotri, but similar to Durung Drung Glacier.

samudra-tupa-sentinel-11-11-16

Sentinel 2 image from 11/11/16.  Red arrow is the 1998 terminus, yellow arrow the 2016 terminus, red dots the snowline.

sumadra-tupa-2002

Landsat image from 2002.  Red arrow is the 1998 terminus, yellow arrow the 2016 terminus, green arrow a subsidiary glacier tongue, red  dots the snowline.

sumadra-tupa-kulkarni-300x224

Image of the debris covered stagnant terminus of Samudra Tapu from Anil Kulkarni taken in 2006

samudra-tupa-supraglacial


samudra-tupa-depth

The above figure is from Maanya et al (2016).

Chilung Glacier Retreat, India

East of the Chilung La and 20 km northwest of Durung Drung Glacier draining into the Sankpo (Suru) River is an unnamed glacier, here referred to as Chilung Glacier. The Suru River flows northwest from Pensi La, while the Zanskar River flows southeast from the Pensi La. The Suru River has a 44 MW hydropower project at Chutak. The glacier is 6 km long starting at 5400 m and terminating at 4400 m.
drung drung map
Topographic map of region

chilung Glacier
Google Earth image

An examination of Landsat imagery from 1998-2013 indicate the expansion of a proglacial lake at the terminus and glacier retreat. The 1998 terminus is marked by a pink arrow in each image. The yellow and green arrow indicate adjacent small glaciers. In 1998 the proglacial lake is 1100 m long and in 2000 it is 1200 m long. By 2005 the glacier has retreated 200 m and the lake is 1400 m long. In 2013 the lake is 1650 m long, and the glacier has retreated 400-450 m since 1998. The retreat rate of 30 m/year is slightly faster than on Durung Drung. A comparison of the adjacent small glaciers on the slopes above Chilung Glacier, yellow and green arrows, from 2000 to 2013 indicate a loss in area of these glaciers as well. Google Earth imagery in 2000 indicates that lower 900 m of the glacier is uncrevassed and relatively stagnant, by 2013 half of this area has been lost. The lake is shallow and may not expand much further as the glacier retreats. The consistent nature of the retreat in this area was noted by Kulkarni (2014)indicating retreat of 12 of the 13 observed glaciers in the region during recent decades. Glacier thinning has exceeded the rate of retreat on many glaciers in this area, indicating that retreat is likely to increase. chilung glacier 1998
1998 Landsat image

chilung 2000
2000 Landsat image

chilung 2005
2005 Landsat image

chilung 2013
2013 landsat image
chilung glacier terminus
2000 Google Earth image

Himalayan Glacier Change Index

Himalaya Range Glacier Change Below is a list of individual glaciers in the Himalaya that illustrate what is happening glacier by glacier. In addition to the individual sample glaciers we tie the individual glaciers to the large scale changes of approximately 10,000 glaciers that have been examined in repeat satellite image inventories. In the Himalayan Range, stretching from the Karokaram Range in NW India east south east to the border region of Bhutan and China,  detailed glacier mapping inventories, from GLIMS: (Global Land Ice Measurements from Space), ICIMOD (International Centre for Integrated Mountain Development), ISRO ( Indian Space Research Organisation) and Chinese National Committee for International Association of Cryospheric Science (IACS) of thousands of glaciers have indicated increased strong thinning and area loss since 1990 throughout the the Himalayan Range. The inventories rely on repeat imagery from ASTER, Corona, Landsat, IKONOS and SPOT imagery. It is simply not possible to make observations on this number of glaciers in the field.  This is an update to the assessment by Pelto (2012) in the BAMS State of the Climate, which was the source of a Skeptical Science article as well

Kali Gandaki Headwaters, Nepal——–Ngozumpa Glacier, Nepal

Khumbu Glacier, Nepal ————         West Barun Glacier, Nepal 

Imja Glacier, Nepal ——–                       Nobuk Glacier, Nepal

Lumding Glacier, Nepal———-

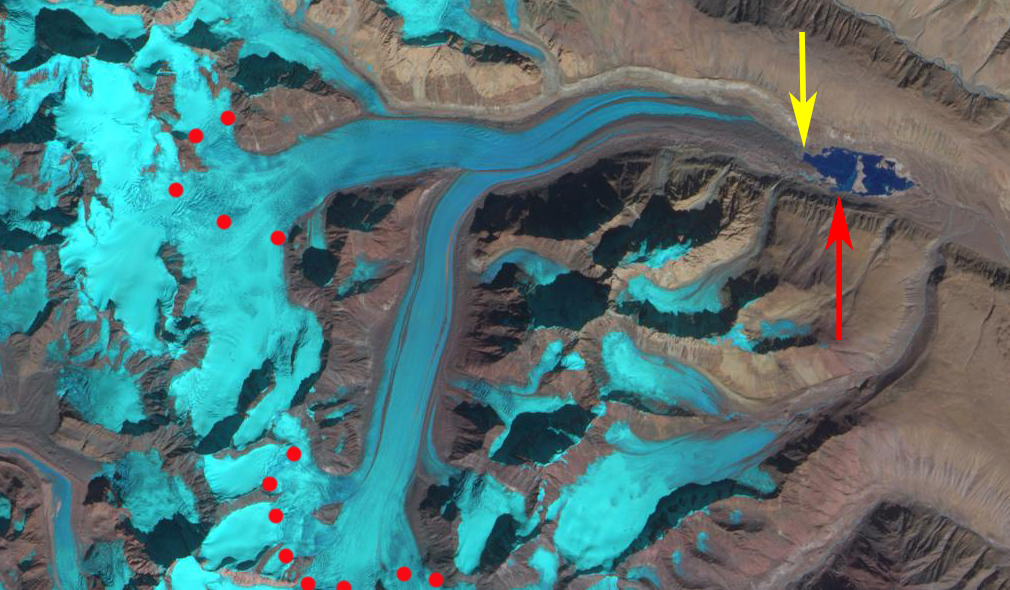
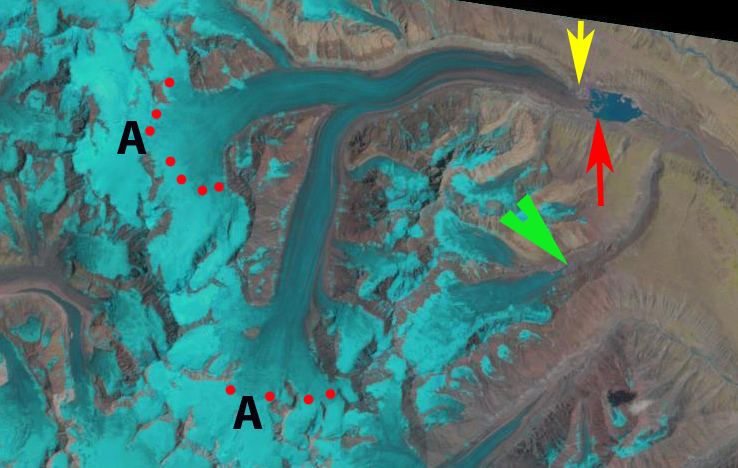
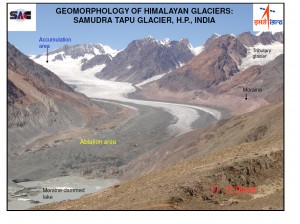
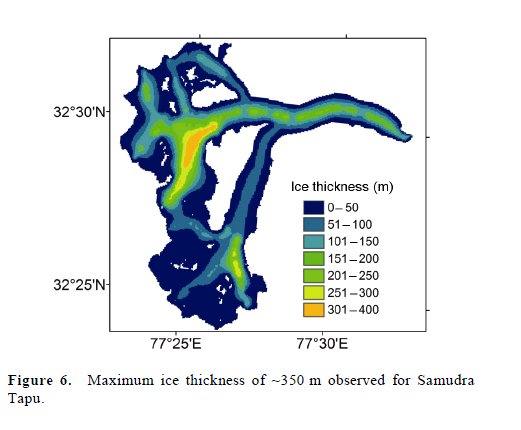
Milam Glacier, India————                Samudra Tupa, India

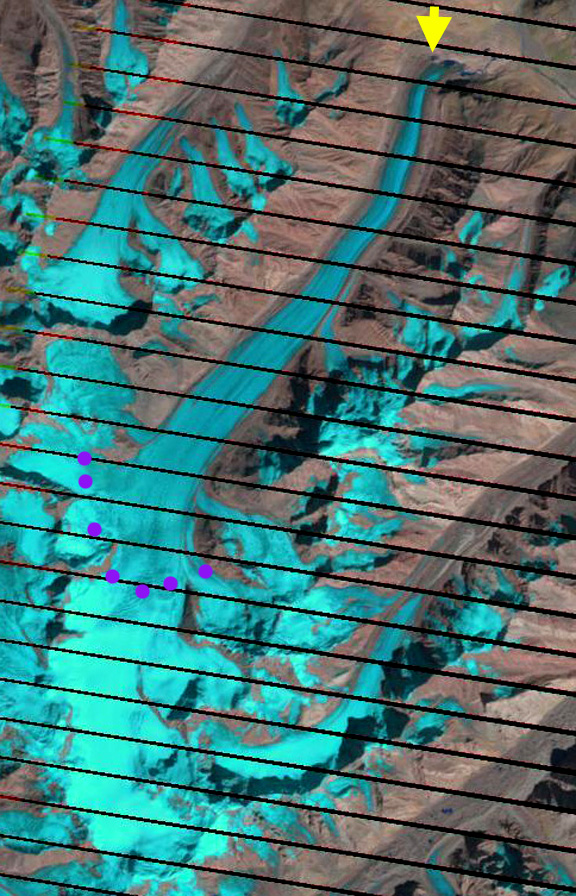
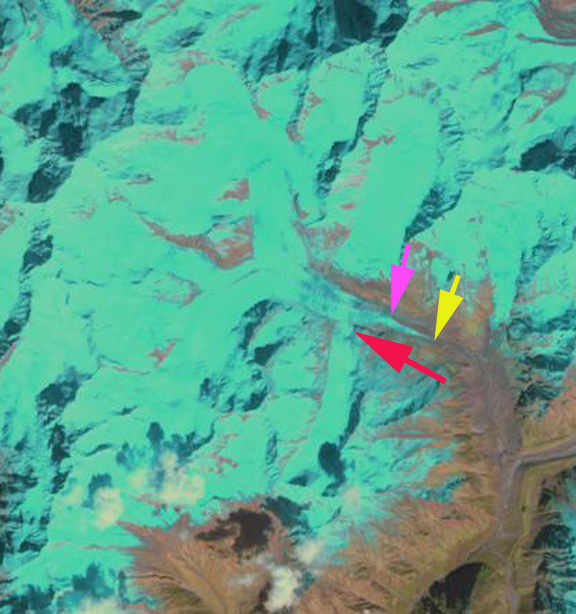
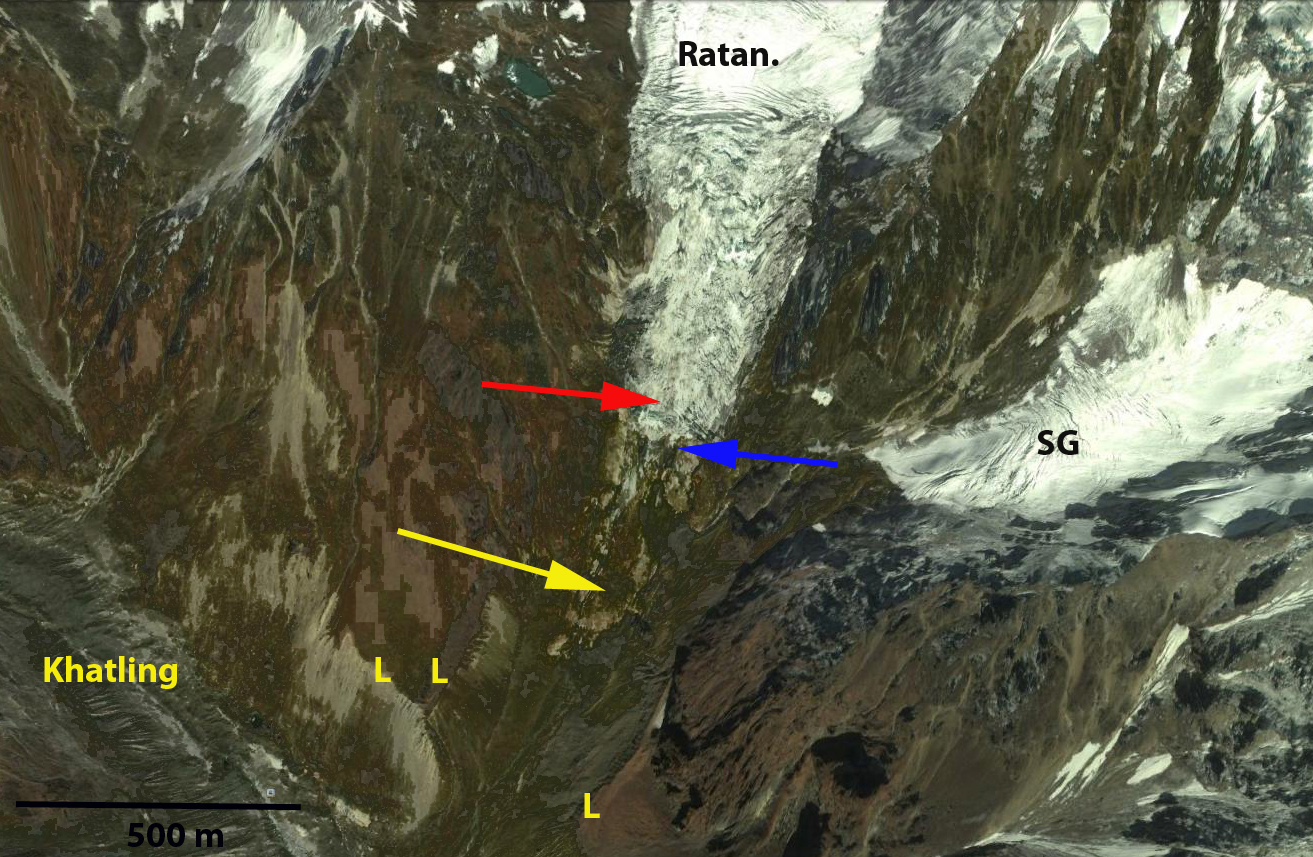
Ratangrian Glacier, India———–       Khatling Glacier, India

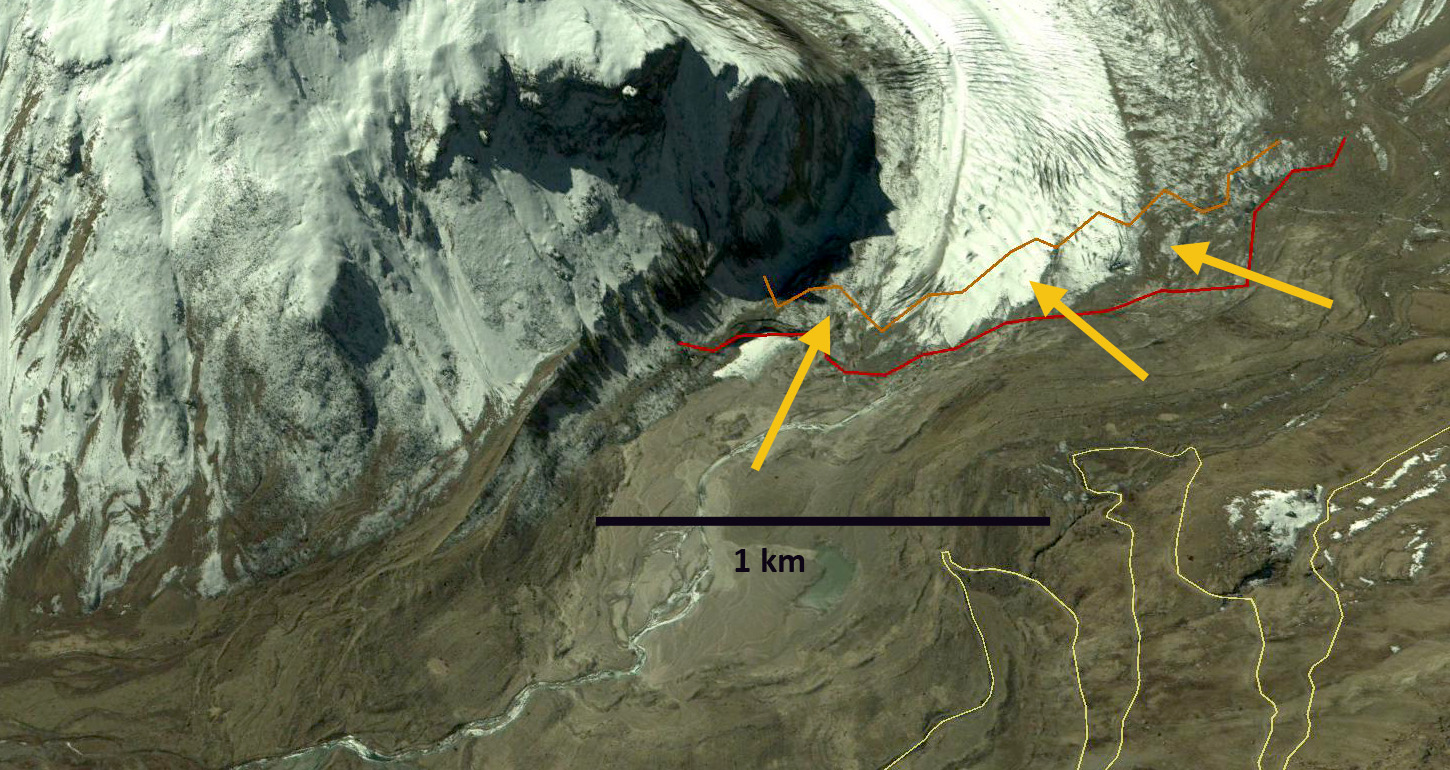
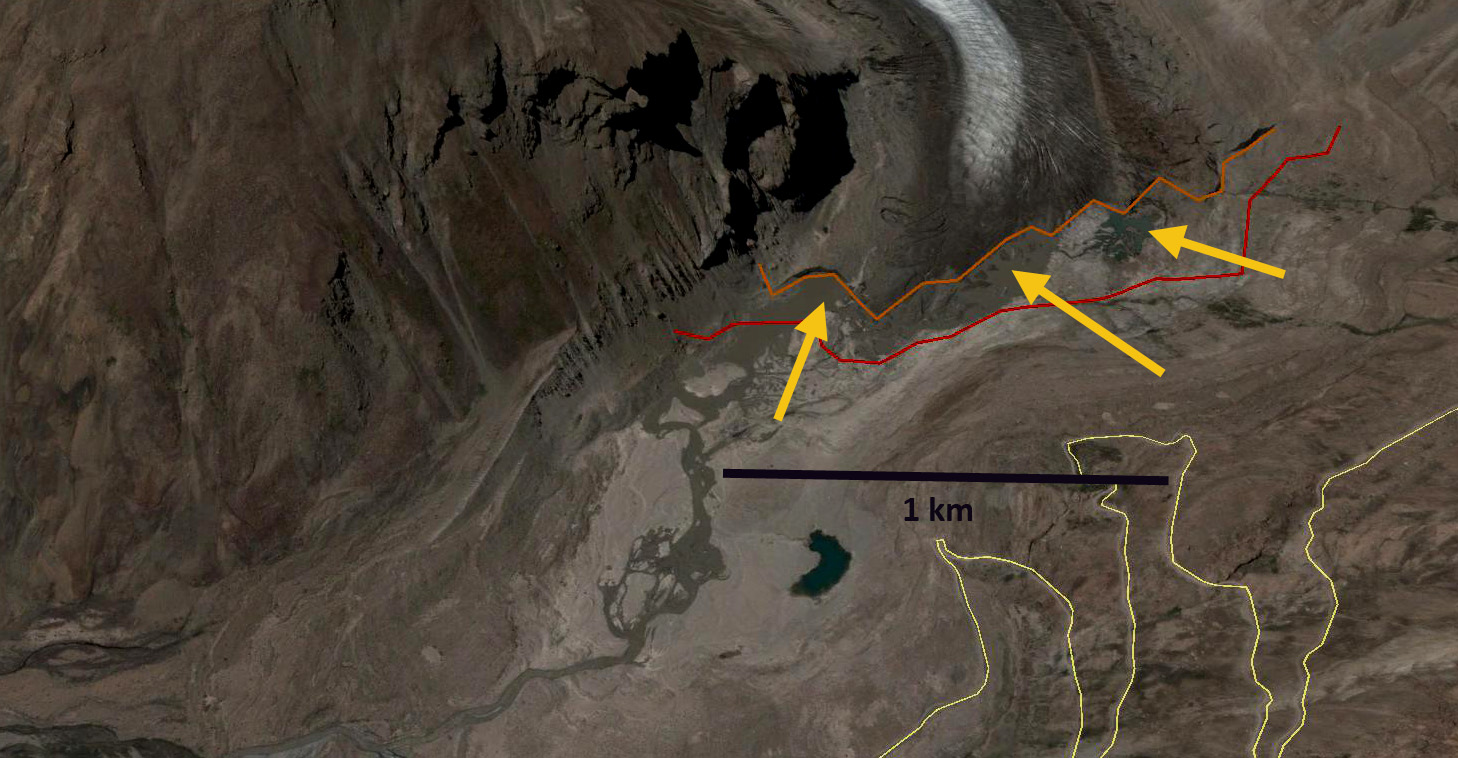
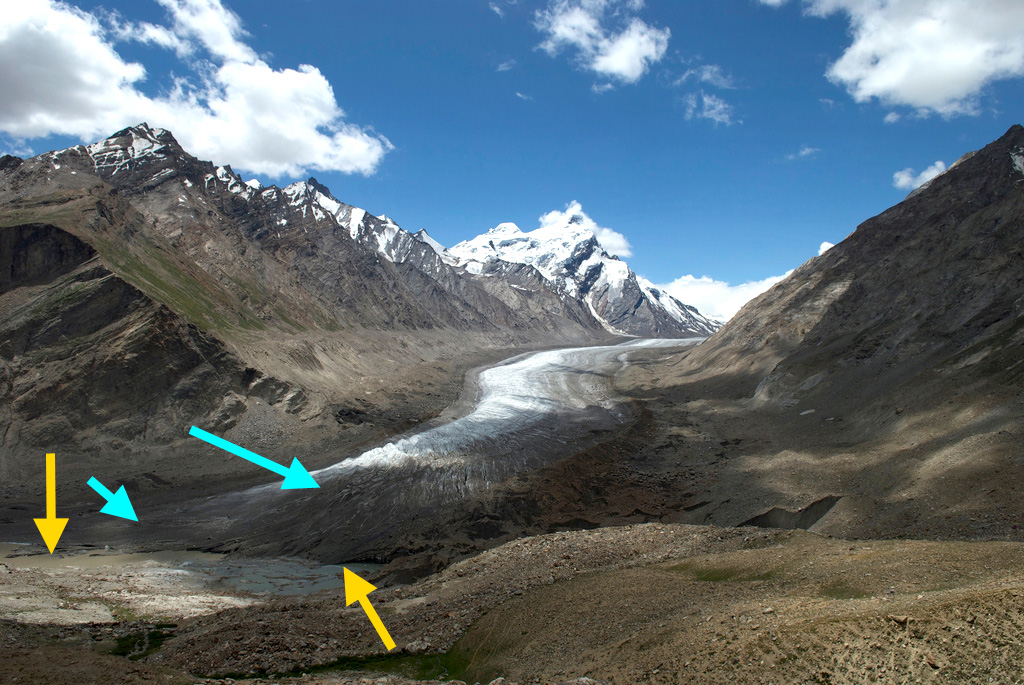
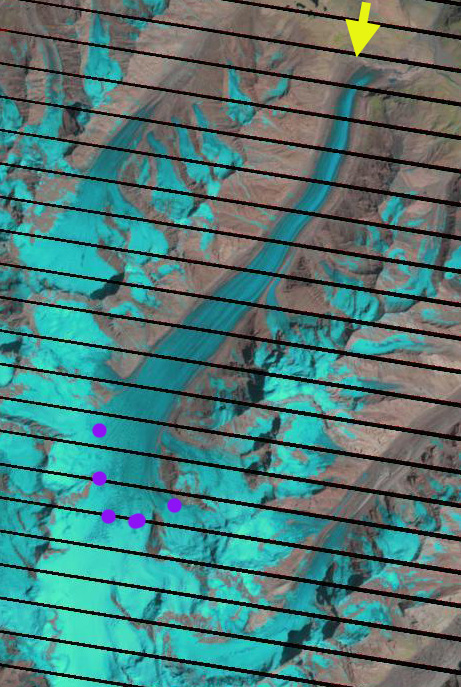
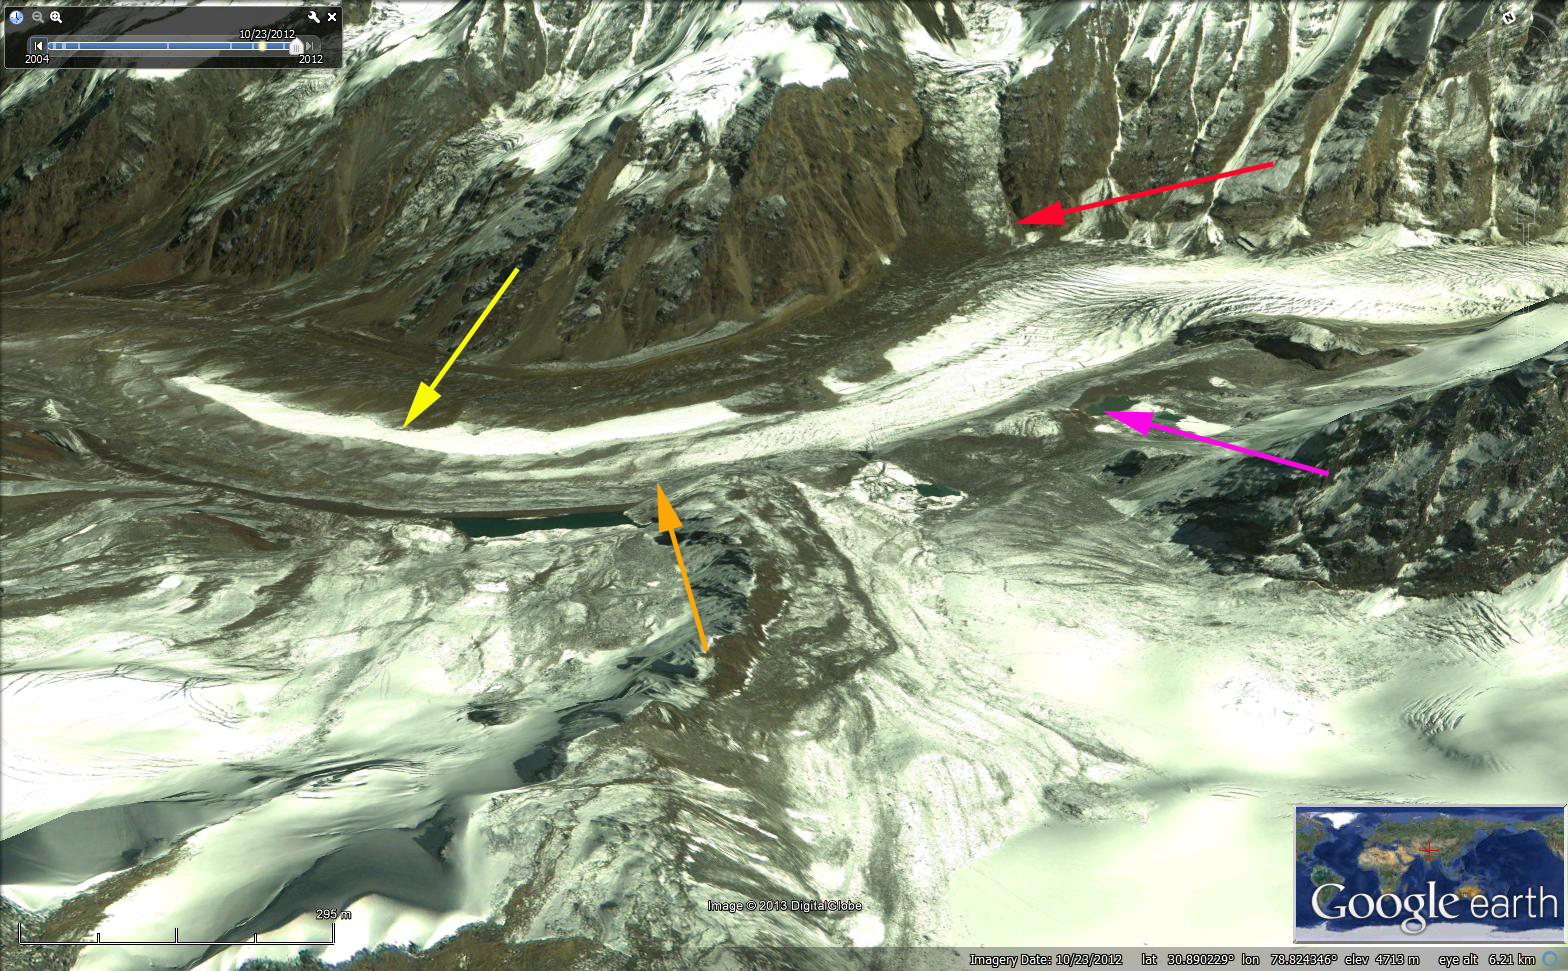
Satopanth Glacier, India———-         Durung Drung Glacier, India

Gangotri Glacier, India————         Warwan Basin, India

Sara Umaga Glacier, India—–          Malana Glacier, India 

Jaonli Glacier, India——–                  Kalabaland Glacier, India  

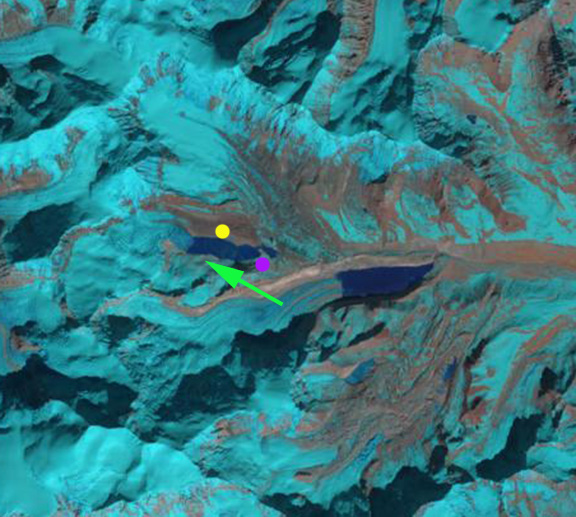
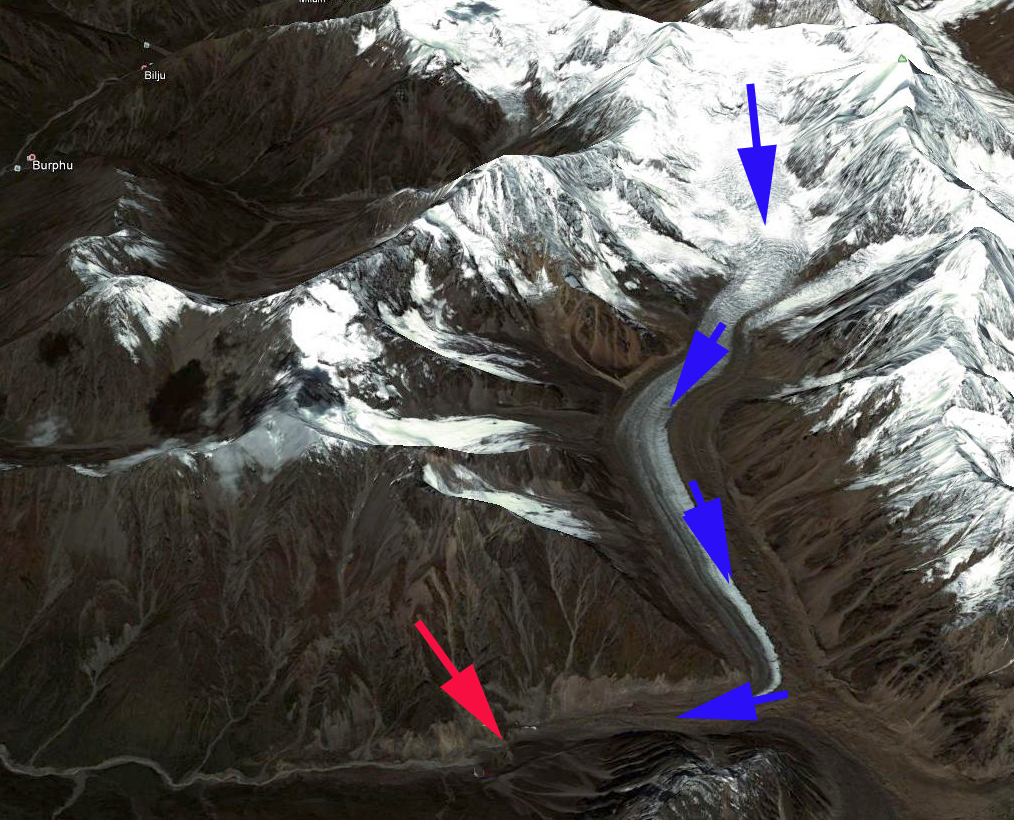
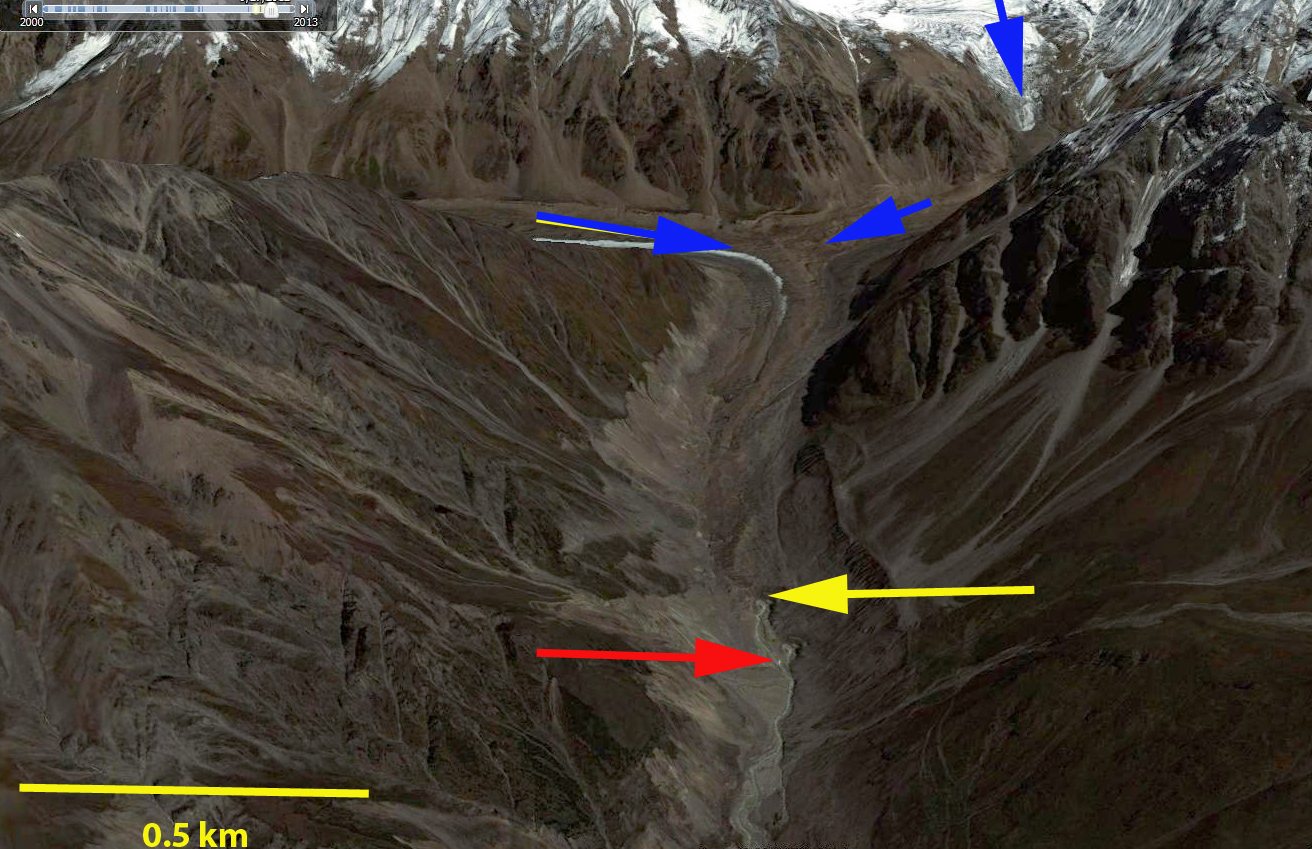
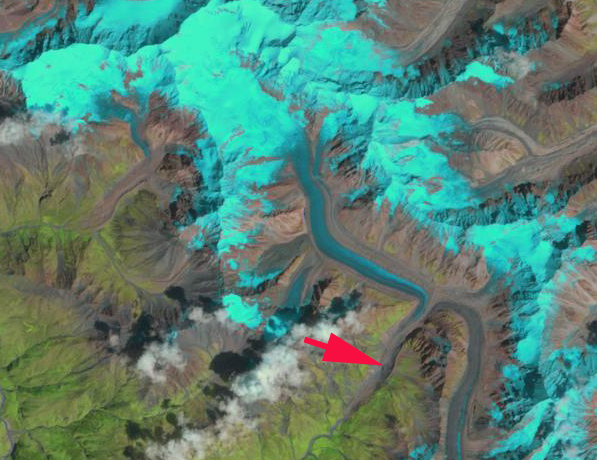
Jaundhar Barak, India———–         Burphu Glacier, India

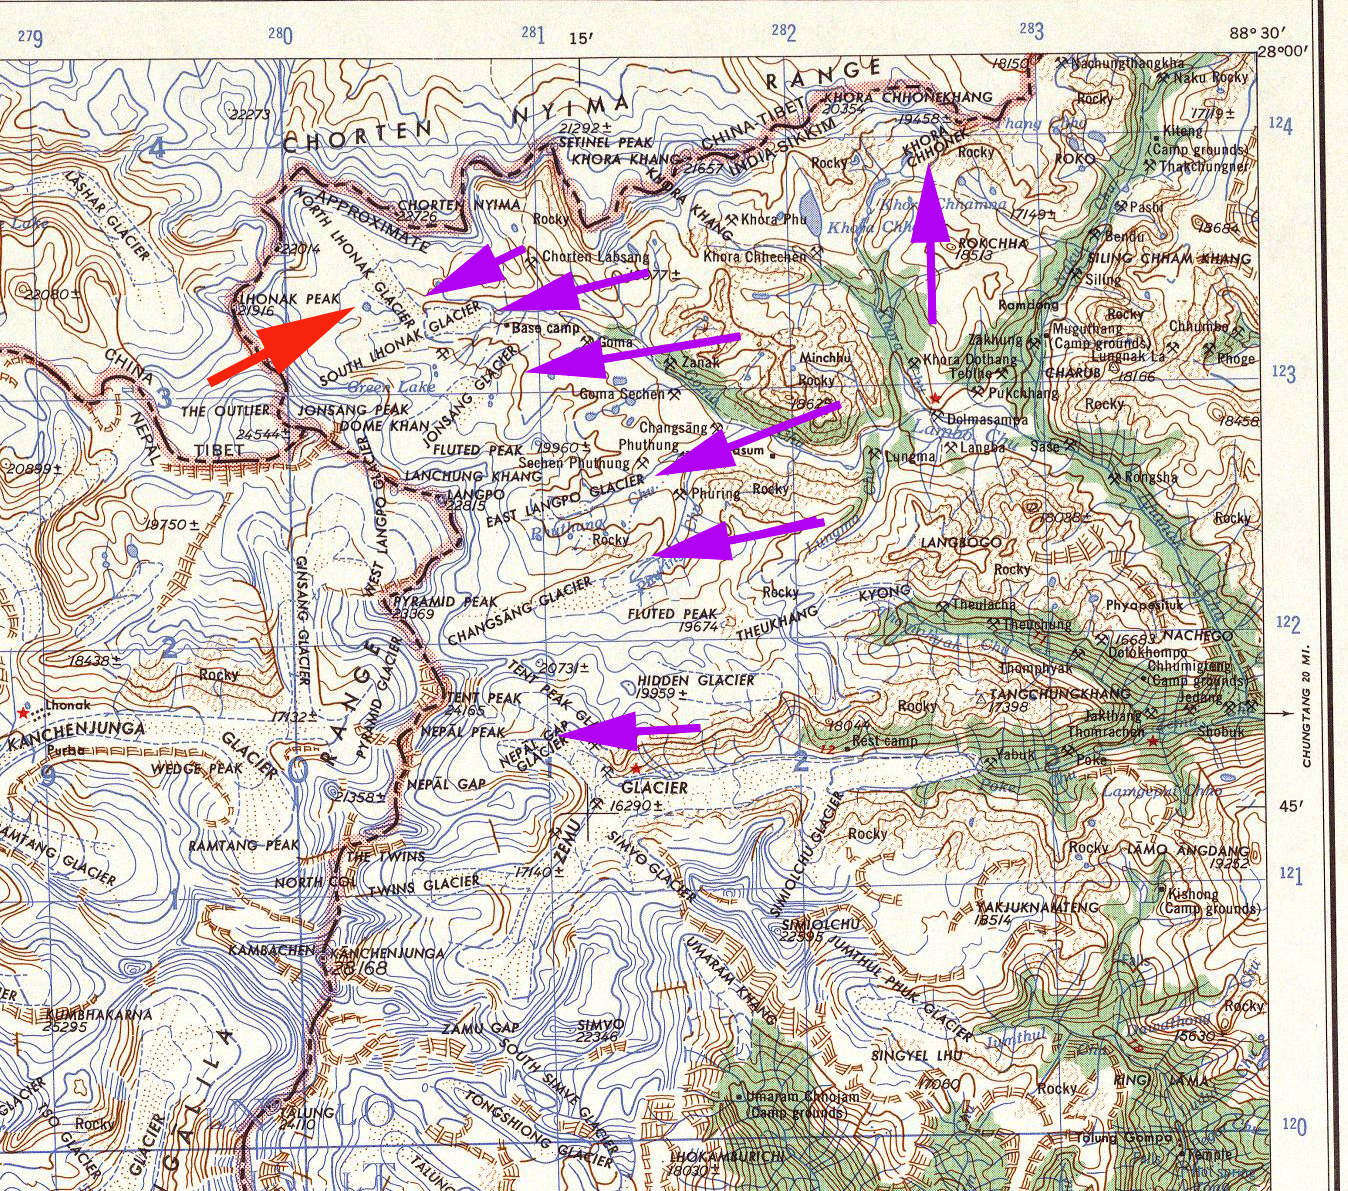
Changsang Glacier, Sikkim—–     Zemu Glacier, Sikkim 

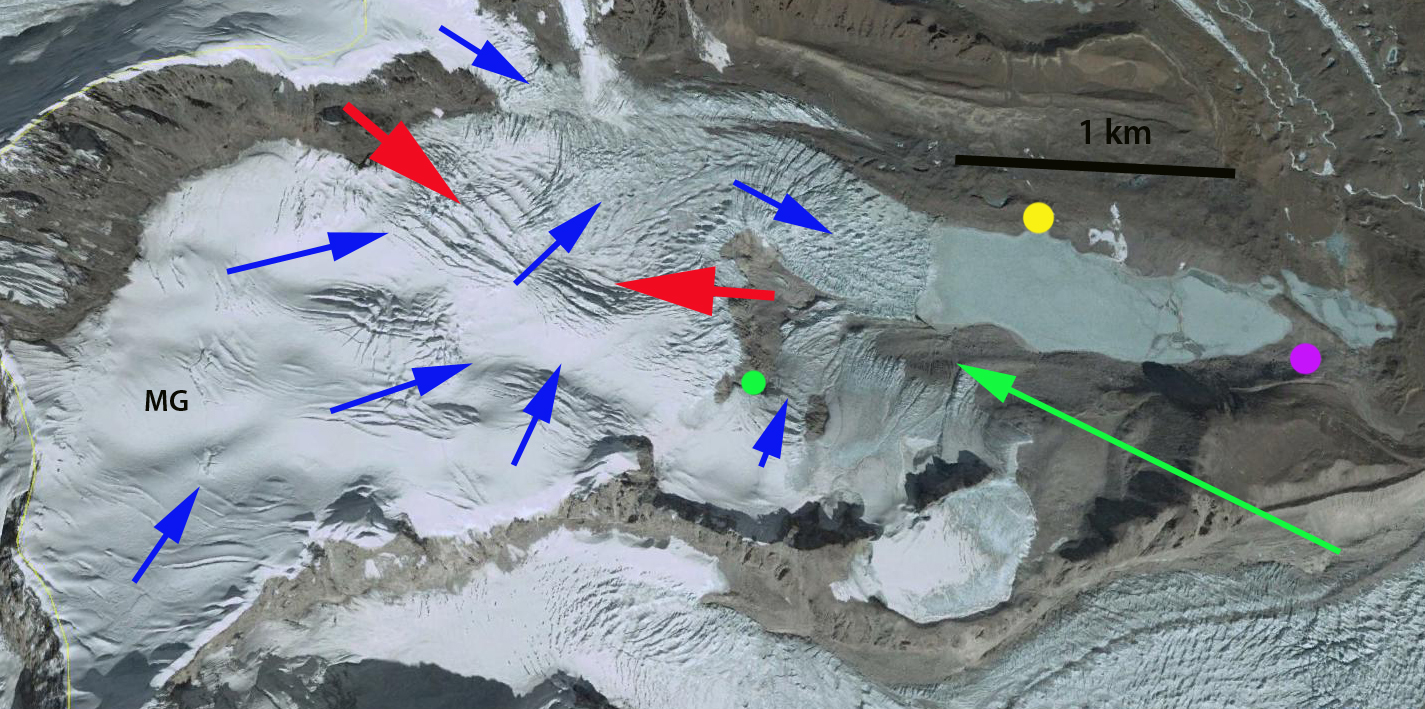
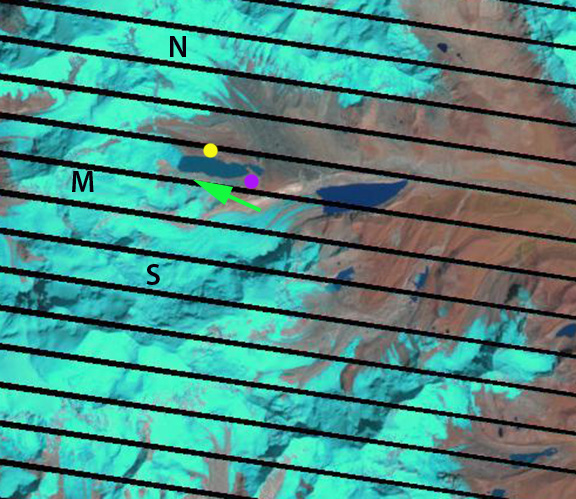
South Lhonak Glacier, Sikkim——North Lhonak Glacier, Sikkim

Theri Kang Glacier, Bhutan———-Luggi Glacier, Bhutan

Mangde Chu Glacier, Bhutan——–Thorthormi Glacier, Bhutan

Menlung Glacier, Tibet———-       Yejyumaro Glacier, Tibet

Lumding Glacier, Tibet—-             Rongbuk Glacier, Tibet

Sepu Kangri, China———–          Longbasba Glacier, Tibet

Jiongla Glacier, Tibet———-        Bode Zanbo Headwaters, Tibet

Zayul Chu Headwaters, TibetBoshula Glaciers, Tibet

Matsang Tsanpo Gl, Tibet—–    Reqiang Glacier, Tibet 

Himalaya-Small

In Garhwal Himalaya, India, of 58 glaciers examined from 1990-2006 area loss was 6% (Bhambri et al, 2011). They also noted the number of glaciers increased from 69 (1968) to 75 (2006) due to the disintegration of ice bodies. Examination of 466 glaciers in the Chenab, Parbati and Baspa Basin, India found a 21% decline in glacier area from 1962 to 2004 (Kulkarni, 2007). Glacier fragmentation was also observed in this study, which for some fragments represents a loss of the accumulation area, which means the glacier will not survive (Pelto, 2010). The India glacier inventory (ISRO, 2010) identified glacier area losses and frontal change on 2190 glaciers and found an area loss rate of 3.3% per decade and 76% of glaciers retreating. (Kulkarni, 2014) reports on Indian Himalyan glaciers  that 79 of 80 with terminus change records have been receding.

In the Nepal Himalaya area loss of 3808 glaciers from 1963-2009 is nearly 20% (Bajracharya et al., 2011). The Langtang sub-basin is a small northeast-southwest elongated basin, tributary of Trishuli River north of Kathmandu and bordered with China to the north. The basin contained 192 km2 of glacier area in 1977, 171 km2 in 1988, 152 km2 in 2000 and 142 km2 in 2009. In 32 years from 1977 to 2009 the glacier area declined by 26% (Bajracharya et al., 2011). In the Khumbu region, Nepal volume losses increased from an average of 320 mm/yr 1962-2002 to 790 mm/yr from 2002-2007, including area losses at the highest elevation on the glaciers (Bolch et al., 2011).  The Dudh Koshi basin is the largest glacierized basin in Nepal. It has 278 glaciers of which 40, amounting to 70% of the area, are valley-type. Almost all the glaciers are retreating at rates of 10–59 m/year and the rate has accelerated after 2001 (Bajracharya and Mool, 2009).  ICIMOD (2013) completed an inventory of Nepal glaciers and found a 21% decline in area from the 1970’s to 2007/08.  ICIMOD has developed an  map viewer application for examining the changes through time.

An inventory of 308 glaciers in the Nam Co Basin, Tibet, noted an increased loss of area for the 2001-2009 period, 6% area loss (Bolch et al., 2010). Zhou et al (2009) looking at the Nianchu River basin southern Tibet found a 5% area loss. 1990-2005. In the Pumqu Basin, Tibet an inventory of 999 glacier from the 1974 & 1983 to 2001 indicated the loss of 9% of the glacier area and 10% of the glaciers disappeared (Jin et al, 2005). The high elevation loss is also noted in Tibet on Naimona’nyi Glacier which has not retained accumulation even at 6000 meters. This indicates a lack of high altitude snow-ice gain (Kehrwald et al, 2008).

A new means of assessing glacier volume is GRACE, which cannot look at specific changes of individual glaciers or watersheds. In the high mountains of Central Asia GRACE imagery found mass losses of -264 mm/a for the 2003-2009 period (Matsuo and Heki, 2010). This result is in relative agreement with the other satellite image assessments, but is at odds with the recent global assessment from GRACE, that estimated Himalayan glacier losses at 10% of that found in the aforementioned examples for volume loss for the 2003-2010 period (Jacobs et al, 2012). At this point the detailed glacier by glacier inventories inventories of thousands of glaciers are better validated and illustrate the widespread significant loss in glacier area and volume, though not all glaciers are retreating. This page will continue to be updated as new inventory data is published and new individual glaciers are examined herein. Yao et al (2012) in an examination of Tibetan glaciers observed substantial losses of 7090 glaciers.  Bolch et al (2012) in a report on the “State and Fate of Himalayan Glaciers” noted that most Himalayan glacier are losing mass and retreating at rates similar to the rest of the globe.  ICIMOD has also developed an application illustrating changes of glaciers in Bhutan.

Durung Drung Glacier Retreat, Zanskar, India

The Durung Drung Glacier (Drang Drung) is a frequently seen glacier from the unpaved Kargil-Leh road in the Zanskar, Lakdakh region of India that flows north from the slopes of Doda Peak. This road climbs up the Suru River valley from Kargil, crosses Pensi La Pass crosses the front of the Durung Drung Glacier and descends the Zanskar River valley to Nimoo. The Zanskar River joins the Indus River just above the village of Nimoo. The Nimoo Bazgo Hydroelectric Project opened in 2012 and provides 45 MW of power to the Ladakh Region. Chris Rubey has a nice image of this power plant. This is a run of river project, that does not alter the downstream flow, but it does have a reservoir that stores 120,000,000 gallons of water, as seen in a 2013 Landsat image.

durung drung 1998a
1998 Landsat Image show flowlines fro Durung Drung Glacier

nimoo Bagzo 2013
2013 Landsat image of the dam and reservoir for the Nimoo Bagzo Hydropower Project

There have a few inaccurate reports of late that this glacier is not currently retreating. Here we examine Landsat and Google Earth imagery from 1998 to 2013 to identify the magnitude of the recent retreat. In Landsat images in 1998 there were no evident proglacial lake at the terminus of the glacier, red arrow. By 2013 a series of proglacial lakes are evident in Landsat images at the terminus red arrow. Looking at the higher resolution Google Earth imagery from 2004 and 2013. The retreat and development of the lakes is apparent. In each image the red line is the 2004 terminus and the brown line the 2013 image, orange arrows indicate three lakes that have formed by 2013. The retreat is 200-250 m not large for a glacier of this size but significant for such a short period of time. More importantly the smooth low slope terminus with pieces breaking off into the proglacial lake in 2013 is indicative of a glacier that is thinning and retreating, note video. The lowest 1.2 km of the glacier is uncrevassed and has a low slope suggesting this area will continue to melt away. An image from a Zanskar River expedition indicates the lakes and icebergs in the lakes as well with the blue arrows indicating the low-sloped uncrevassed region. durung drung 1998
1998 Landsat of Durung Drung Glacier terminus

durung Drung close 2013
2013 Landsat of Durung Drung Glacier terminus

durung drung glacier terminus 2004
2004 Google Earth image of Durung Drung Terminus

durung drung terminus 2013
2013 Google Earth image of Durung Drung Terminus

durung drung glacier exped
Whitewater Asia image

Landsat images from 2005 and 2013 indicate the snowline on the glacier as well as the change at the terminus. In 2005 and 2013 the snowline is at 5100 m, purple dots. Given that the glacier extends from 6000 m to 4100 m this is near the median elevation, but this is also likely not the date of highest snowline position. The retreat of Durung Drung Glacier is similar to the more debris covered Gangotri Glacier and Satopanth Glacier but slower than the similarly debris limited Malana Glacier and Samudra Tupa Glacier

durung drung 2005
2005 Landsat image

durung Drung 2013
2013 Landsat image

Khatling Glacier Retreat, Uttarakhand, India

Khatling Bamak (Glacier) is the headwaters of the Bhilangana River in Uttarakhand, India. The Bhilangana River flows into the Tehri Reservoir(2400 MW), that along with the Bhilangana River’s three small hydropower projects (50 MW), make these glaciers key contributors to regional hydropower. The glacier was formerly joined with the Ratangrian Glacier as indicated by the map, but the two have separated with the Ratangrian Glacier now terminating 1.7 km upvalley of this former connection. The 10 km long glacier is fed by several mountain peaks including Jaonli over 6000 m. The lower section of the glacier is debris covered. khatling map
Here we examine satellite imagery from 1998, 1999, 2011 and 2013 to identify recent changes. The yellow arrow in the images indicates the lower limit of the clean ice in 1998, the pink arrow the lower limit of the clean ice in 2013. The red arrow indicates a significant tributary to Khatling Glacier joining from the south. The terminus is not evident in the Landsat images, but can be observed in the Google Earth imagery.

In 1998 the southern tributary joins the Khatling Glacier at 4500 m, 2.5 km upglacier of the terminus. The clean ice extends to within 1 km of the terminus. In the 1999 image the same connection with the southern tributary and location of the clean ice is evident. By 2011 the southern tributary is no longer connected to the glacier, red arrow. The clean ice does not reach the yellow arrow. The spread of the debris cover is not from additional avalanche input or flow from upglacier. The spread occurs as a glaciers ablation melts the clean ice faster and the debris cover where thick slows ice melt. This leads to topographic highs covered by debris cover that than slide-tumble down onto the clean ice. Without much input from upglacier the debris within the ice is melted out and can continue to concentrate at the surface. This is common among retreating glaciers with debris cover to have the debris begins to spread across the glacier. By 2013 the clean ice extent has retreated 1000 m from 1998 to the pink arrow of 2103. The southern tributary has retreated 200 m from its former junction. The terminus of the glacier has retreated 400 m from 1998-2013. A close up of the terminus from 2011 Google Earth imagery indicates the outlet river (pink arrow) issuing from beneath the stagnant debris covered ice (DC) and the distance from the terminus to the clean ice (CI). The lateral moraines of the Khatling and Ratangrian Glacier are also shown. The hummocky thin nature of the lower 700 m of the glacier is evident, light blue arrows, indicating an area that will be lost from the glacier soon. Khatling Glacier retreat is similar to that of nearby Gangotri Glacier and Jaonli Glacier that also feed Tehri Dam.
khatling 1998
1998 Landsat image

khatling 1999
1999 Landsat image

khatling 2011
2011 Landsat image

khatling 2013
2013 Landsat image

khatling terminus upglacier
2011 Google Earth image

Ratangrian Glacier Retreat, Uttarakhand, India

Ratangrian Glacier is adjacent to Khatling Glacier and with that glacier is at the headwaters of the Bhilangana River. The Bhilangana River flows into the Tehri Reservoir(2400 MW), that along with the Bhilangana River’s three small hydropower projects (50 MW), make these glaciers key contributors to regional hydropower.
ratangrian glacier

Ratangrian ge

In the 1998 Landsat image the glacier terminus is at the red arrow, which is at 4150 m and downhill of the stream from the glacier labelled SG. The map above indicates the glacier was joined with Khatling Bamak at 3950 m, the lateral moraines (L-on second image below) indicate this too. The glacier is quite steep in its last mile descending from 5000 m to 4150 m in 1.5 km. The glacier is also not debris covered unlike many of its neighbors Khatling, Gangotri or Jaonli Glacier. A 2011 Google Earth image indicates the glacier has retreated to the blue arrow, where the outtlet stream from the glacier SG reaches the Ratangrian valley. By 2013 the glacier has retreated above the location where the outlet stream reaches the valley and is at the yellow arrow. The total retreat in 15 years is 400-450 m. The terminus of the glacier has risen from 4150 m to 4500 . The glacier is following the path of retreat of the nearby Gangotri Glacier and Jaonli Glacier that also feed Tehri Dam. The retreat is more rapid proportionally for the size of the glacier, probably due to the lack of debris cover. The slopes in the basin feeding the glacier are mostly covered by the glacier itself. If they were steeper and were not as ice covered, than avalanches could sweep debris onto the glacier.
ratangrian 1998b
1998 Landsat image

Ratangrian 2011
2011 Google Earth Image

Ratangrian 2013b
2013 Landsat image

Ratangrian 2013a
2013 Landsat image-closeup

Middle Lhonak Glacier Retreat, Sikkim, India

“Middle” Lhonak Glacier is an unnamed glacier between North Lhonak and South Lhonak Glacier near the border of the state of Sikkim in India and Nepal, red arrow on first map. I have previously reported on the retreat of South Lhonak Glacier whose retreat has led to a significant proglacial lake expansion and nearby Changsang Glacier. Here we examine landsat and Google Earth imagery from 2000-2013. Like all glaciers in this region Middle Lhonak Glacier is a summer accumulation type glacier. This means that the glacier receives most ~80% of its snowfall during the summer monsoon. This is also the period when ablation low on the glacier is highest. Following the summer monsoon which ends in early September there is a transition period with some colder storm events where the snowline drops. Than from November-February is the dry winter monsoon with limited precipitation. Thus, strange compared to most glaciers as winter proceeds often the lower glacier remains snow free. The pre-monsoon season from March-May features increasing precipitation, temperature and rising snowlines. The glacier drains into the Teesta River, which has several existing and many proposed hydropower projects, mostly run-of-river with minor dams. kanchenjunga map close
Map of Region
pyramid tp
Weather records from Pyramid station at 5000 m in Nepal indicating the peak temperature and precipitation occurring in summer monsoon.Deluge_of_Dams_Nature-Dec2012
Proposed hydropower

In 2000 and 2001 Middle Lhonak Glacier ends in a proglacial lake at the yellow dot. The pink dot indicates a small peninsula in the lake. The green dot indicates a bare rock area that separates two arms of the glaciers. The green arrow indicates where the two arms of the glacier join. By 2005 the glacier had retreated from the yellow dot, but the two arms of the glacier still connected, green arrow. In 2006 a higher resolution image from Google Earth indicates the 300-400 m retreat since 2000 of the glacier. The two glacier arms still join, green arrow, though barely. There is a substantial icefall that begins at 5800-5900 m, as noted by red arrows. Above the icefall the glacier is almost always snowcovered, but the icefall the glacier often remains snow free for much of the year at around 5700 meters. This will be explored further in a sequence of 2013 images below the terminus change sequence. In 2013 the two arms of the glacier have separated, the green dot bare rock area has greatly expanded and the glacier terminus has retreated 500-600 m since 2000. Lhonak glacier 2000
Landsat image 2000

Lhonak 2001
Landsat image 2001

lhonak 2005
Landsat image 2005

Middle Lhonak 2006
Google Earth image 2006

lhonak12212013
Landsat Image 2013

A series of images below indicate the snowline in a period from October 12, 2013-December, 21 2013. On October 21 the snowline is at the last bend above the terminus at 5650 m. By November 21 the snowline has shifted little. By December 1 the snowline has begun to rise to 5700 m. The rise has continued to 5750 by December 21. The lake at the terminus remains unfrozen.

lhonak10122013
October 12 2013 Landsat

Lhonak11212013
November 21, 2013 Landsat

lhonak 1212013
December 1, 2013 Landsat

lhonak12212013
December 21, 2013 Landsat

Kalabaland Glacier, Retreat, Uttar Pradesh, India

Kalabland Gal (Glacier) in Uttar Pradesh, India drains into the Goriganga River, via Ralam Gad. The glaciers flows southeast from the Peak of Chhiring We, joins the Yankchar Glacier and turns sharply southwest. The combined terminus is referred to as Shunkalpa Gal, but here since Kalabaland is the largest contributing glacier, that name is applied to the terminus as well. Here we examine changes in the glacier from 2000 to 2013 using Google Earth and Landsat imagery. purphu map
Map of Region

ralma ge
Google Earth Image, blue arrows glacier flow, red arrow terminus.

The Goriganga River is fed by many glaciers and is a target for a number of run of river hydropower projects, some existing such as at Talla Dummar and others projected, such as at Bogudiyar. These projects have only minor dams to divert the water from the river for a short distance before running through turbines and returning to the river. In 2000 both Landsat and Google Earth imagery indicate the terminus location, red arrow. The terminus is heavily debris covered and is evident because of the glacial stream that emerges from beneath the debris covered ice. By 2012 the glacier had retreated 250 m to the yellow arrow. The lowest one kilometer of the glacier has thinned both in width and thickness, is stagnant and will melt away soon. The side by side view from 2000 and 2012 better indicates the change and the thinning of the terminus tongue. The two pink markers are at the 2000 and 2012 terminus respectively, dark pink 2000 and light pink 2012.

ralma 2004
2000 Google Earth

Ralma 2012
2012 Google Earth

ralman terminus change
Terminus closeup in Google Earth

Landsat images from 2000 to 2013 indicate that the terminus retreat is small compared to the full length of the glacier, red arrows. The width and length of blue ice extending southwest at the bend has been reduced from 2000 to 2013 indicating a continued reduction in net flow of ice to the terminus. This glaciers retreat is following the pattern of Malana Glacier, Milam Glacier and Satopanth Glacier in this region.

ralman ls 2000
2000 Landsat image

ralman 2013
2013 Landsat image

Jaundhar Bamak Glacier tributary retreat, Tons River, Uttarakhand, India

The Tons River is in Uttarakhand India. The watershed is fed by more than 50 glaciers. The largest are Jaundhar Barak and Bandarpunch, the glaciers of Tons valley are notable for a thick mantle of debris cover, due to the terrain characteristics, and the avalanche fed nature of the glaciers (Pankaj et al, 2012). The Tons River Basin has one significant operational hydropower unit, the Mori Hanol Hydro Power Project (70 MW) with a diversion dam downstream of Mori village. There are other proposed projects in the basin. Mehta et al (2013) observed the spatial changes of Jaundhar Barak, Jhajju and Tilku glaciers in the Tons River basin between 1962 and 2010 using Landsat Satellite data, topographic maps and field surveys. They estimated the overall loss in area to be 3.6 km2 (5.4%) and frontal retreat of 1,700 m, ∼ 800 m and ∼ 700 m for the Jaundhar Barak, Tilku and Jhajju Glaciers. The debris cover (DC) makes it quite difficult to easily identify terminus (T) position using Landsat imagery, Google Earth Imagery is not good either.

tons river map
Map of Tons River basin glacier from (Pankaj et al, 2012)

tons base map
Jaundhar Barak Glacier in 2012 arrows indicate flow Debris cover=DC and Terminus=T, tributary glaciers of note discussed below A-E.

Here we use Landsat imagery to identify the retreat of five tributary glaciers that have fed or are feeding into the Jaundhar Barak from the ridge to its north from 2000 to 2012. Jaunhar Barak is a 19 km long glacier with a north and south arm, here we focus on the north arm. The glacier begins near 6000 m and quickly drains into the main valley, at 4900 m the debris cover begins and the lower 13 km of the glacier are debris covered to the glacier end at 3900 m . The tributary glaciers are each a potential income stream for the main glacier, which when lost lead to less snow and ice “income” for the main glacier and then thinning and retreat will follow. The Jaundhar Barak Glacier is The five tributaries are labelled A-E. A comparison of the 2000, 2011 and 2012 images below indicate that: At Point A in 2000 two arms of the tributary glacier joined and it flowed out of the high alpine basin it was in, by 2011 and 2012 the two glacier arms have separated and the glacier is confined to the upper basin. At Point B there is a well established glacier tongue that extends halfway from the tributary to Jaundhar Barak, and by 2012 this tributary terminus has pulled back 200 m, which is nearly 200 m of elevation change also. At Point C in 2000 this tributary joins the main valley glacier and a small tongue of blue ice, its contribution can be seen heading downglacier. By 2012 the Point C tributary no longer reaches the main glacier. At Point D in 2000 the tributary joins the main glacier and like the previous tributary contributes a small tongue of blue ice that heads down the Jaunhar Barak Glacier. By 2011 the Point D tributary is no longer reaching the main glacier. At Point E in 2000 this accumulation area for the glacier is nearly all covered with glacier ice, with only a couple of small bedrock areas seen below the Point. By 2012 the bedrock exposed has coalesced into a one kilometer region separating a portion of the upper glacier from the main valley glacier. The ice from this tongue still may reach the lower glacier via avalanching. The last decade of loss on tributary glaciers more than 10 kilometers above the terminus of Jaundhar Barak indicates that downwasting and retreat of this glacier will continue. This glacier follows the pattern of other glaciers in the Garhwal of the Himalaya in its retreat and downwasting, Jaonli Glaicer, Gangotri Glacier, Satopanth Glacier . It also will feeds hydropower projects as do the other glaciers.
tons river 2000
2000 Landsat Image of tributaries on north side of Jaundhar Barak Glacier.

tons river 2011
2011 Landsat image

tons river 2012
2012 Landsat image

Jaonli Glacier Thinning and Retreat, Uttarakhand India

Jaonli Glacier is in the Pilang basin which feeds the Bhagirathi River in Uttarakhand. The glacier is 20 km west of the well known Gangotri Glacier and 30 km east of Jaundhar Barak. The glacier is one valley north of the well studied Dokriani Glacier. Jaonli has a heavily debris covered terminus which slows the retreat of the actual terminus, while upglacier thinning has been quite rapid. Here we examine Landsat imagery from 2000 to 2012 to illustrate the change due to increased melting. The glacier provides hydropower as it passes three Hydropower plants generating 1430 MW, including the 1000 MW Tehri Dam and reservoir, which also provides flood control, such as this past week of June 17, 2013(second image). The Tehri Reservoir level rose 25 m within 48 hours which is a storage of approximately 1.3 billion cubic meters. Jaonli Glacier is a heavily avalanche fed from the huge wall of rock on its northeastern flank, as noted by light blue arrows. In each image the yellow and orange arrows indicate the same location for comparison of the width of debris cover. The purple and red arrow indicate where two tributaries flow down to meet the Jaonli Glacier.jionla profiletehri dam map 2007

In 2000 the clean ice region of the main valley tongue of the Jaonli Glacier is 400 m wide at the yellow arrow and 500 m wide at the orange arrow. The eastern tributary at the red arrow joins the main valley glacier. At the purple arrow two small ponds are developing as the tributary that does not reach Jaonli melts back. By 2012 the debris free ice surface is 100 m wide at the yellow arrow and 200 m wide at the orange arrow. The debris cover spreads across the glacier as the clean ice melts faster thinning, and the debris covered area is then on an increasingly wide and high ridge above the clean ice and the debris then falls and oozes down onto the cleaner ice. The tributary at the red arrow still reaches the main glacier but is now covered by debris. The two ponds have merged at the purple arrow to create a larger terminus lake. IN Google Earth the images are from 2011. The first is a cross ice view towards the red arrow tributary, indicating the same locations and the extent of the debris cover. The second image is a closeup of the terminus, with a pink arrow indicating the 2011 terminus, note river issuing here and large ice face. However, there are two other developing termini with lakes forming 1 km upstream of the main terminus, green arrows. This stagnant ice in between will continue to melt and collapse. The glacier has retreated 160 m from 2000 to 2012, but will undergo an additional one kilometer retreat to reach the lake locations. This glacier fits well the overall retreat in the region (Kulkarni et al, 2007).Dokriani Glacier retreated at a rate of 17 m/year from 1962-2000 (Bhambri and Bolch, 2011). In the nearby Tons River Basin Mehta et al (2013) noted the 1962-2010 retreat of three glaciers Jaundhar (34 m/year), Jhajju (15 m/year) and Tilku Glacier (13 m/year). jaonli glacier 2000

jaonli glacier 2012

jionla debris

jaonli terminus 2011