South Lhonak Glacier, Retreat Sikkim

The South Lhonak Glacier drains east from Lhonak Peak into Sikkim from the Nepal-Sikkim border. The glacier begins at the border at 6500 meter and ends in a lake at 5200 meters. In 1933 the Mount Everest Expedition led by Eric Shipton explored the area. They traversed across the border and down the Lhonak Glacier finding only moraine covered cover glacier and no lake. Comparison of Landsat and Google Earth images from 2000-2011 indicate the expansion of the lake as the glacier has retreated. The first three are Landsat images from 2000 (top), 2010 (middle) and 2011 (bottom), indicating the expansion of the lake and glacier retreat. 2013 Update A paper just published in Current Science by K. Babu Govindha Raj1, S.N. Remya andK. Vinod Kumar reports on this lake expanding by 1.9 km due to glacier retreat from 1962-2008.

s Lhonak glacier 2000

s lhonak glacier 2010 s lhonak glacier 2011
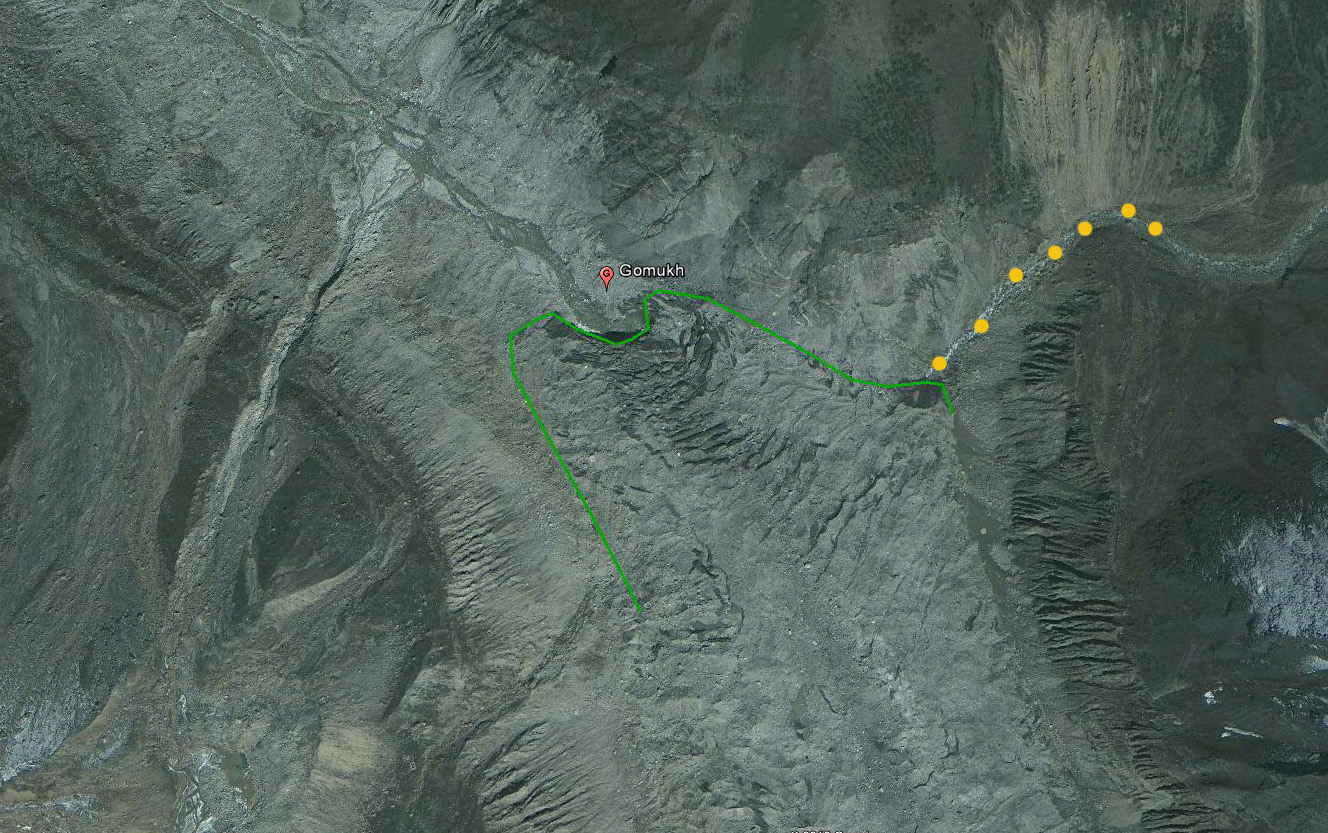
The next set of three are from Google Earth with a Landsat image from 2000 overlain in GE (top), 2006 GE image (middle) and 2010 GE image (bottom). The 2010 terminus is marked by green line, 2006 orange line and 2000 magenta line. The glacier retreated 350 meters from 2000 to 2006 and 250 meters from 2006-2010. The net 600 meter retreat for the decade is 60 m/per year. The 2006 image has red arrows indicating the large moraine behind which the lake has formed, and which Shipton found the glacier pressed up against. The retreat from 1933-2010 is at least 1800 meters. Clearly the retreat in the last decade is much more rapid than previous. The specific hazard is identified by Babu Govindha Raj et al (2013), the lake outburst probability is a very high value of 42% and peak discharge estimated at 586 m3/s. The retreat fits the pattern of other glaciers in the area reported by Raina (2008) and including Zemu Glacier and Changsang Glacier. In Sikkim 26 glaciers examined were retreating at an average rate of 13.02 m per year from 1976 to 2005. An example of this kind of retreat from Bhutan is Theri Kang Glacierand Changsang Glacier in Sikkim is another example.lhonak ge 2000
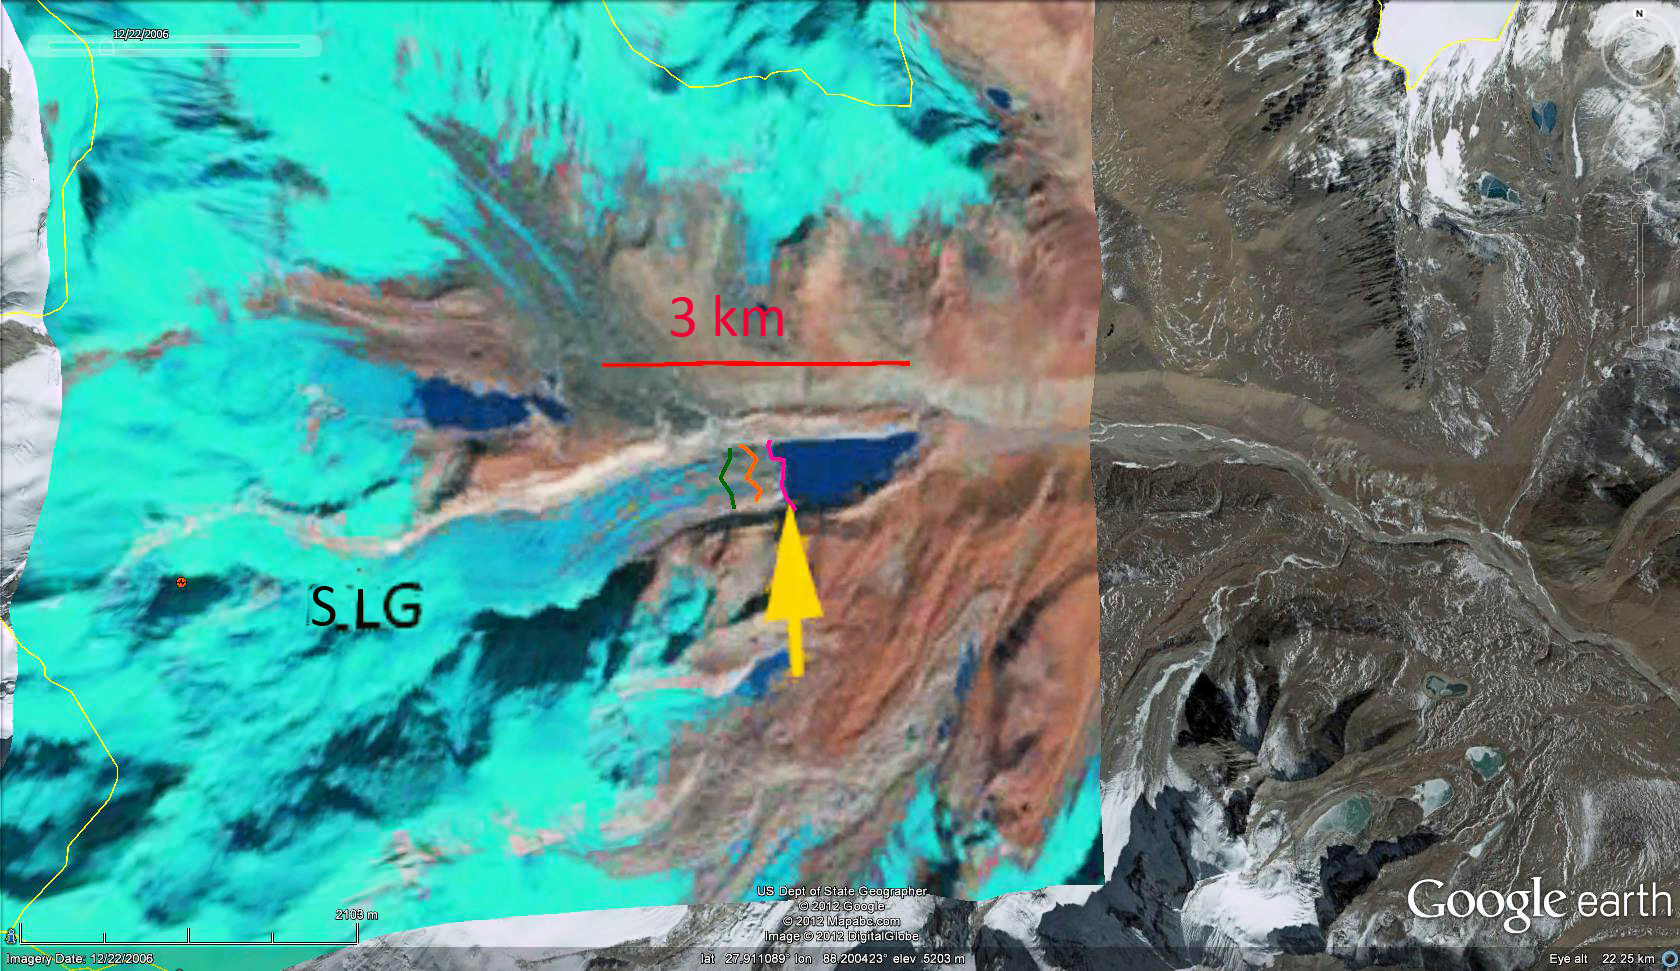
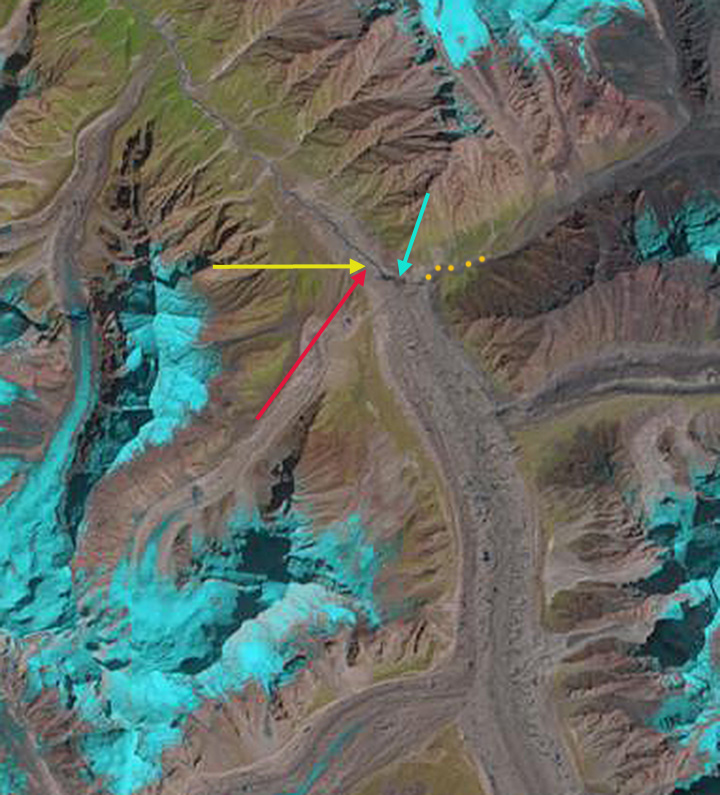
A closeup examination of the terminus region of the Lhonak Glacier indicates a well incised supraglacial stream (on surface of glacier), indicating relative stagnation. Three areas where debris cover has protected the underlying ice leading to a prominent ridge on the glacier,(light blue arrows) again an indicator of stagnation. Finally the magenta arrow identifies a side stream valley that adjacent to the glacier and lower than the glacier, another indication of stagnation.

Satopanth Glacier Retreat-Debris Cover and Hydropower

Satopanth and Bhagirath Kharak glaciers are located at the headwaters of the Alaknanda River, Uttarakhand, India. Satopanth glaciers has been assessed for the 1962-2006 period by Nainwal and others 2008 . This is accomplished through a comparsion of the 1962 Survey of India map and a total station survey completed in 2006 since 1962. Examination of satellite imagery indicates a retreat of 1900 meters from the Little Ice Age moraine that is evident. Satopanth Glacier has retreated continuously during this period. The total recession of the terminus which is at 3870 meters ranges from 1160 meters to 880 meters depending where on the glacier front retreat is measured, the average rate is reported as 22 meters per year (Nainwal and others, 2008), , for a total average retreat of 970 meters. The image of the terminus below is from the work of Nainwal and colleagues at Garhwal University.(Nainwal and others, 2008) . The glacier has an equilibrium line altitude of 4800 meters, below 4700 meters the glacier is dominantly debris covered, the mean elevation of the glacier is, above the ELA, at 4900 meters. This debris cover is thick enough to retard ablation and also prevent black carbon from enhancing ablation on this section of the glacier. This glacier has a similar behavior, but a more limited accumulation zone than Gangotri Glacier or Khumbu Glacier. The transition zone where the glacier is not debris covered and there is significant melting comprises 20% of the glacier. The remaining 30% of the glacier is in the dry snow zone, where melting is limited and hence black carbon again has a limited role. The recession of this glacier is slowed by the debris cover. An alpine glacier needs a minimum of 50% of its area to be in the accumulation zone to be in equilibrium, this glacier has 40% of its area in the accumulation zone, hence retreat will continue. The debris covered area is illustrated in the first image below, the ELA in the second image and the accumulation zone in the third image. It is apparent that the zone of melting (ablation) is significantly larger than the accumulation zone.Run of river hydropower projects to yield 140 MW have been proposed for the upper Alaknanda River basin. Satopanth Glacier will be a key contributor to this project.

Gangotri Glacier Retreat Continues 2013 and Hydropower

In India the Gangotri Glacier is the largest glacier at the headwaters of the Bhagirathi River. The false-color image below provided by NASA shows the retreat of Gangotri Glacier, situated in the Uttarkashi District of Garhwal Himalaya. It is one of the larger glaciers in the Himalaya, and like all of the nearby Himalayan glaciers is retreating significantly. The Bharigrathi River has the Tehri Dam, a 2400 mw hydropower facility. With an area of 286 square kilometers Gangotri Glacier (Singh and others, 2006) provides up to 190 cubic meters per second of runoff for this river. Gangotri Glacier provides hydropower as it passes three hydropower plants generating 1430 MW, including the 1000 MW Tehri Dam and reservoir and maneri Bhali I and II, see map below. The Tehri also provides flood control, such as this past week of June 17, 2013. The Tehri Reservoir level rose 25 m within 48 hours which is a storage of approximately 1.3 billion cubic meters. Below is a view of the Tehri Reservoir, images of the dam and its operations are here. Bhagirathi 150411
Map from the Southeast Asian Network on Dams, Rivers and People
tehri dam map 2007Gangotri Glacier retreated 26.5 meters per year form 1935-1971. From 1968-2006 the glacier retreated 800 meters, close to 20 meters per year (Bhambri et al, 2012). Srivastava et al (2013) indicate the retreat rate of 21 m/ year from 2004-2010. The glacier continues to thin and tributary inflow decline, while the thick heavily insulated by debris terminus retreat is slow. Srivastava (2012) published a report with numerous terminus pictures though they do not have a common reference point beginning on page 90. Where the river exits the glacier is referred to as Gomukh.
Here we compare both Landsat and Google Earth images during the 2000-2013 period. First the 2000 and 2013 Landsat images. A 2000 and 2013 landsat image pinpoint the terminus change, the yellow and red arrows converge on the 2000 location of Gomukh. The blue arrow indicates the mouth of a side valley from the east that is at the terminus in 2013 and actively cutting the face, which is not the case in 2000. The orange dots indicate the course of this stream. A 2006 Cartosat image from Bhambri et al (2012) can be compared to the 2010 and 2013 Google Earth images. In Google Earth the 2010 image gives a clear view of Gomukh which can be compared to the 2006 Cartosat image from Bhambri et al (2012). In 2000 and even 2006 this was not the case. A 2013 Google earth also indicates this point,with the glacier having retreated to the side valley from the east. The retreat from the location of Gomukh in 2000 to 2013 is 240-270 m, approximately 20 m per year as noted by Srivastava et al (2013) for a shorter interval.
gangotri Glacier 2000
2000 Landsat image

gangotri glacier 2013
2013 Landsat image

.
2006 Cartosat image

gangotri 2010
2010 Google Earth image

gangotri 2013 ge
2013 Google Earth image
Gangotri 2013
2013 Google Earth image

This glaciers remains over 30 km long, and is not in danger of disappearing anytime soon. The lower section of the glacier is heavily debris covered, which slows melting. The debris cover prevents black carbon-soot from enhancing melt over most of the ablation zone. The upper reaches of the glacier extends above 6000 meters and remains snow covered even during the summer melt season June-August, as this is also a main accumulation season due to the summer monsoon. This is different from other alpine regions, where the melt season is also the dry season, here it coincides with the wet season and the accumulation season on the upper glacier. Compare the differences in hydrographs from Thayyen and Gergen (2009) Figure 3 and 4. The new snowcover on the upper glacier also limits the impact of black carbon or soot on ablation. The glacier is fed from avalanches off of the even larger area of mountains above 6000 meters adjacent to it. This is one of many glacier in the Himalaya that is being tapped for hydropower. The retreat is slower than that of nearby Malana Glacier and Samudra Tupa Glacier but similar to Durung Drung Glacier.