Mount Baker Glacier’s Perspective on Climate Change 1984-2022-Disastrous!

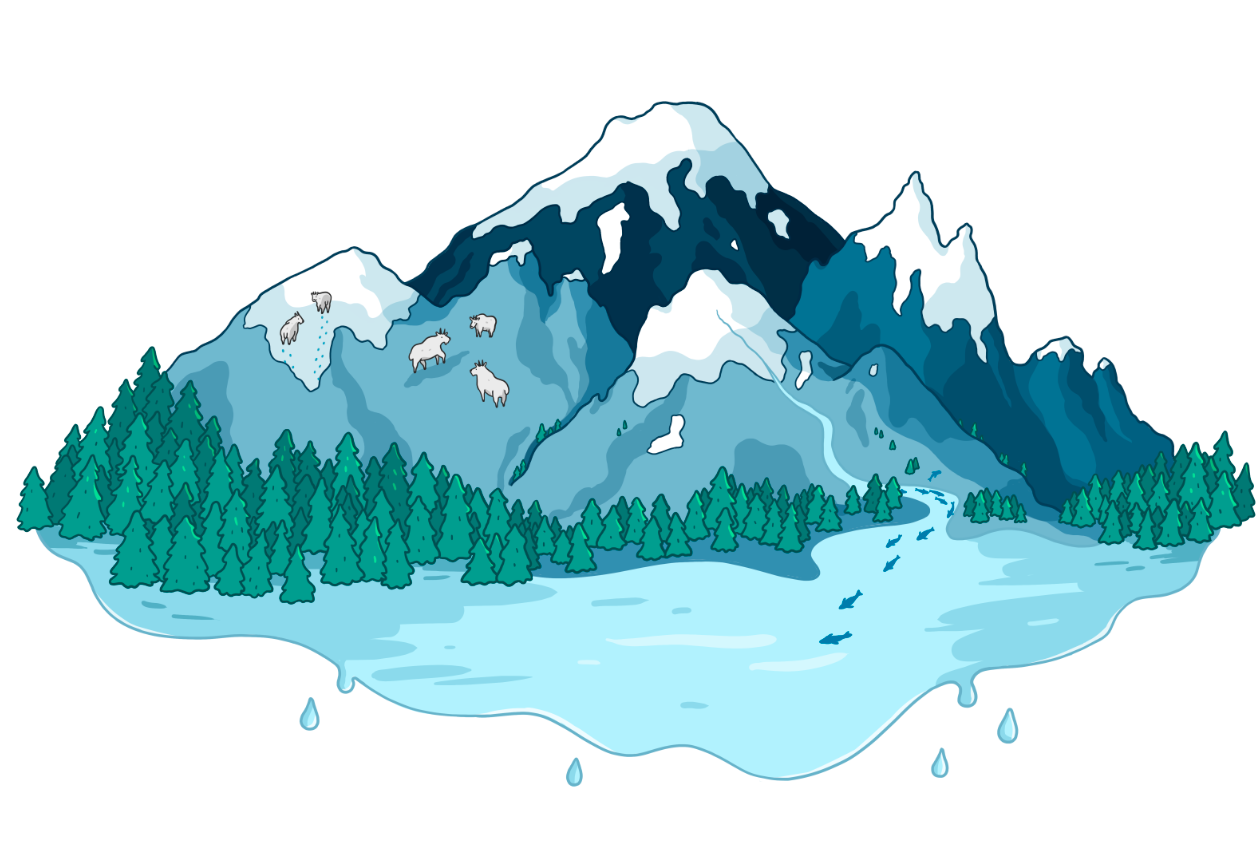
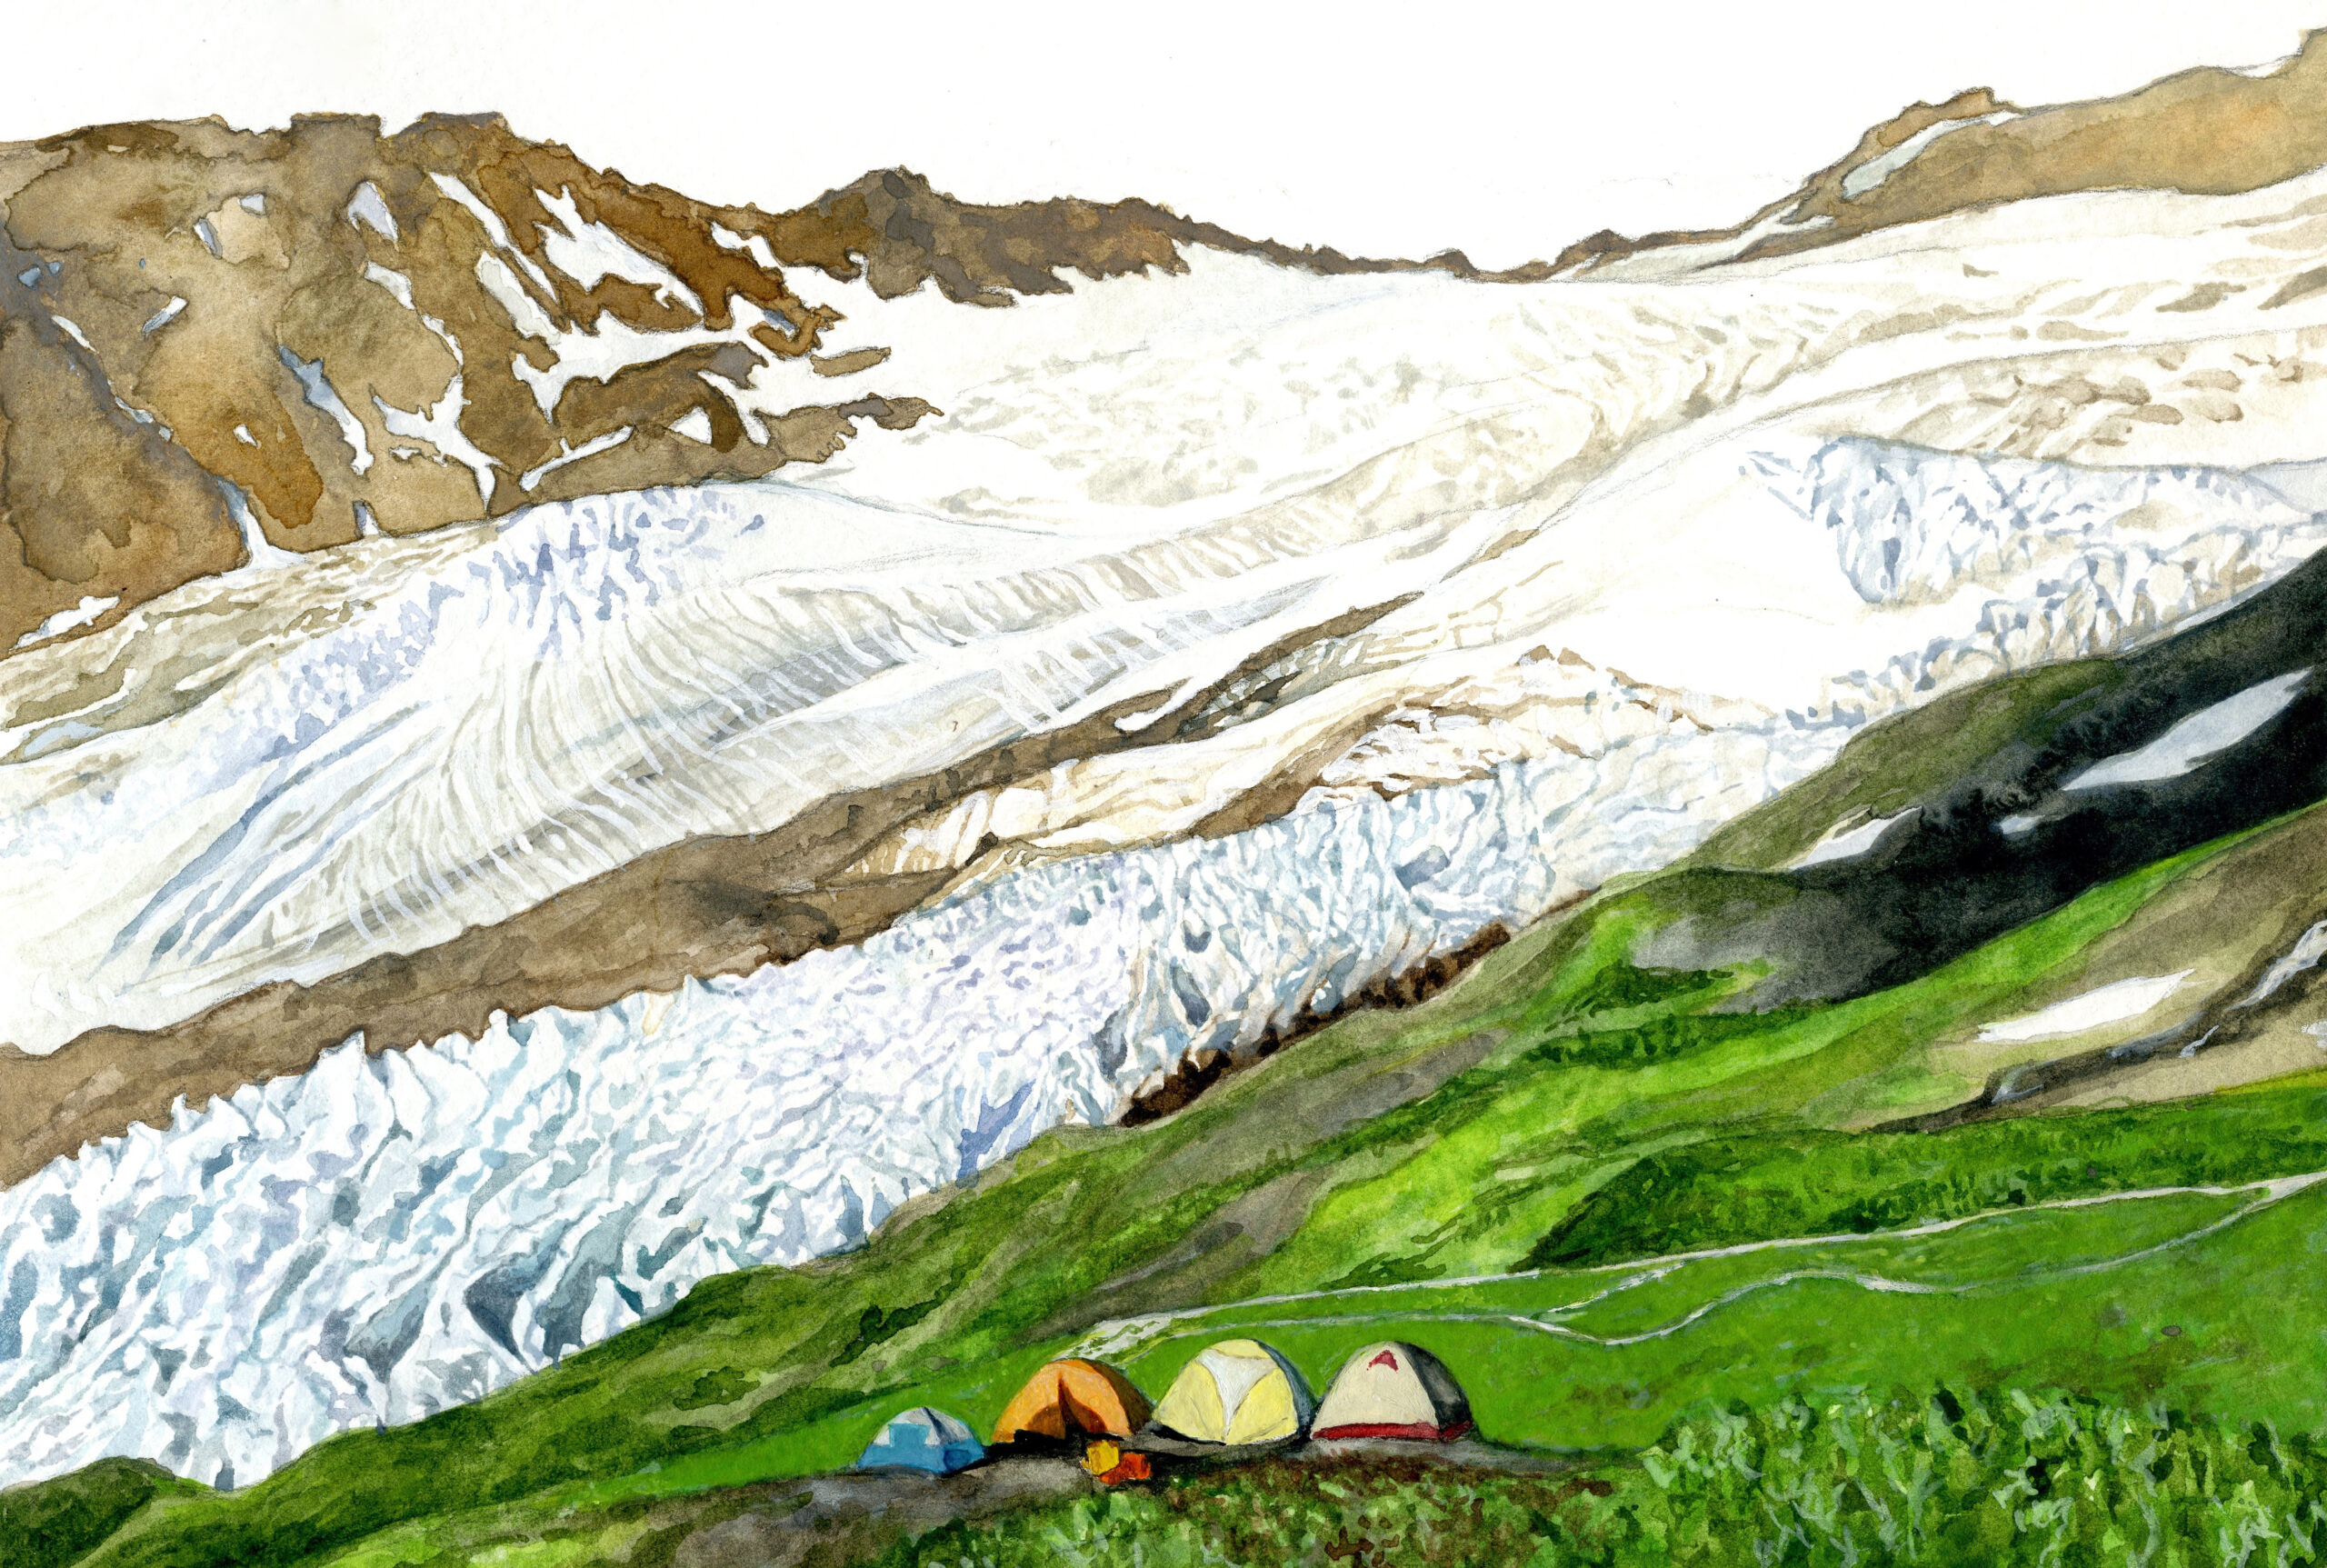
Camp above Coleman Glacier on Heliotrope Ridge, (Jill Pelto painting)

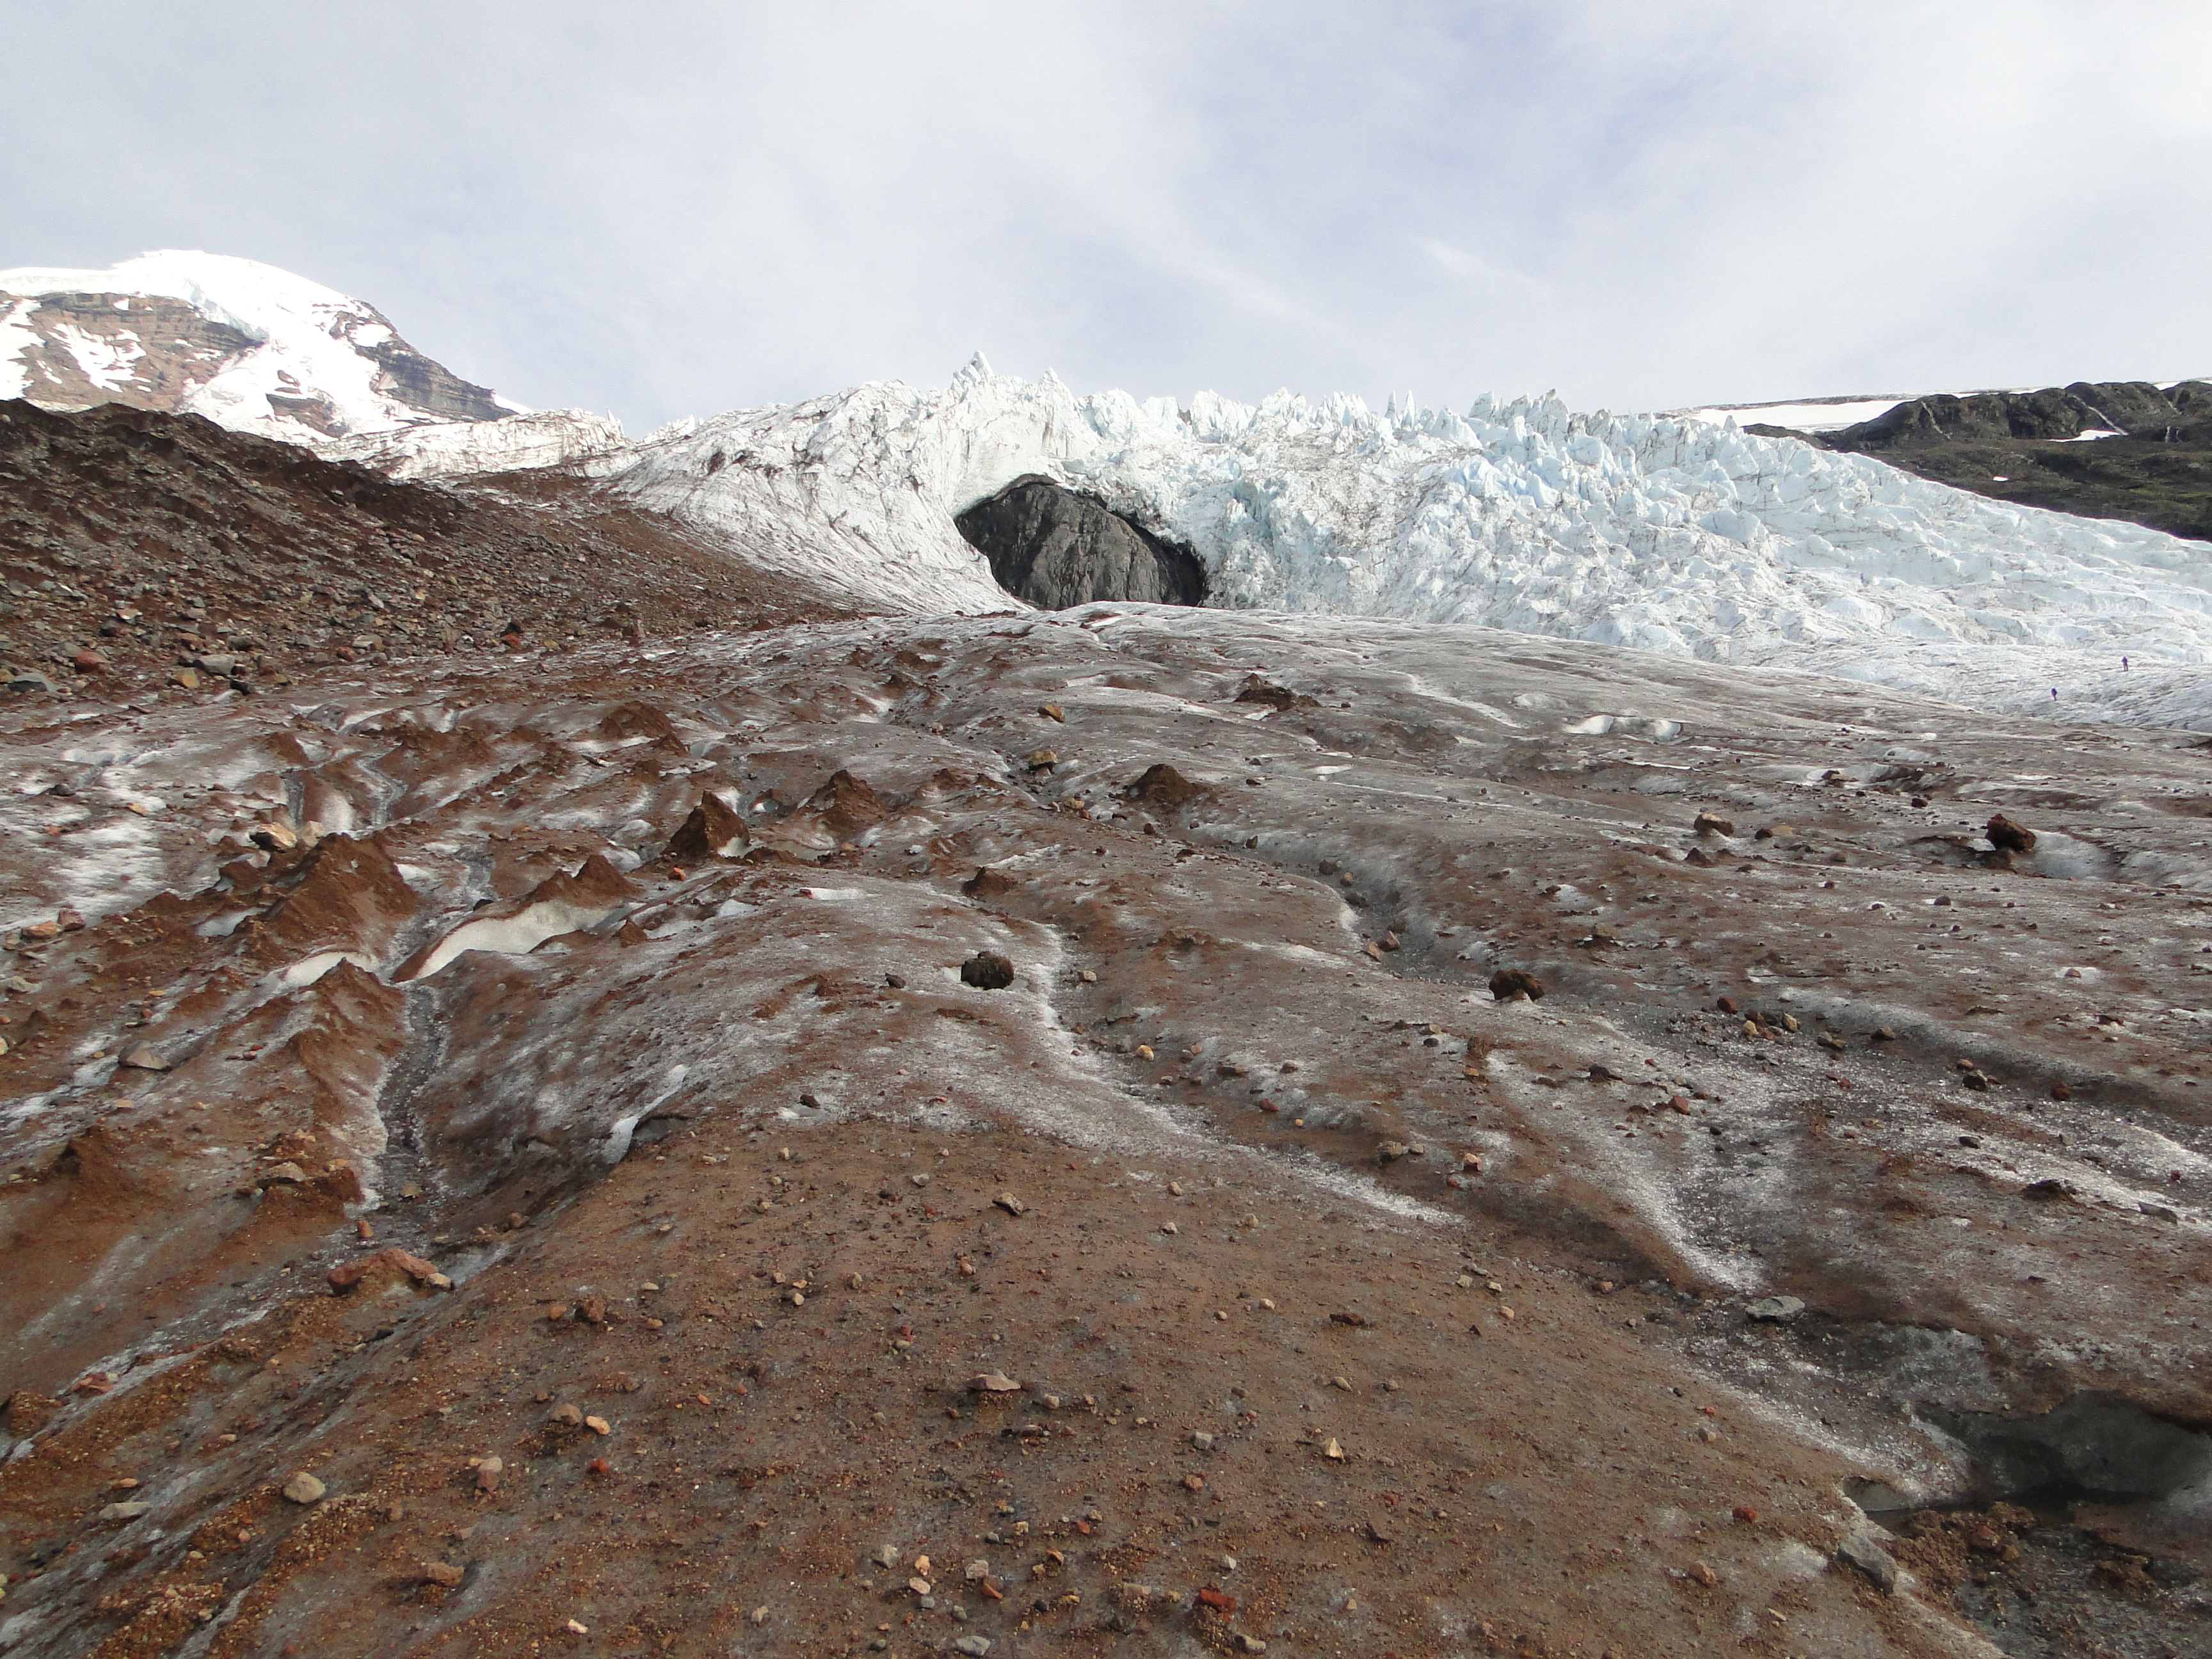
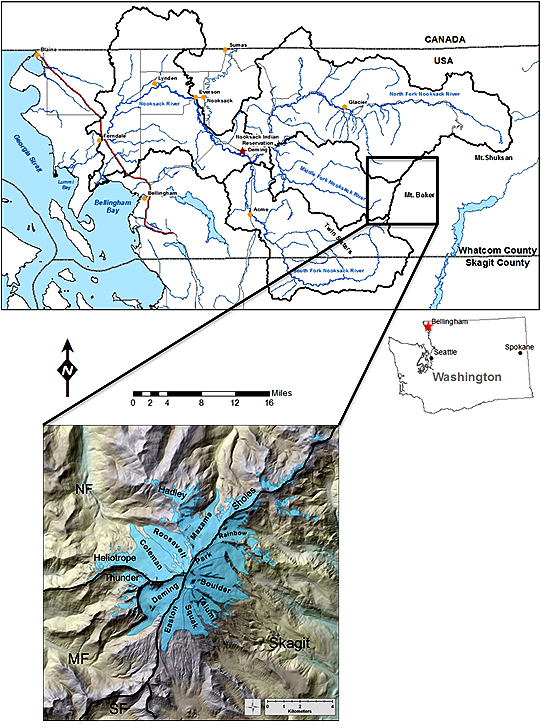
Mount Baker is the most glaciated peak and highest mountain in the North Cascade Range at 3286 m.  The Nooksack Indian Tribe refers to this strato volcano as Komo Kulshan, the great white (smoking) watcher. Mount Baker has 12 significant glaciers that covered 42 km2 in 1984 and ranged in elevation from 1320 m to 3250 m.  Kulshan watches over the Nooksack River Watershed, and its flanks are principal water sources for all three branches of this river and Baker River.  In 1984 we began an annual monitoring program of glacier mass balance, terminus position and glacier area on these glaciers. Over the last 40 years we have visited these glaciers every summer observing their response to climate change.

In 1984/85 we visited 11 of the 12 glaciers mapping their terminus position.  All but one had advanced between 1950 and 1975 emplacing an advance moraine.  In the 1980’s as each glacier retreated from this moraine we used these prominent moraines as a benchmarks, as their ice cores have melted and erosion has occurred they have become less prominent. The distance from the typically well preserved, fresh moraines  to the current glacier front has been measured in each case using a laser ranging device with an accuracy of +1m.   In 2009 Mount Baker glacier had declined to 38.5 km² Pelto and Brown (2012). The Randolph Glacier Inventory reported a glacier area of 37 km² in 2015.  In October 2022 an updated area was determined for Mount Baker glaciers at 33.5 km². This represents a decline of 20% in 38 years. Pelto and Brown (2012)  identified a mean annual mass balance loss of -0.52 m/year from 1990-2010 on Mount Baker glaciers. From 2013-2021 the mass loss had more than doubled to -1.30 m/year. Below we review each glacier circling the mountain counter-clockwise

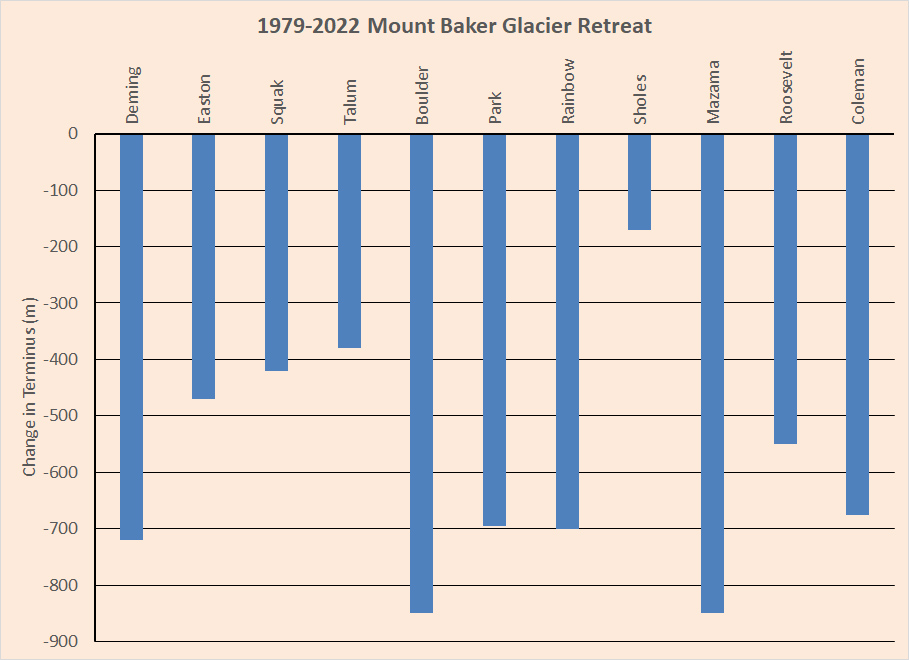
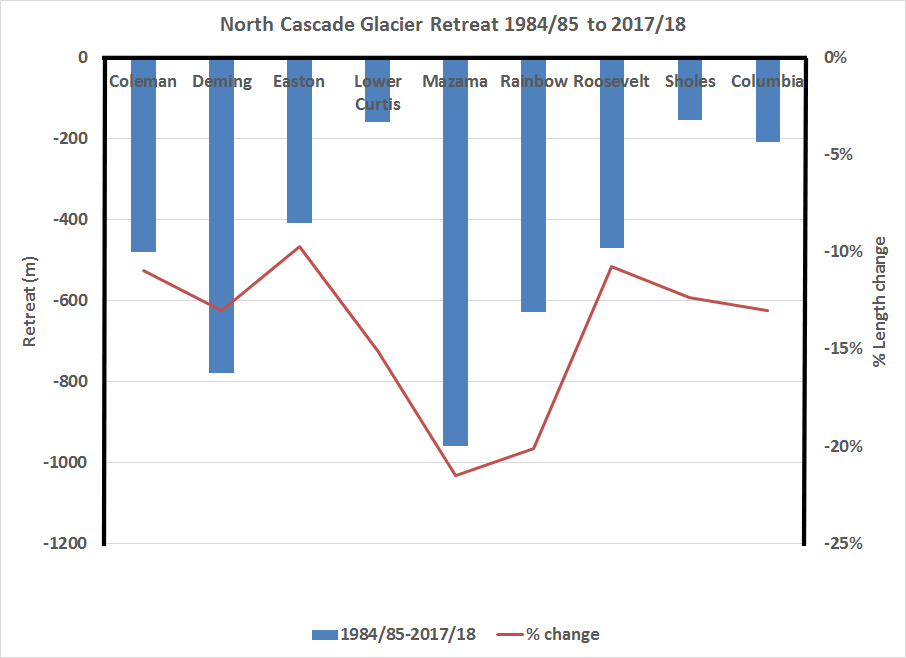
Measurement of glacier retreat from the advanced moraines ~1979 to 2022. We have measured terminus position of these glacier on 130 occassions from 1984-2022.

Easton Glacier from our survey camp  in (2022) above and 2003 (below) illustrating 470 m retreat from 1990-2022.

Change at terminus from August 2022 to August 2023. Image from same location though different orientation area the size of a hockey rink lost all of its ice here.

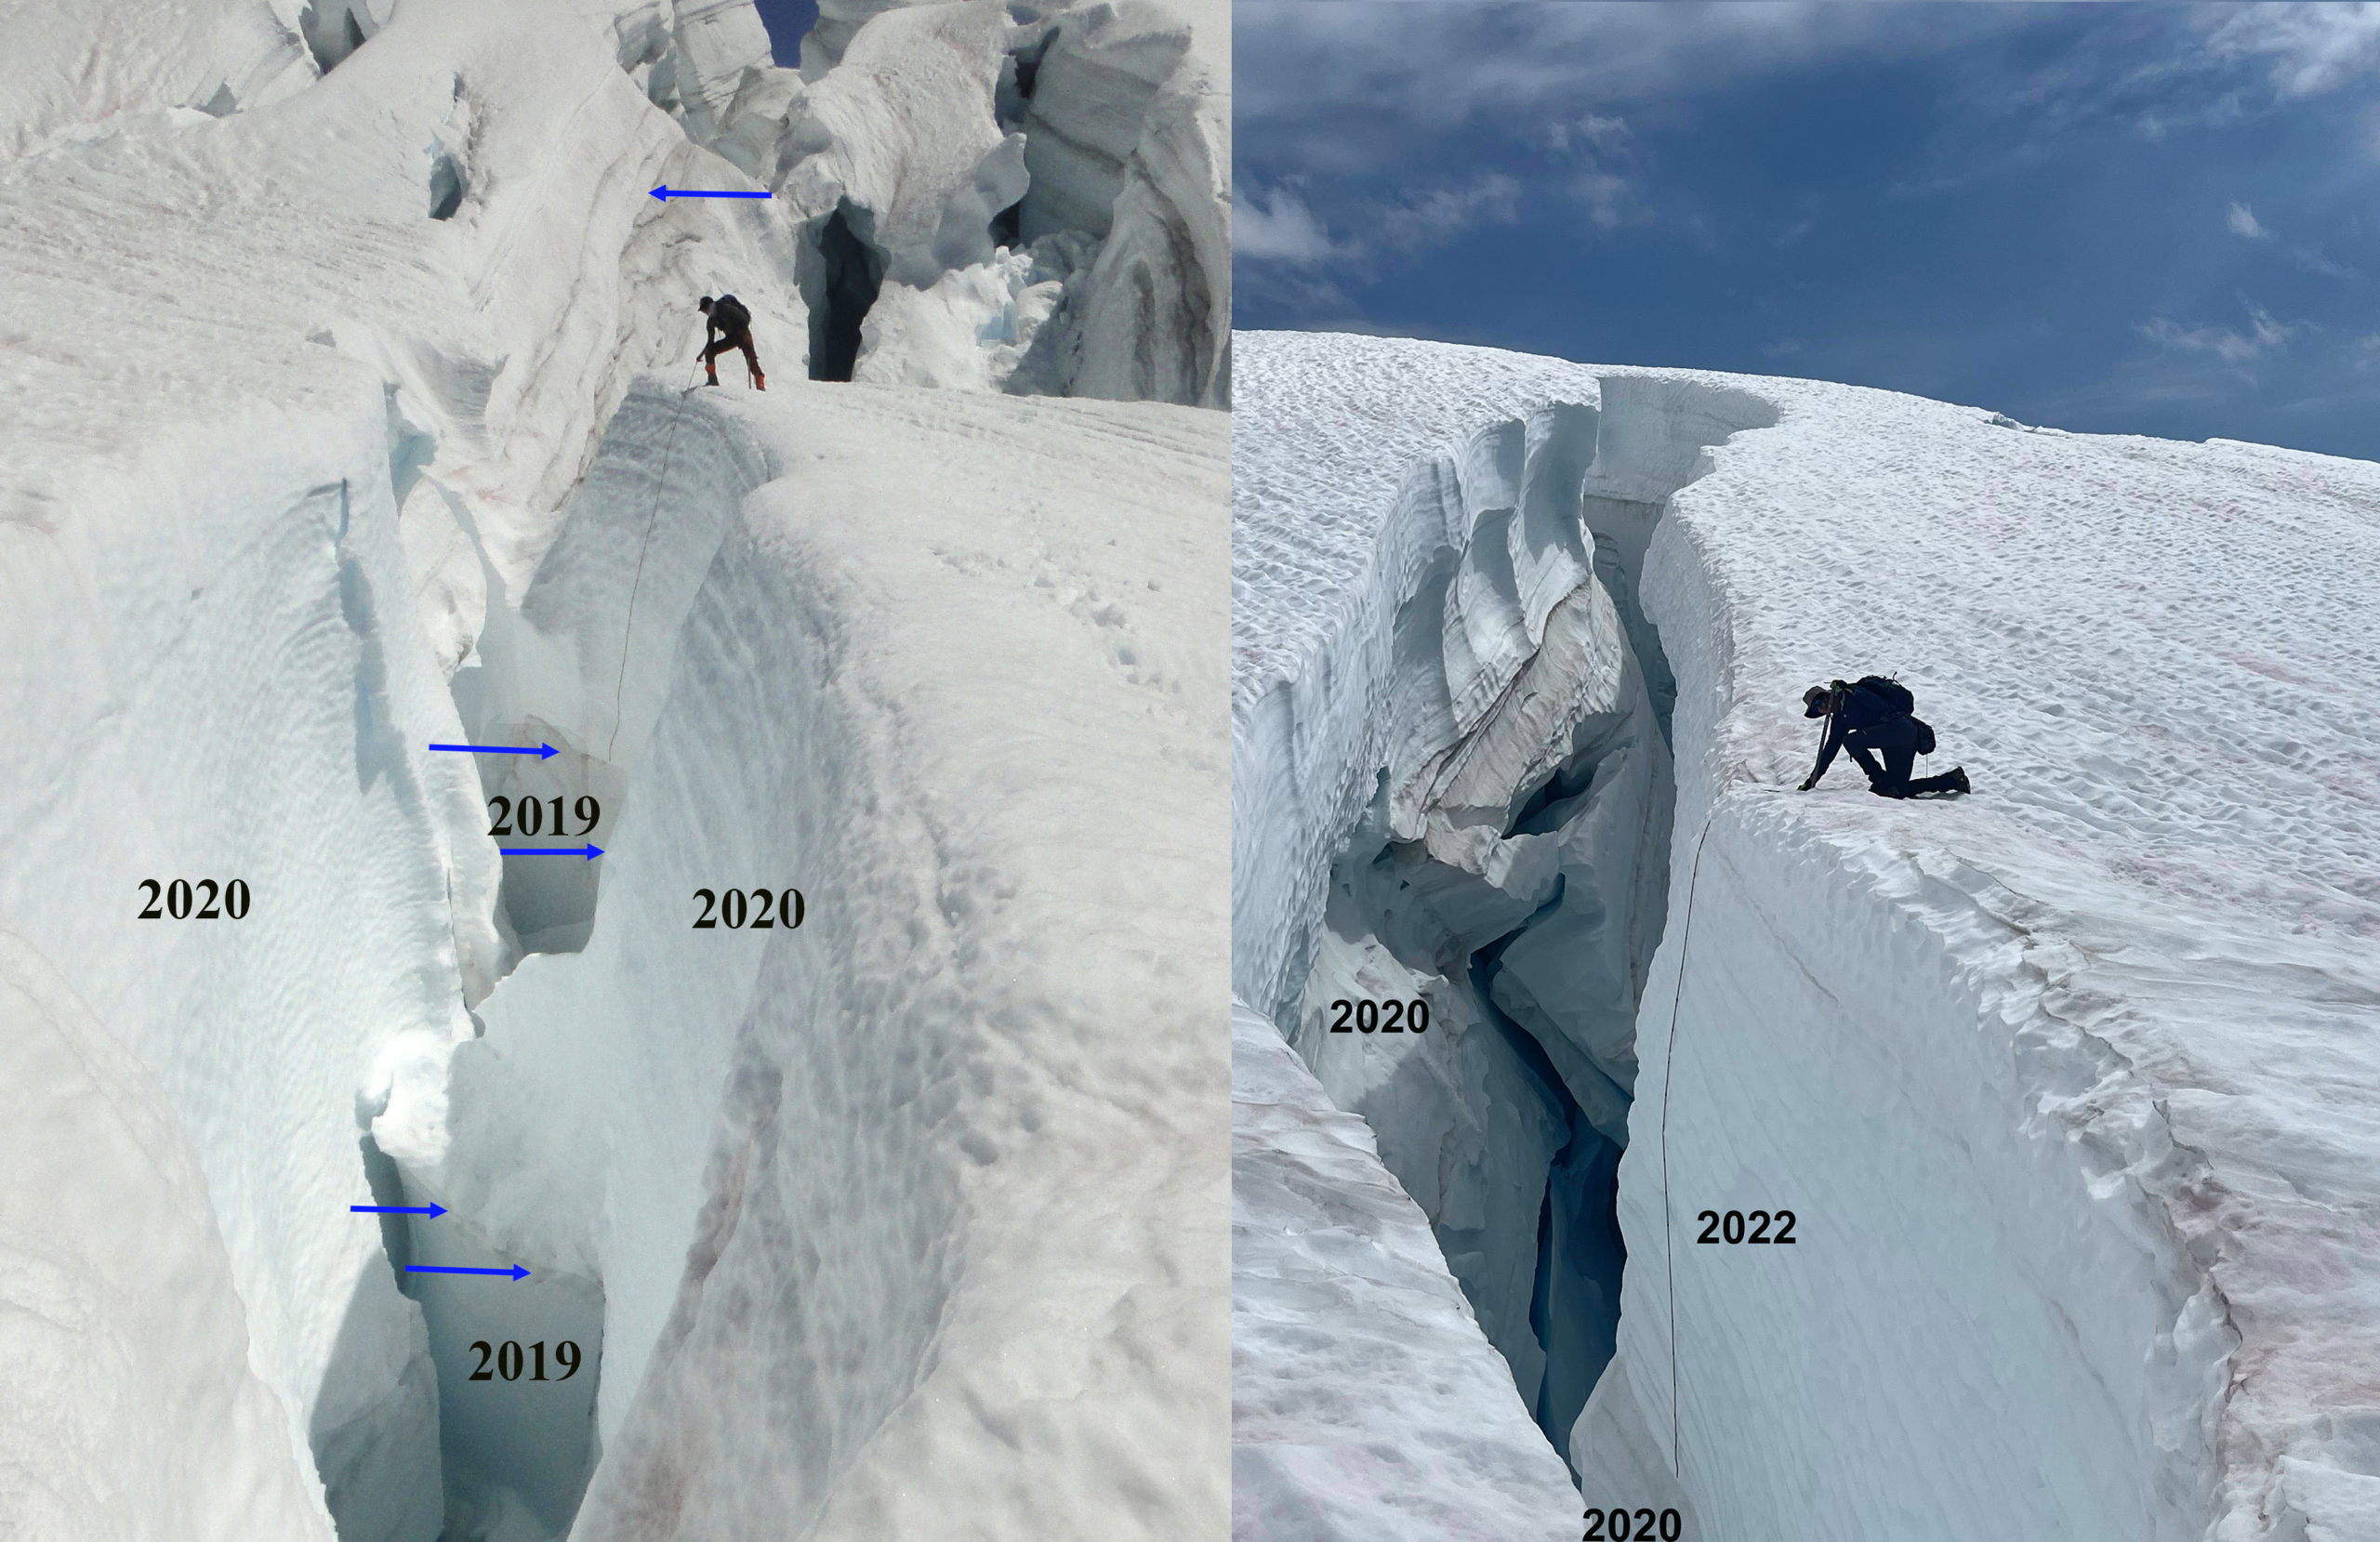
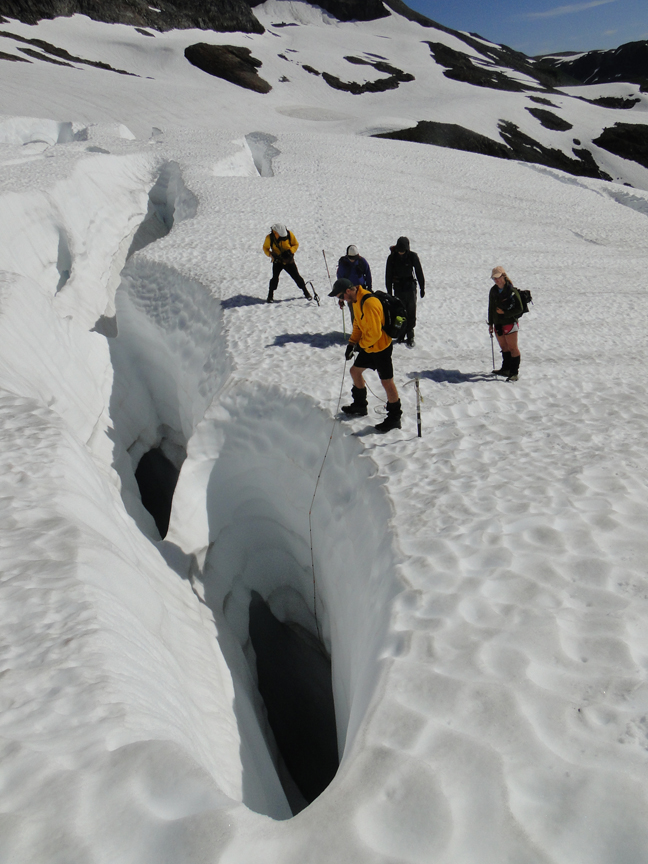
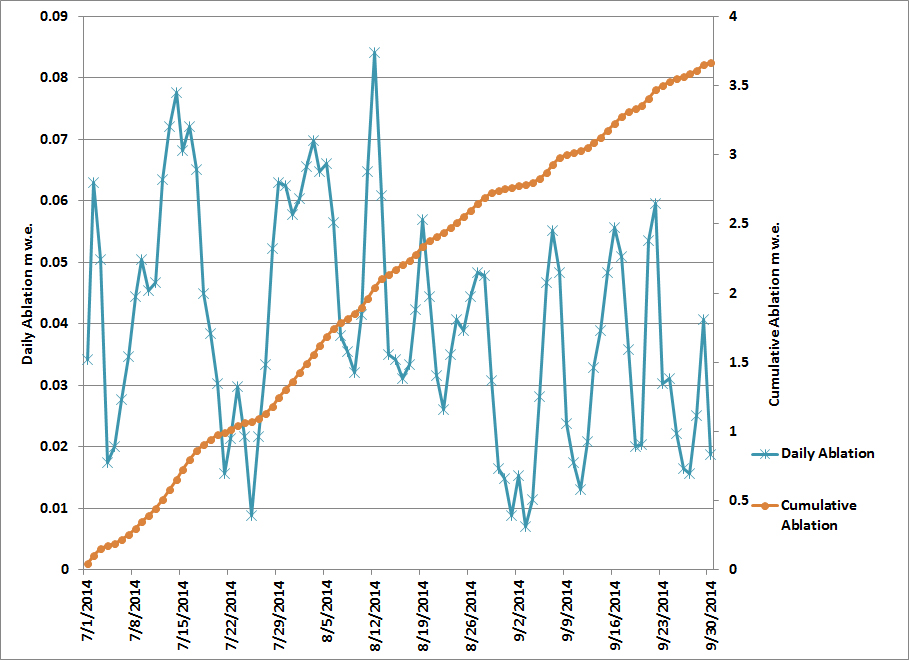
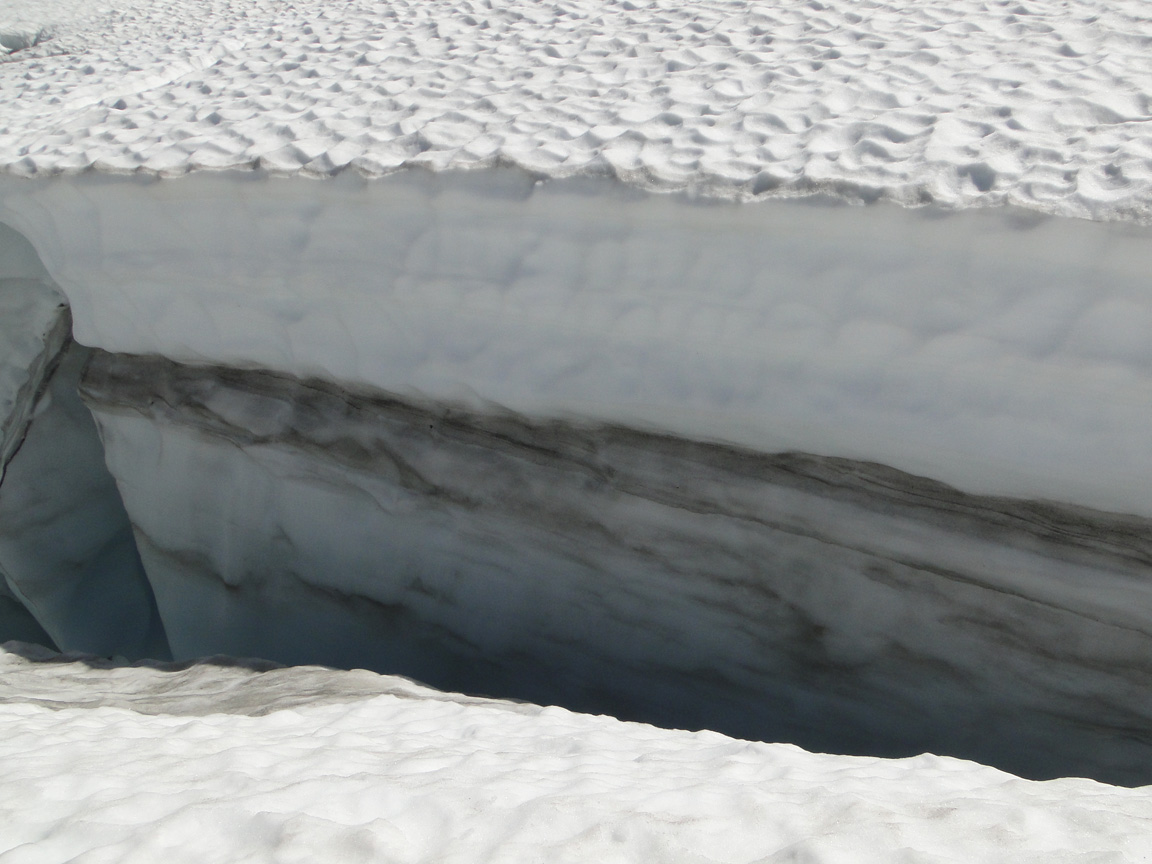
Crevasse measurement of annual snowpack at 2500 m on Easton Glacier comparison of 2019-2022.

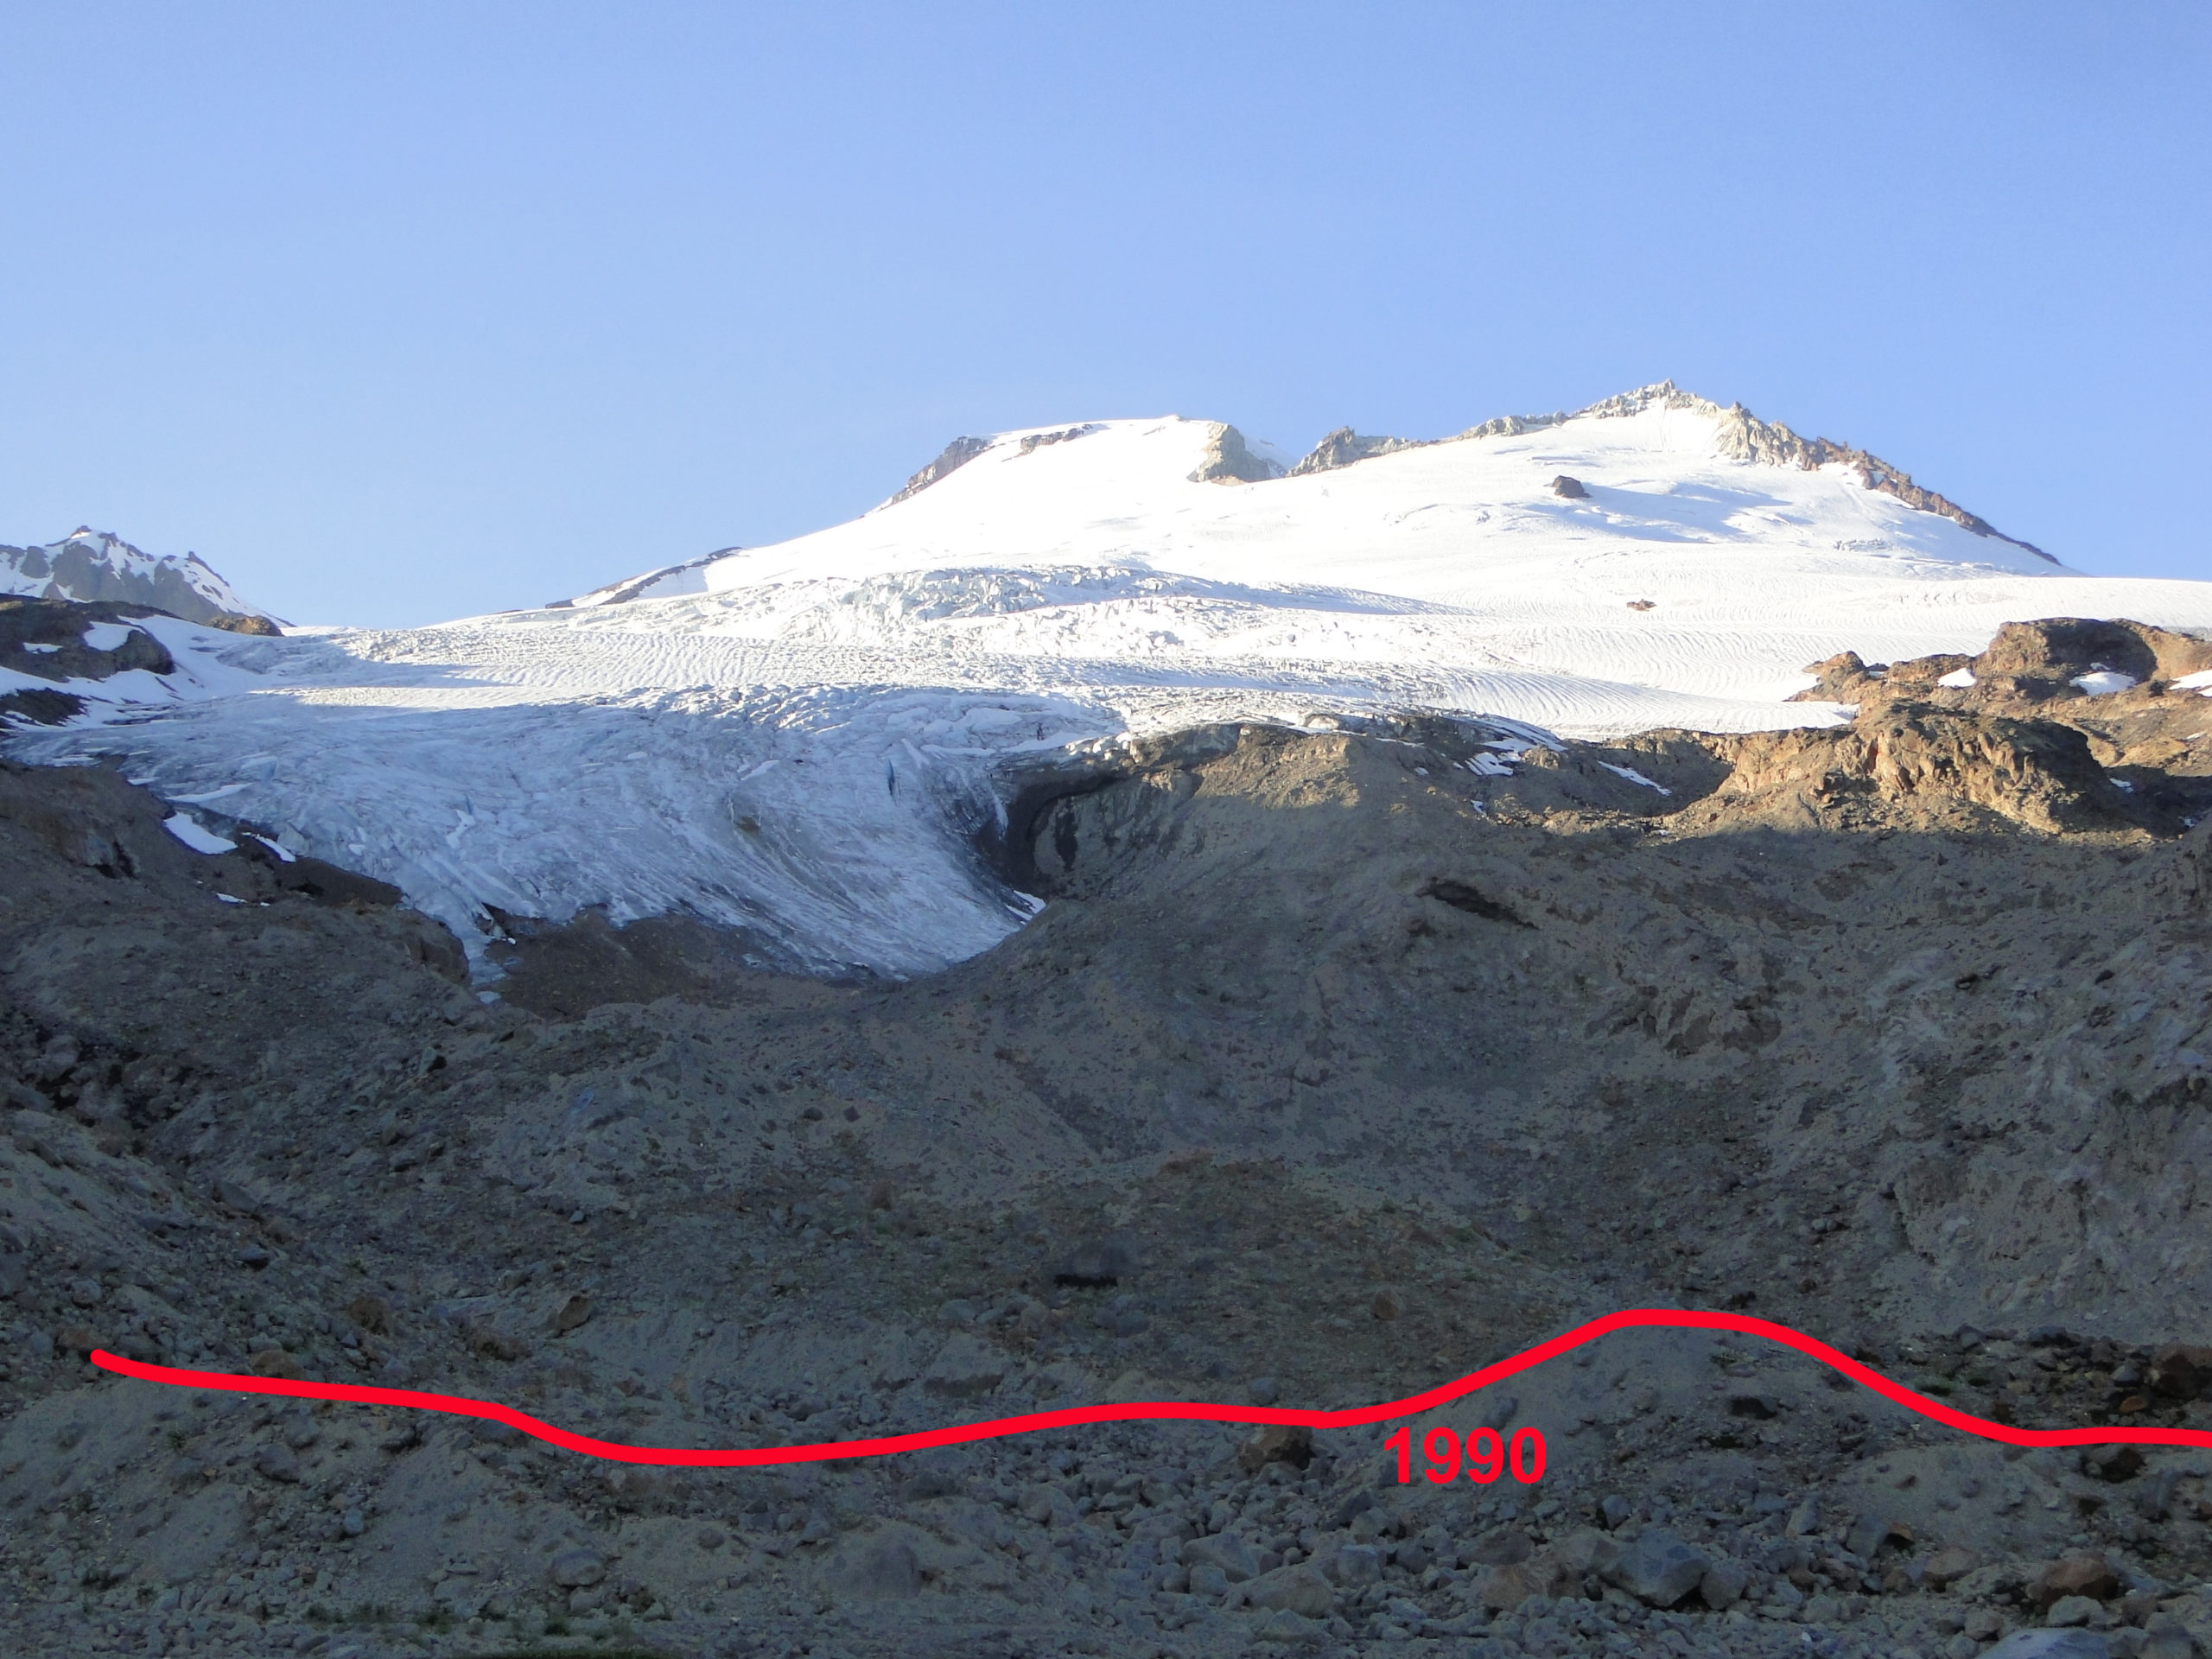
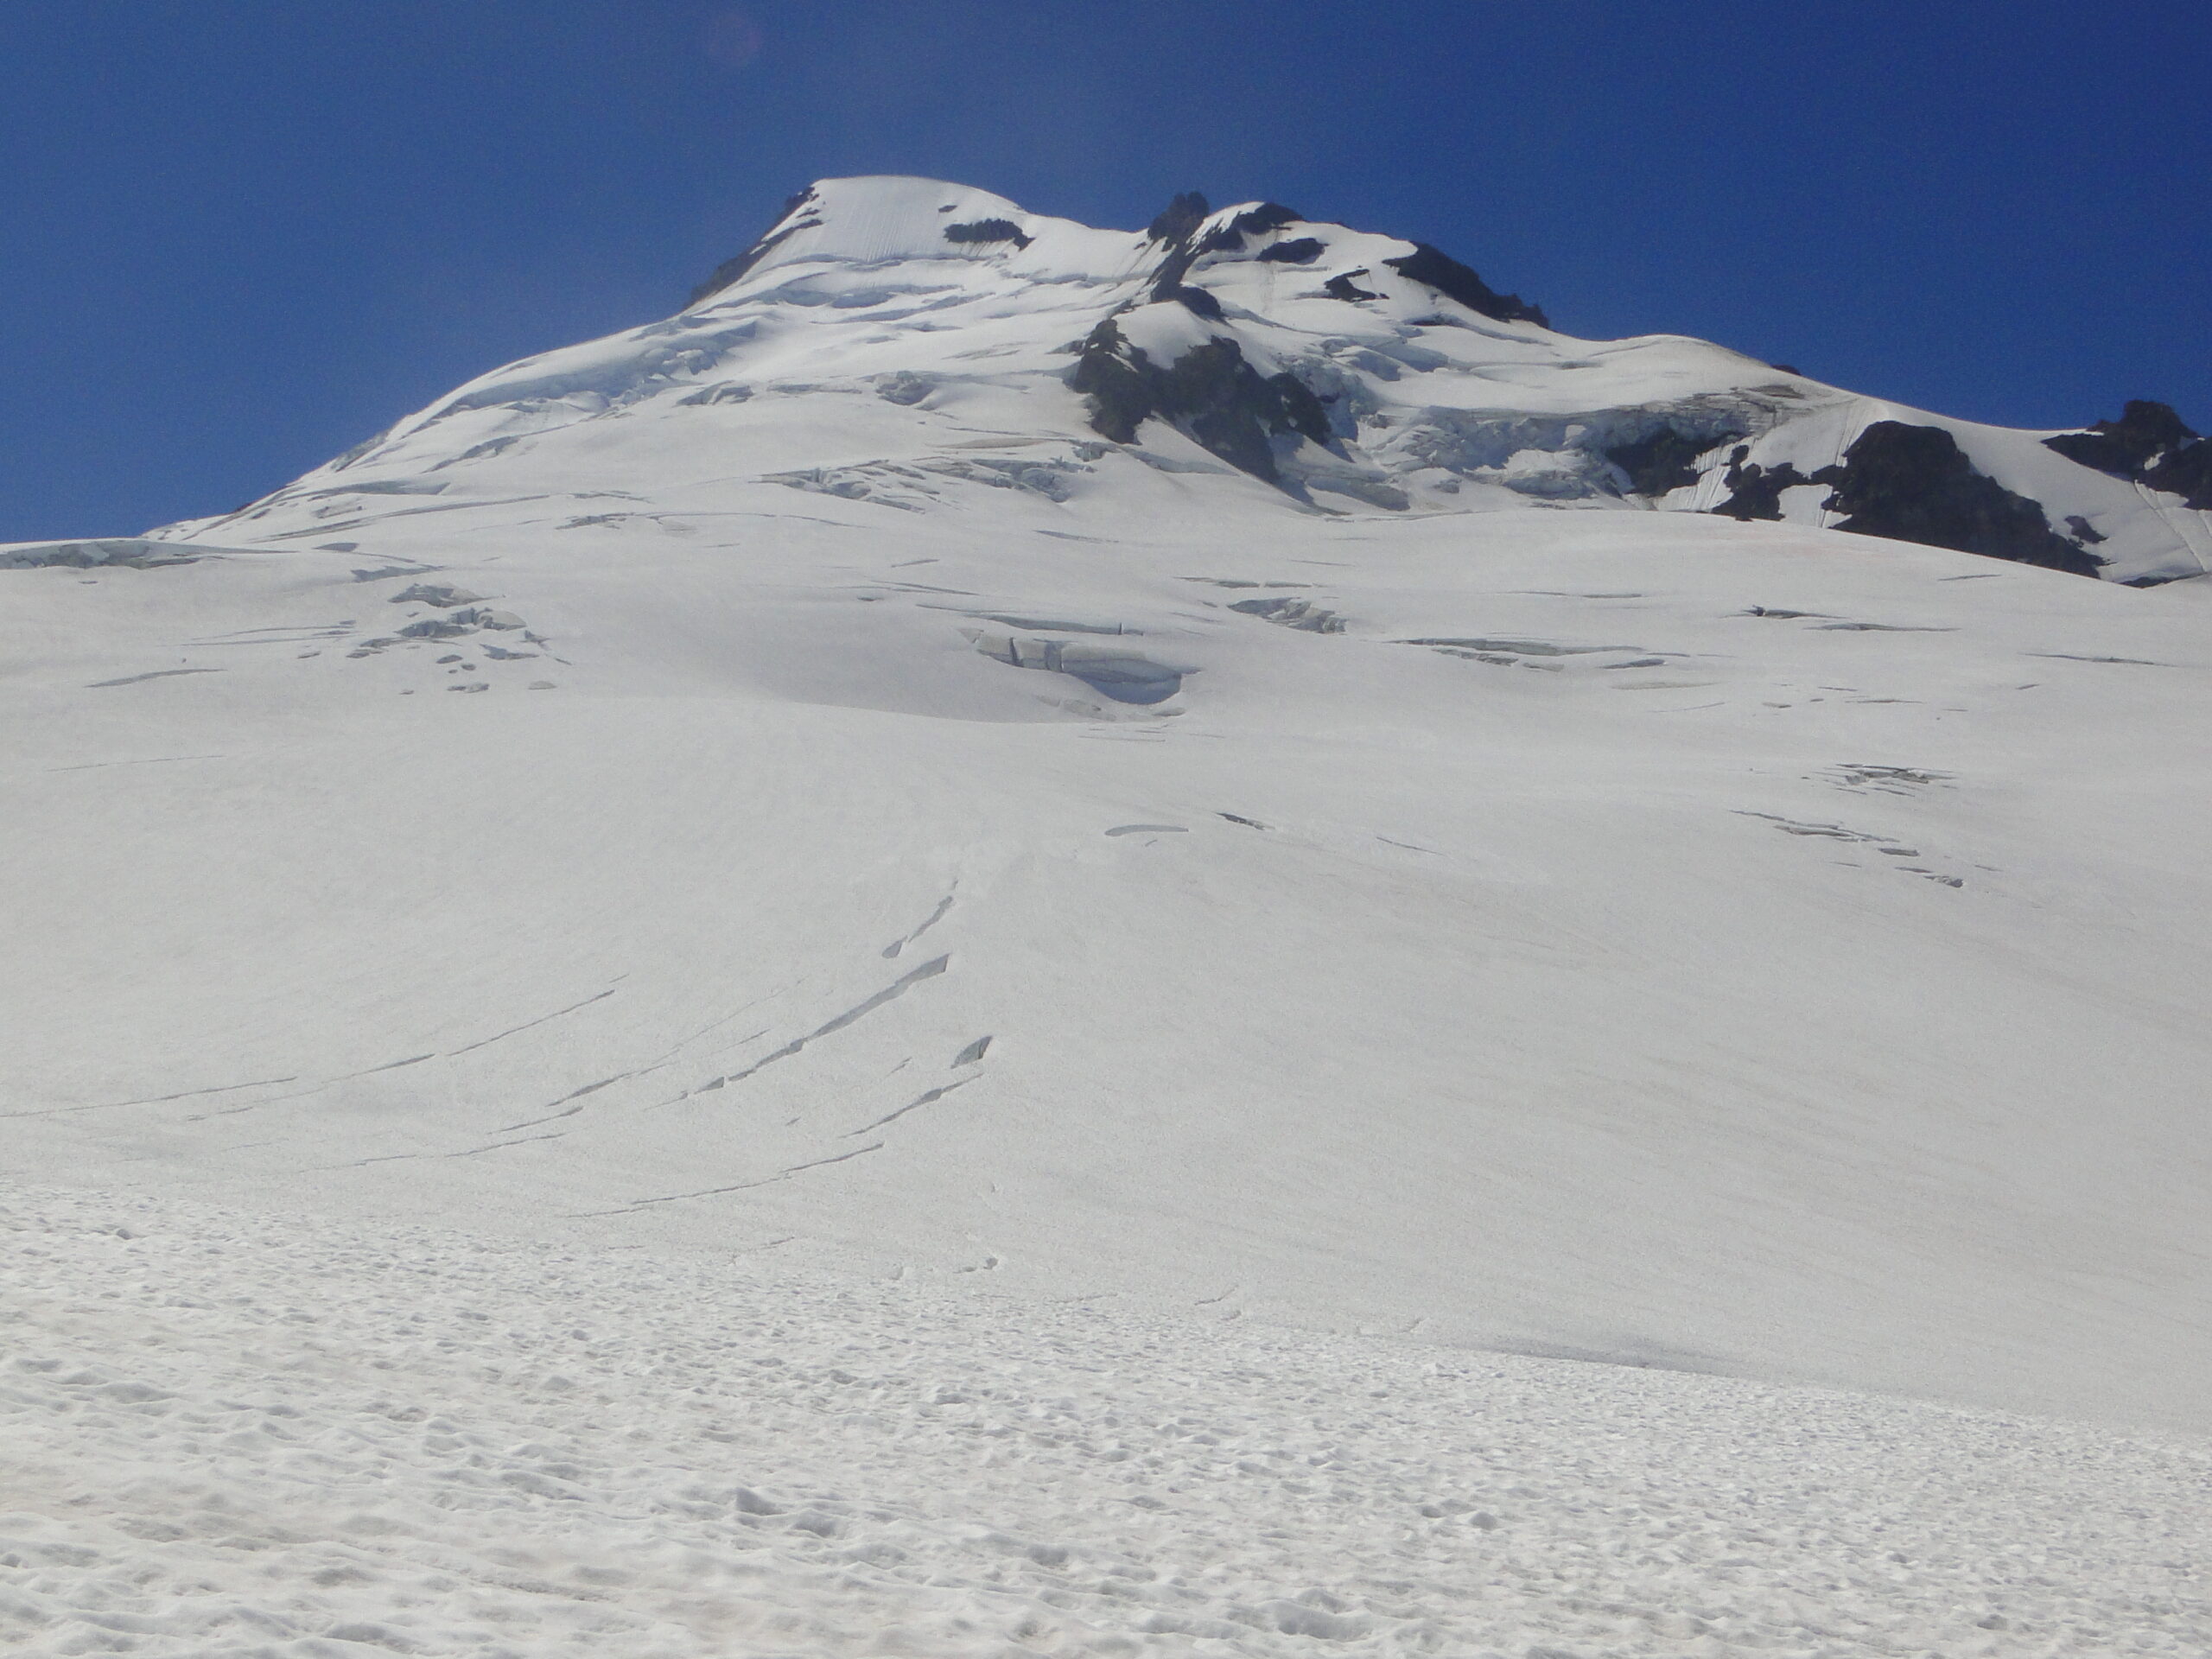
Easton Glacier flows down the south side of the mountain and feeds the Baker Lake Hydropower project. We have monitored the mass balance and terminus change of this glacier every year from 1990-2022. This is a World Glacier Monitoring Service reference glacier. In recent years thinning has exposed a few bedrock knobs near 2200 m on the glacier. The glacier has lost 21 m w.e. since 1990 driving a 470 m retreat during this interval. The pace of loss and retreat has been faster since 2013. The typical snowpack retained at the end of the summer has declined from 2.6 to 1.2 m w.e. at 2300 m.

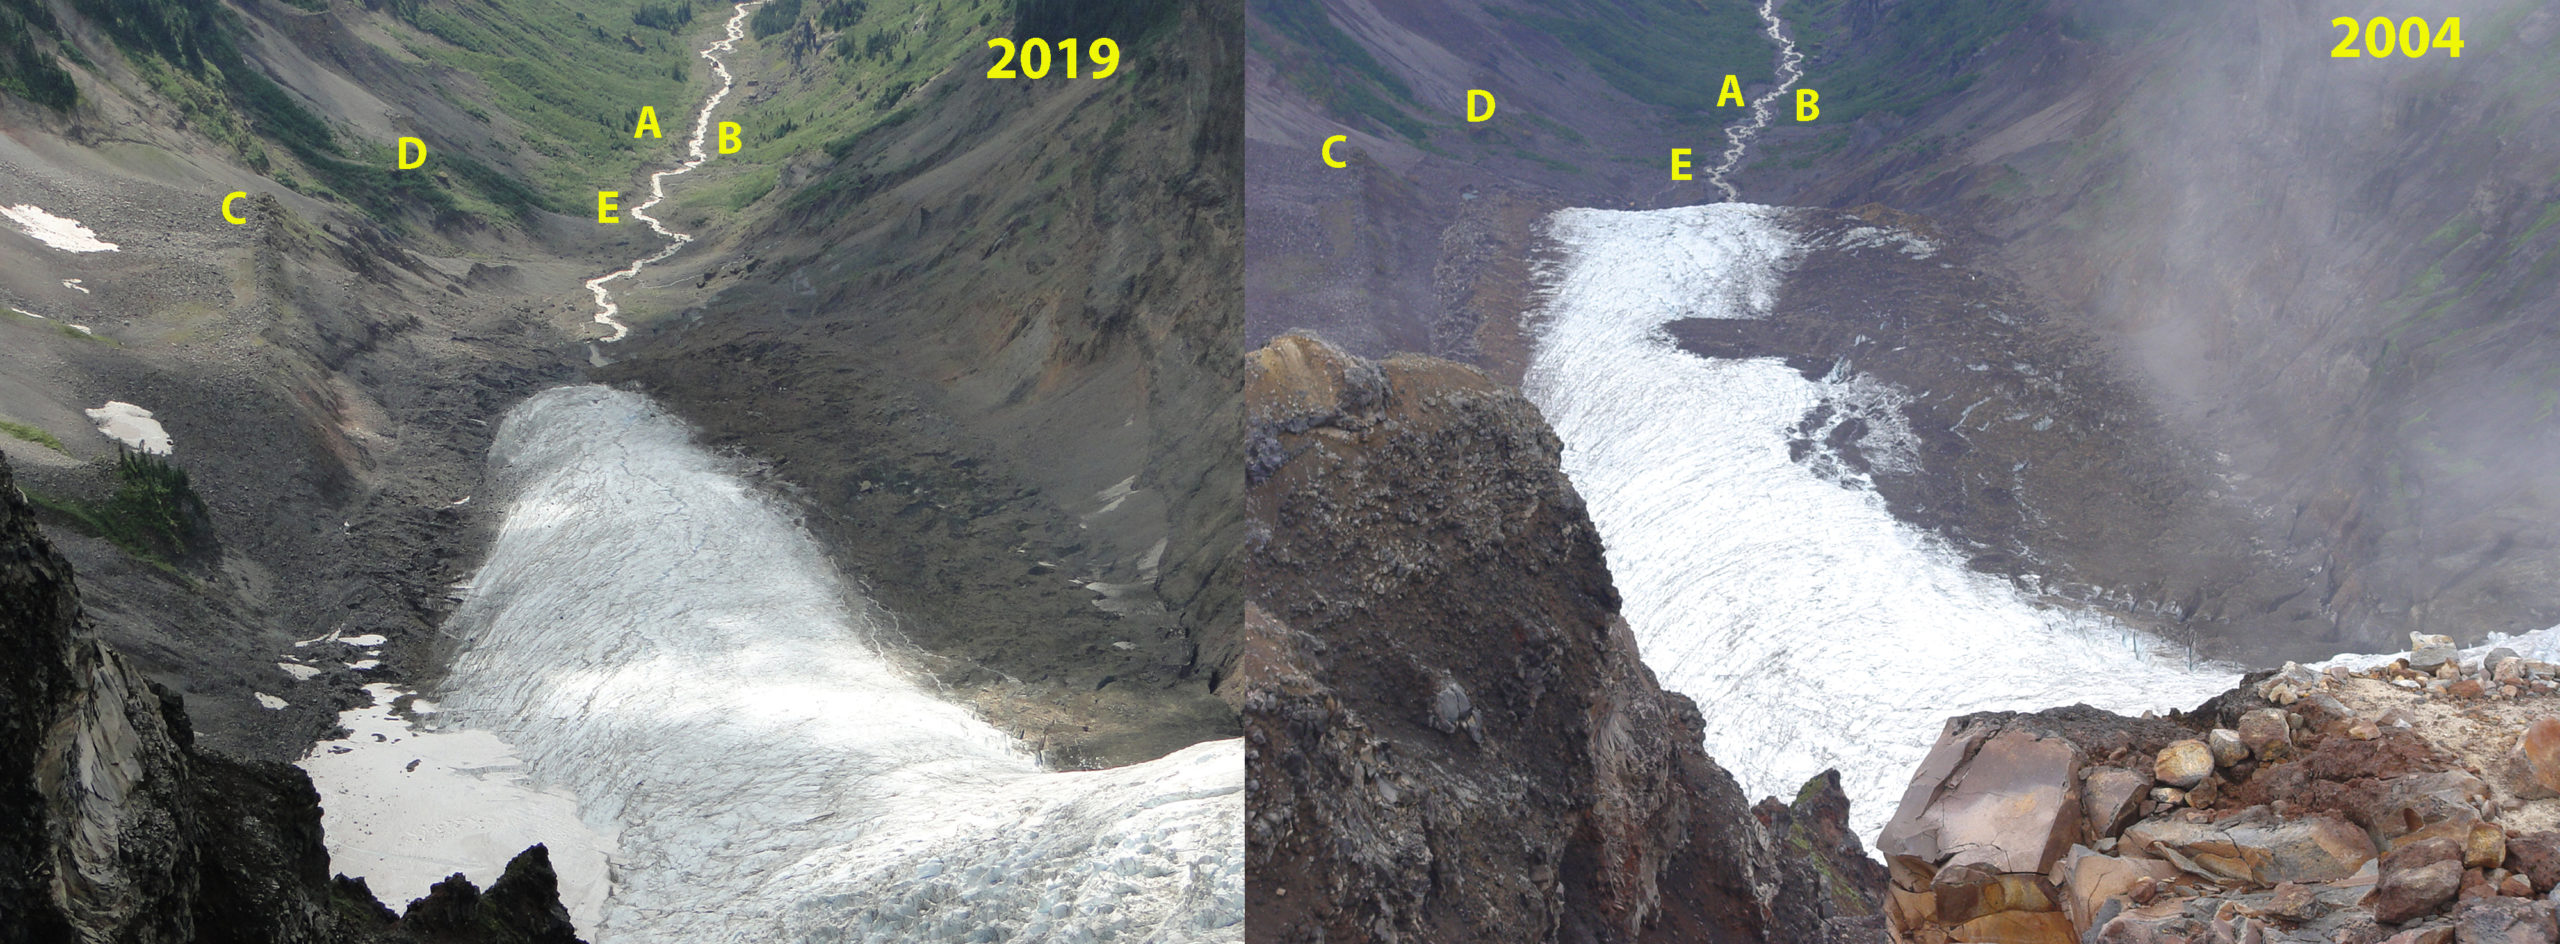
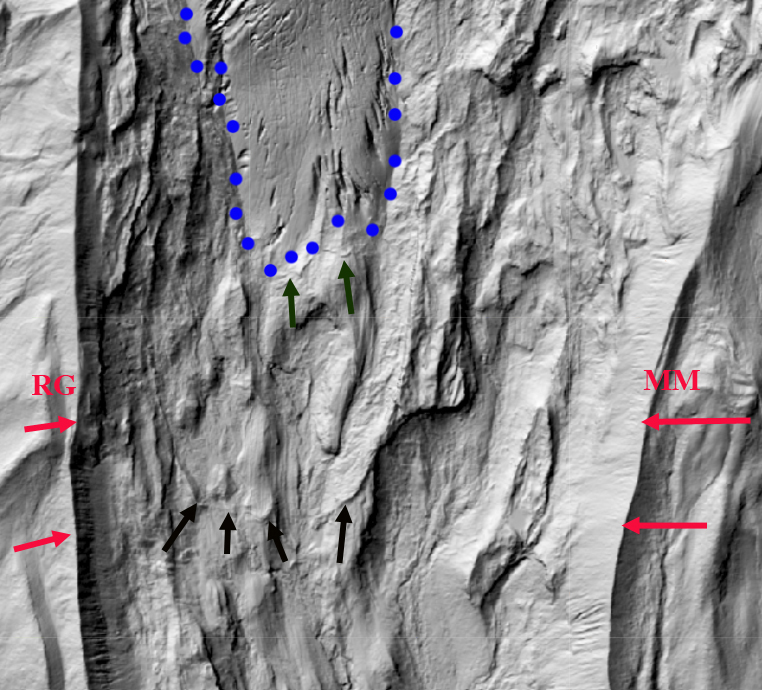
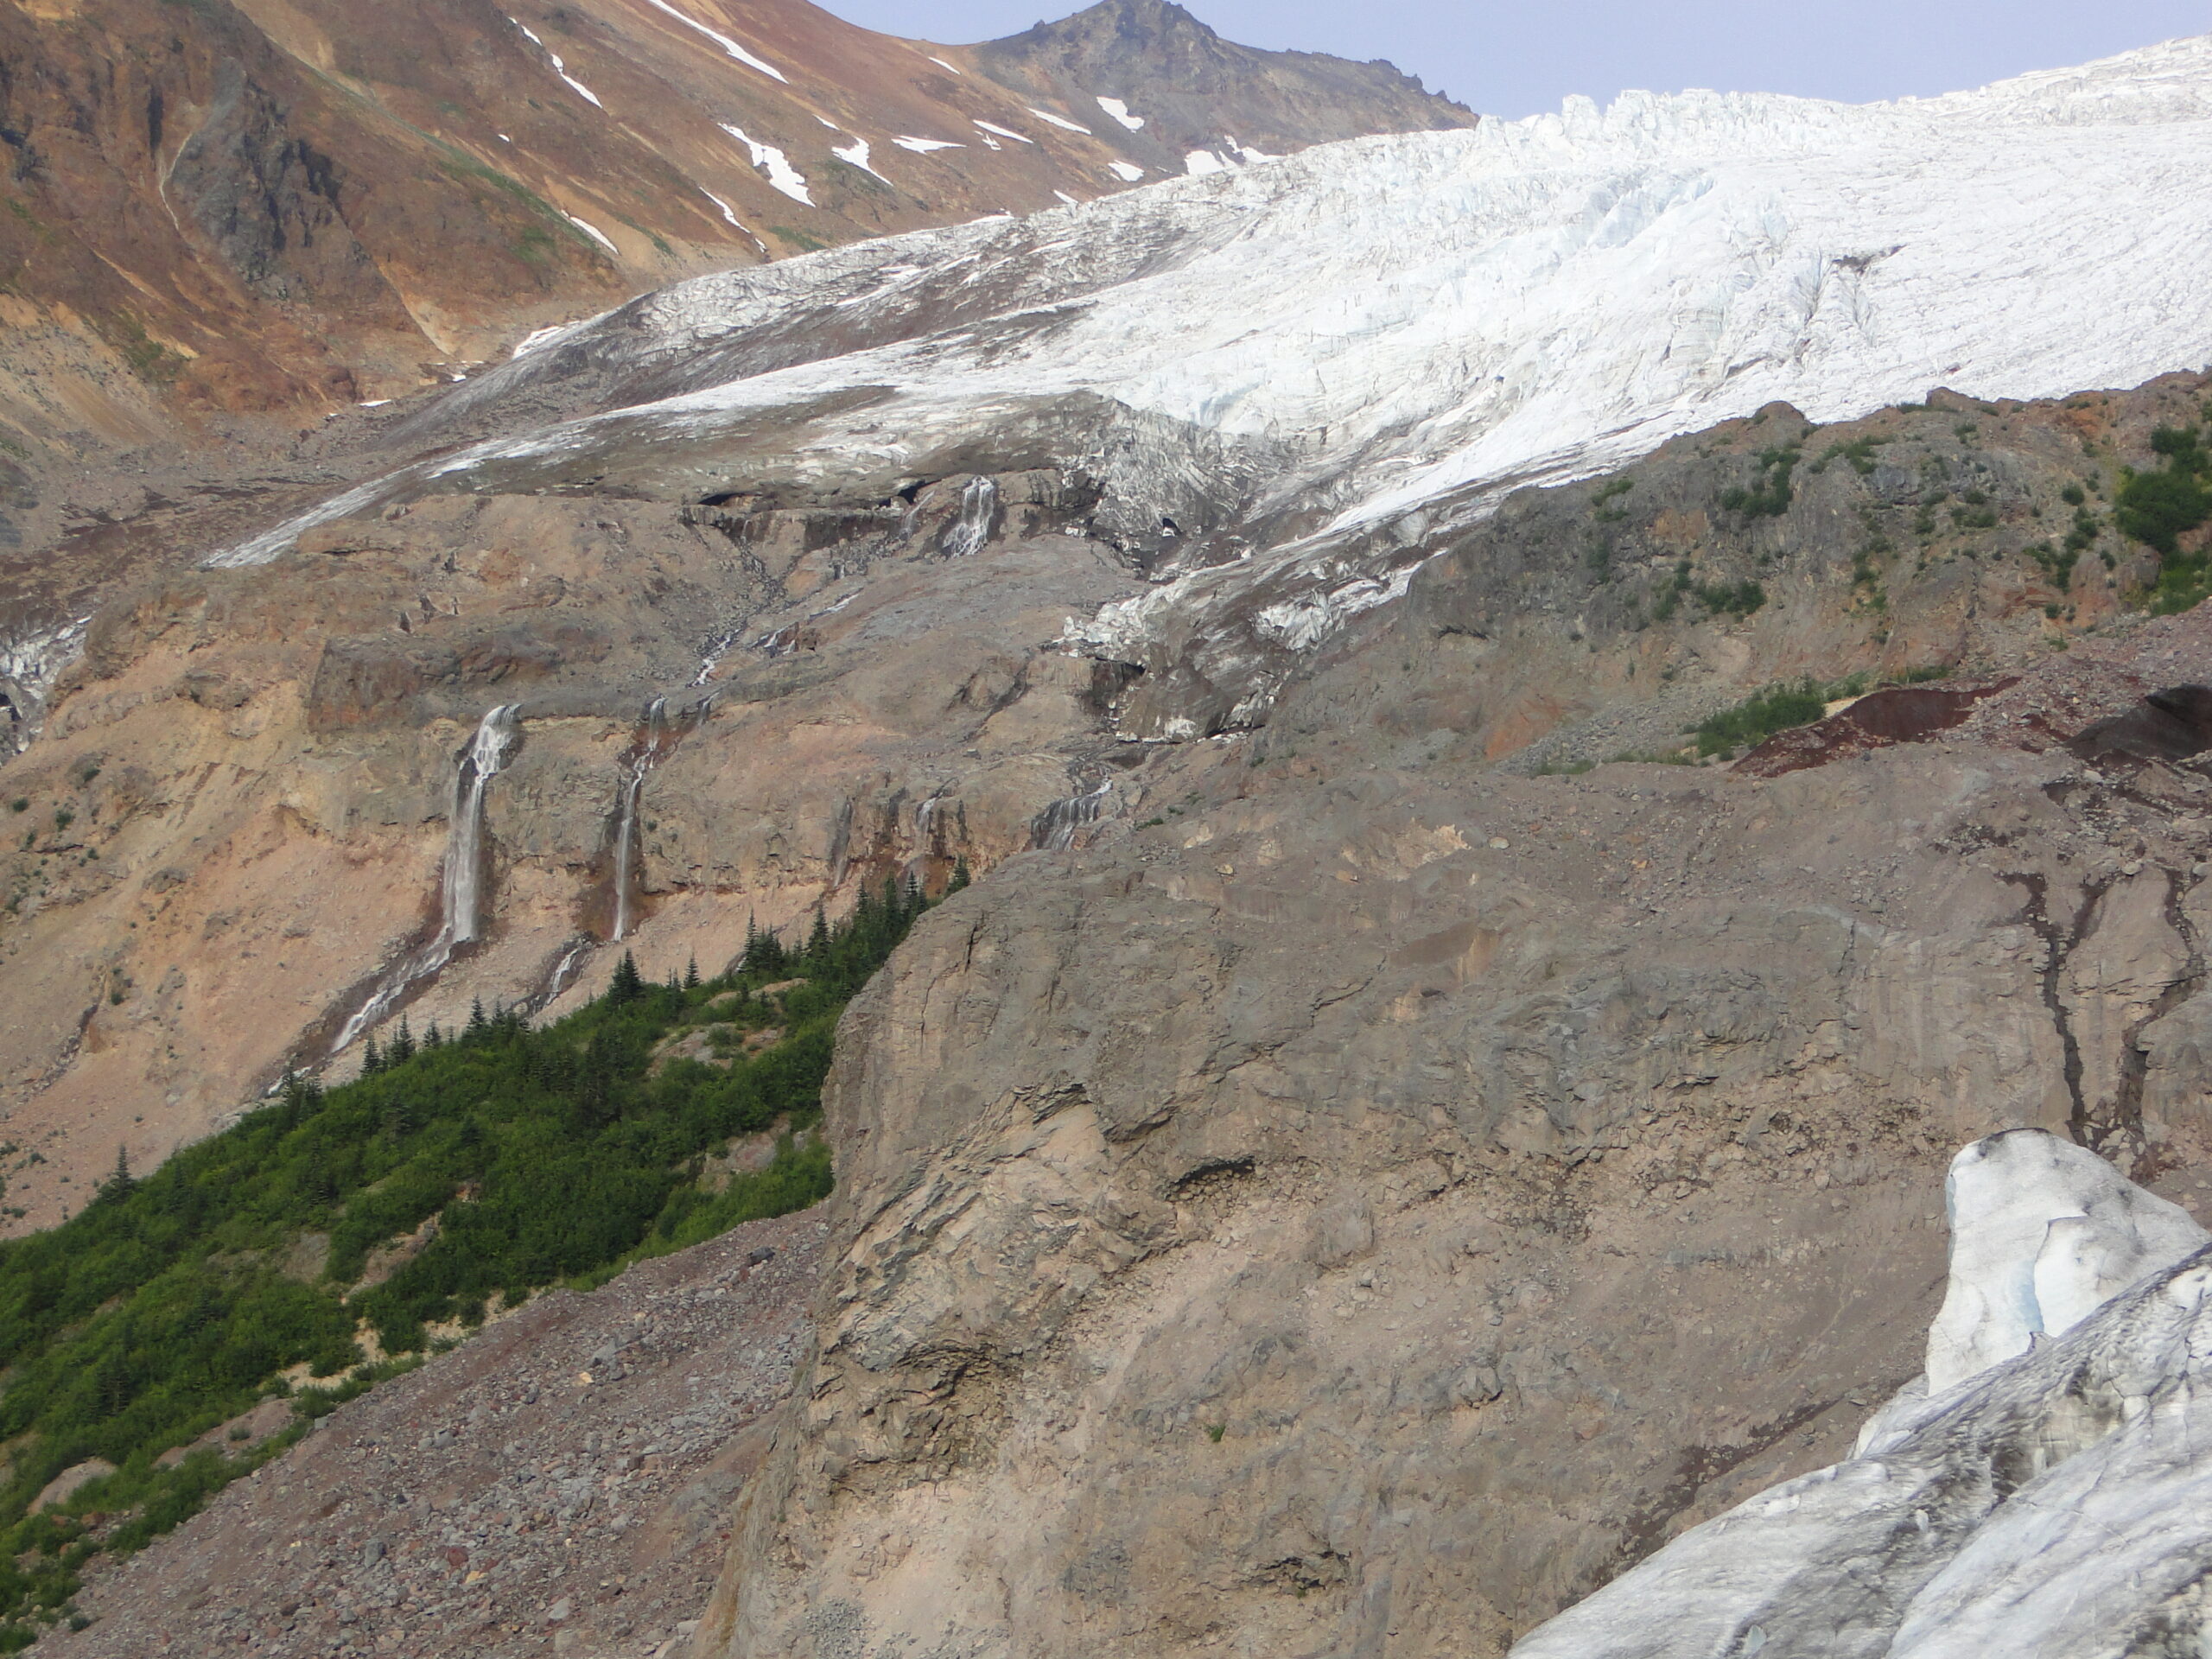
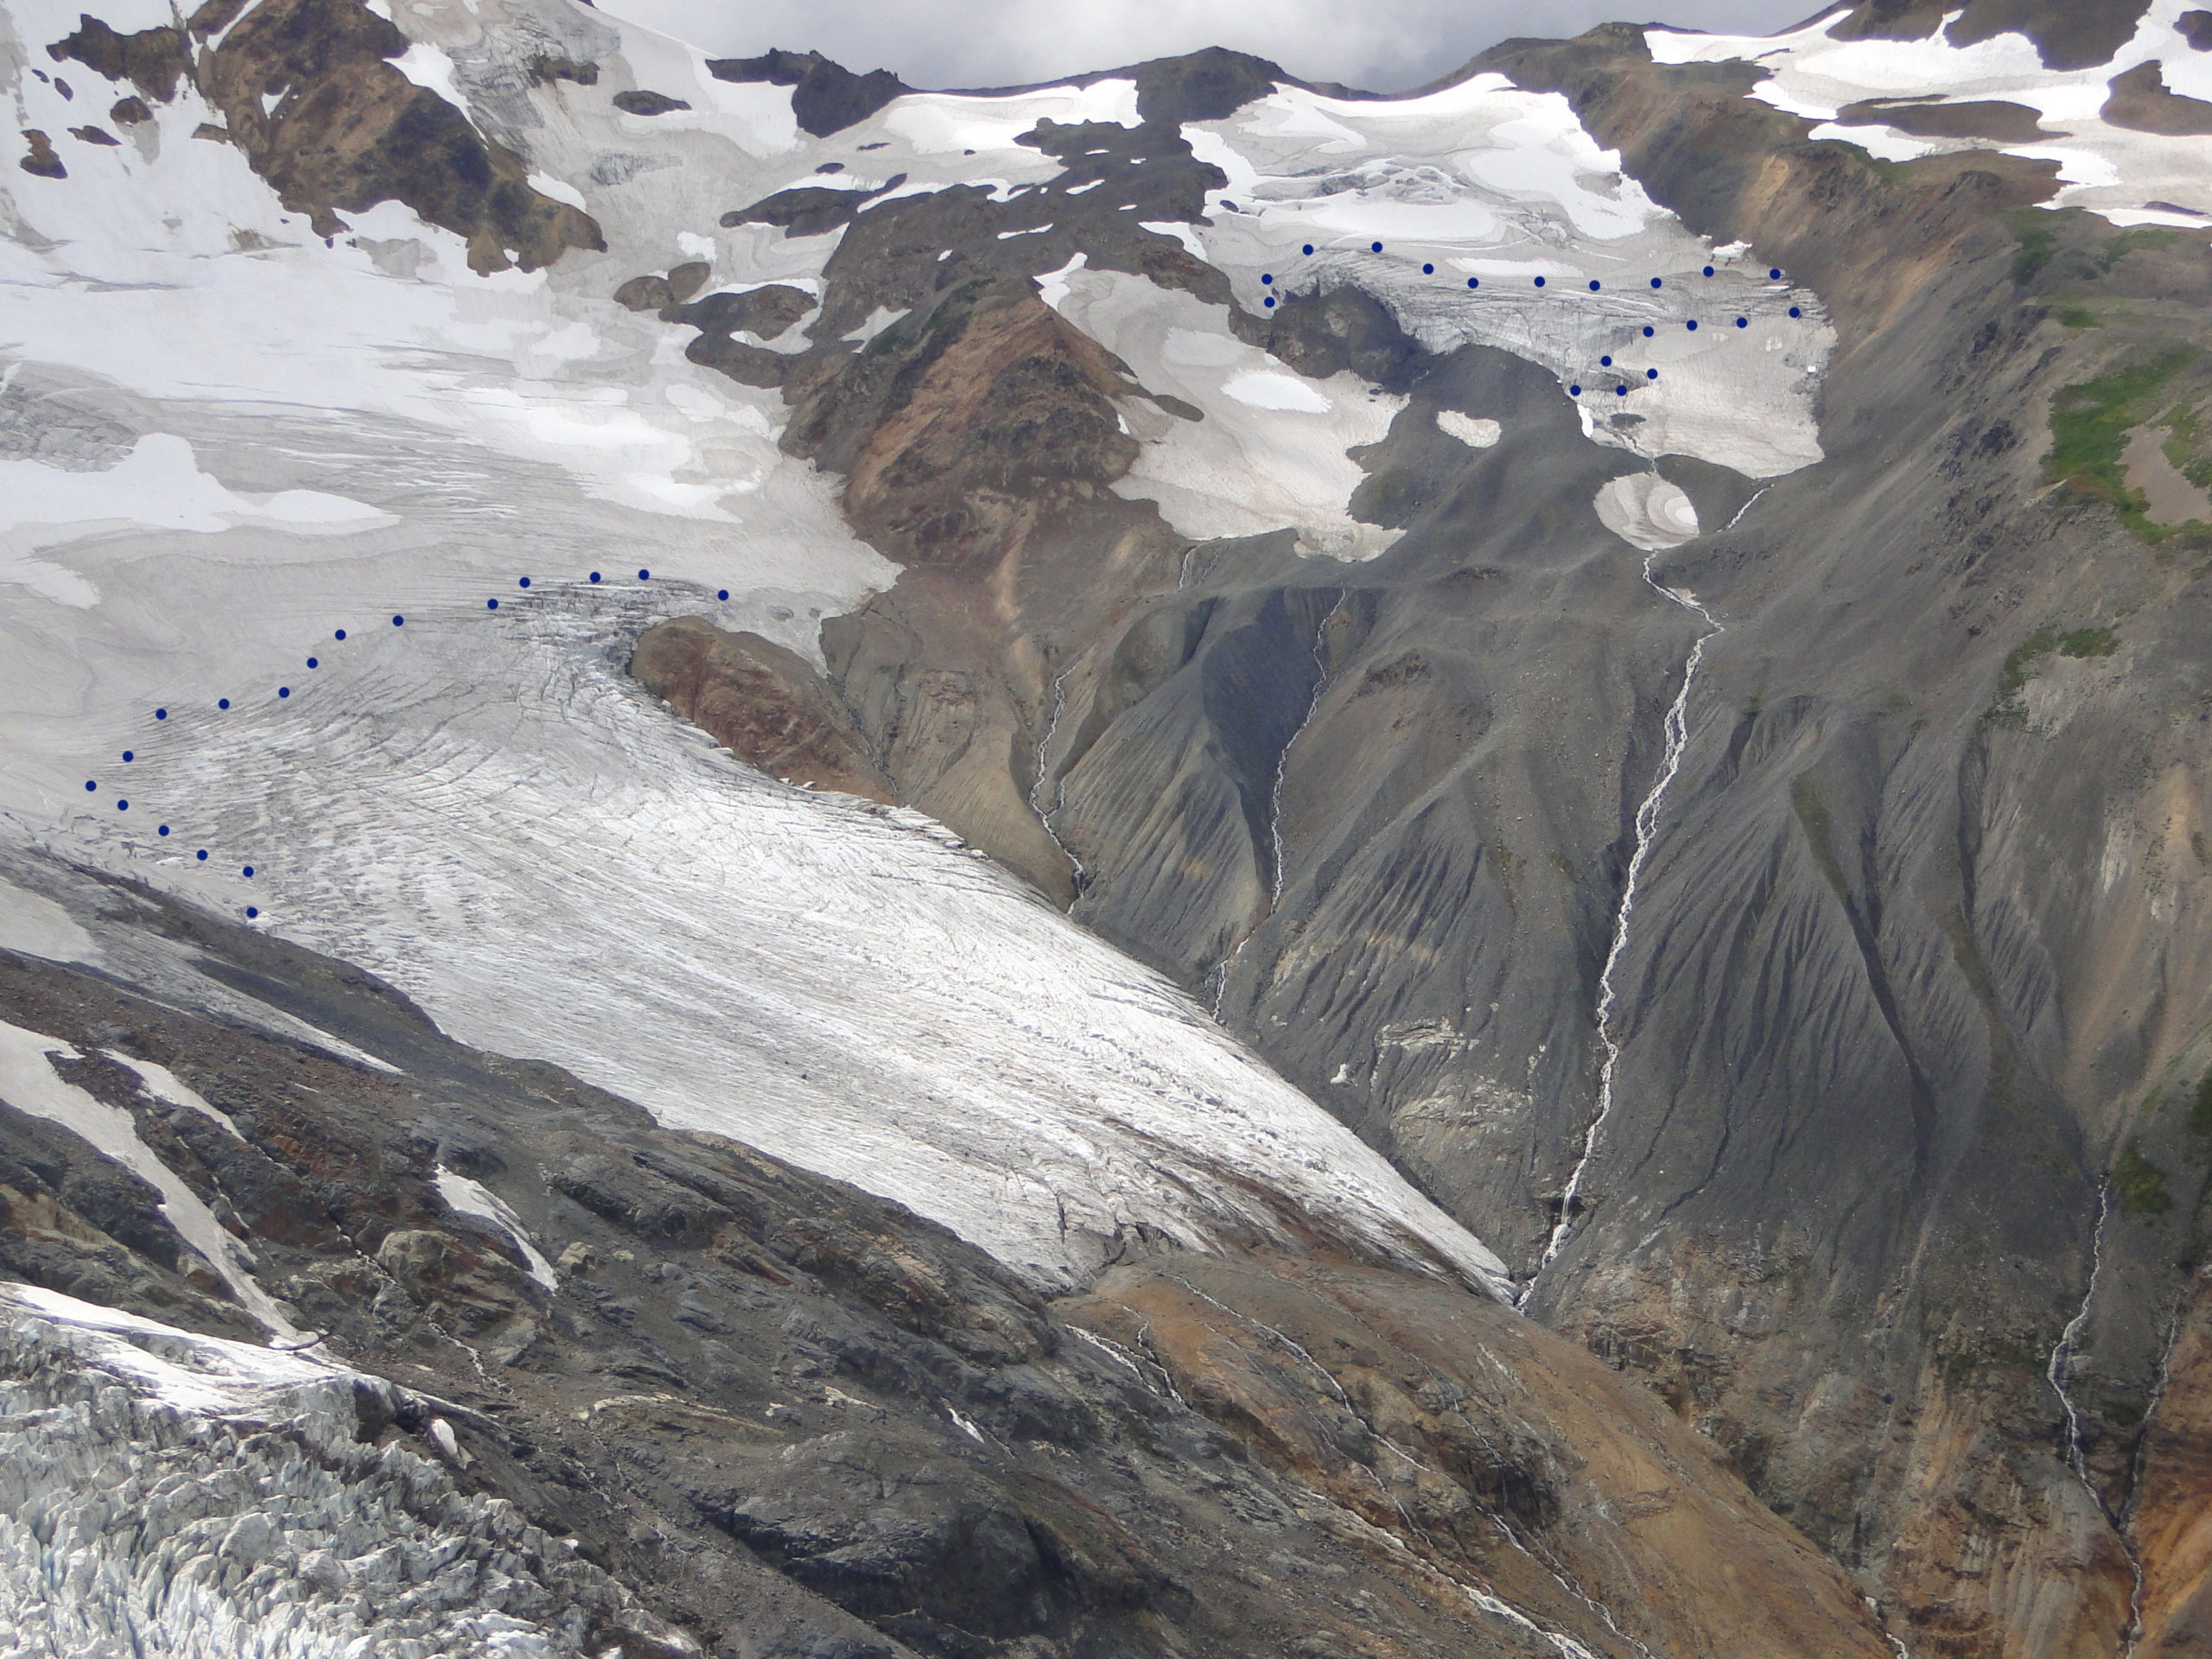
Deming Glacier icefall indicating velocity locations and change in terminus from 1979.

The Deming Glacier drains the southwest side of the summit of Mount Baker a stratovolcano in the North Cascades of Washington, with a massive icefall feeding the lower valley terminus reach of the glacier. The icefall begins at 2200 meters and descends to 1600 meters. The glacier feeds the Middle Fork Nooksack River which provides water supply to Bellingham, WA. Deming Glacier flows from the summit and is the headwaters of the Middle Fork Nooksack River. We observed the terminus of this glacier every year from a survey point and conduct snow depth measurements at 2200 m on the glacier. he NASA Measures ITS_LIVE application uses feature tracking to determine glacier velocity. An examination of velocity change from the top of the icefall to the bottom on Deming Glacier from 2015-2022 indicates deceleration at the three points within or below the icefall, but no change at the top of the icefall.  At the top of the icefall red X velocity has declined ~20%. In the middle of the icefall, green X, velocity has also declined ~20% since 2017. Near the base of the icefall, orange X, velocity has a chaotic signal lacking a clear trend.  Below the icefall at the blue X, velocity has declined by ~20-30%.  The resulting reduction in flux to the terminus will continue the rapid retreat.  Pelto and Brown (2012) measured a 360 m retreat of Deming Glacier from 1979-2009, ~20 m/year. From 1979-2021 the glacier has retreated 725 m, with the rate of retreat from 2009-2021 of ~30 m/year.

Coleman Glacier and Roosevelt Glacier terminus at their maximum size in 1979, photo from Austin Post. Each has receded above the first prominent icefall step indicated by extensive crevassing.

Coleman and Roosevelt Glacier in 2014

In 1984 Coleman Glacier had just completed its advance begun in 1948.  The Roosevelt Glacier on left almost merged with it and Coleman stretched across the Glacier Creek in the valley bottom leaving a prominent moraine that we surveyed retreat from.  The Coleman Glacier has retreated 200 m upslope from Glacier Creek by 1997. Retreat has accelerated with 675 m of retreat from the 1979 moraine to 2022. In 2019 we surveyed the same line across the glacier at 1800 m that we had examined in 1988 and found the glacier had thinned by 38 m in this area.


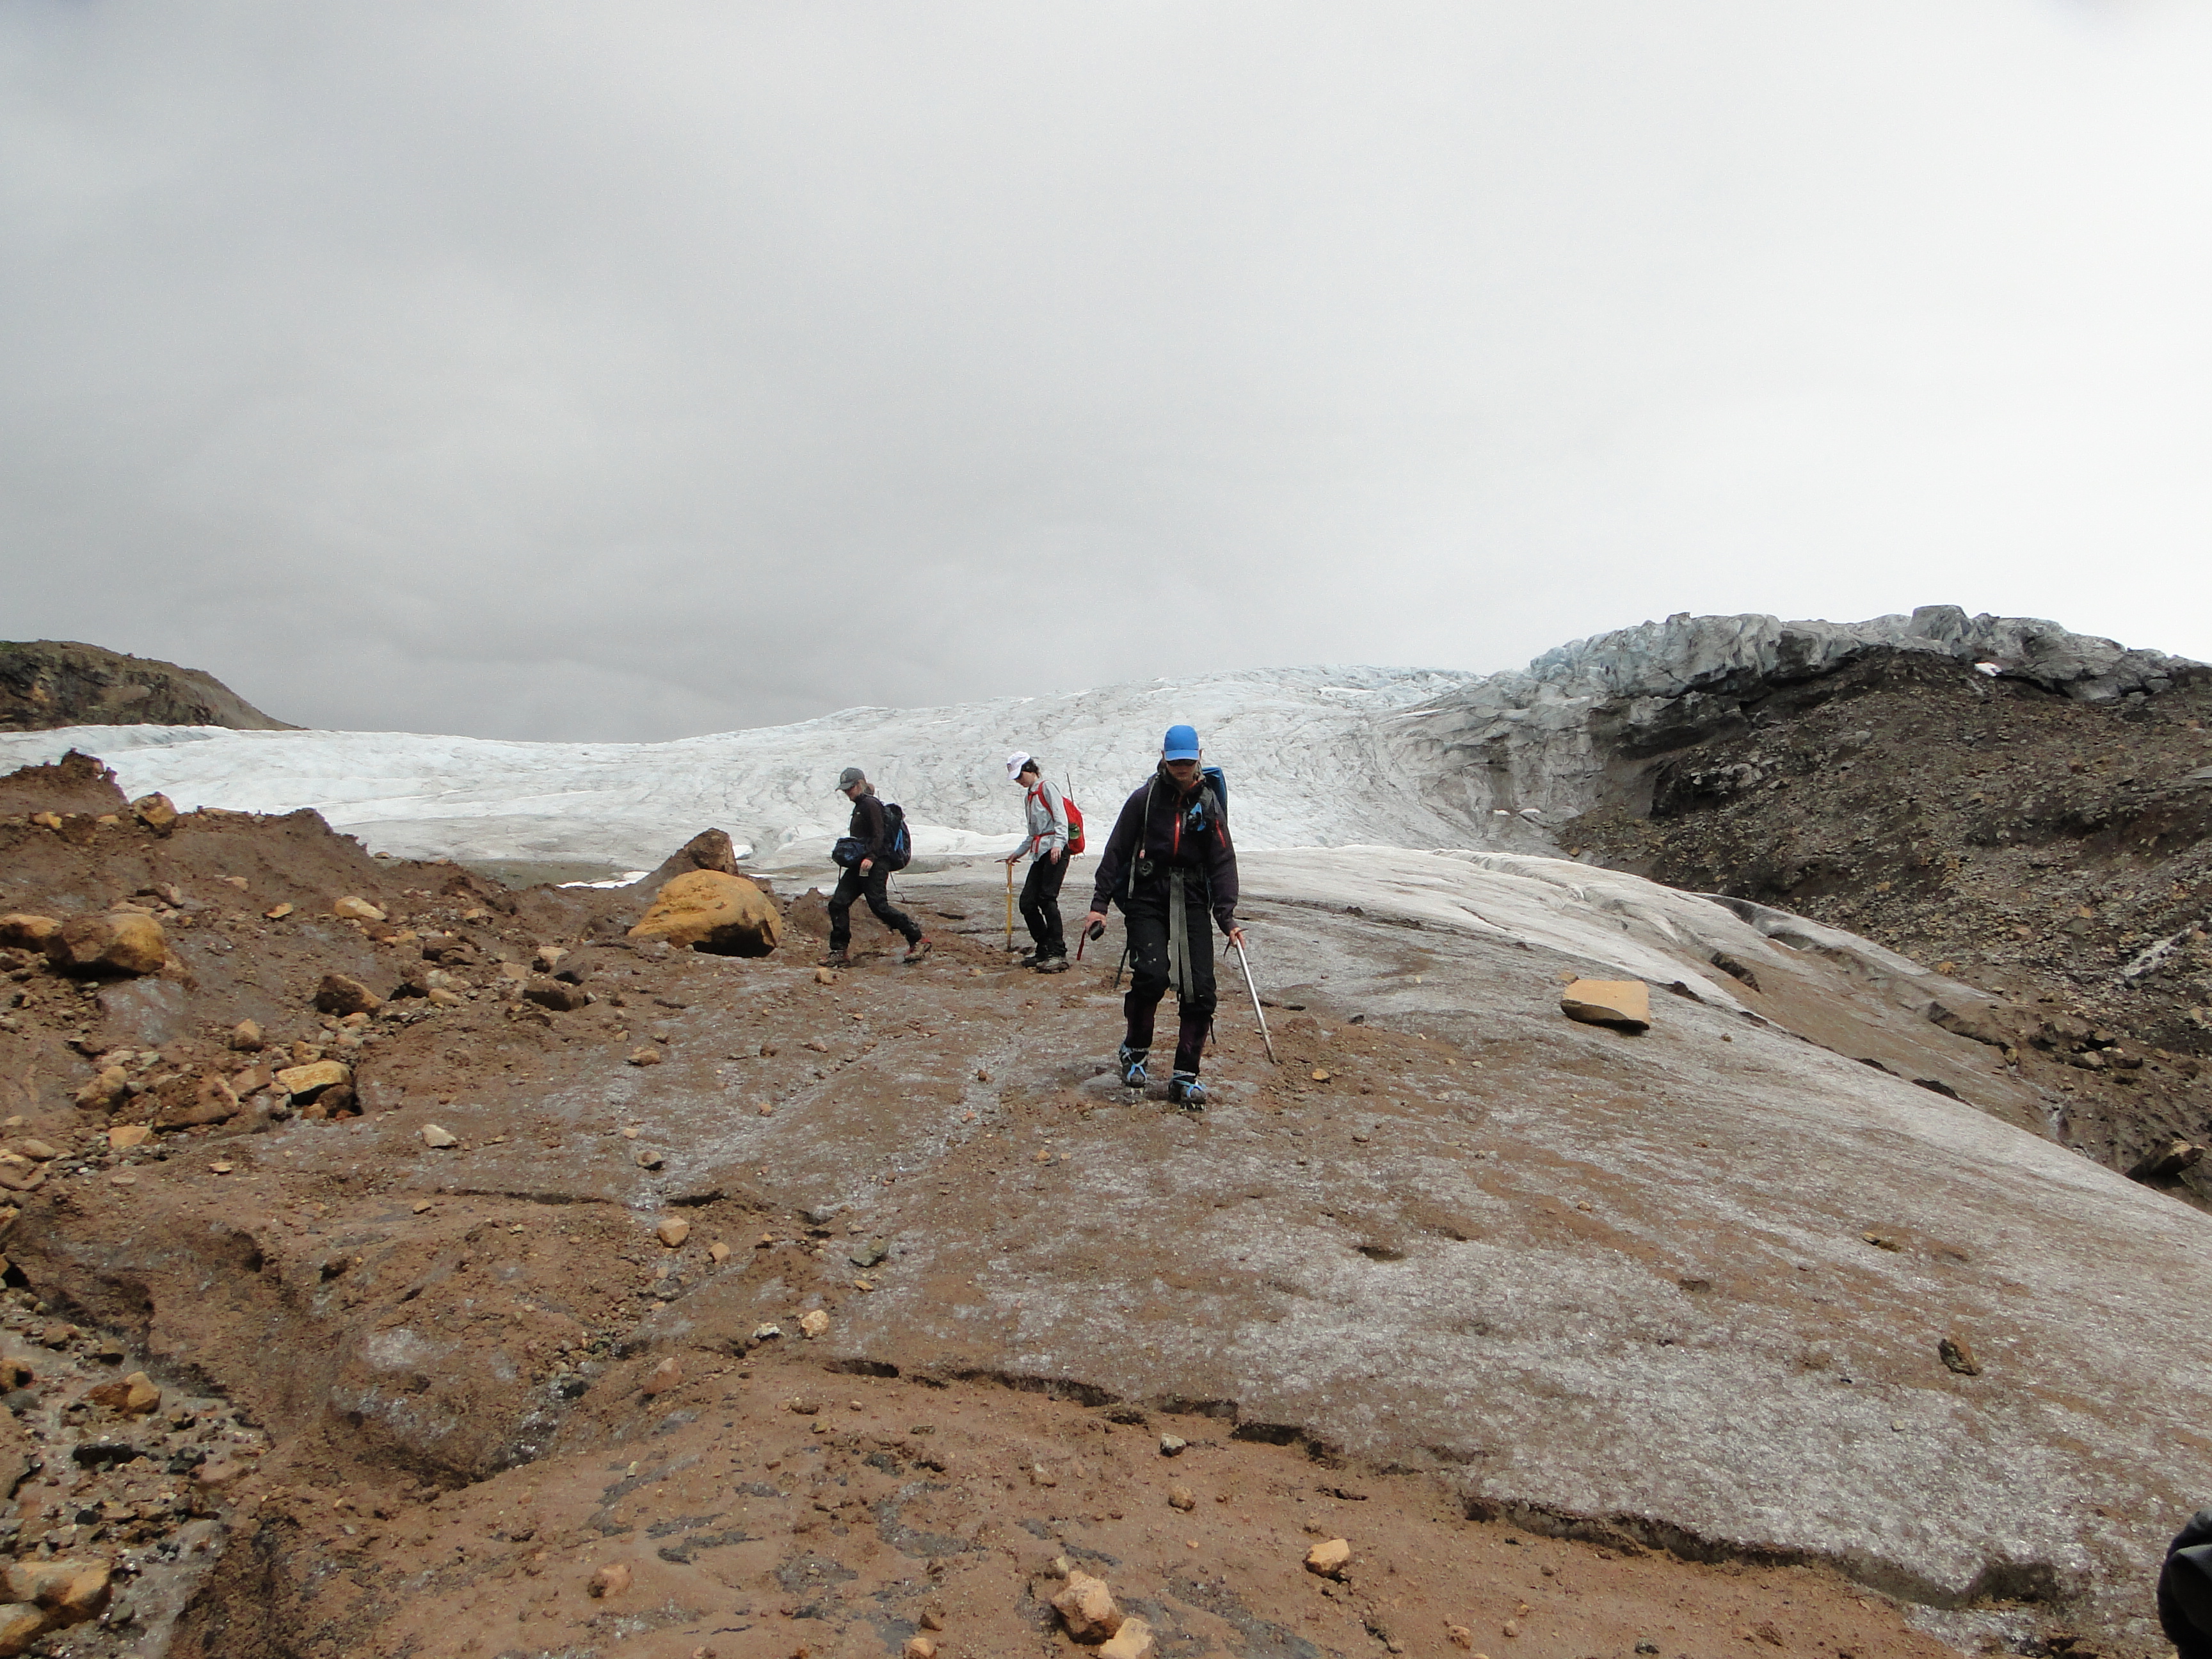
Coleman Glacier Terminus in 2022.

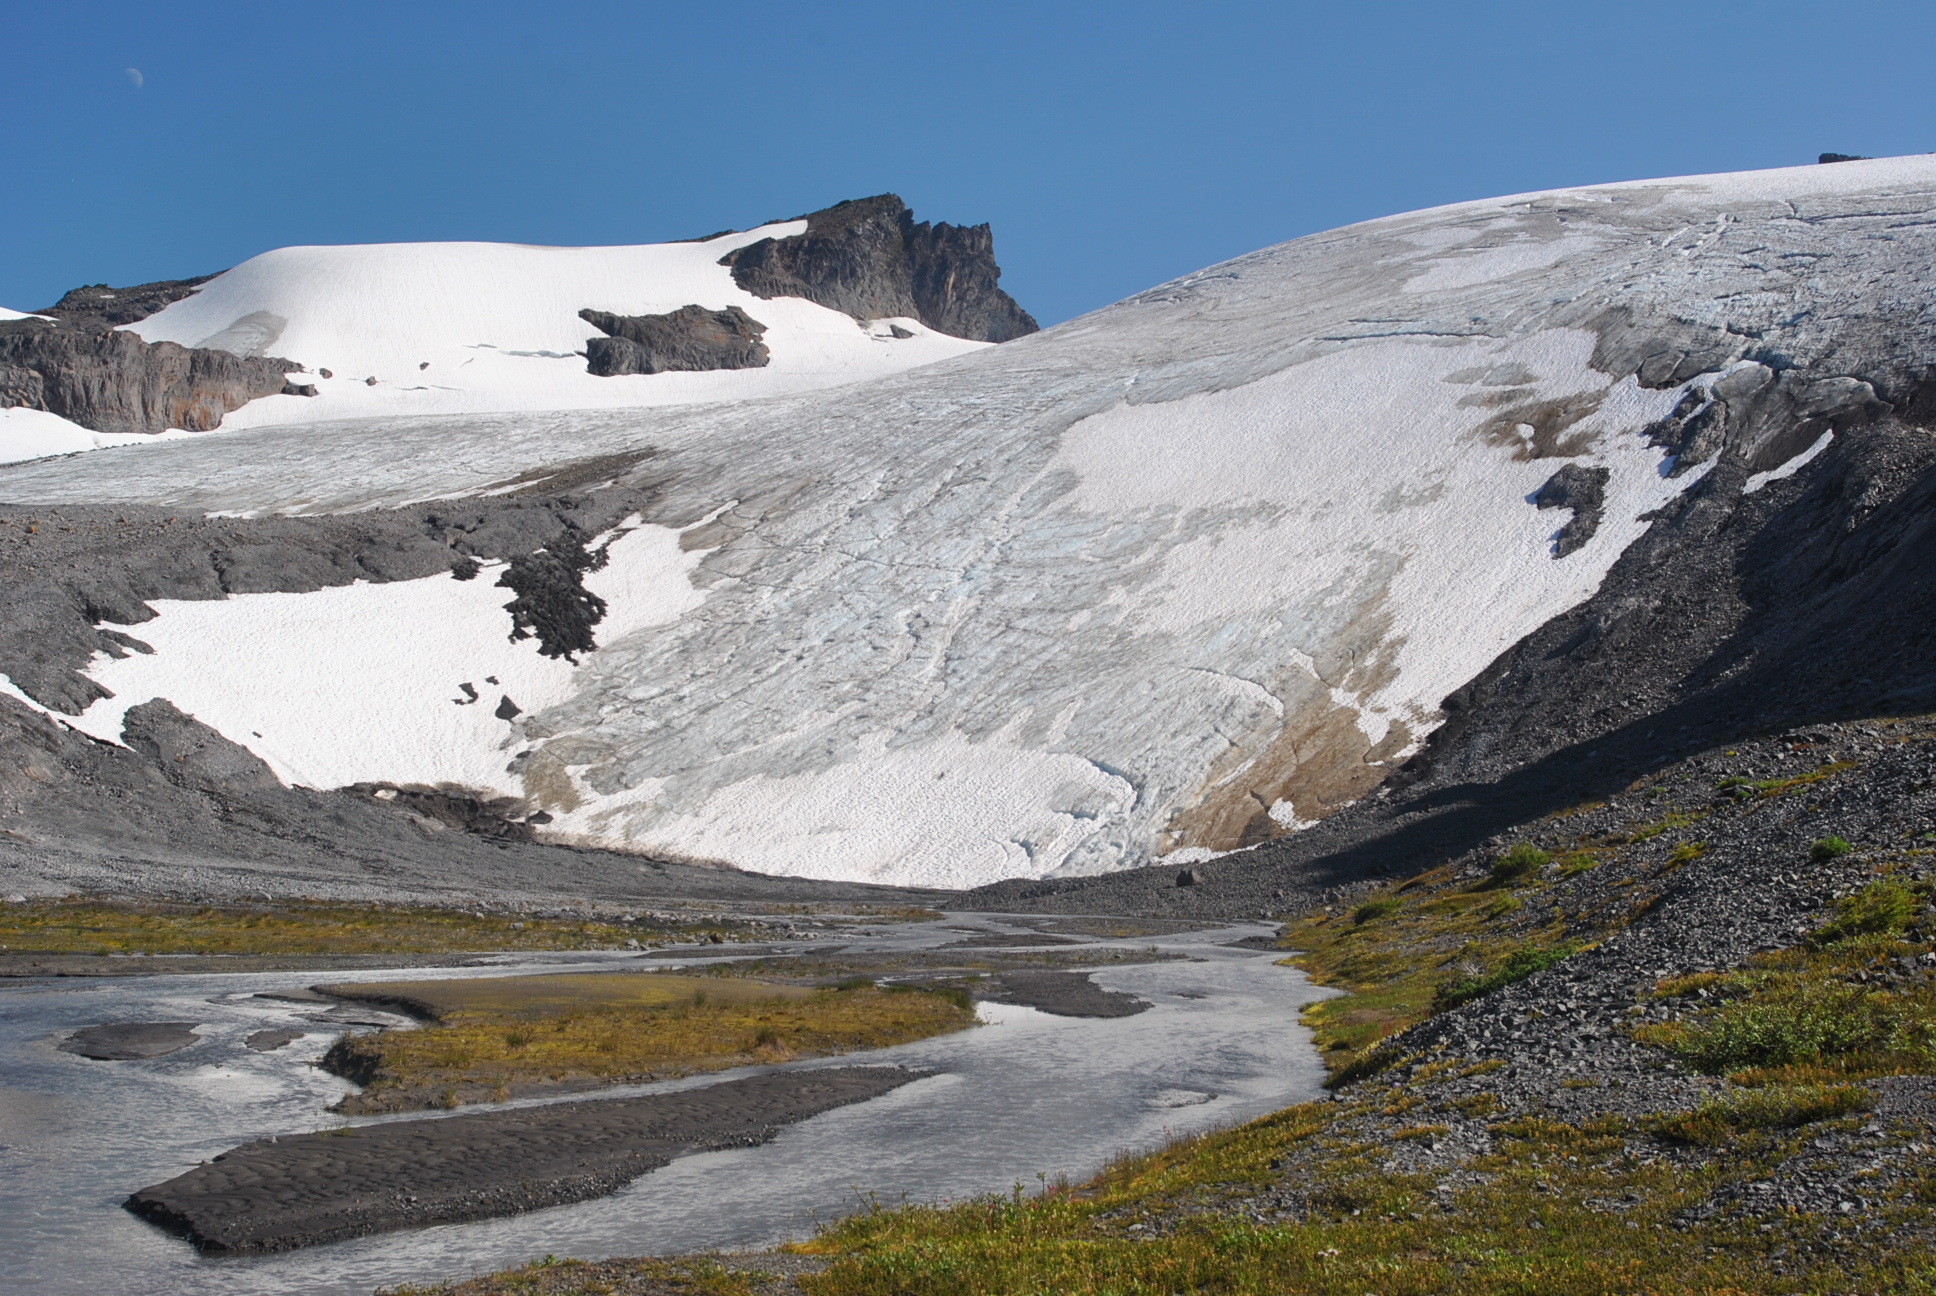
Roosevelt Glacier retreating to top of bedrock step in 2019.

Roosevelt Glacier is adjacent to Coleman Glaier on the northwest side of Mount Baker. It has followed the same pattern as the Coleman Glacier with less total retreat since 1979 of 550 m.  The glacier in 2022 has retreated above a large bedrock step and has a thin profile that will encourage ongoing rapid retreat.

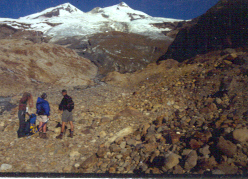
Mazama Glacier in 2015

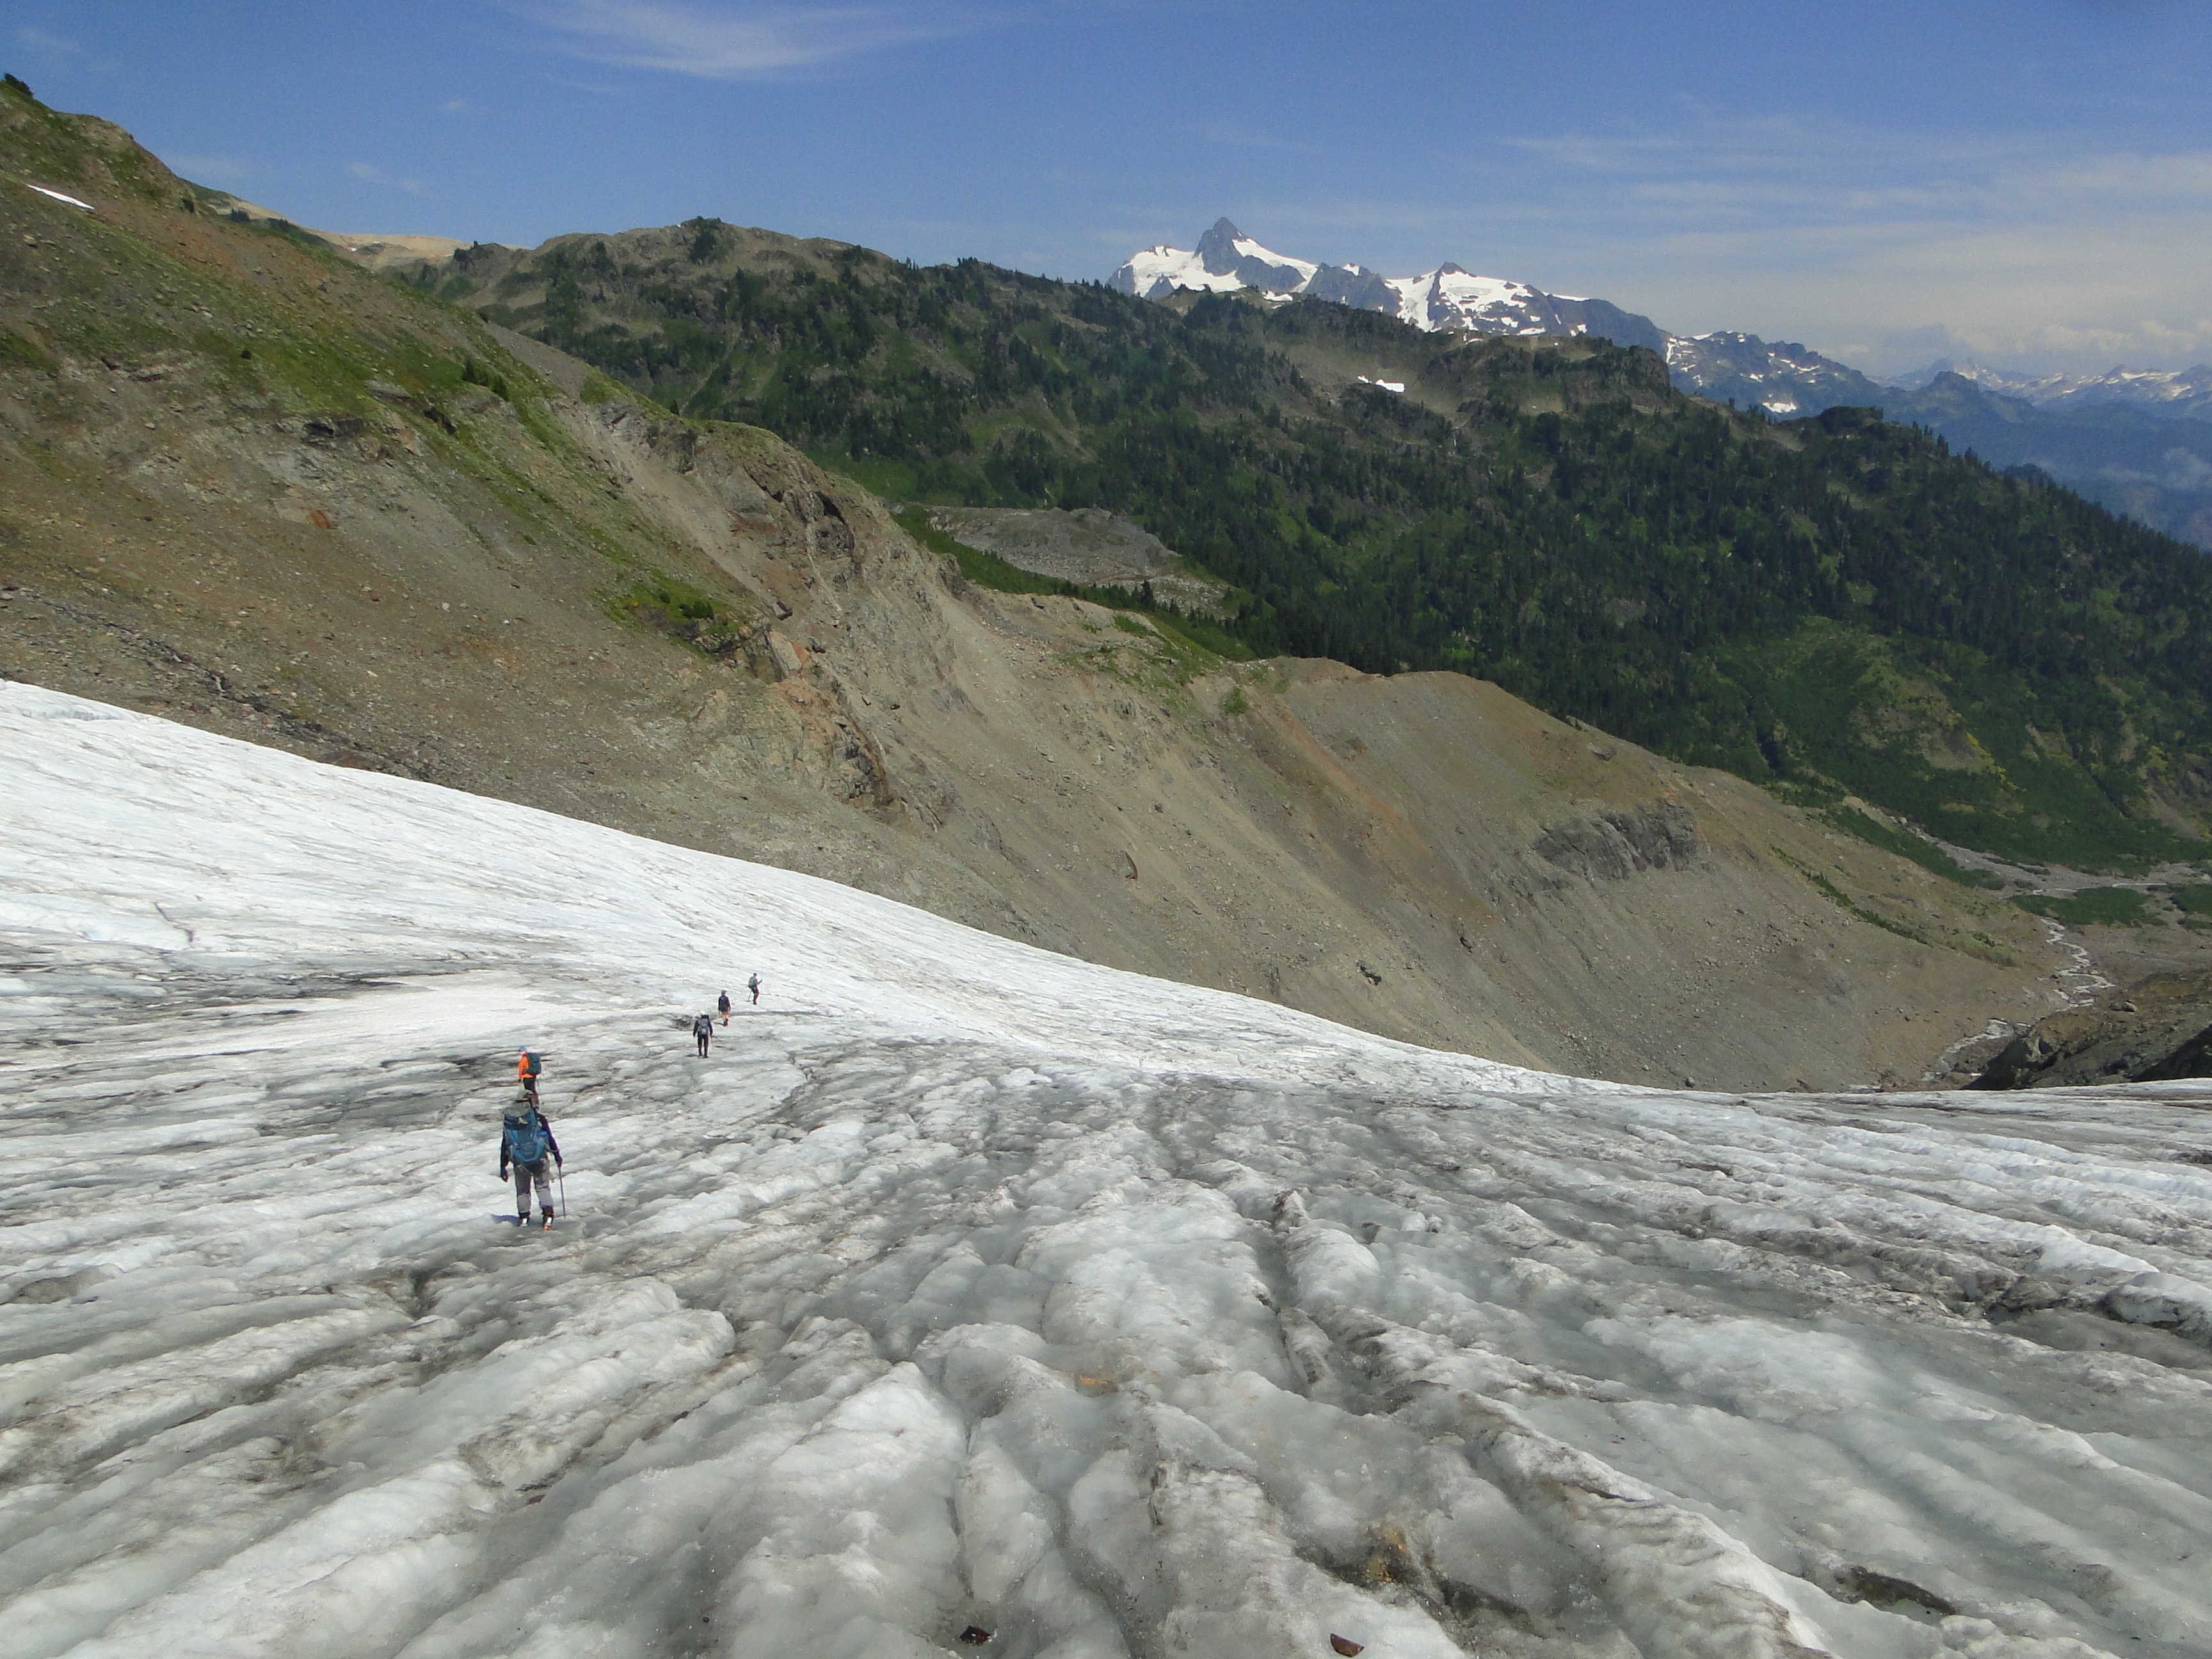
Looking up Mazama Glacier from near the saddle with Rainbow Glacier at 2000 m.

Mazama Glacier  flows from the summit down the north side of Mount Baker. The glacier terminates at the head of Wells Creek at 1470 meters. This is a glacier we visit briefly each summer since 1984, but is not a focus of detailed observations. The glacier had a low slope relatively stagnant tongue in 1988 that has led to a rapid retreat of 825 m by 2022. The glacier has a high snow algae region near the Dorr Steamfield.

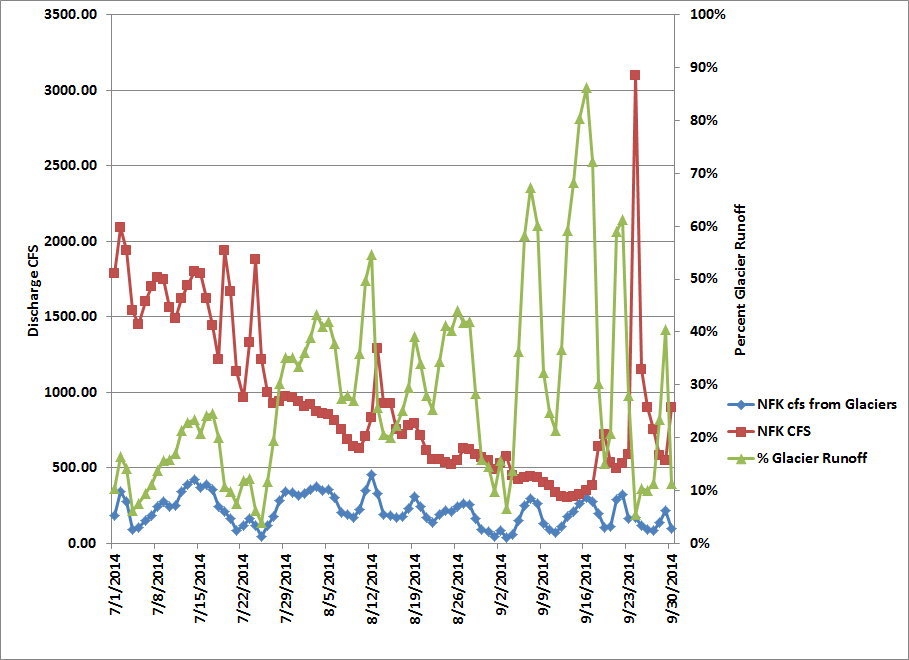
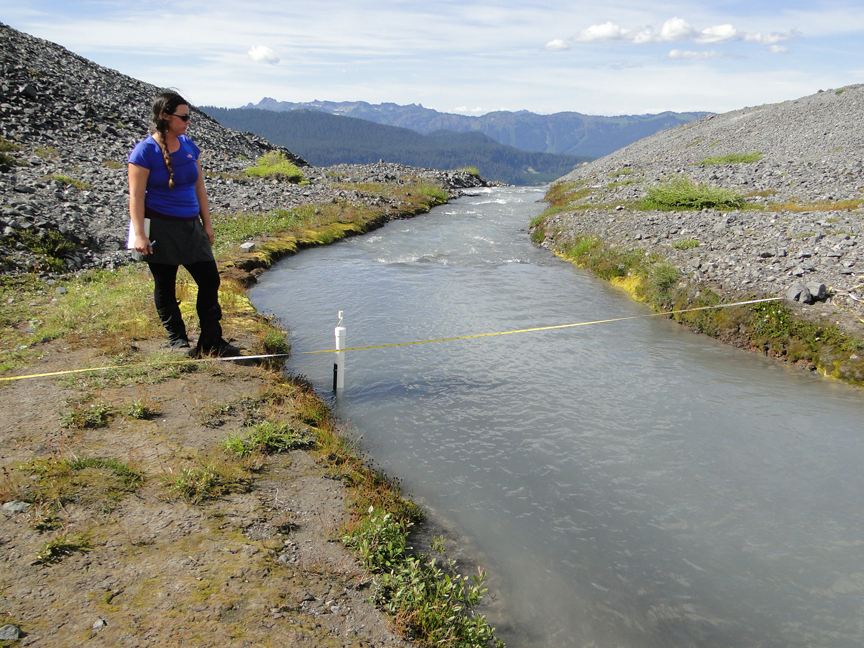
Sholes Glacier terminus in 2015 with stream gaging location, we calibrated this stream discharge station for the Nooksack Indian Tribe.

Sholes Glacier terminus in 2022 with 1984 terminus location indicated.

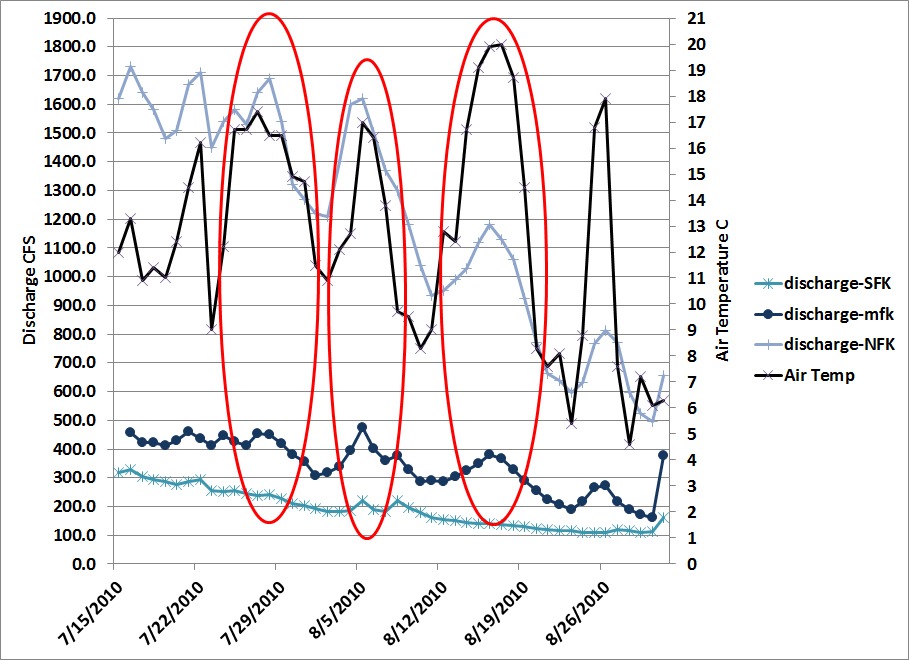
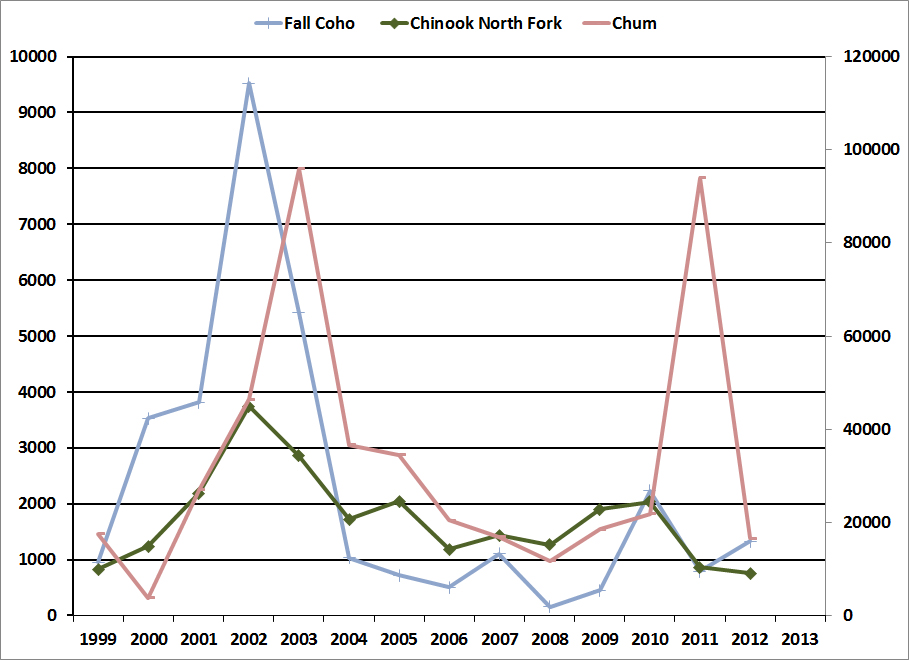
Sholes Glacier is on a ridge extending northeast from Mount Baker. We have surveyed mass balance on this glacier each year since 1990. In 2012 in a joint project with the Nooksack Indian Tribe we began summer long monitoring of streamflow below this glacier that has identified the response of glacier melt to heat waves (Pelto et al 2022). The glacier has lost 24.6 m w.e. thickness since 1990 and retreated 170 m, most of that retreat since 2010. Our studies of streamflow indicate how during heat waves glaciers in this basin increase discharge by ~20% and limit water temperature increases (Pelto et al 2022).

Rainbow Glacier terminus in 2014 indicating the 2o14 and 1984 position. Taken by Tom Hammond from Rainbow Ridge.
Rainbow Glacier annual accumulaiton layer thickness in 2013.

Rainbow Glacier is a World Glacier Monitoring Service reference glacier that we have measured the mass balance of each year since 1984.The glacier begins at 2200 m at a saddle with Mazama and Park Glacier and drains the northeast flank of Mount Baker into the headwaters of Rainbow Ceeek and then Baker Lake. The glacier has lost 17.7 m w.e thickness which has driven a retreat of 700 m. The glacier was advancing during our first two years of observations. At the 2000 m saddle with Mazama Glacier the accumulation zone has persisted. The average retained snowpack has declined from 2.7 m to 1.5 m.

Park Glacier Cliffs in 2003

Park Glacier drains the northeast side of Mount Baker’s summit area, meltwater flowing into Baker Lake. Each year we work on the adjacent Rainbow Glacier and during the 1980’s and 1990’s the Park Glacier Cliffs provided a daily sequence of avalanches, the noise echoing across the valleys. By 2010 this occurrence was rare, as the cliffs receded and diminished in height. This accompanied the retreat of the main valley tongue that most of these avalanches had fallen onto.  By 2022 the glacier has receded 690 m from the advance moraine of the 1970’s

Boulder Glacier in 1993 from just below its 1970s advance moraine.

Boulder Glacier from our camp in 2003 illustrating retreat

Debris covered terminus of Boulder Glacier, due to subglacial debris exiting onto glacier surface

Boulder Glacier drains the east side of Mount Baker into Boulder Creek and then Baker Lake. The glacier was advancing rapidly in the 1950s. Our second visit in 1988 revealed a significant retreat underway.  The terminus area of the glacier is debris covered due to subglacial debris flows from the crater exiting onto the glacier surface. This glacier has retreated 850 m retreat from its advance moraine of the 1970’s.

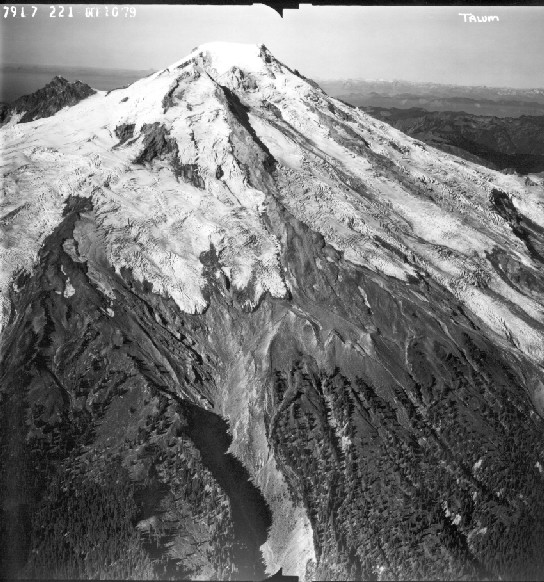
Talum Glacier in 1979 image from Austin Post

Talum Glacier has a wider bottom then top, as it is pinched between the Boulder and Squak Glacier on the east flank of Mount Baker. There are several terminus tongues, which tends to reduce the rate of retreat. Retreat from the advance moraines to 2022 has been 380 m.

Squak Glacier from survey camp in 1990

Squak Glacier from survey camp in 2009

Squak Glacier is adjacent to Easton Glacier on the southeast slope of Mount Baker. This glaciers retreat has been 420 m since 1984 when it was still in contact with its advance moraine. There are several bedrock areas emerging in what was the accumulation zone of the glacier, indicating a substantial expansion of the ablation zone. Thinning of the glacier from 1990-2009 is evident with expansion of ridge between Squak and Talum.

In 2023 we will again be on Mount Baker assessing the ongoing rapid response to climate warming generating glacier thinning and retreat.


Deming Glacier Icefall Deceleration 2017-2022 Driven by Mass Balance Loss

Deming Glacier velocity from NASA MEaSUREs ITS_Live at four locations from below icefall at blue X to above icefall at red X. There is not a significant change in velocity above the icefall (red X), but significant deceleration in the icefall and below the icefall. 

The Deming Glacier drains the southwest side of the summit of Mount Baker a stratovolcano in the North Cascades of Washington, with a massive icefall feeding the lower valley terminus reach of the glacier. The icefall begins at 2200 meters and descends to 1600 meters. The glacier feeds the Middle Fork Nooksack River which provides water supply to Bellingham, WA. I first observed the Deming Icefall from the terminus area of the glacier in 1987. This visit demonstrated that it is not safe to hike to the terminus of this glacier. In 1990 we began annual observation of Deming Glacier. Each summer we monitor the adjacent Easton Glacier in detail including mass balance, while also taking several specific observations of Deming Glacier including terminus position, and accumulation between 2400-2700 m. This combined with mass balance assessment on Easton Glacier provides an annual assessment of the meltwater provided by the glacier to the Nooksack River system. During heatwaves the tributaries of the Nooksack fed by glaciers have had the impacts mitigated, while those without glaciers have seen significant temperature increase and discharge decrease (Pelto et al 2022).

Pelto and Brown (2012)  identified a mean annual mass balance loss of -0.52 m/year from 1990-2010 on Mount Baker glaciers. From 2013-2021 the mass loss had more than doubled to -1.30 m/year. The declining mass balance is less pronounced above the icefall. The icefall transitions the glacier from the accumulation zone to the ablation (melt) zone at the bottom of the icefall. Above the icefall at 2400-2700 meters the average snow depth left at the end of the summer based on several thousand crevasse stratigraphy measurements from 1990-2013 had been 2.75 meters, from 2014-2021 the average depth has been 2.4 m.

The result of the declining mass balance of the entire glacier and the upper glacier will be glacier deceleration. The NASA Measures ITS_LIVE application uses feature tracking to determine glacier velocity. An examination of velocity change from the top of the icefall to the bottom on Deming Glacier from 2015-2022 indicates deceleration at the three points within or below the icefall, but no change at the top of the icefall.  At the top of the icefall red X velocity has declined ~20%. In the middle of the icefall, green X, velocity has also declined ~20% since 2017. Near the base of the icefall, orange X, velocity has a chaotic signal lacking a clear trend.  Below the icefall at the blue X, velocity has declined by ~20-30%.  The resulting reduction in flux to the terminus will continue the rapid retreat.  Pelto and Brown (2012) measured a 360 m retreat of Deming Glacier from 1979-2009, ~20 m/year. From 1979-2021 the glacier has retreated 725 m, with the rate of retreat from 2009-2021 of ~30 m/year.

View of the Deming Glacier from terminus to top of icefall in 2019. Jill Pelto at left, Abby Hudak and Mauri Pelto at right. X’s mark the velocity locations, Point A ties this to the upper glacier view, red arrow is the 1987 terminus location.

The icefall sweeps around a bedrock with an east and a west arm splitting above and rejoining below the knob.

The Deming Glacier from the top of the icefall to the summit of Mount Baker in 2020.

In mid-August 2022 snowpack was particularly low right to the top of Deming Glacier. Comparison with 2020 which was an average year for the last decade, but still a significant mass balance loss.

Deming Glacier terminus annotated to show retreat from 2004 to 2019 in photographs from Mauri Pelto

Terminus of Deming Glacier in 2004 and 2019 illustrating the ongoing retreat of the terminus, 725 m from 1979-2021.

Jill Pelto measuring Crevasse depth and snowpack thickness in Crevasse at 2500 m on Deming Glacier.

North Cascade Glacier Climate Project 2019, 36th Annual Assessment


The summer of 2019 found the North Cascade Glacier Climate Project in the field for the 36th consecutive summer monitoring the response of North Cascade glaciers to climate change.  This long term monitoring program was initiated partly in response to a challenge in 1983 from Stephen Schneider to begin monitoring glacier systems before and as climate change became a dominant variable in their behavior.

The field team was comprised of Clara Deck, Ann Hill, Abby Hudak, Jill Pelto and myself.  All of us have worked on other glaciers. The bottom line for 2019 is the shocking loss of glacier volume. Ann Hill, UMaine grad student observed, that “Despite having experience studying glaciers in southeast Alaska and in Svalbard, I was shocked by the amount of thinning each glacier has endured through the last two and a half decades.”  Glaciers are typically noted as powerful moving inexorably.  Clara Deck, UMaine MS graduate, was struck by “the beauty and fragility of the alpine environment and glaciers.”  Fragile indeed in the face of climate change. Abby Hudak, Washington State grad student, looked at both the glacier and biologic communities as under stress, but glaciers cannot migrate, adapt or alter there DNA.

Over the span of 16 days in the field, every night spent in the backcountry adjacent to a glacier, we examined 10 glaciers in detail. All glaciers are accessed by backpacking.  The measurements completed add to the now 36 year long data base, that indicate a ~30% volume loss of these glaciers during that period (Pelto, 2018). Here we review preliminary results from each glacier. Each glacier will have a mass balance loss of  1.5 -2.25 m, which drives continued retreat.  Columbia and Rainbow Glacier are reference glaciers for the World Glacier Monitoring Service, with Easton Glacier joining the ranks later this year. Below and above is the visual summary. Specific mass balance and retreat data will be published here and with WGMS after October 1.

Easton Glacier, Mount Baker.  Terminus has become thin and uncrevassed as a rapid retreat of 15 m per year continued, 405 m retreat since 1990.

Easton Glacier icefall at 2200 m typically has 1.8 m w.e. at the end of the summer, this year it will be 0 m. The overall mass balance will be ~2 m of loss.

Deming Glacier, Mount Baker has now receded over 700 m since our first visit 35 years ago.

On Lower Curtis Glacier a key accumulation source the NE couloir now shows bedrock. Overall by summers end ~25% of the glacier will retain snowcover, far short of what is needed to maintain its volume.

The Lower Curtis Glacier terminus continues to retreat at 8 m/year, but thinning and slope reduction has been more notable.  

In early August the majority of Sholes Glacier has lost its snowpack.  The thin nature of the terminus indicates the glacier is poised for continued rapid retreat that has exceeded 15 m per year during the last 7 years.

Runoff assessment confirmed ablation stake measurement of 11 cm of ablation/day from 8/6-8/8 on Sholes Glacier.

High on Rainbow Glacier there are still plenty of regions lacking snowcover, instead of a thick mantle of snowpack.

Rainbow Glacier was awash in meltwater streams, see video.  This area should have 1 m of snowpack left. Rainbow Glacier has retreated 650 m since 1984.

Just getting to each glacier does involve overcoming various miseries.

A transect across lower Coleman Glacier, Mount Baker indicates 38 m of thinning since 1988.

Limited snowpack remaining on Columbia Glacier, with six weeks of melt left. Lake in foreground expanded dramatically in last two years.  Retreat ~45 m from 2017-2019 and 210 m from 1984-2019, more than 10% of its length.

Upper basin of Columbia Glacier mainly bare of retained snowpack.

Ice Worm Glacier terminates in expanding lake.

Ice Worm Glacier continues to retreat at the top and bottom of the glacier.  Mass loss is leading to a more concave shape each year.

Daniels Glacier had a maximum snowpack of 1.75 m, instead of 4 m.

Foss Glacier measurements discontinued as it disintegrates, only 20% snowcover in mid-August.

Lynch Glacier less than 50% snowcovered with six weeks of melt left.


The team which completed over 1200 mass balance measurements, 40,000 vertical feet and 110 miles of travel across glacier clad mountains.


35th Annual Field Observations of North Cascade Glaciers

The 2018 field season observations, conditions and summary. Field team Mariama Dryak, Erin McConnell, Jill Pelto and Mauri Pelto.

For the 35th consecutive year I headed to the North Cascade Range, Washington to monitor the response of glaciers to climate change.  Two of the glaciers the North Cascade Glacier Climate Project (NCGCP) monitors are now part of the 42 glaciers comprising the World Glacier Monitoring Service  (WGMS) reference glacier network, where annual mass balance has been assessed for more than 30 years consecutively.

The 2018 winter season featured relatively normal snowpack despite a winter of wide temperature fluctuations, February freezing levels 400 m below the mean and December 500 m above the mean. Summer melt conditions featured temperatures 1.1 C above the 1984-2017 mean. The summer melt season through August was warm and exceptionally dry, which has also helped foster forest fires. The melt rate during the August field season was 35% above normal.

Washington Climate Division Five, western North Cascades

We assessed the mass balance of eight glaciers.  All eight will have significant negative mass balances in 2018, between -0.5 m and -1.0 m.  Retreat was measured on seven of the glaciers where the terminus was exposed, all had retreated since 2017 with the retreat ranging from 7-21 m. This continues the pattern of significant retreat each year that began in 2014. The overall length loss as a percentage of total length falls into a relatively narrow range of 10-22%.  The mass balance losses has also led to additional rock outcrops emerging in what had been the elevation of the accumulation zone.  We continued to measure runoff below Sholes Glacier and to assess crevasse depth.  The average crevasse depth in 2018 was 10 m, with the deepest at 16 m on Lower Curtis Glacier.

Annual  mass balance of North Cascade glaciers 1984-2018 (right).  Cumulative glacier mass balance from NCGCP compared to WGMS global cumulative mass balance.  Below is the retreat of selected North Cascade glaciers during the last 35 years, in meters and as a percentage of the total length.  Locations for all but Columbia Glacier are in image below. 

Mount Baker and Mount Shuskan glaciers identified in a Landsat image from 8-9-2018. Blue indicates mass balance and terminus change are observed.  Orange indicates only terminus change is observed. C=Coleman, D=Deming, E=Easton, LC=Lower Curtis, M=Mazama, N=Nooksack, P=Price, R=Rainbow, Rv=Roosevelt, SH=Sholes. 

Easton Glacier, Mount Baker, WA Annual Retreat & Mass Loss 1990-2017

Mass balance, terminus and supra glacial stream assessment are illustrated in the video, Filmed by Mauri Pelto, Jill Pelto, Melanie Gajewski, with music from Scott Powers.

This is the story of  the annual monitoring of Easton Glacier, Washington.  We have been monitoring Easton Glacier on Mount Baker, a stratovolcano in the North Cascade Range, Washington since 1990.  Each year we survey the terminus position, measure its mass balance, assess crevasse depths and map surface elevation on a transect across the glacier.  In 1990 Easton Glacier was in contact with an advance moraine built from the late 1950’s- 1980’s.  The advance moraine is noted in the 2015  Washington DNR Lidar  image of the terminus area by black arrows. The green arrows indicate the recessional moraine from the winter of 2015. Red arrows indicate the Little Ice Age lateral moraines Railroad Grade (RG) to the west and Metcalfe Moraine (MM) to the east. From 1990-2017 the glacier has retreated 370 m, including 65 m in the last three years. The second Lidar image indicates the transect where the surface elevation is mapped, red line.  This is close to 2000 m in elevation, and in a good snow year retains snowpack and in most recent years has lost its snowpack (note paired image below). In 2015 the worst year, the snowpack had been lost by the end of July. Note the comparison of the 2017 transect snowpack and 2015 lack of snowpack.

Washington DNR Lidar image of Easton Glacier , black arrows indicate 1980’s advance moraine, green arrows 2015 winter moraine and red arrows the Little Ice Age lateral moraines. Blue dots indicate the glacier margin.


Washington DNR Lidar image of Easton Glacier. Blue dots indicate the glacier margin.  Red line the cross glacier profile.

A view along the cross glacier profile at 2000 m in early August of 2015, snowpack gone already and in 2017 with 2 m of snowpack remaining. 

More than 5000 measurements of snow depth and melt have been completed illustrating the glacier has lost 16.6 m of water equivalent thickness, over 18 m of thickness from 1990-2016.  For a glacier that averaged 70 m in thickness in 1990 this is ~25% of the volume of the glacier gone.  The glacier has not maintained sufficient snow cover at the end of the summer to have a positive mass balance, this is the accumulation area ratio.  The mass balance and terminus data is reported annually to the World Glacier Monitoring Service.  The area lost in the terminus region due to the retreat has been 0.22 km2.

The glacier has also slowed its movement as it has thinned, evidenced by a reduction in number of crevasses. In the lowest icefall Jill Pelto has surveyed the crevasse depths finding a mean depth 20 m and a maximum depth of 32 m. This glacier supplies runoff to Baker Lake and its associated hydropower projects.  Our annual measurements here and on Rainbow Glacier and Lower Curtis Glacier in the same watershed provide a direct assessment of the contribution of glaciers to Baker Lake.  The glacier is also adjacent to Deming Glacier, which supplies water to Bellingham, WA. The Deming is too difficult to access, and we use the Easton Glacier to understand timing and magnitude of glacier runoff from Deming Glacier.  Deming Glacier has retreated a greater distance during this period, 705 m, but has lost a similar area.

Annual terminus survey in 2015 terminus exposed to melting by early July.  In 2017 terminus being exposed first week in August. Taken from same location.

Crevasses measurement in lower icefall and on the cross profile.  In both cases crevasse depth is measured, on the profile 2017 winter snow depth remaining measured. 

Easton Terminus viewed from our benchmark location just beyond 1980’s margin. Tree in foreground is over 50 years old.


34th Annual Field Program NORTH CASCADE GLACIER CLIMATE PROJECT 2017


2016 Field Season Video

NORTH CASCADE GLACIER CLIMATE PROJECT 2017

For the thirty fourth consecutive summer it is time to head into the field to monitor the continued response of North Cascade glaciers to climate change.  In 1984 when I began this program we selected 10 key glaciers to monitor.  Two of these have now disappeared.  All the glaciers have retreated extensively and lost considerable volume.  The mass balance loss is 19 m of water equivalent thickness, which is over 20 m of ice thickness loss on glaciers that averaged less than 75 m thick. This is significant with 25-30% of their entire volume lost. This project looks at the implications of the glacier loss as we complete an annual inventory of ice worms on Sholes Glacier, mountain goats on Ptarmigan Ridge region and monitor runoff all summer below Sholes Glacier with the Nooksack Indian tribe. 

Illustration of research (Megan Pelto and Jill Pelto)

The result of volume loss and area loss is that despite higher melt rates, the reduction in area of melting glaciers has led to a decline in glacier runoff in the region. The reduced runoff effects salmon, hydropower and irrigation. Details of the runoff impacts are detailed in a Book “Climate Driven Retreat of Mount Baker Glaciers and Glacier Runoff and summarized in Salmon Challenges from the Glaciers to the Salish Sea.

The focus will be on mass balance observations, longitudinal profiles and terminus observations. For Mount Baker, Washington the winter freezing level was much lower than the previous two winters, and was 100 m below the long term mean. The snowpack on April 1st snowpack was 110% of normal, by June 10th, the snowpack is trending down steeply, but remained just above average.  Since then a persistent dry period and the impending heat wave that begins today, Aug. 1 has led to rapid snow loss.  The most recent  comparable year is 2009, which featured a good winter snowpack and very warm mid to late summer conditions. We will first travel north to Mount Baker and the Easton Glacier.    Of the 40 glacier in the World Glacier Monitoring Service Reference glacier list we have two Columbia and Rainbow, as soon as Easton Glacier has 30 years, the minimum requirement it will be added, that is in 2019. The field team consists of Mauri Pelto, 34th year, Jill Pelto, UMaine for the 9th year, Anthony Himmelberger, Clark University 1st year.  Tom Hammond, 14th year will join us for a selected period as will Pete Durr, Mt. Baker Ski Area, 2nd year.   We will report on our findings in a month. Field photos will be posted periodically on Twitter.

Measuring terminus change and snowpack thickness in 2016

Aug.   2:  Hike into Easton Glacier
Aug.   3:  Easton Glacier
Aug.   4:  Easton Glacier
Aug.   5:  Hike Out Easton Glacier, Hike in Ptarmigan Ridge
Aug.   6:  Sholes Glacier
Aug.   7:  Rainbow Glacier
Aug.   8:  Sholes Glacier
Aug.   9:  Hike out and into Lower Curtis Glacier
Aug. 10:  Lower Curtis Glacier
Aug. 11: Hike out Lower Curtis Glacier- Hike in Blanca Lake
Aug. 12:  Columbia Glacier
Aug. 13:  Columbia Glacier
Aug. 14:  Hike out Columbia Glacier; Hike in Mount Daniels
Aug. 15:  Ice Worm Glacier
Aug. 16:  Daniels and Lynch Glacier
Aug. 17:  Ice Worm Glacier, Hike out Mount Daniels-Hike out-

2016 Field Season Results-North Cascade Glacier Climate Project

For Mount Baker, Washington the freezing level from January-April 20 was not as high as the record from 2015, but still was 400 m above the long term mean. April 1 snowpack at the key long term sites in the North Cascades was 8% above average. A warm spring altered this, with April being the warmest on record. The three-four weeks ahead of normal on June 10th, but three weeks behind 2015 record melt.  The year was poised to be better than last year, but still bad for the glaciers.  Fortunately summer turned out to be cooler, and ablation lagged.  Average June-August temperatures were 0.5 F above the 1984-2016 mean and 3 F below the 2015 mean. The end result of our 33rd annual field season assessing glacier mass balance in the North Cascades quantifies this. Our Nooksack Indian Tribe partners again installed a weather and stream discharge station below Sholes Glacier.

The primary field team consisted of myself, 33rd year, Jill Pelto, grad student UMaine for the 8th year, Megan Pelto, Chicago based illustrator 2nd year, and Andrew Hollyday, Middlebury College.  We were joined by Tom Hammond, NCCC President 13th year, Pete Durr, Mount Baker Ski Patrol, Taryn Black, UW grad student and Oliver Grah Nooksack Indian Tribe.  The weather during the field season Aug. 1-17th was comparatively cool.

Mass Balance: Easton Glacier provides the greatest elevation range of observations.  On Aug 2, 2016 the mean snow depth ranged from 0.75 m w.e. at 1800 m to 1.5 m w.e. at 2200 m and 3.0 m w.e. at 2500 m. Typically the gradient of snowpack increase is less than this.  There was a sharp rise in accumulation above 2300 m.  This is the result of the high freezing levels.  The mass balances observed fit the pattern of a warm but wet winter.  The high freezing levels left the lowest elevation glaciers Lower Curtis and Columbia Glacier with the most negative mass balance of approximately 1.5 m. The other six glaciers had negative balances of -0.6 to -1.2 m. This following on the losses of the last three years has left the glaciers with a net thinning of 6 m, which on glaciers averaging close to 50 m is a 12% volume loss in four years.  We anticipate with that this winter will be cooler and next summer the glaciers happier.  We will back to determine this.

Snowpack loss from Aug. 5-Sept. 22 is evident in the pictures below on Sholes Glacier.  Detailed snow depth probing, 112 measurements, of the glacier on August 5th allows determination of ablation as the transient snow line traverses probing locations from Aug. 5. GPS locations were recorded along the edge of blue ice on each of the dates. Ablation during this period was 2.15 m.


Terminus Change: We measured terminus change at several glaciers and found that a combination of the 2015 record mass balance loss and early loss of snowcover from glacier snouts in 2016 led to considerable retreat since August 2015.  The retreat was 25 m on Easton Glacier, 20 m on Columbia Glacier, 20 m on Daniels Glacier, Sholes Glacier 28 m, Rainbow Glacier 15 m, Lower Curtis Glacier 15 m.  The main change at Lower Curtis Glacier was the vertical thinning, in 2014 the terminus was 41 m high, in 2016 the terminus seracs were 27 m high.  The area loss of the glaciers will continue to lead to reduced glacier runoff. We continued to monitor daily flow below Sholes Glacier which allowed us to determine that in August 2016 45% of the flow of North Fork Nooksack River came from glacier runoff.  This is turns has impacts for the late summer and fall salmon runs.


Thirty-third Annual North Cascade Glacier Climate Project Field Season Underway

fig8-1
Base Map of the region showing main study glaciers, produced by Ben Pelto.

From President Reagan to President Obama each August since 1984 I have headed to the North Cascade Range of Washington to measure the response of glaciers to climate change.  Specifically we will measure the mass balance of nine glaciers, runoff from three glaciers and map the terminus change on 12 glaciers. The data is reported to the World Glacier Monitoring Service.  Three glaciers that we have monitored annually have disappeared since 1984.

In 2016 for Mount Baker, Washington the freezing level from January-April was not as high as the record from 2015, but still was 400 m above the long term mean. The snowpack on June 1st was three weeks behind last year’s record melt, but still three to four weeks of head of normal. July has been exceptionally cool reducing this gap. With all the snow measurement stations losing snowcover by July 1, the gap is uncertain until we arrive on the glaciers. This will not be a good year, but will be a significant improvement over last year, likely more in the 2012 or 2013 category.  Each location is accessed by backpacking in and camping in tents.

We will first travel north to Mount Baker and the Easton Glacier, we will be joined by Oliver Lazenby, Point Roberts Press.  We will then circle to the north side where I expect we will be joined by Jezra Beaulieu and Oliver Grah, Nooksack Indian Tribe.  Jen Lennon from the Sauk-Suiattle Tribe and Pete Durr, Mount Baker Ski Patrol are also planning to join us here.   When we head into Columbia Glacier Taryn Black from U of Washington will join us. The field team consists of Mauri Pelto, 33rd year, Jill Pelto, UMaine for the 8th year, Megan Pelto, 2nd year, and Andrew Hollyday, Middlebury College.  Tom Hammond, 13th year will join us for a selected period.

[ngg_images source=”galleries” container_ids=”38″ display_type=”photocrati-nextgen_basic_imagebrowser” ajax_pagination=”1″ template=”/nas/wp/www/sites/blogsorg/wp-content/plugins/nextgen-gallery/products/photocrati_nextgen/modules/ngglegacy/view/imagebrowser-caption.php” order_by=”sortorder” order_direction=”ASC” returns=”included” maximum_entity_count=”500″]

Aug.   1:  Hike into Easton Glacier.
Aug.   2:  Easton Glacier
Aug.   3:  Easton Glacier
Aug.   4:  Hike Out Easton Glacier, Hike in Ptarmigan Ridge
Aug.   5:  Sholes Glacier
Aug.   6:  Rainbow Glacier
Aug.   7:  Sholes Glacier and/or Rainbow Glacier
Aug.   8:  Hike out and into Lower Curtis Glacier
Aug.   9:  Lower Curtis Glacier
Aug. 10: Hike out Lower Curtis Glacier- Hike in Blanca Lake Mail Pickup Maple Falls, WA 98266
Aug. 11:  Hike in Columbia Glacier
Aug. 12:  Columbia Glacier
Aug. 13:  Hike out Columbia Glacier; Hike in Mount Daniels
Aug. 14:  Daniels and Lynch Glacier
Aug. 15:  Ice Worm Glacier
Aug. 16:  Ice Worm Glacier, Hike out Mount Daniels-Hike out

Conducting Long Term Annual Glacier Monitoring

2015 time lapse easton

Easton Glacier in 1990, 2003 and 2015 from same location. Below Painting by Jill Pelto of crevasse assessment using a camline.

camline

This is the story of how you develop and conduct a long term glacier monitoring program.  We have been monitoring the annual mass balance of Easton Glacier on Mount Baker, a stratovolcano in the North Cascade Range, Washington since 1990.  This is one of nine glaciers we are continuing to monitor, seven of which have a 32 year long record. The initial exploration done in the pre-internet days required visiting libraries to look at topographic maps and buying a guide book to trails for the area.  This was followed by actual letters, not much email then, to climbers who had explored the glacier in the past, for old photographs.  Armed with photographs and maps we then determined where to locate base camp and how to access the glacier.  The first year is always a test to make sure logistically you can reach enough of the glacier to actually complete the mass balance work with a sufficiently representative network of measurement sites.  The second test is if you can stand the access hike, campsite, and glacier navigation, to do this every year for decades; if the answer is no, move on.  That was the case on Boulder Glacier, also on Mount Baker:  poor trail conditions and savage bugs, were the primary issue. Next we return to the glacier at the same time each year, completing the same measurements each year averaging 210 measurements of snow depth or snow melt annually.  This occurs whether it is gorgeous and sunny, hot, cold, snowy, rainy, or recently on this glacier dealing with thunderstorms.  You wake up, have your oatmeal and coffee/cider/tea, and get to work.  Lunch on the snow features bagels, dried fruit, and trail mix. Happy hour features tang or hot chocolate depending on the weather.  It is then couscous, rice, pasta or quinoa for dinner, with some added dried vegetable or avocado.  The sun goes behind a mountain ridge and temperatures fall, and the tent is the haven until the sun returns.  Repeat this 130 times on this glacier and you have a 25 year record. During this period the glacier has lost 16.1 m of water equivalent thickness, almost 18 m of thickness.  For a glacier that averaged 70 m in thickness this is nearly 25% of the volume of the glacier gone.  The glacier has not maintained sufficient snow cover at the end of the summer to have a positive balance, this is the accumulation area ratio, note below.  The glacier has retreated 315 m from 1990-2015.  This data is reported annually to the World Glacier Monitoring Service.  The glacier has also slowed its movement as it has thinned, evidenced by a reduction in number of crevasses. During this time we have collaborated with researchers examining the ice worms, soil microbes/chemistry, and weather conditions on the ice. This glacier supplies runoff to Baker Lake and its associated hydropower projects.  Our annual measurements here and on Rainbow Glacier and Lower Curtis Glacier in the same watershed provide a direct assessment of the contribution of glaciers to Baker Lake.  The glacier is adjacent to Deming Glacier, which supplies water to Bellingham, WA. The Deming is too difficult to access, and we use the Easton Glacier to understand timing and magnitude of glacier runoff from Deming Glacier.

The glacier terminates at an elevation of 1650 m, but thinning and marginal retreat extends much higher.  A few areas of bedrock have begun to emerge from beneath the ice as high as 2200 m. The changes in ice thickness are minor above 2500 m, indicating this glacier can retreat to a new equilibrium point with current climate.

Mass balance, terminus and supra glacial stream assessment are illustrated in the video, Filmed by Mauri Pelto, Jill Pelto, Melanie Gajewski, with music from Scott Powers.

easton 2010
Mass balance Map in 2010 of Easton Glacier used in the field for reference in following years. 

easton aar

Accumulation Area Ratio/Mass balance relationship for Easton Glacier

Climate Driven Retreat of Mount Baker Glaciers and Changing Water Resources

breakfast2

We have spent 300 nights in a tent just on this mountain collecting data from 1984-2015 in this study that the book documents.

This post has the same title as a book released last month as part of the Springer Briefs in Climate Studies series.  The nice thing about publishing research emerging from 30 years of field research in a book  is that I had a chance to include 104 figures in 107 pages.   Here I give a brief synopsis of the book and a key figure from each of the six chapters.This book presents the impact of climate change on Mount Baker glaciers, USA, and the rivers surrounding them. Glaciers are natural reservoirs that yield their resource primarily on warm dry summer days when other sources are at their lowest yield. This natural tempering of drought conditions will be reduced as they retreat. Mount Baker, a volcano in the Cascades of Washington, is currently host to 12 principal glaciers with an area of 36.8 km2. The glaciers yield 125 million cubic meters of water each summer that is a resource for salmon, irrigation and hydropower to the Nooksack River and Baker River watersheds. Recent rapid retreat of all 22 glaciers is altering the runoff from the glaciers, impacting both the discharge and temperature of the Nooksack and Baker River. Over the last 30 years we have spent 270 nights camped on the mountain conducting 10,500 observations of snow depth and melt rate on Mount Baker. This data combined with observations of terminus change, area change and glacier runoff over the same 30 years allow an unusually comprehensive story to be told of the effects of climate change to Mount Baker Glaciers and the rivers that drain them.

Red Channel|Green Channel|Blue Channel

Chapter 1: Panchromatic sharpened Landsat image of the glacier of Mount Baker in Aug. 2014, rendered by Ben Pelto (UNBC).  

We have worked on each of these glaciers except Thunder Glacier.  After advancing from 1950-1979, the glaciers have all been in retreat, in 2015 the average retreat was 390 m since 1985. 

easston compare

Chapter 2 Comparison of Easton Glacier from our base camp in 2003 and 2015, where we have spent over 90 nights.  We measure the retreat of each glacier in the field as they respond to climate change.

fig 3-23

Chapter 3 looks at mass balance of glaciers in the area including the Sholes Glacier Daily ablation measurements over the last 30 years allow determination of a relationship between daily melt and air temperature. Other factors matter, but  air temperature does yield a good relationship.

nfk glacier contributiion


Chapter 4 Glacier runoff provides a critical water resource to the Nooksack River.  We measure meltwater runoff from Sholes Glacier and observe glacier melt on several glaciers in the basin.  This allows determination of the contribution of glaciers to the watershed.  In 2014 contributions from glaciers exceeded 40% of total North Fork Nooksack River streamflow on 21 days after Aug. 1.   This is a critical period for salmon migration in the watershed.

fig 5-6

Chapter 5 Glacier runoff is measured below the Sholes Glacier in conjunction with Oliver Grah and Jezra Beaulieu, Nooksack Tribe.  This is the record for part of the 2014 field season at the gage site.

fig 6-22

Chapter 6  Deming Glacier in 2011 Google earth image illustrating retreat. The glacier has retreated 420 m from 1979 to 2015. 


Nooksack River: Glacier Runoff Maintains Suitable Aquatic Conditions for Salmon

salmon glacier
Illustration from Megan Pelto above left

Sholes Glacier from our runoff measurement station above right.

Glaciers are a critical water resource in the North Cascades of Washington for hydropower, irrigation , municipal supply and aquatic life. In dry summers glaciers play an even larger role in the overall water budget and maintaining suitable aquatic conditions.  The summer of 2015 will pose particular challenges due to the drought emergency that is likely to persist and we will be investigating the role glaciers play. During the last three years in an ongoing study with the Nooksack Indian Tribe we have been working on quantifying the role glaciers play in that watershed. Glaciers comprise the headwaters of the Nooksack River and are a critical source of summer discharge and greatly influence summer stream temperatures. There are nine species of salmon in the watershed that the Nooksack Indian Tribe depends on for cultural, subsistence, and economic uses. Climate change is an additional new threat to salmon that has caused and will continue to cause an increase in winter flow, decreased summer baseflow, and increased summer water temperatures as noted by (Isaak et al, 2011). Abatzaglou et al (2014) note a reduction in summer and autumn precipitation coupled with increased potential evapotranspiration causing larger climatic water deficits over the past four decades in the Pacific Northwest.

fig
Nooksack Watershed map with Mount Baker glaciers.

This post will focus on the changing impact of glaciers on streamflow and the evolving water temperature threat. The Nooksack River watershed has three significant watersheds, South Fork, Middle Fork and North Fork. The South Fork has no glaciers.  The Middle Fork has four significant glaciers and 2% of the watershed area above the USGS gage is glaciated.  The North Fork has 12 significant glaciers that cover 6% of the watershed area above the USGS gage. This difference in glacier cover allows identification of the role of glaciers when combined with measurements of melt on and runoff from the glaciers. Here we examine stream discharge and water temperature at USGS gages on each stream to illustrate the different response to 12 warm weather events during the summers of 2009, 2010, 2012 and 2013. During each of these periods we have, along with Oliver Grah and Jezra Beaulieu, working for the Nooksack Tribe, been observing the ablation and runoff directly from the glaciers. The largest area of glaciers are those on Mount Baker, a strato volcano that is the highest mountain in the North Cascades. Pelto and Brown (2012) note that terminus observations on the nine principal Mount Baker glaciers, 1984–2009, indicate retreat ranging from 240 to 520 m, with a mean of 370 m or 14 m/year. Pelto and Brown (2012) observed that this is the result of a sustained mass balance loss averaging -0.5 m/year during the 1990-2010 period. This equates to an 11-m loss in glacier thickness, 12–20% of the entire 1990 volume of glaciers on Mount Baker. This summer we will for the 32nd consecutive year be measuring glacier mass balance on Mount Baker.

Rainbow strat
Measuring snow depth in crevasse on Mount Baker glacier.

sholes gage
Jezra Beaulieu at Runoff measurement Gage

During each of these warm weather events ablation was measured on glaciers in the basin. For stream discharge, a 10% increase is set as the key threshold for significant response to each warm weather event. For the North Fork 10 of 12 warm weather events exceeded the limit, in the Middle Fork 4 of 12 events had a significant response and for the South Fork none of the 12 events led to a 10% flow increase. It is apparent that warm weather events increase glacier melt, thus enhancing flow in the North Fork. In a basin without glacier runoff the hydrologic system consistently experiences reduced discharge.

nooksack 2009t

2009 stream discharge  variation of the three Nooksack forks, warm water events within ellipse.

nooksack 2010t

2010 stream discharge  variation of the three Nooksack forks, warm water events within ellipse.

For water temperature, an increase of 2° C is the threshold of significance used for response to warm weather events. In each the North Fork and Middle Fork, 2 of 12 events exceeded this threshold, and for the South Fork 12 of 12 events exceeded this threshold, each event is a gold ellipse on the charts below. Warm weather events consistently generate a significant increase in stream water temperature only in the non-glaciated South Fork Basin. During 6 of these 12 warm events, runoff measurements below Sholes Glacier and ablation measurements on Sholes and Easton Glacier indicate daily ablation ranging from 0.05-0.06 meters per day, which for the North Fork currently yields 9.5-11 m3/second. This is 40-50% of the August mean discharge of 24 m3/second, despite glaciers only covering 6% of the watershed. Increased glacier discharge largely offset the impact of increased air temperature on stream water temperature during the warm weather events. In the charts below note the red line with diamond markers that is the South Fork stream temperature and the in the graph above the top brightest blue line that is North Fork discharge and what happens during the warm events, gold ellipses. Also note the South Fork discharge bottom blue line in the graph above does not respond nor does the North Fork stream temperature red line with triangles, below.

nooksack response

The frequency of significant response of each watershed to the 12 warm weather events.

NFK glacier runoff Daily and cumulative ablation during the 2014 melt season.

nooksack 2009d
2009 Temperature record for the South Fork, North Fork and Middle Fork, warm water events within ellipse.

Nooksack 2010d
2010 Temperature record for the South Fork, North Fork and Middle Fork, warm water events within ellipse.<

As the glaciers continue to retreat the North Fork will trend first toward the more limited impact of the Middle Fork and then the highly sensitive South Fork where warm weather leads to declining streamflow and warming temperatures. Our ongoing measurements of daily runoff and daily streamflow below Sholes Glacier allow determination of the contribution of glaciers to the North Fork Nooksack, which peaked in 2014 at 80% of total streamflow. Reductions in glacier runoff will put stress on the salmon in the watershed.  The Washington Dept of Fish and Wildlife monitors the salmon population, which in the North Fork migrate 40 km upstream of the junction with Nooksack River to Nooksack Falls. The salmon population which is threatened, shows no sign of recovery in the last decade, the good returns in 2002 reflect good water conditions in 1999-2000 for salmon fry. Continued glacier loss and reduced summer streamflow will lead to a situation similar to the Skykomish River where the number of low flow days has sharply increased. The retreating glaciers include the Sholes, Roosevelt,Deming and Mazama.

nfk glacier contributiion
Glacier runoff in the North Fork Nooksack in 2014, product of observed ablation and glacier area, also percent of total flow.

nooksack salmon
WFDW Governor’s Salmon Recovery Office data for North Fork Nooksack.

Rainbow Glacier: Record Ablation in 2014 for 1984-2014 Period

From 1984-2014 we have monitored the mass balance of the Rainbow Glacier on Mount Baker, North Cascade Range, Washington. This entails detailed monitoring of snowpack depth in July and August, and subsequent ablation to the end of the melt season. On July 13th the glacier was completely snowcovered. By August 10th the snowline had risen to 1575 m, with 1.4 m of ablation since July 13th. We measured the snowdepth at 85 locations on the glacier, with only 6 measurements exceeding 3.5 m on Aug. 10th.

Ben Pelto and Ashley Edwards examining crevasse stratigraphy both the 2013 and 2014 layers evident.

Limited snowpack below the main icefall at 1750 m on Aug. 10.

Minimal 2014 snowpack in crevasses at 1650 m on Aug. 10th 1.25 m.
Limited snowpack below the main icefall at 1750 m on Aug. 10.
By September 27th the snowline had risen to 1975 m with a few pockets of snow retained where the snowdepth had exceeded 3.2 m on Aug. 10th. Snowdepth at the Sept. 27th snowline had been 3.0 to 3.2 m on Aug. 10th. This indicated ablation of approximately 3 m of snowpack, 1.8 m of water equivalent from Aug. 10th to Sept. 27th. Ablation from July 13th to Sept. 27th was 5.3 m of snowpack and 3.2 m w.e. This was 5-10% more ablation than any other year since 1984. A comparison of images from the ground on Aug. 10th indicates the snowpack on the glacier from 1550-1950 m, the blue arrows indicate locations where a patch of 2014 snow remained on Sept. 27th. The Sept. 27th image was taken by Tom Hammond from Rainbow Ridge the only location where the whole glacier can be viewed. The firn is simply old snow that survived a summer and could be from 2012 or 2013.
Aug. 10th accumulation zone view

Tom Hammond Image adusted to show firn, ice and retained snow. Sept. 27th

Winter snowpack was normal on Mount Baker, the record ablation then led to a large negative mass balance for the glacier of -1.8 m, but not a record loss. The ablation did lead to many significant surface streams on the glacier shown below, which drain into the glacier at moulins.

The terminus of glacier retreated rapidly from 1984 to 1998, but has slowed as it currently is in an avalanche runout zone. We visited the terminus in 1984 and all retreat is measured from that point when the glacier was in contact with an advance moraine from the 1955-1980 period of advance. A comparison of 1993 and 2006 Google Earth images indicates the retreat, red outline 2006 margin and black outline 1993. The 2014 image taken by Tom Hammond indicates that the terminus did get exposed in 2014 which will lead to additional retreat when we measure the terminus position next summer. Total retreat from 1984 to 2014 is 490 m.

1993 Google Earth view of terminus

2006 Google Earth view of terminus.
Picture of the terminus in 2014 indicating the 214 and 1984 position.  Taken by Tom Hammond from Rainbow Ridge.
Picture of the terminus in 2014 indicating the 214 and 1984 position. Taken by Tom Hammond from Rainbow Ridge.
Ablation zone on Aug. 10