Skykomish River Basin State of Glaciers in 2026

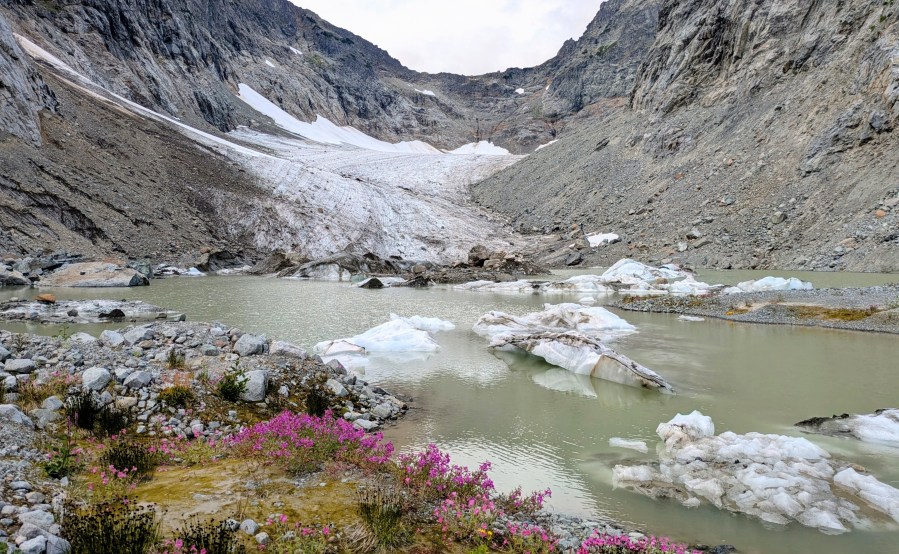
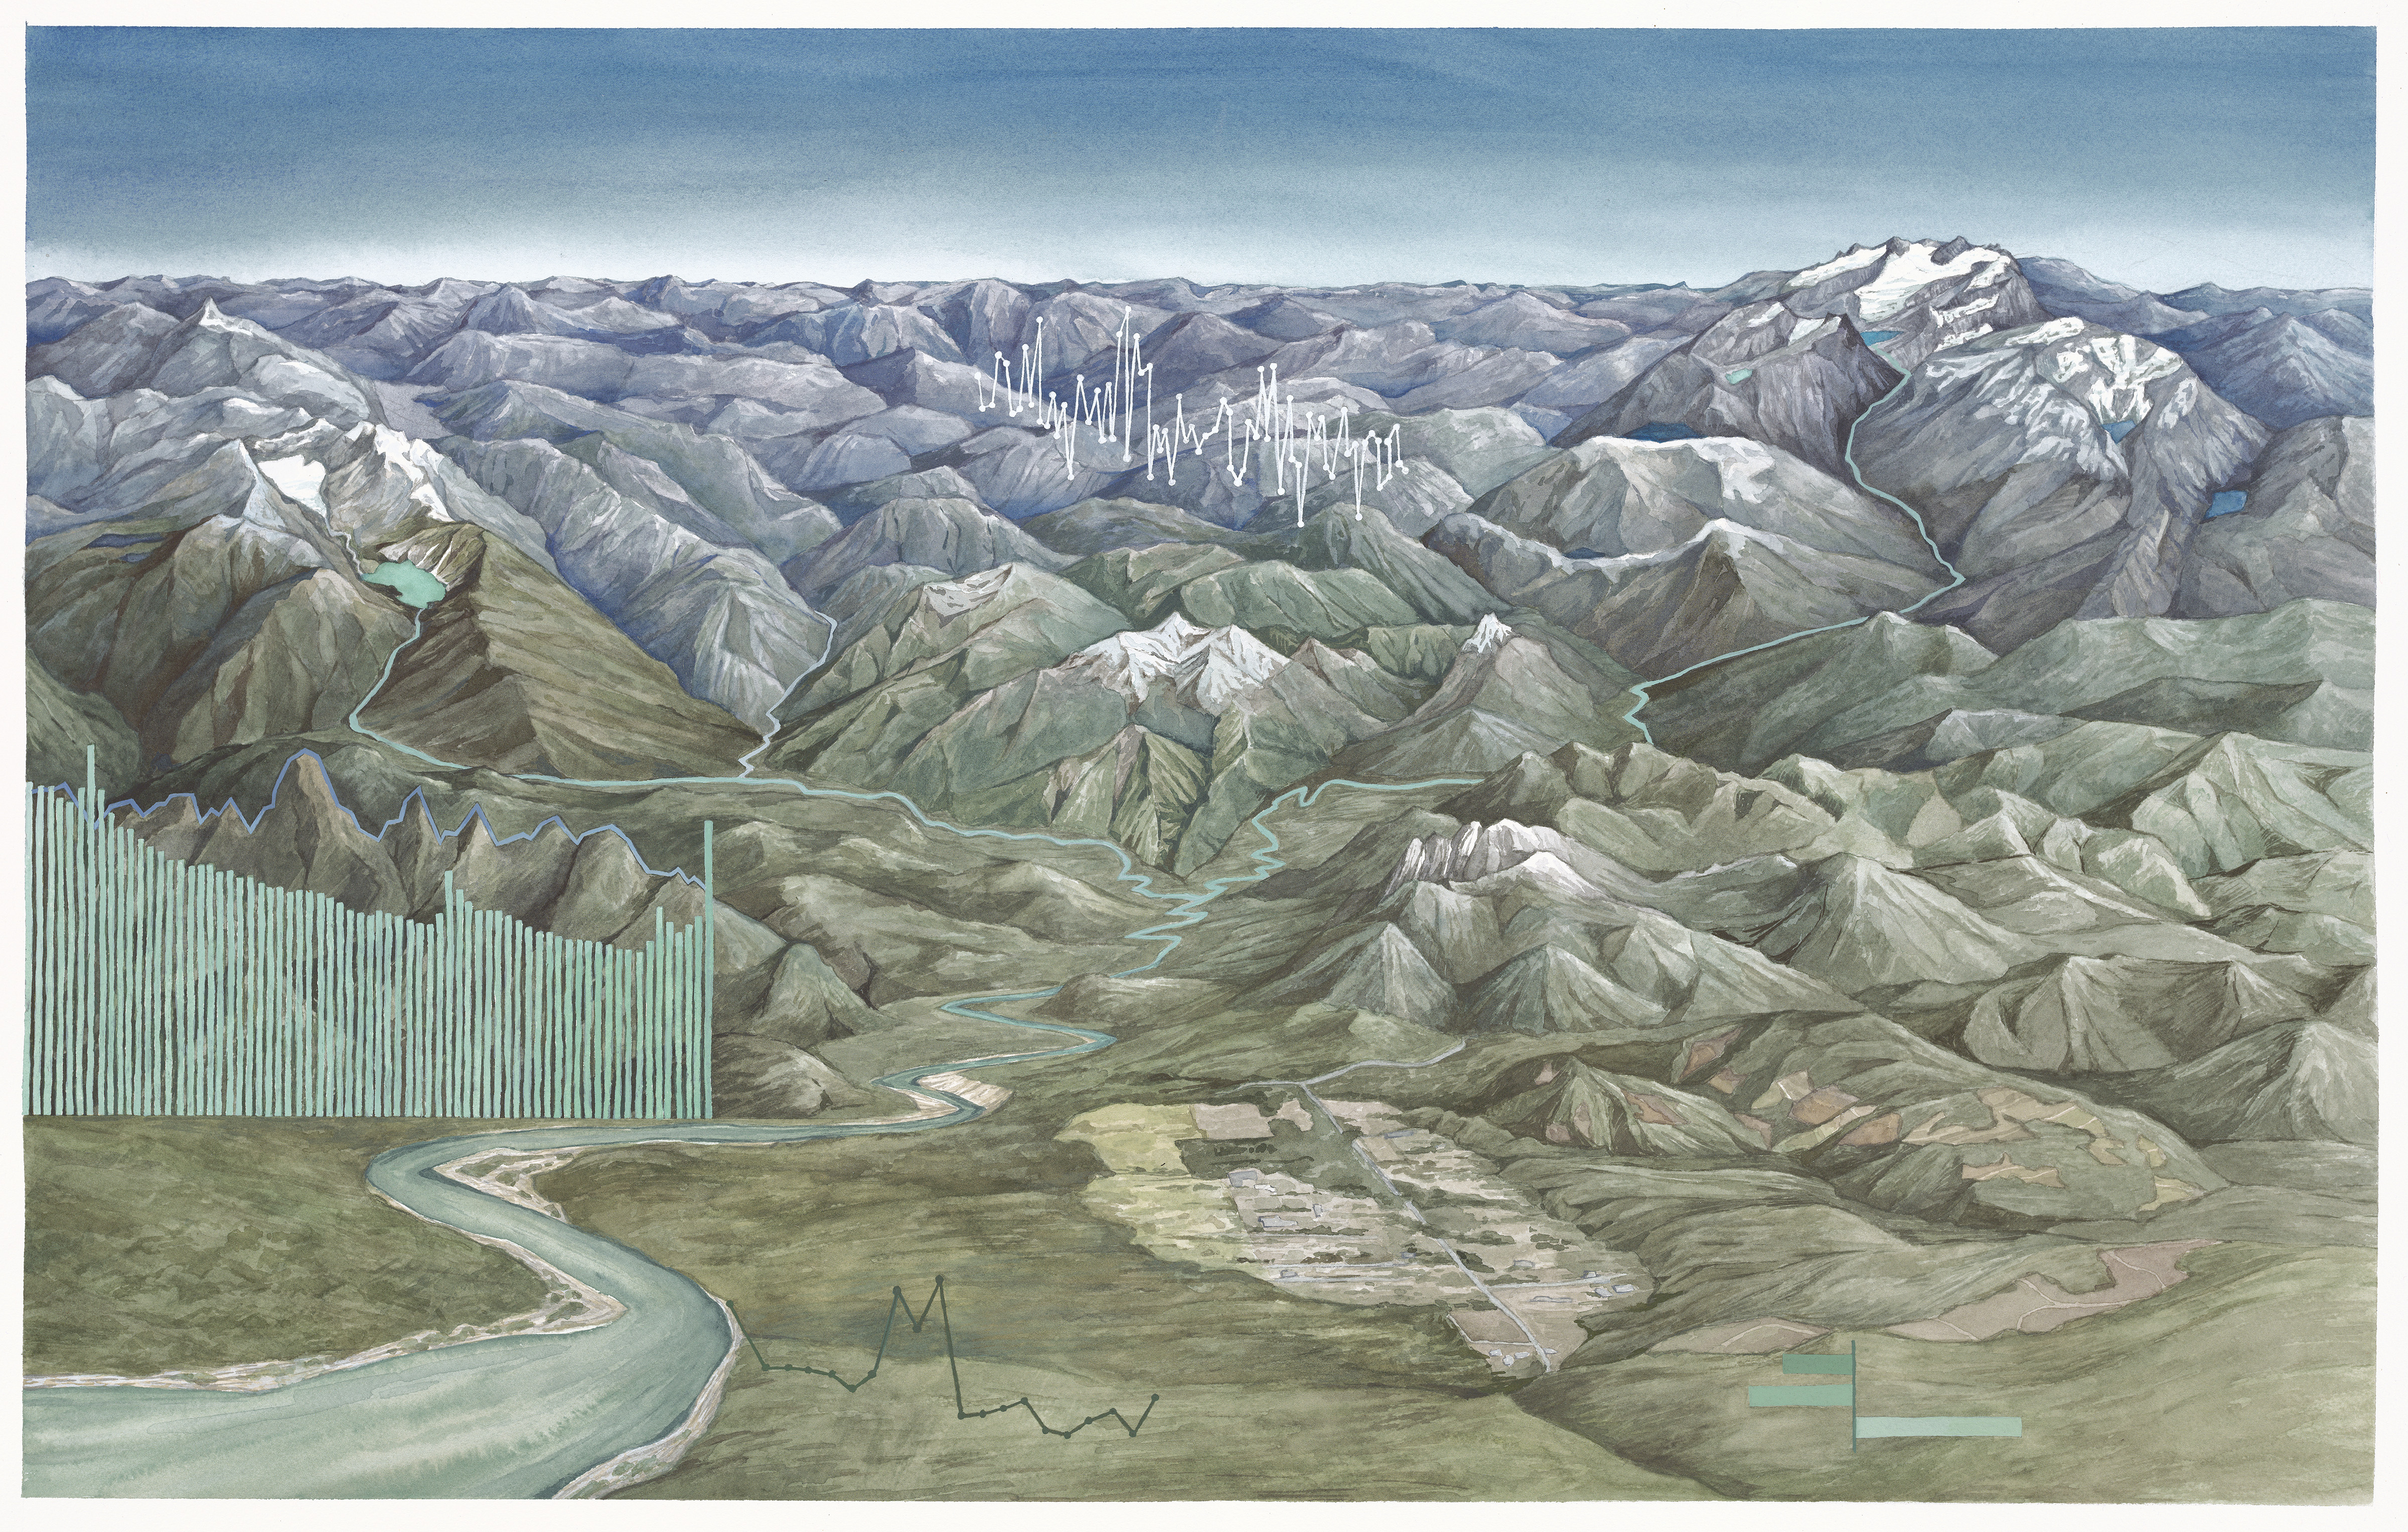
The Skykomish River in the North Cascades is partially glacier fed. It joins with the Snoqualmie River to form the Snohomish River, flowing into the Puget Sound near Everett. Columbia Glacier is seen on the left of the painting, with the beautiful Blanca Lake beneath. This is one of three glaciers remaining in this region, the other six have recently disappeared. On the right side is the Alpine Lakes Wilderness, two glaciers in this complex remain.
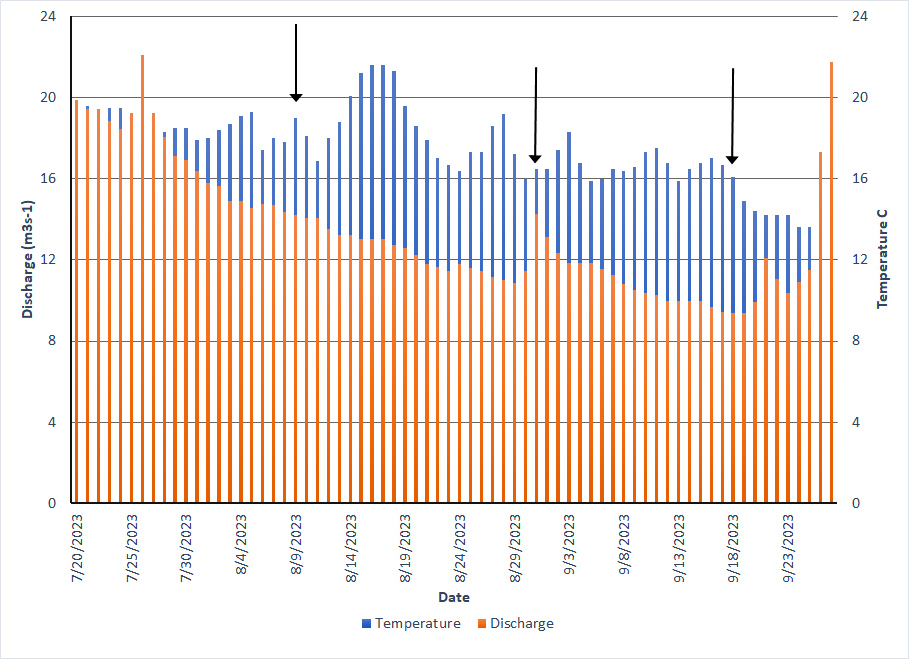
The large bar graph in this piece shows Skykomish River discharge (the volume of water) from mid July to late September in 2023. The decrease in water over the dry, hot summer period is evident. The line graph that makes up the mountain above the bars shows the temperature of the river at this same time, highlighting heat wave events. When the temperature spikes, and when the river levels drop, a critical threshold is reached for salmon and other species. This highlights the importance of glaciers in acting as a buffer during drought and heat events.

In 1958 the Skykomish River Basin was home to nineteen glaciers or perennial snow and ice bodies exceeding 0.1 km2 in area, with a combined area of 5.7 km2 (Post and others, 1971). It was the third most glaciated west side basin in the North Cascades behind the Nooksack and Skagit River. These glaciers provided significant runoff to the basin in late summer (Fountain and Tangborn, 1980). We have monitored the mass balance of two glaciers in this basin from 1984-2026, and the changing area and dynamic characteristics of six other glaciers during this period.  The Skykomish River Basin has experienced rapid glacier loss leading to the loss of six of its nine glaciers, and over a 40% area reduction of the remaining three.

The North Cascade Glacier Climate Project has maintained an annual mass balance monitoring on the two largest glaciers in the basin from 1984-2026; Columbia and Lynch Glacier. The mean annual mass balance on these two glaciers was –0.4 m/year from 1984-2013, decreasing to –1.5 m/year from 2014 to 2025. This represents the average water equivalent thickness of ice lost from the glacier.

Columbia Glacier in 2003 and 2026 illustrating both the thinning, formation of a new lake and significant area decline.

In the field between 1984 and 1986 we identified nine glaciers in the basin that had active crevassing and sufficient area to be classified as a glacier. During the 2005-2023 period we observed six of these glaciers to have disappeared. Lynch and Columbia Glacier now comprise 88% of the total glaciated area in the basin in 2023, up from 37% of total glaciated area in 1958. Foss Glacier, the third remaining glacier in the basin, has lost 85% of its area since 1958 and has almost disappeared. We will check on this glacier later this summer to see if it still is a glacier. The basin is on a trajectory to lose all its remaining glaciers in the next 2-3 decades; this transition to a non-glacier fed watershed will lead to further reductions in summer discharge and increased summer water temperatures.

In 2026 the approach to Columbia Glacier via the Blanca Lake trailhead was lenghtened by bridge and road washouts from the December atmospheric river event. In 2026 the Columbia Glacier will thin by at least 2 m. The lack of avalanche snowpack indicates the warm winter conditions that prevented buildup of snowpack in the 5000-6500 foot range that feeds this glacier. Lynch Glacier had substantial snowpack remaining in its upper basin above 7200 feet. This indicated that the December atmospheric river event deposited snow not rain on the upper Lynch. This was partly due to the embedded cold air east of the divide that Lynch Glacier sits on. Our approach and exit from Mount Daniel and Lynch Glacier was impacted by smoke from the Three Queens fire.

Foss Glacier continues to fragement and disappear.

In glaciated watersheds glacier runoff is of particular importance to aquatic life in late summer and early fall when other water sources are at a minimum, increasing minimum flow and reducing maximum temperatures, thus providing crucial drought buffering capacity (Ultee and others, 2022). In the Skykomish River Chinook salmon are a threatened species with the fall runs being sensitive to lower flows and higher temperatures.

Stream discharge and temperature are observed at the USGS Skykomish River gaging station at Gold Bar. This gaging station is downstream of the confluence of the North and South Fork of the Skykomish River. The basin above Gold Bar has an area of 1386 km2, the average elevation of the basin is 1050 m. A key threshold of in-stream flow levels considered insufficient to maintain short term survival of fish stocks is below 10% of the mean annual flow, for Skykomish River that threshold is 14 m3s-1 (~490 cfs). In the Skykomish River from 1958 to 2023 there were 390 melt season days with discharge below 14 m3s-1. Of these only three occurred before 1985, and 74% have occurred since 2000. The loss of significant glacier runoff is a key reason for the increase of low flow days. Of more concern for aquatic life is the occurrence of extended periods (7+ days) of low flow-below 14 m3s-1 during the melt season, 1986, 1987, 1992, 1998, 2003, 2005, 2006, 2007, 2015, 2017, 2019, 2021, 2022, 2023, 2024, 2025 and 2026.

These low flows are associated with higher stream temperatures.The Skykomish River was listed as having a water quality standard impairment for water temperature in a 2008 303(d) listing and proposed 2010 303(d) listing, under the Clean Water Act[11]. Several segments of the Skykomish River as well as its tributaries consistently exceed water quality temperature standards today. The TMDL(total maximum daily load) for the Skykomish River indicates the maximum temperature should not exceed 16oC for seven consecutive days.

A water temperature sensor became operational in early July 2022 at the USGS Gold Bar site. The temperature exceeded 18oC for the first time on July 27. It surpassed 18oC diurnally on 37 of 42 days from July 27-September 7. In 2022 the 16oC threshold was exceeded continuously from July 26th to August 4th, August 14th-August 28th, and August 29th to September 4th. In 2023 the 16oC threshold was exceeded continuously from July 27th to August 21st, coinciding with the period of low streamflow from August 11to August 21. In 2025 stream temperature remained above 16C from August 22nd to Sept. 14th.

In 2026 stream temperature rose above 16C on Aug. 5th and as of Aug. 22nd has remained above this threshold. During this same interval discharge has reamined below the adequate flow threshold declining to 360 CFS. The low flow and high stream temperatures will continue to stress salmon and limit recreational uses of the river.
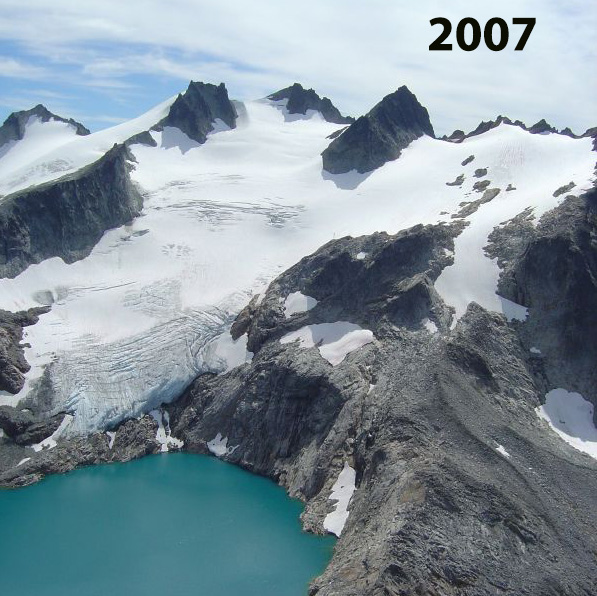
Lynch Glacier from across Pea Soup Lake. The lake has lost its pea soup color and is now trending toward azure. The west side of the glacier is now crisscrossed by rock bands and no longer contributes to flow.
Skykomish River discharge and temperature at the USGS Gold Bar station in summer 2023 indicates temperature rising above the 16 C threshold and discharge falling below the 14 m3/second threshold.

North Cascade Glacier Accumulation Season 2025/26

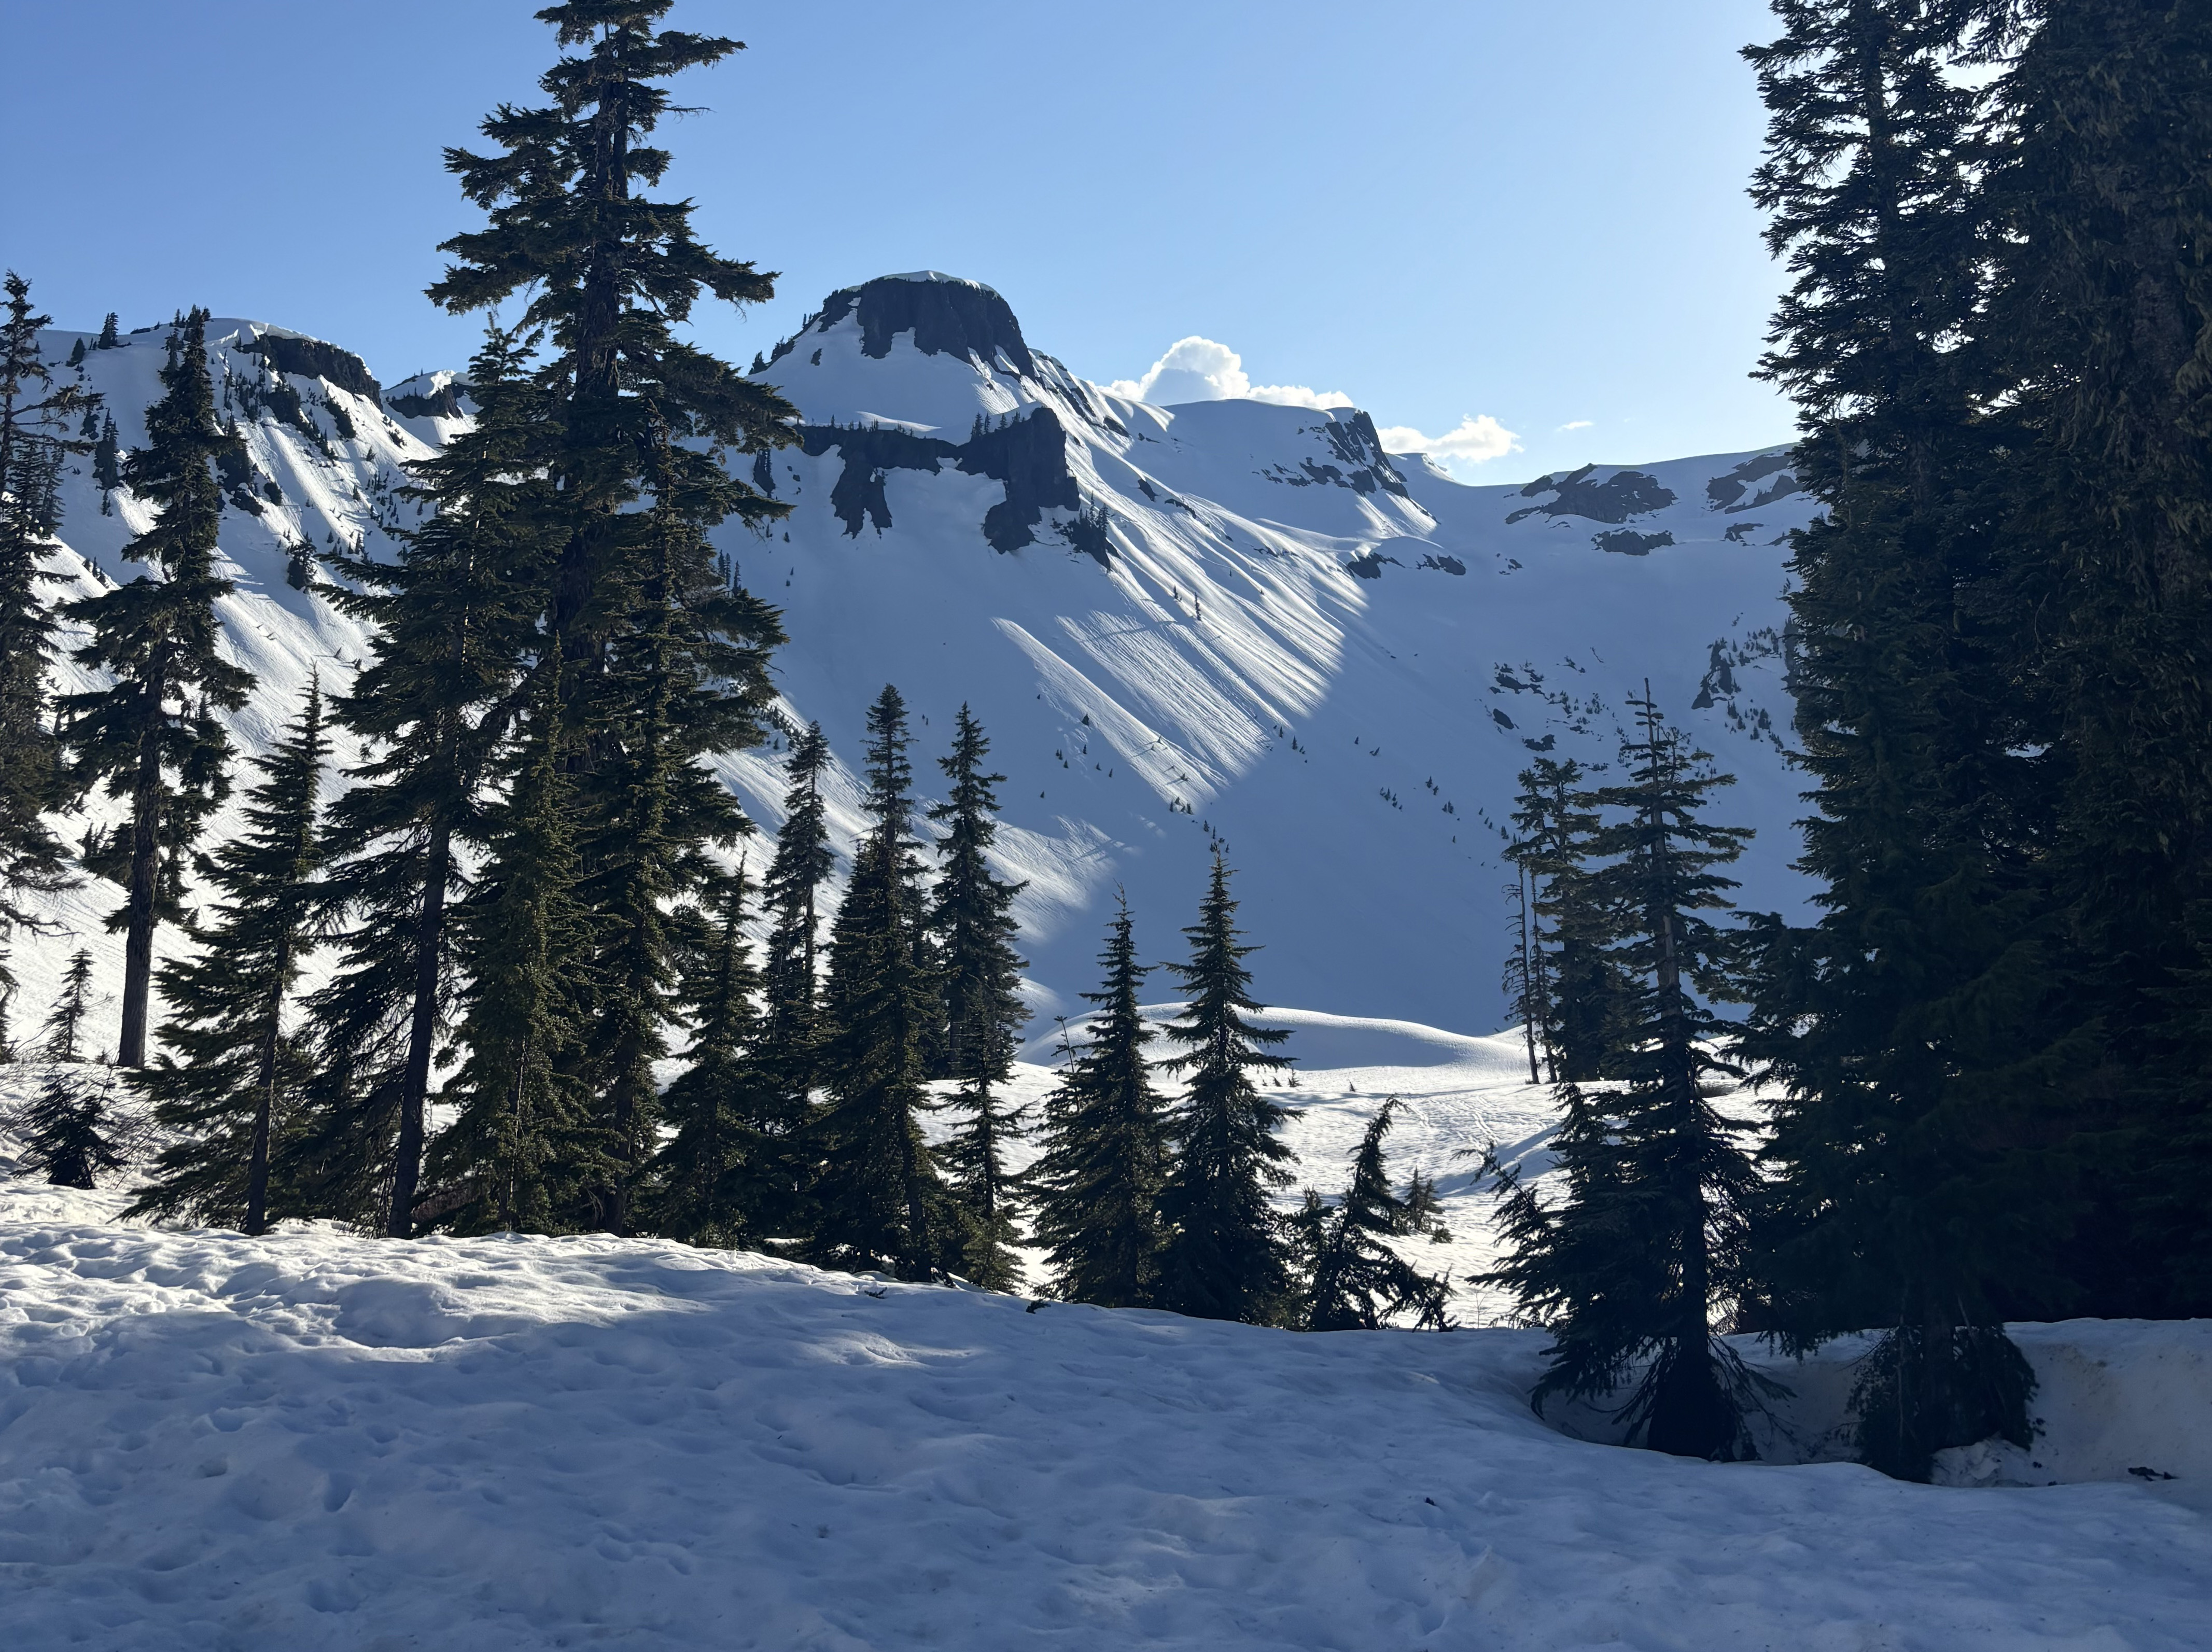
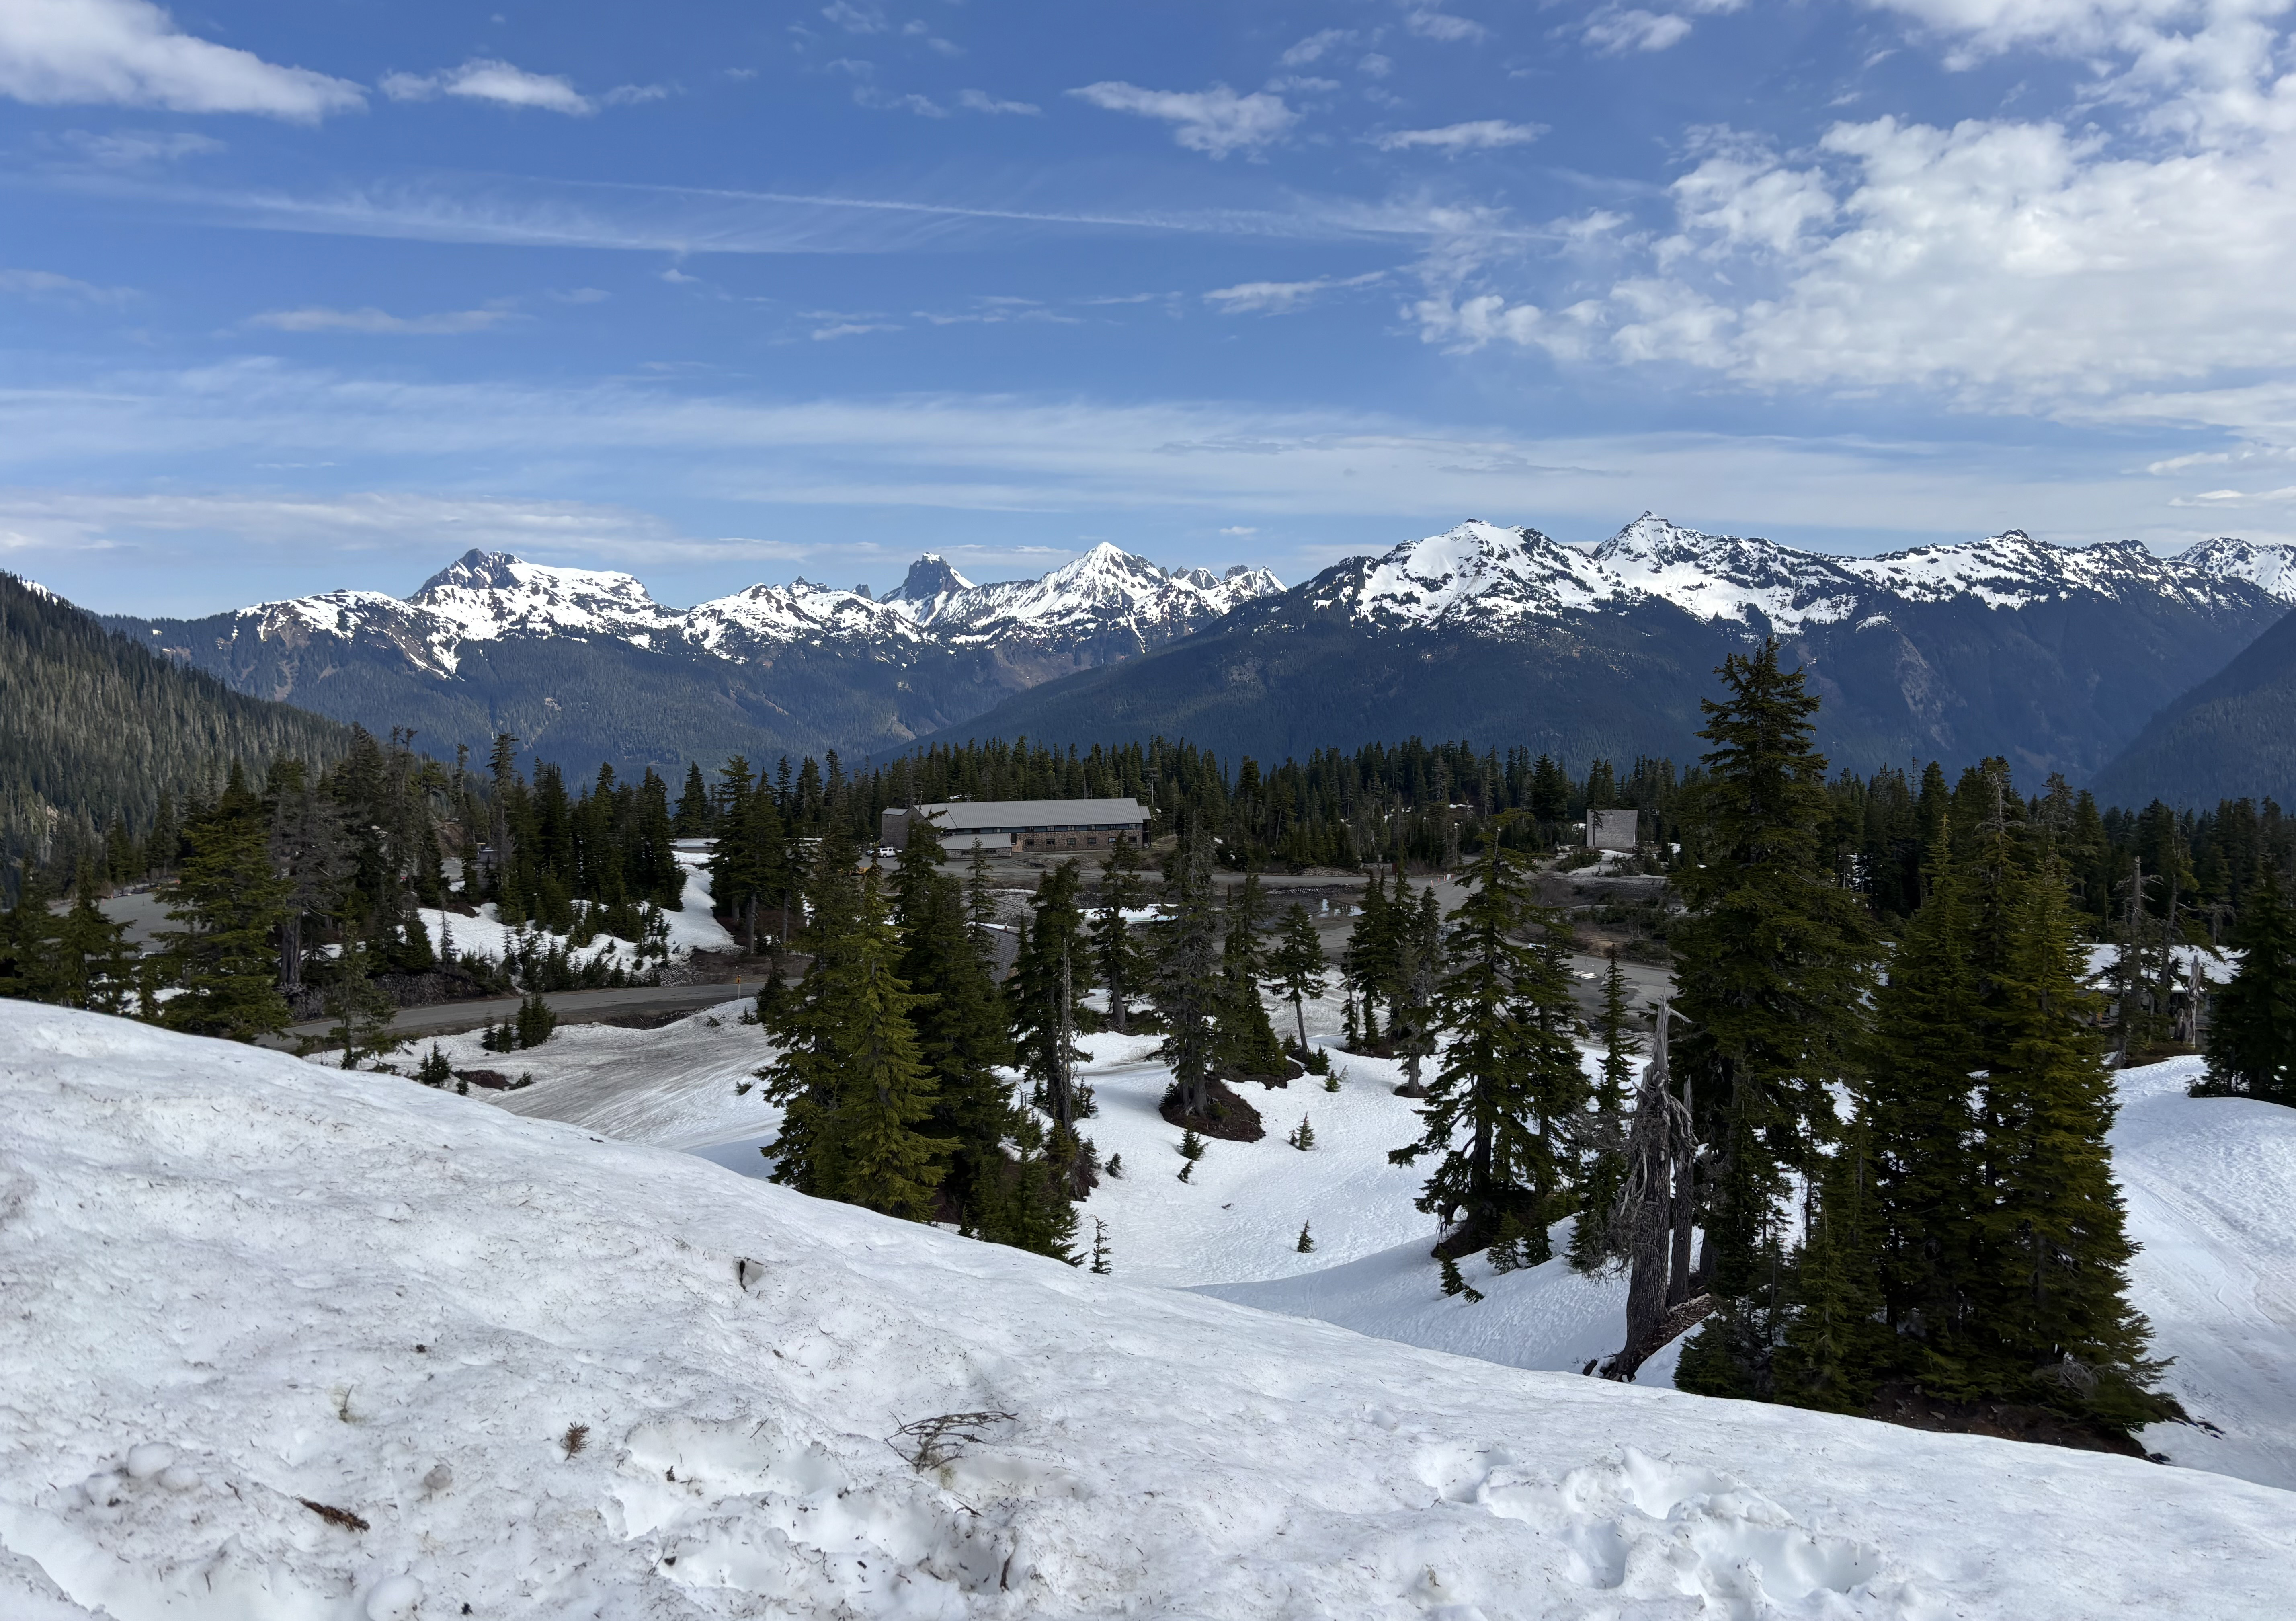
View from Heather Meadows to Table Mt on May 2, 2026 (Jill Pelto photo)

Since 1984 we have measured glacier mass balance on North Cascade glaciers every year. Mass balance is the difference between accumulation (income) and melt (expenses). The accumulation season typicallys ends around May 1. In 2026 it ended on April 19.

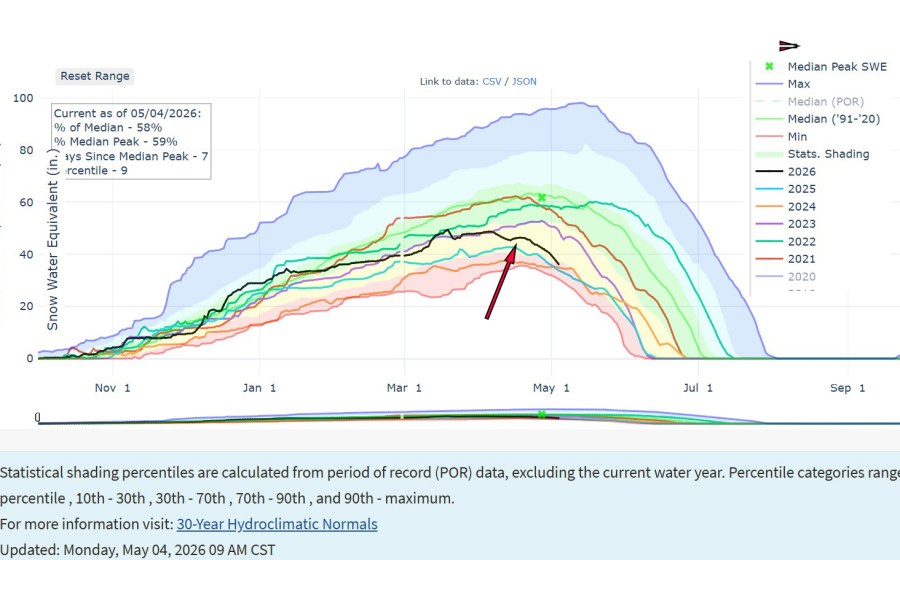
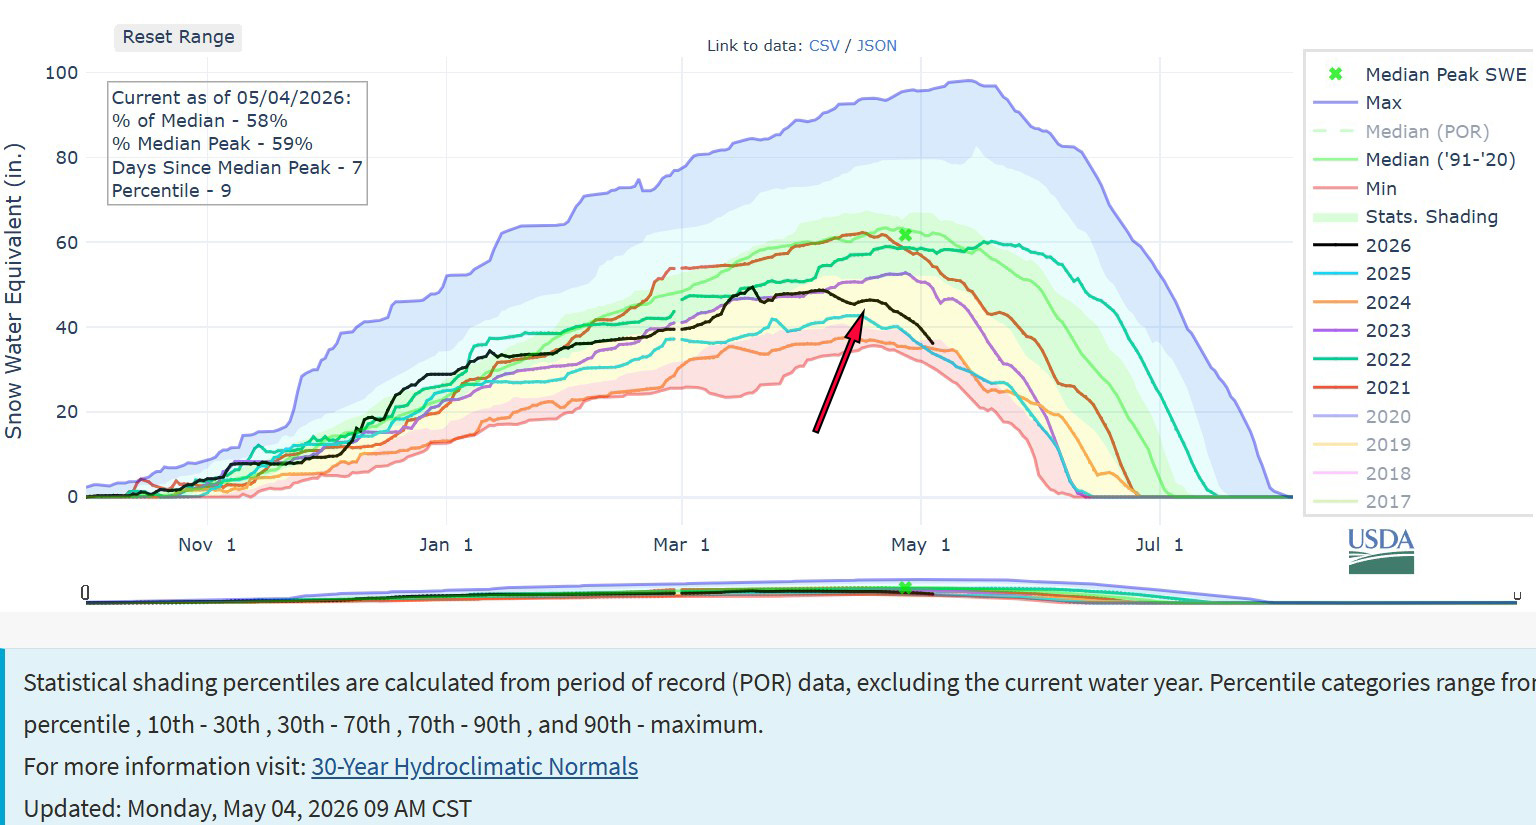
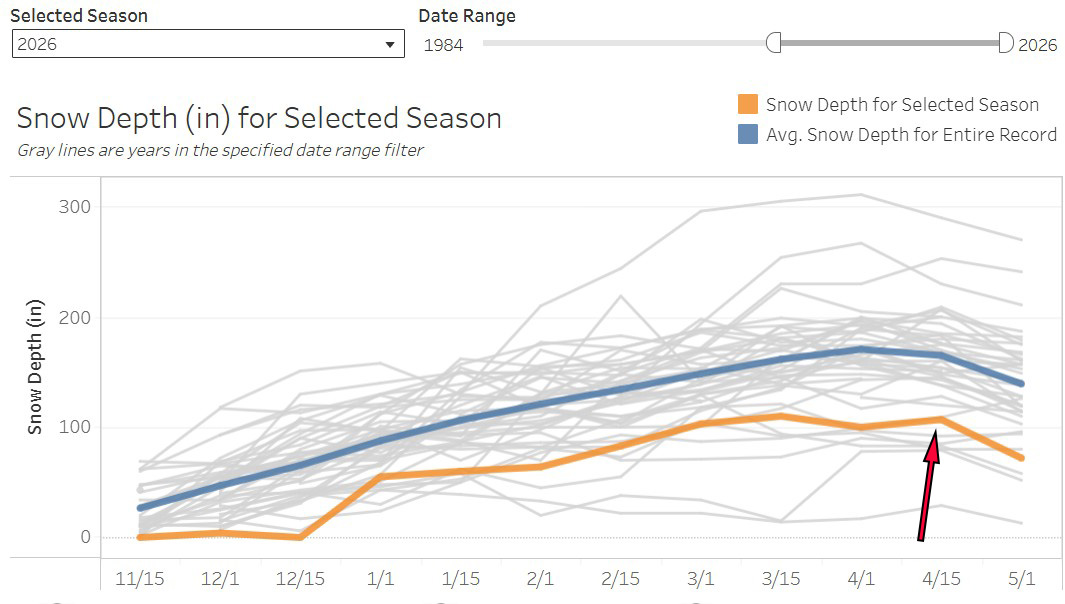
In early December snowpack was average above 1500 m (5000 feet) and limited below. The region was then impacted by a historic atmospheric river from Dec. 8-12. that led to flooding and landslides closing I-90 and Highway 2. Snowpack was completely lost at most locations below 1500 m including the Mount Baker station in Heather Meadows (1285 m). Above 1500 m at Lyman Lake (1825 m) SWE increased by 15 cm, which was 50% of the 30 cm of precipitation that fell in this period. The last half of December snow depth increased from 0 to 1.5 m at Heather Meadows. Snowpack built to 1.2 m w.e. at Lyman Lake by March 15, and then hovered around this peak until mid-April. At Heather Meadows snowpack depth peaked at 2.8 m on March 15th and was at 2.7 m on April 15th. This April 15th represented the maximum snowpack for elevations at 1500 m and above. The snowpack was less than 50% of normal below 1800 m. Above 2000 m warm wet winter events did deliver snowfall that was rain below and the situation is likely better. Working with Snowgoat Skimo as they prepare for the Kulshan Randoneee has noted snowpack of over 6 m at the 2000 m level.

The transition to melt season was rapid with a particularly warm period from April 26-May 4 has led to rapid melt off of snowpack. At Lyman Lake a third of the snowpack was lost by May 8th. At Heather Meadow 50% of snowpack depth was lost by May 8th.

Mount Baker snow depth station indicating loss of snow in December atmospheric river, then rapid development and finally the unusually rapid drop in late April. WSCO graph.


View toward lower Heather Meadows and Baker ski area-snowline above 1200 m on 5-2-26.-where the snowpack is already thin. (Jill Pelto photo)

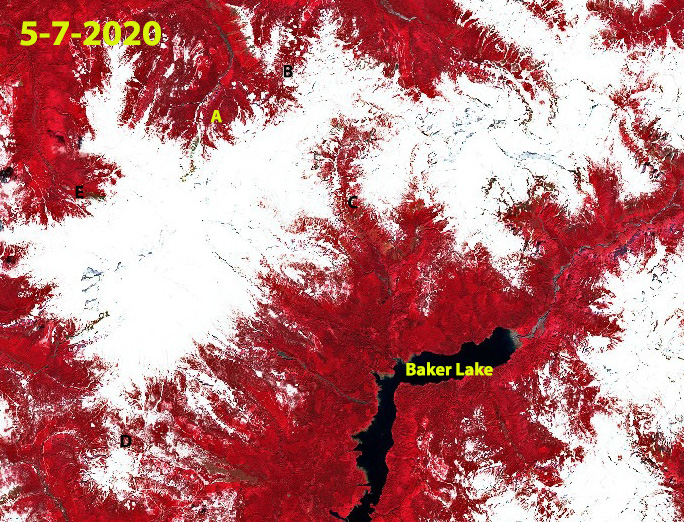
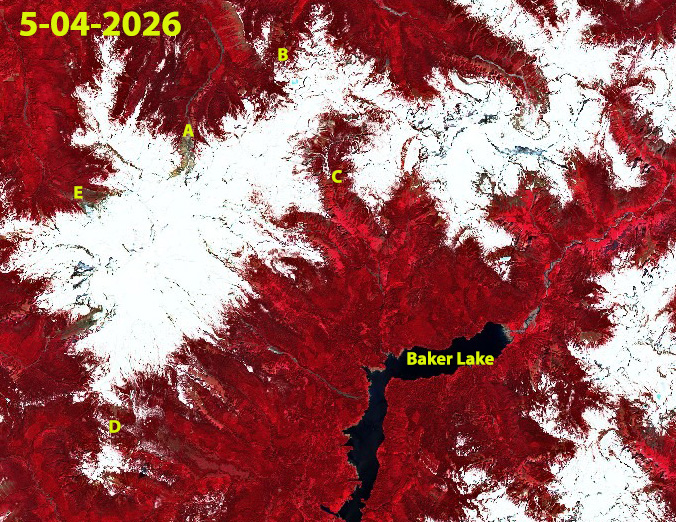
Sentinel Image from 5-7-2020 a normal snow year-snow line 850 m.

Sentinel image from 5-4-2026 illustrating regional snow line at 1200 m. The limited winter snowpack indicates that in 2026 we have a low accumulation/income for glaciers and melt/expenses already underway. Coleman Glacier terminus (E) is already exposed ice the first week in May. We will be in the field this summer to measure the details. We are expecting more bare ice and rockfall during our work.

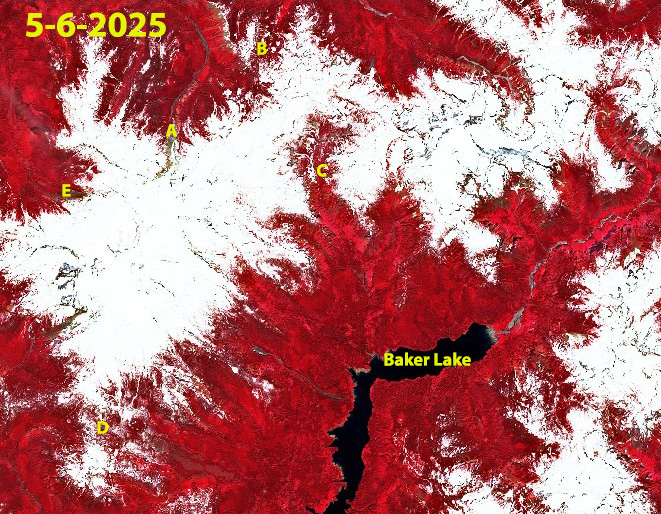
Sentinel image from 5-6-2025 snow cover- snow line 975 m.

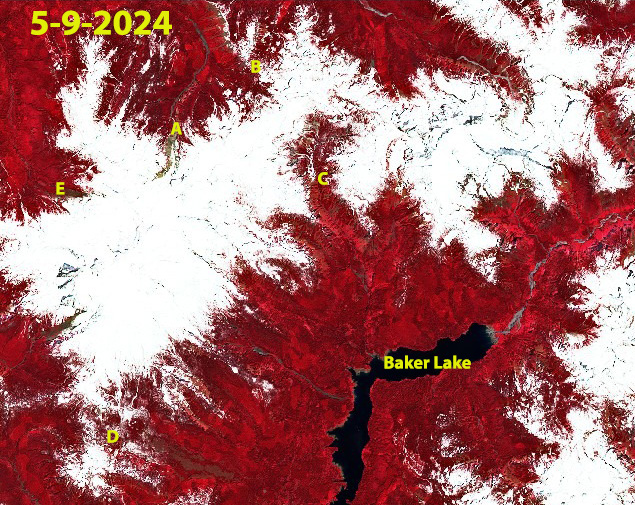
Sentinel image from 5-9-2024 with snow line at 975 m.

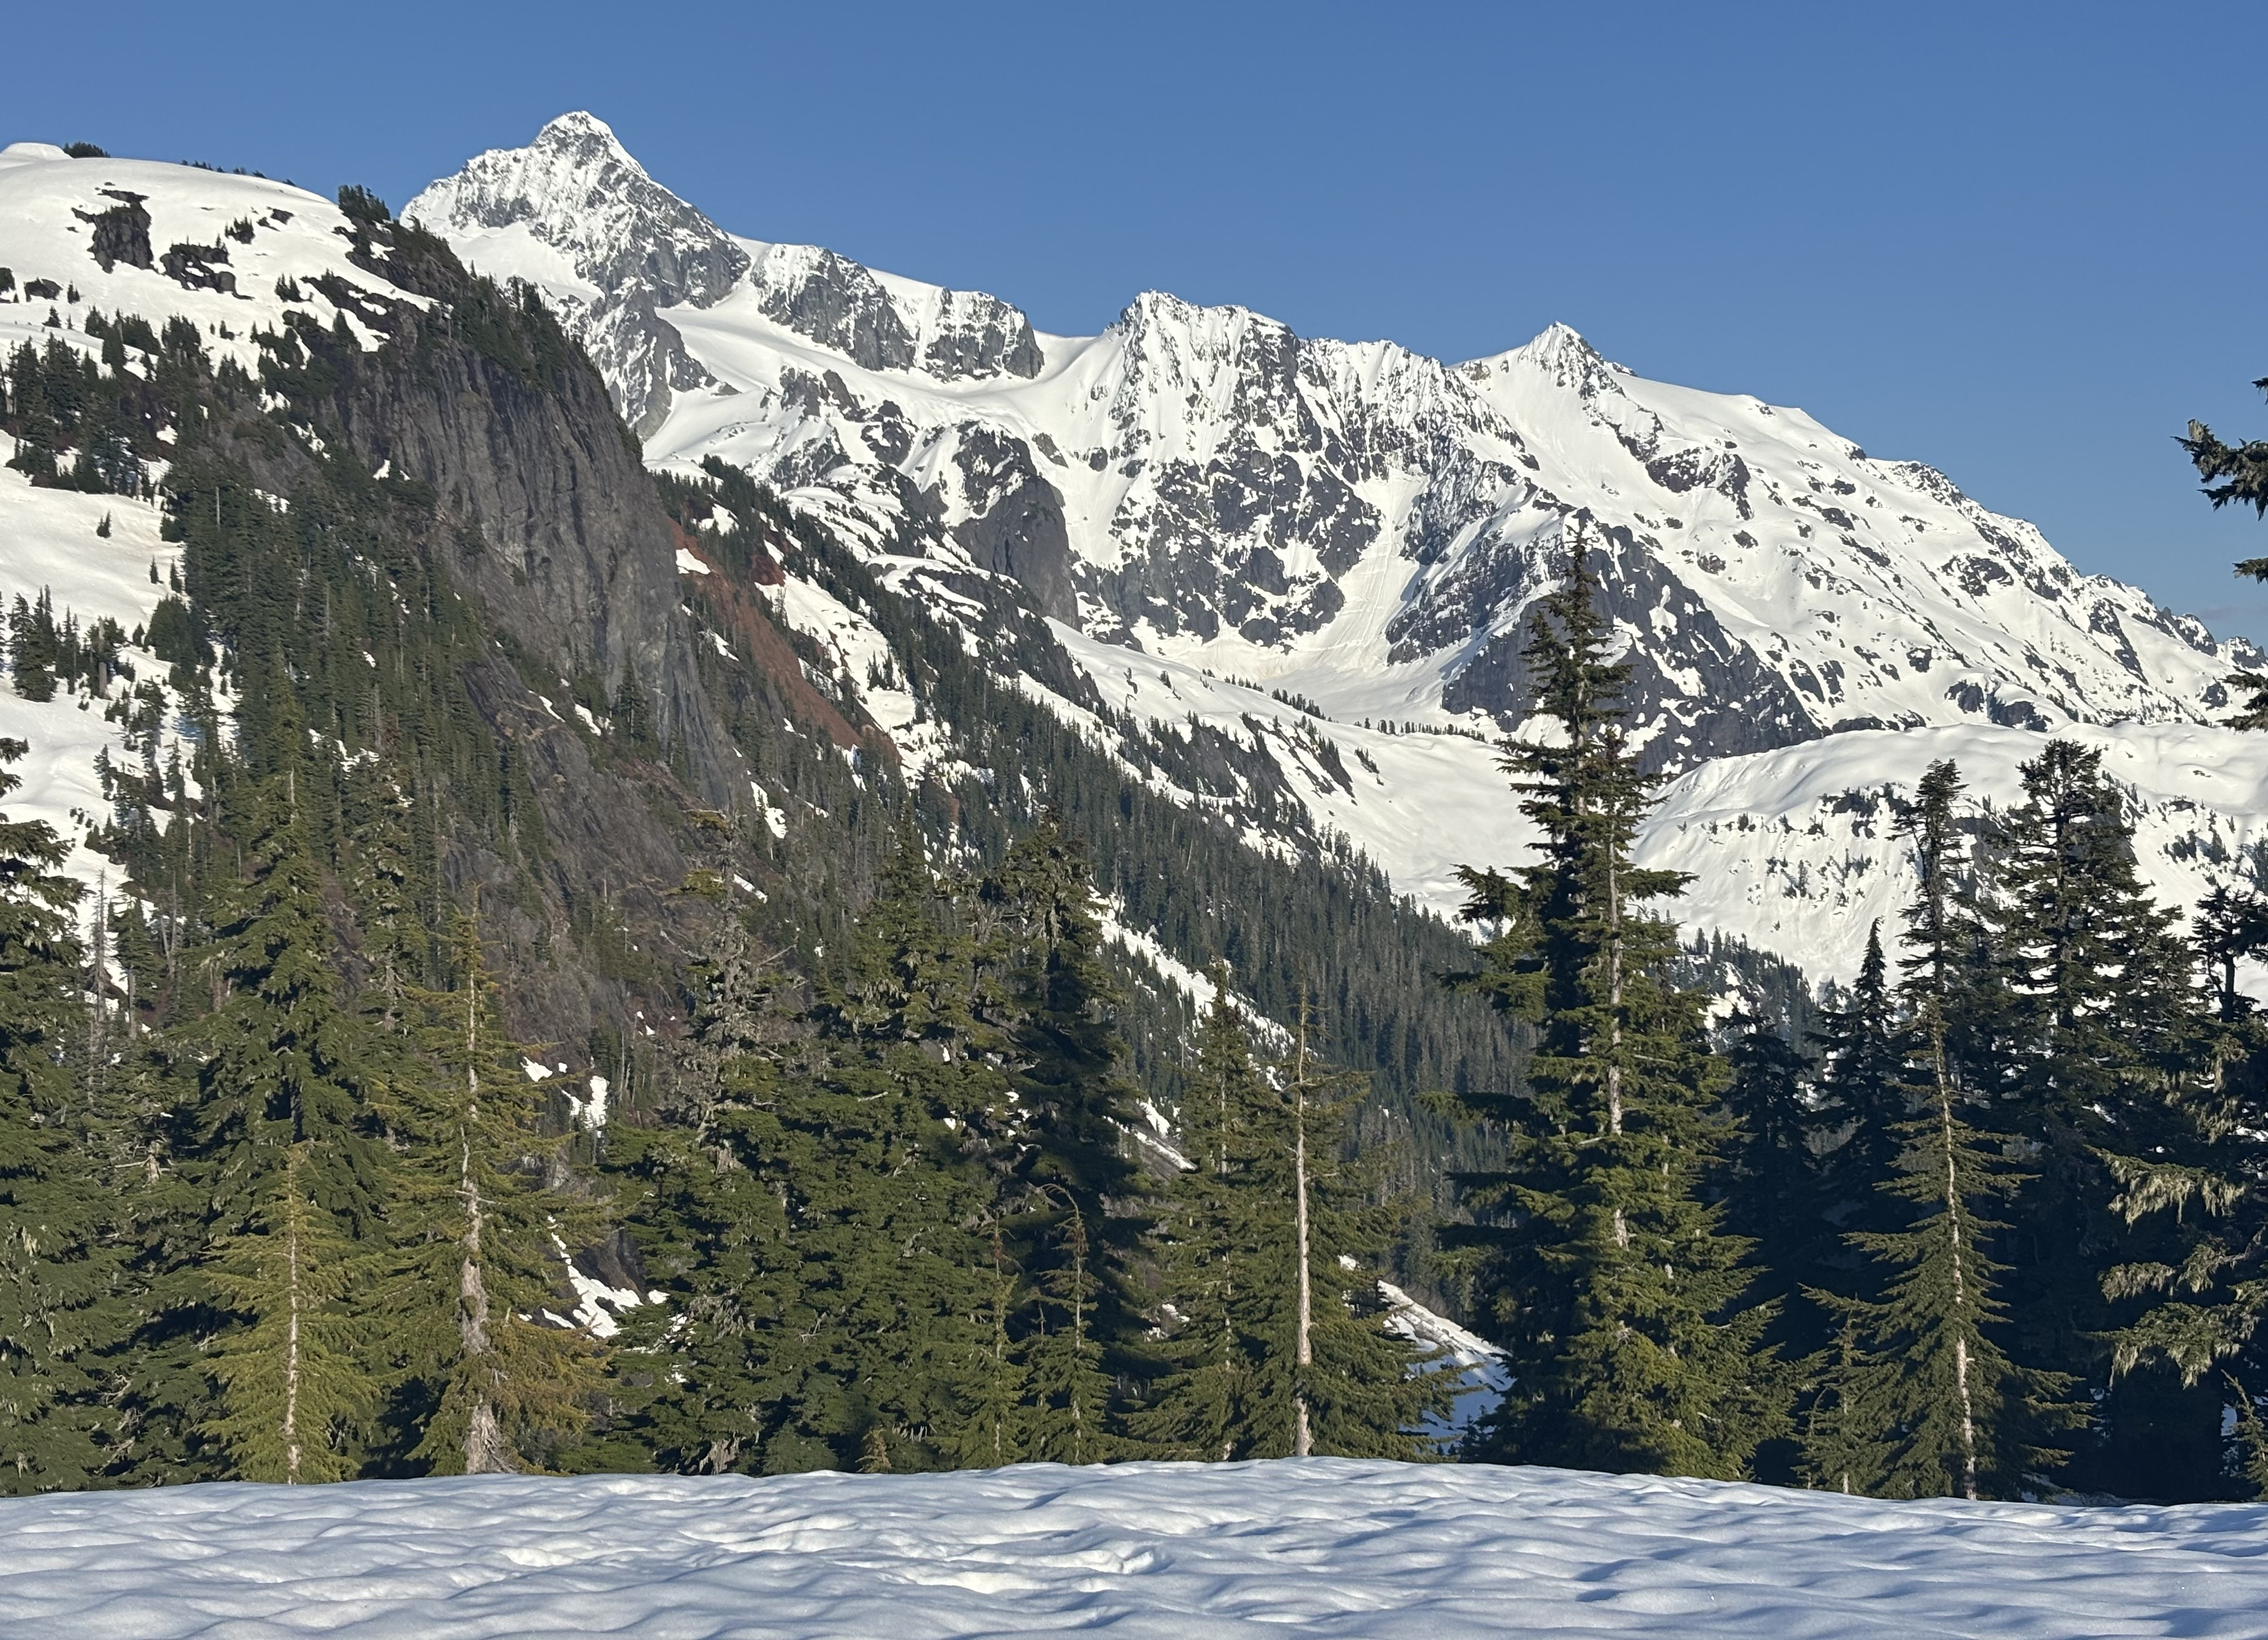
Looking from Austin Pass across to Shuskan on 5-3-26 (Jill Pelto photo)

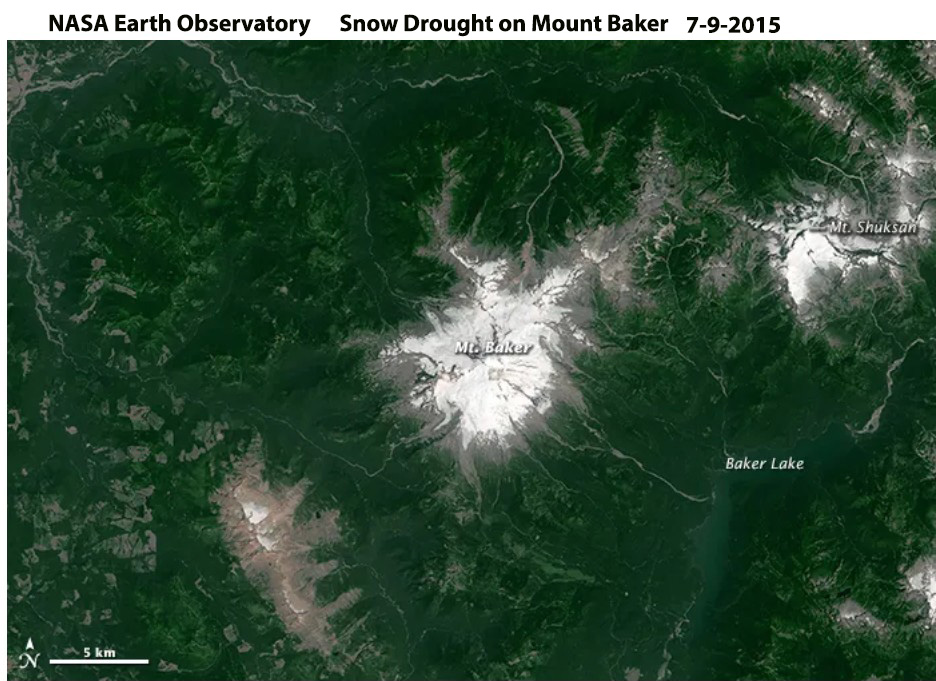
The outlook is poor for glaciers and snowpack in the Pacific Northwest in 2026. How this measures up with the snow drought of 2015 that we reported on in a project with NASA will be important to observe.

snow free iceland ice cap

Hofsjokull East, Iceland Loses all Snow Cover in 2025-Bedrock Expanding amidst Ice Cap

Hofsjokull East is snow free on 8-17-2025 in this false color Sentinel image. This leads to ice melt, thinning and bedrock expansion at Point A-D.

Hofsjokull East, Iceland is a small ice cap east of Vatnajokull with a summit elevation of 1100 m. In the last decade the snow line has often been above the ice cap. The ice cap had an area or 4.97 km2 in 2003 declining to 2.51 km2 in 2023 (Iceland Glacier Viewer). In 2024 all 10 glaciers in Iceland had significant mass loss (Pelto, 2025).

In August 2020 the ice cap has lost nearly all of its snow cover, this occurred again in 2023 and 2024. The result in 2025 when the ice cap again lost all its snowcover, is significant glacier surface melt and thinning. This leads to expansion of bedrock. At Point A there has been rapid expansion of the bedrock knob. At Point B and C new bedrock has been exposed and rapidly expanded. At Point D a bedrock rib at the edge of the ice cap has spread into the ice cap.

The lack of snow cover indicates the ice cap no longer has an accumulation zone and cannot survive. In 2025 the ice cap area is 2.10 km2 . Ice cap area has declined by ~60 % in the last 22 years. The story here is similar to that at the larger Prándarjökull 10 km to the northeast. The summer of 2025 in Iceland was exceptional beginning with a May heatwave, followed by a July heatwave. The May heat wave led to high snow lines as summer began on Vatnajokull.

Hofsjokull East is nearly snow free on 8-14-2020 in this false color Sentinel image. Contrast the area of bedrock at Point A-D to the 2023 and 2025 images.

Hofsjokull East is nearly snow free on 9-3-2023 in this false color Sentinel image. Point B and C now have evident bedrock areas.

Prándarjökull, Iceland Loses all Snow Cover in 2025-Accelerating Loss

Prándarjökull on August 20, 2025 has no retained snowpack-with weeks left in the melt season (Sentinel false color image)

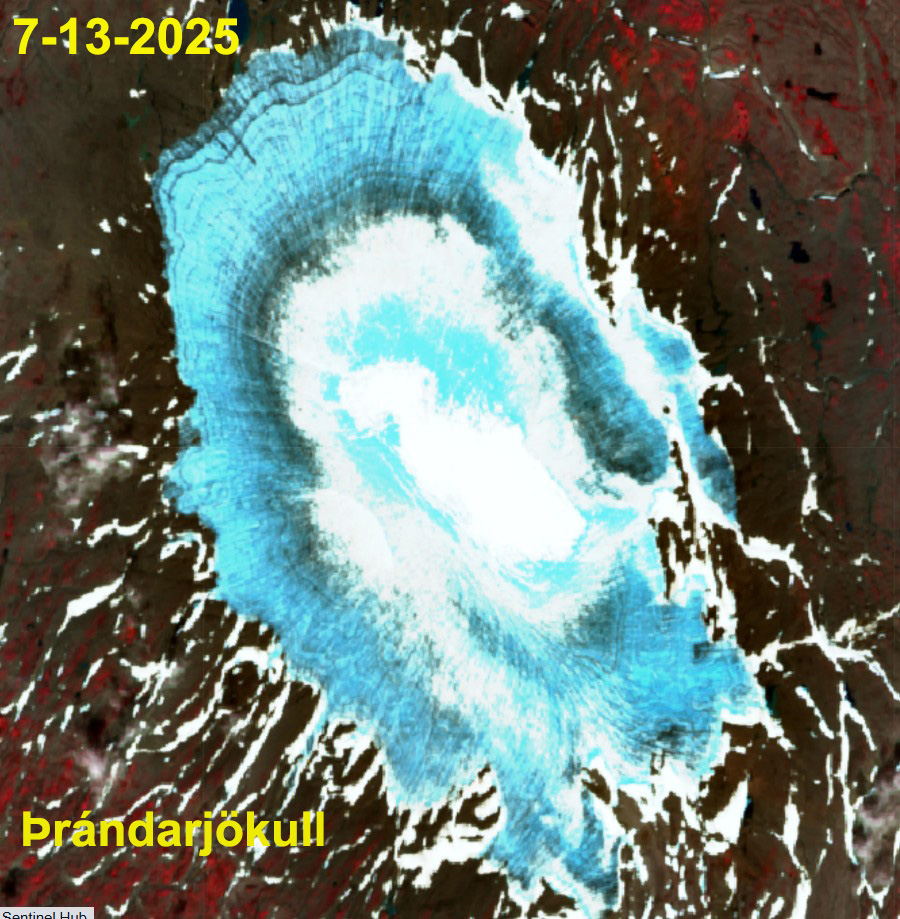
Prándarjökull is an icecap northeast of Vatnajokull that has a summit elevation of 1215 m, and a margin between 875 and 925 m. In 2003 the ice cap had an area of 17.3 km2, declining to 12.8 km2 by 2023 (Iceland Glacier Viewer). In 2024 all 10 glaciers in Iceland had significant mass loss (Pelto, 2025)

In 2021 the ice cap lost at least 90% of its snow cover as noted in the Sentinel image from 8-24-2021. In 2023 The ice cap again lost nearly all of its snow cover.

Prándarjökull on August 31, 2023 has only 5-10% retained snowpack-with weeks left in the melt season (Sentinel false color image)

The spring and early summer of 2025 was one of record warmth for Iceland. This led to a rapid rise of the snowline to 900-1000 m on Vatnajokull. By mid-July 60% of the Prándarjökull was snow free. There is an area of water saturated snow-light blue amidst the snowpack.

Prándarjökull on July 13, 2025 the ice caphas 40% retained snow cover-with weeks left in the melt season (Sentinel false color image)

By August 20, 2025 the ice cap had no snow cover. The early exposure of ice in recent years is leading to the continued recession of the ice cap and the intrusion of bedrock areas into the ice cap at Point A and B. At Point C in 2021 recent firn is exposed, that has melted away by 2025. The area of the ice cap has declined to 11.5 km2. There is no recent retained firn-indicating that in the last five year no snow cover has persisted to the end of this summer. This indicates the lack of an accumulation zone, without which the glacier cannot survive.

Prándarjökull on August 31, 2023 has only 5-10% retained snowpack-with weeks left in the melt season (Sentinel false color image)

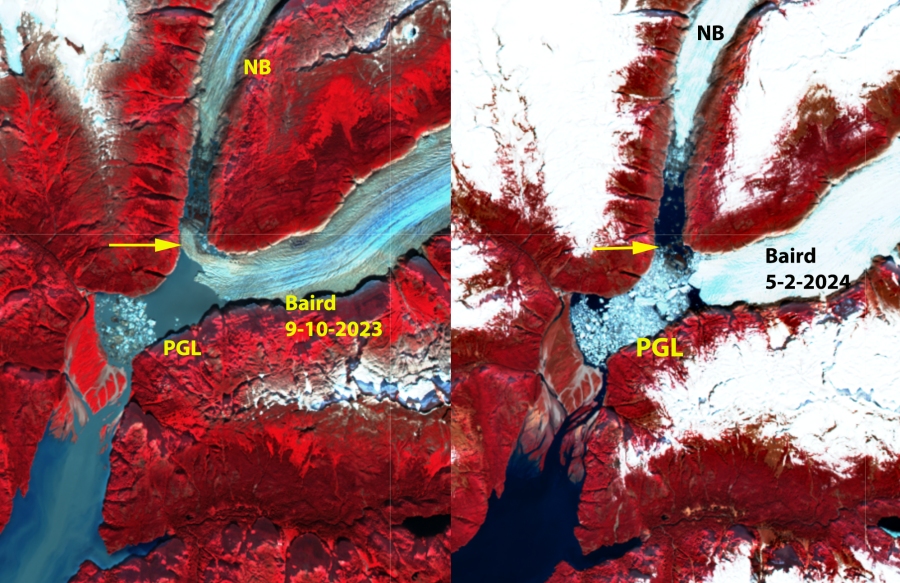
Baird Glacier, Alaska Terminus Tongue Breaks Off April 2024

Baird Glacier terminus tongue gone in April 26, 2024 Landsat image. Red arrow indicates now joined 5 km2 proglacial lake. Yellow dots terminus of Baird and North Baird Glacier

Baird Glacier drains the west side of the Stikine Icefield in southeast Alaska. It is the only glacier of the Stikine Iceifield that did not retreat significantly from 1960-2010. Pelto et al (2013) predicted the onset of significant retreat of this glacier, which like Brady Glacier had been slow to begin retreat despite thinning that was evident when I visited the glacier in 1984. The proglacial lake that has emerged with retreat has an area of 3.25 km2 and the glacier retreat is 2800 m from 1990-2024. The North Baird Glacier separated from Baird Glacier in 2019, with a proglacial lake extending downvalley to the tongue of Baird Glacier that separated this lake from the Baird Glacier proglacial lake until April 2024.

Baird Glacier in Landsat images from 1990 and 2023 illustrating retreat and proglacial lake expansion.
Baird Glacier in false color Sentinel images from September 10 2023 and May 2 2024. Proglacial lake (PGL) expanded from 3.2 to 5.1 km². Tongue extending upvalley toward North Baird Glacier (NB) broke up in late April, yellow arrow.

Baird Glacier in false color Sentinel images from July 2022 and July 2023. Proglacial lake (PGL) expanded from 3.00 to 3.25 km² width of tongue extending upvalley toward North Baird Glacier (NB) has declined from 700 m to 400 m.

In 1990 the Baird Glacier was sitting on an outwash plain, with no lake at the terminus. The North Baird Glacier was 1 km wide where it joined the Baird Glacier. By 2015 the glacier has retreated 750 m and the lake (PGL) has an area of ~1 km².  In 2022 the glacier has retreated leading to a lake expansion to 3.00 km². In July 2023 the tongue of ice extending across the front of the North Baird Glacier valley has thinned 40% since July 2022. The tongue remained throughout 2023 into April of 2024 before breaking up. This leaves the main terminus of the glacier more vulnerable to further rapid calving retreat. Baird Glacier is catching up to the rest of the Stikine Icefield that has experienced significant retreat, Dawes GlacierPatterson Glacier and Great Glacier. With Sawyer Glacier retreating from tidewater in 2023.

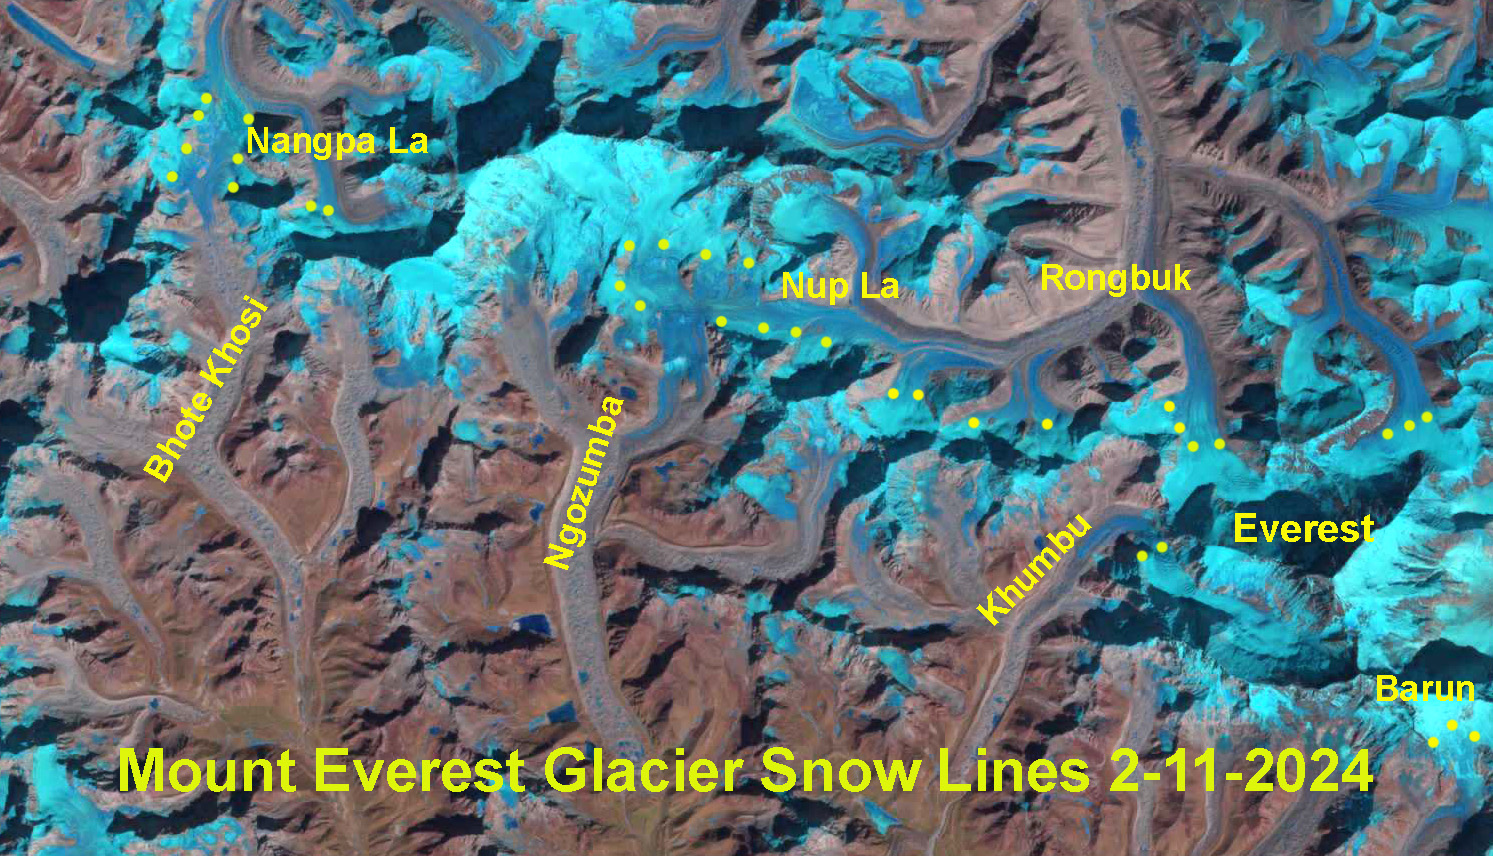
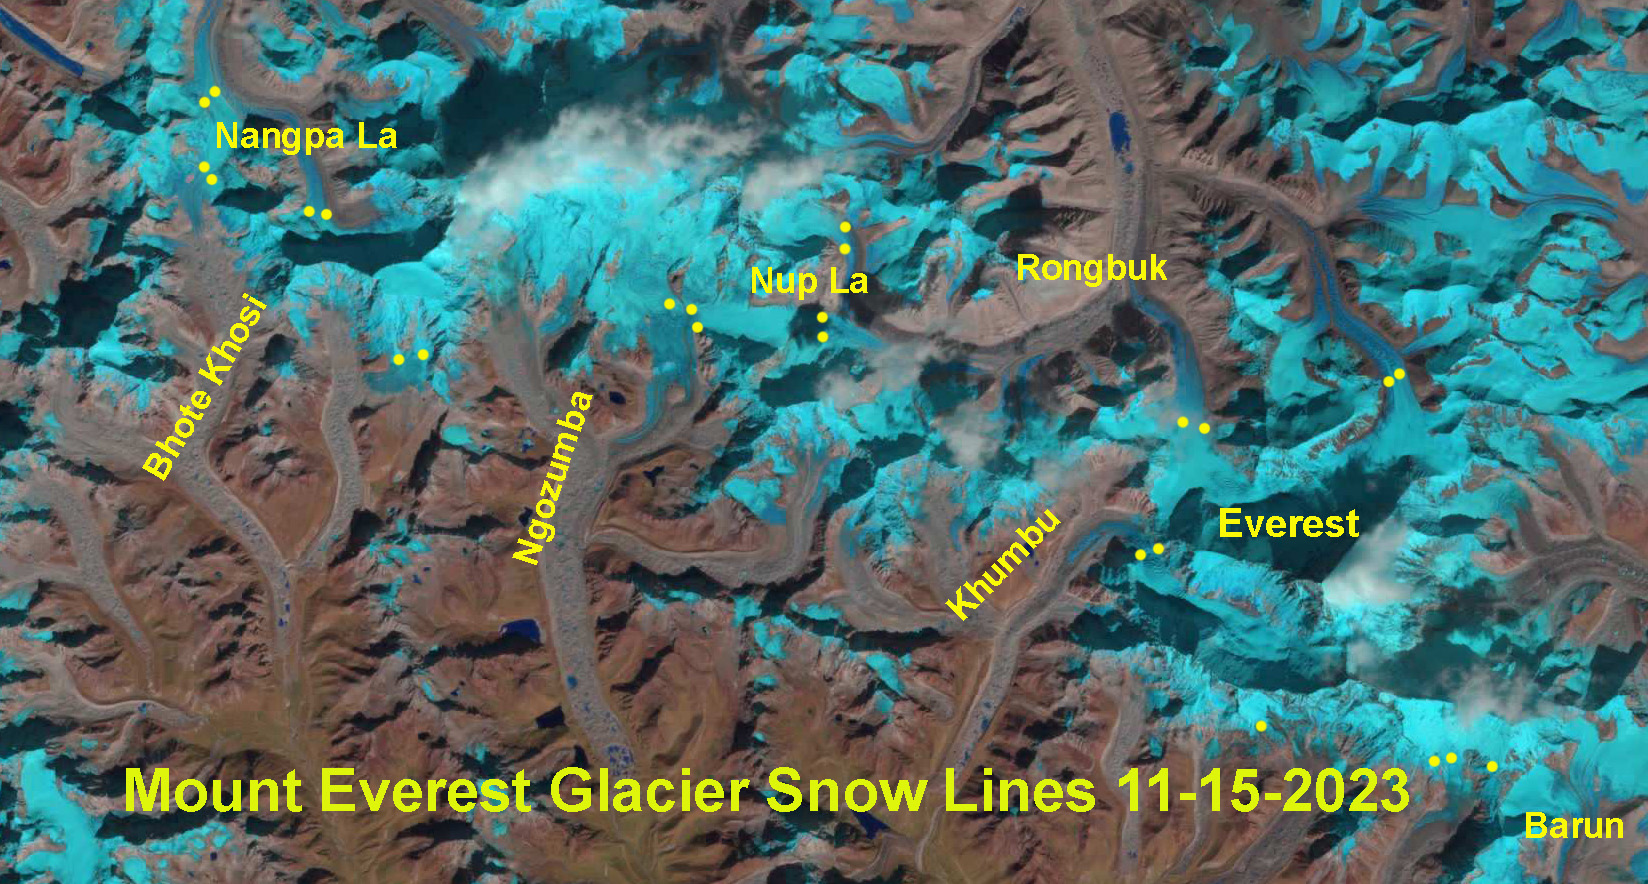
Mount Everest Region Snow Line Winter 2024: Rises Above and Remains Above 6000 m

The snow line on Mount Everest Region glaciers on Feb. 11, 2024 indicated by yellow dots on the Landsat image. Note that Nangpa La and Nup La-two high passes (5800-5900 m) are both snow free. The average snow line is 6000 m.

The snow line on Mount Everest Region glaciers on Oct. 30, 2023 indicated by yellow dots on the Landsat image. Note that Nangpa La and Nup La-two high passes are both snow covered. The average snow line is 5700 m.
The snow line on Mount Everest Region glaciers on Nov. 15, 2023 indicated by yellow dots on the Landsat image. Note that Nangpa La and Nup La-two high passes are both snow covered. The average snow line is 5800 m.
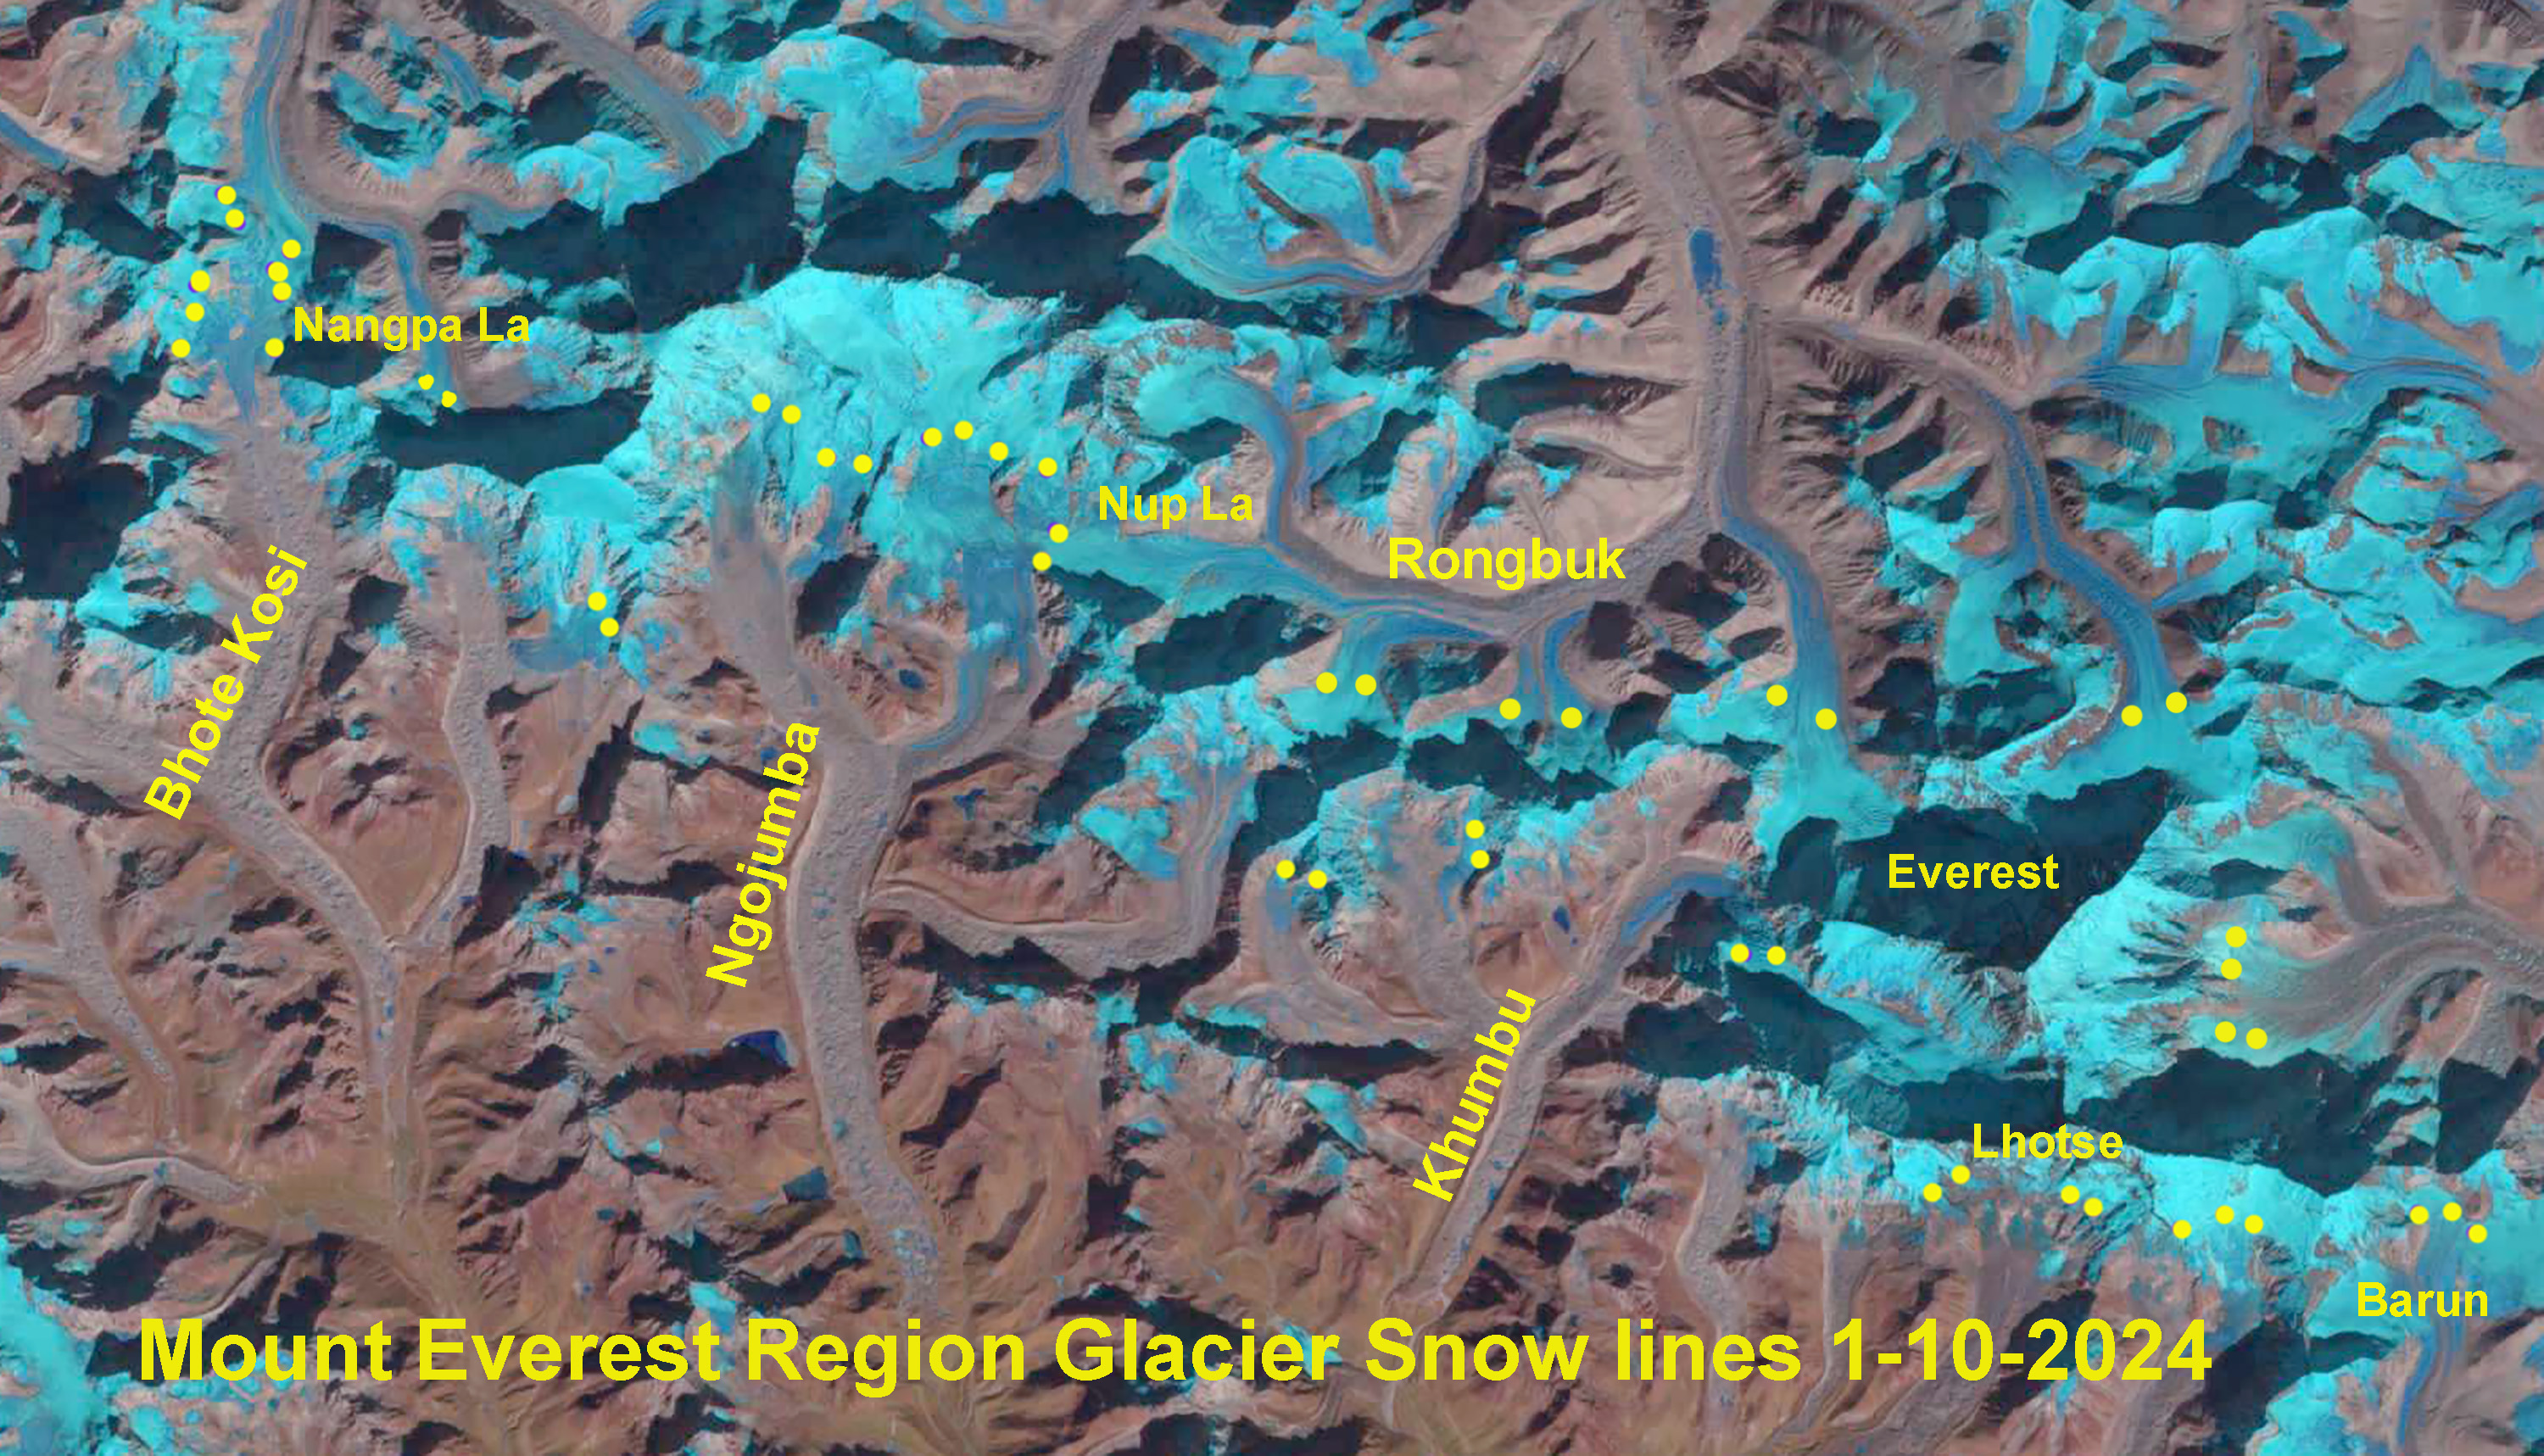
The snow line on Mount Everest Region glaciers on Jan. 10, 2024 indicated by yellow dots on the Landsat image. Note that Nangpa La and Nup La-two high passes are both snow free. The average snow line is 5950 m.
Cumulative precipitation through the year at Everest Base Camp. The typical dry period begins in October and extends into Februrary, but this year is the lowest since the National Geographic Rolex Perpetual Planet weather station was installed.

In several recent years including Winter 2017/18, 2020/21 and 2023/24 the snow line has risen substantially on Mount Everest glaciers from October into the mid-winter period (Pelto et al 2022).. This indicates not just dry conditions, but conditions that allow significant ablation at the snow line, which has risen 150-300 m during each of these periods on the glaciers. The ablation can be from melting or as the case this winter sublimation, which can lead to losses up to 2.5mm/day (Tenzing Chogyal Sherpa et al 2023). When will snow finely cover the glaciers in the Everest region?