How A Glacier Disappears- Lewis, Milk Lake and Colonial Glacier North Cascade Range?

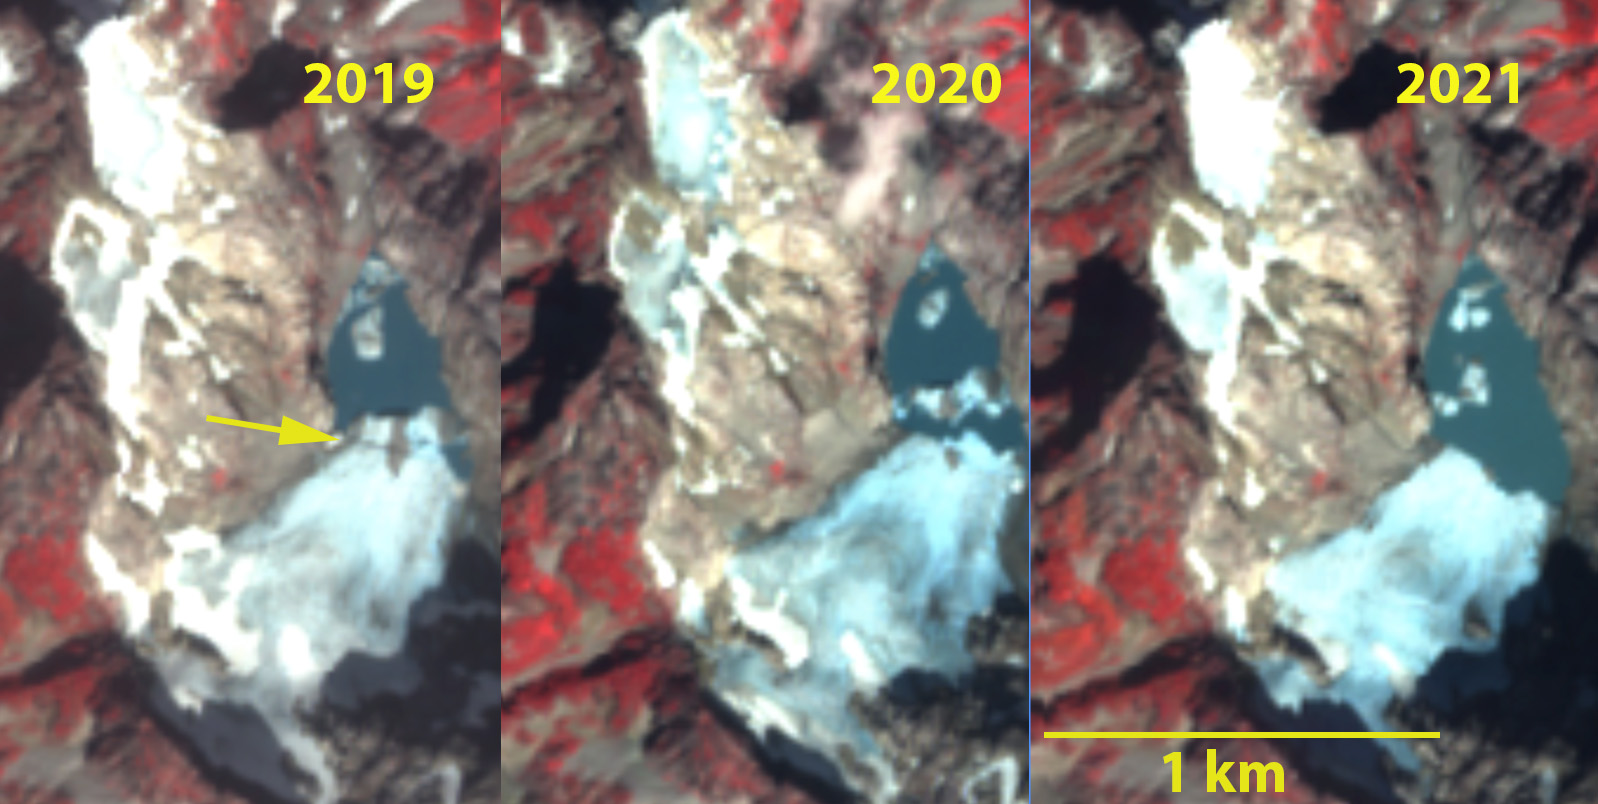
Colonial Glacier in late summer false color Sentinel 2 images from 2019, 2020 and 2021. Yellow arrow indicates step that calves in 2020. Notice the ~10% of snowcover (bright white) remaining on glacier surface with more melt to come.

An alpine glacier disappears when it no longer has a persistent accumulation zone (Pelto, 2010). When this occurs the glacier is typically limited in size, but still can have significant ice thickness that takes time to melt away.  Here we look at three glaciers I have worked on, where two disappeared and the third is disappearing in the North Cascade Range, Washington.

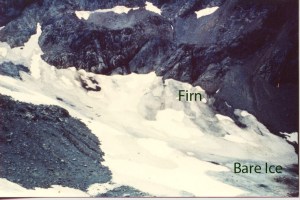
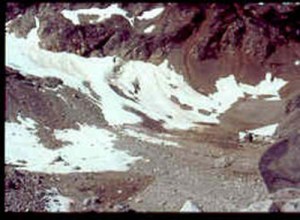
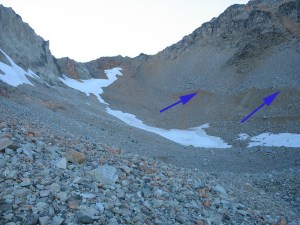
Lewis Glacier was a small cirque glacier in the drier part of the range, near Rainy Pass. In 1985 during my second visit to the Lewis Glacier, was the first time I confronted the idea of a glacier disappearing. We were able to peer down several crevasses and see the bottom of the Lewis Glacier, measurements indicated a maximum depth of 12 meters over an area the size of a football field/soccer pitch. This glacier had been selected for the North Cascade Glacier Climate Projects’s mass balance program assessing mass balance on 10 glaciers across the mountain range.  This size made it attractive to observe in terms of response to climate change. The USGS map indicated a significant glacier with an area of 0.12 km2 in the 1950’s.  By 1985 (top image) the glacier had lost half of its mapped area, there were still some significant blue ice areas, and areas of firn, snow several years old that is not yet glacier ice. Return visits each summer over the next few years chronicled the demise of the glacier. By 1988 (middle image) the glacier had shrunk dramatically even since 1985, the thickest ice measured was 5-6 meters. By 1990 the glacier was gone (bottom image), no blue ice left in the basin, the blue arrows indicate the lateral moraine above the now empty glacier basin. At the time I had not developed the model for forecasting glacier survival (Pelto, 2010). At bottom is 2021 image of the cirque basin with no glacier.

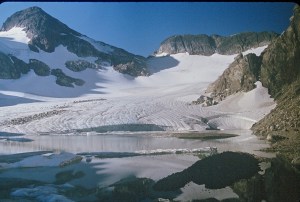
Milk Lake Glacier was a small glacier on the north flank of Glacier Peak in the North Cascades, Washington. The flat topography over the lake indicated a very thin unstable glacier area. In the USGS map for Glacier Peak in the  based on 1979 aerial photographs, Milk Lake Glacier fills most of the Milk Lake Basin, had an area of 0.24 km2 with just a fringe of lake visible.  Thw flat topography indicates the thin unstable nature of this part of the glacier. By 1988, Milk Lake had formed, a notably circular new alpine lake, the former glacier ice still filled part of the lake as ice bergs. The glacier had retreated to the margins of the lake fringing the west side of the lake. The fringing ice was clearly thin, we found several crevasses that reached bedrock 5-10 m down. In 1994 on a return visit in miserable weather (camera got too wet to function), there was no longer any icebergs in the lake and the lake was more of a jade to turquoise color. The fringing ice had lost about half of its area since 1988. This glacier remnant was not going to last long. By the end of 2005 the glacier had disappeared. The lake retains a beautiful jade color that will slowly become more azure as glacier flour settles. In 2021, see image bottom, the basin does not look like a recently glaciated basin.

Colonial Glacier is a cirque glacier in the Skagit River Watershed, North Cascades of Washington. The North Cascade Glacier Climate Project has made six visits to this glacier since 1985. Meltwater from this glacier enters Diablo Lake above Diablo Dam and then flows through Gorge Lake and Gorge Dam. These two Seattle City Light hydropower projects yield 360 MW of power. In 1979 the glacier was clearly thinning, having a concave shape in the lower cirque, but still filled its cirque, there is no evidence of a lake in this image from Austin Post (USGS).  In 1985 my first visit to the glacier there was no lake at the terminus. We measured the glacier area at 0.92 km2. In 1991 the lake had begun to form, second image, but was less than 30 m across. The upper glacier was a smooth expanse of snow. By 1996 the lake was evident, and was 75 meters across. In 2001 the lake had expanded to a length of 125 meters. By 2006 the lake was 215 m in length, and had some thin icebergs broken off from the glacier front. From 2019-2021 a series of late summer Sentinel 2 images indicate the lack of retained snowcover necessary for survival. In 2019 15% of the glacier is snowcovered with three weeks left in the melt season. The terminus is just below a step in the glacier surface. In 2020 there is only 10% snowcover with two weeks left in the melt season.  The portion of the glacier below the step has calved off and is now an iceberg in the lake. In 2021 the exceptional June heat wave took its toll and by the end of August the glacier only has 10% retained snowcover. The glacier area in 2021 is 0.26 km2, a 70% decline in area.  The glacier has retreated 440 m and now is 520 m long. The lake has an area of  0.1 km2. The continued losses of Colonial Glacier are not being replenished by snowfall, this business model can only lead to the glacier disappearing. Colonial Glacier still has substantial area and thickness that will allow it to survive for a couple more decades. The continued loss of glacier area from Colonial and all other glaciers in the region reduce the mitigating affect of enhanced summer streamflow due to higher glacier runoff during warm dry periods.

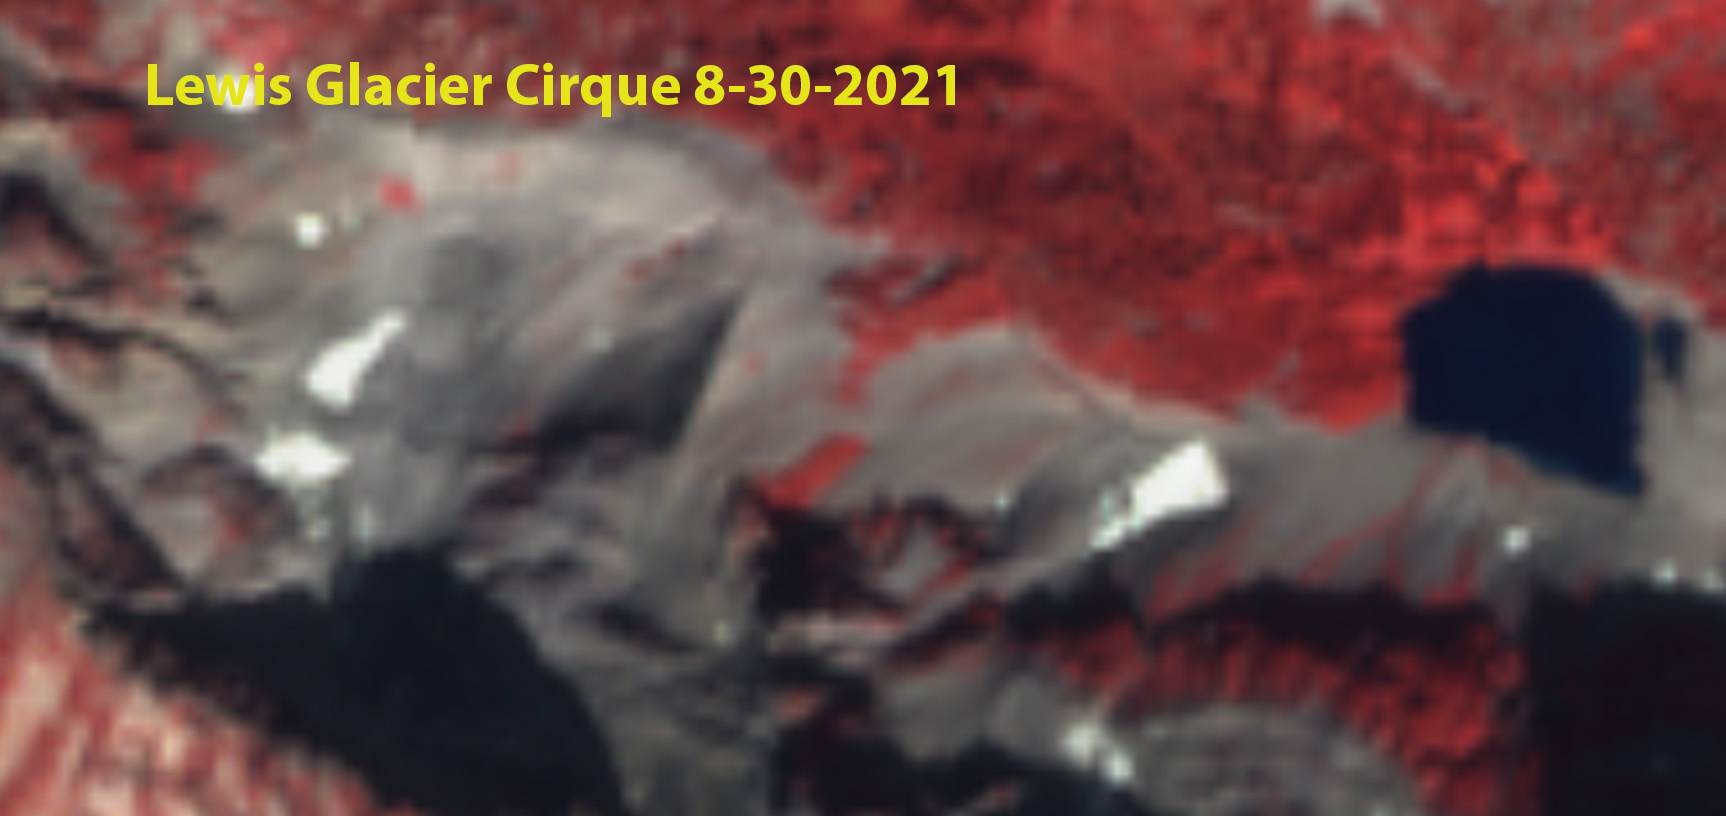
Lewis Glacier cirque in Sentinel 2 image from 2021, Lewis Lake is lower right.

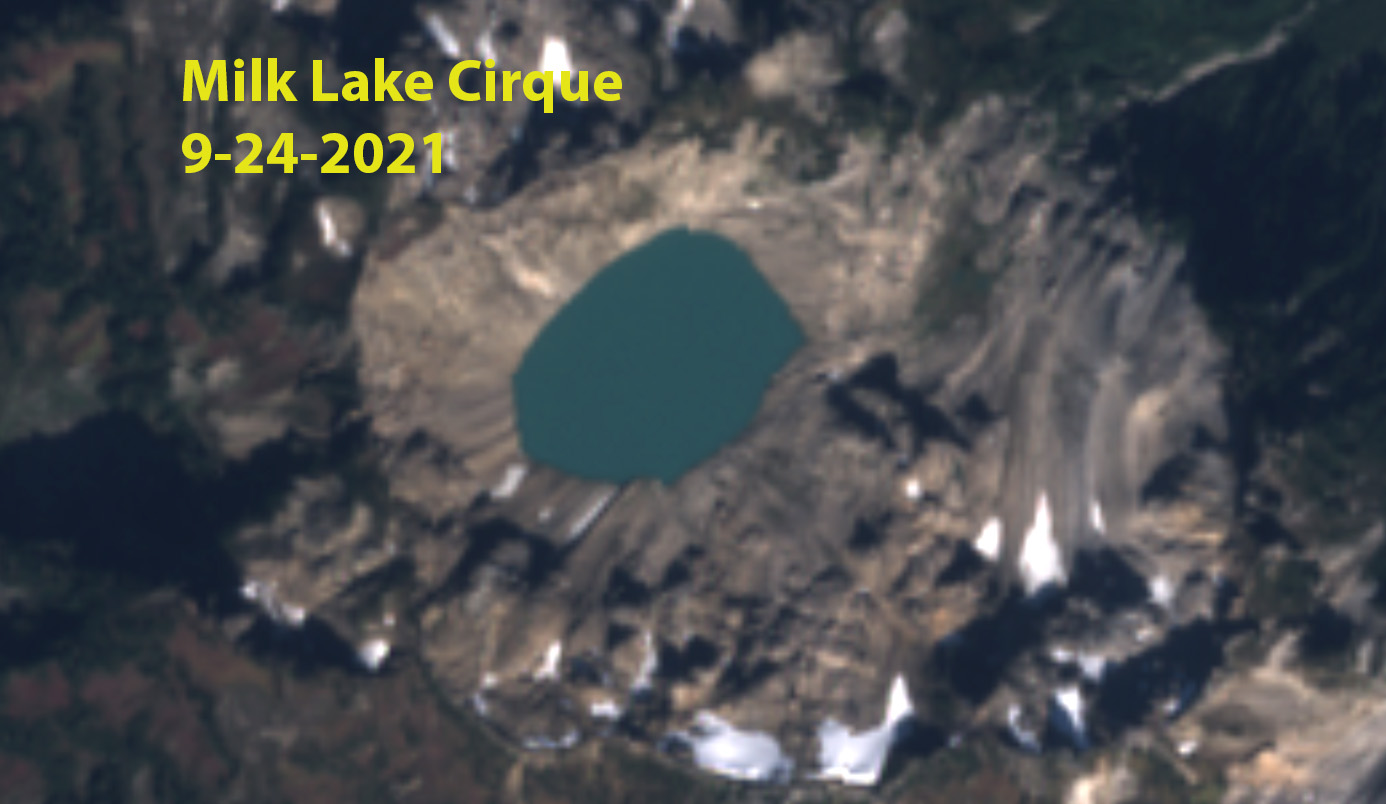
Milk Lake cirque in 2021, looking like a basin that was not recently glaciated.


North Cascade Glacier Climate Project Observations 2020, 37th Field Season

The North Cascade Glacier Climate Project 2020 field season was our 37th consecutive year of glacier observations.  The field team consisted of Cal Waichler, Mariama Dryak, Jill Pelto and Mauri Pelto.  Each team member has studied glaciers on more than one continent and is passionate about science communication, using either art, videography or writing.

Mauri Pelto, Jill Pelto, Cal Waichler and Mariama Dryak from left to right on Easton Glacier the 2020 field team (Jill Pelto Photograph).

At Columbia Glacier the field team  was joined by Michelle Tanz a Wlderness Stewardship Fellow for the National Forest Service.  The initial observation was that the 2 km bushwhack around Blanca Lake has gotten much brushier as the alpine meadow becomes more sub-alpine. Columbia Glacier is a low elevation avalanche fed glacier that developed a new lake at its terminus a decade ago that continues to expand.  The east side of the glacier has been thinning much faster than the west side altering the very shape of the glacier.  Observed snowpack in 2020 was below average except for on the slopes of the main west side avalanche fans. The upper basin at 1550-1650 m averaged 2.2 m of snowpack at the 70 probing locations, which is 70% of normal.  This snowpack will not survive the melt season, only snowpack in the main avalanche fans will remain. Terminus retreat has been 217 m since our first observation in 1984.

Lower Curtis Glacier is fed by avalanches from the slopes of Mt. Shuskan.  We were joined in the field by Tom Hammond for the 17th consecutive year and artist Claire Giordano.  There was a similar pattern to Columbia Glacier in that snowpack across most of the glacier was below average, while the primary avalanche fan on the east side had above average snowpack.  The avalanche fans on the central headwall of the glacier fed from the Upper Curtis Glacier continue to thin rapdily, as avalanching has declined.  The terminus slope which had been a daunting 42 degrees in 2015 is now 34 degrees. For the sixteenth consecutive year we had at least one artist in the field, below are field sketches from Cal Waichler and Jill Pelto and a painting from Claire Giordano.  We will be combining the science findings and art in forthcoming articles on Lower Curtis and Easton Glacier.

Claire Giordano working on painting of Lower Curits Glacier and Mt. Shusksan (Mariama Dryak Photograph).

Jill Pelto completes sketch, while sitting on ice chunk, of Easton Glacier icefall (Mariama Dryak Photograph).

Cal Waichler annotated story board style sketches both capture and explain the scene at Columbia Glacier (Mariama Dryak Photograph).

Rainbow Glacier has a terminus that is largely buried by avalanches, but is now is close to detaching from the main valley glacier.  Snowpack at 1700 m averaged 2.4 m which is 75% of average. The saddle with Mazama glacier at 2000-2100 m averaged 3.9 m, which is 85% of normal. Subglacial bedrock knobs continue to become more prominent in expanding crevassing above and slope below the slope change, as the glacier thins.

Sholes Glacier had the highest percentage of surface blue ice of the glaciers observed.  Snowpack had been reduced from at a rate of 8 cm/day during the first week of August, a relatively warm period. A snow cave at the terminus could be entered from a terminus crevasse that was 50 m long, 10 m wide and 2-5 m high.  This is indicative of a relatively stagnant rapidly retreating terminus. From 2014-2020 the glacier has retreated 80 m, which is equivalent to the retreat from 1990-2014. Glacier runoff continues to be monitored just below the glacier by the Nooksack Tribe, while we provide continued rating curve development.  Runoff during early August was averaging 0.25 m3/sec.

On Easton Glacier the terminus slope was the gentlest we had seen in our 31 years of consecutive observations.  The terminus has retreated 430 m in this period. The significant thinning in the last few years had both reduced crevassing in the lowest icefall, but had reduced crevasse depth.  Jill Pelto has been observing the crevasses depth in all the open crevasses in this icefall over the last decade.  The biggest change has been from 2018-2020 with average depth being reduced by 40%. Snowpack on the bench at 2000 m averaged 2.4 m at the 45 observation sites, which is 75% of normal.  The snowpack remained below normal at 2200 m, before a sharp increase to above normal snowpack averageing 5.1 m in 14 crevasse observations at ~2500 m. At this same elevation retained snowpack, now firn from previous years averaged 2.25 m. Based on the storm stratigraphy one significant difference was the result of an atmospheric river precipitation event of 12+ cm of precipitation from 1/31-2/2, that led to a snow depth and snow water equivalent decline at the Middle Fork Nooksack Snotel at 1550 m, while above 2300 m this all fell as snow.  The freezing levels were above 2000 m for much of the event.  The better high elevation snowpack will help Easton Glacier’s mass balance in 2020.

Easton Camp from adjacent to 1990 terminus position (Jill Pelto Photograph).

Crevasse stratigraphy at 2500 m on Easton Glacier indicates an average of 5.1 m of 2020 snowpack in crevasses and 2.25 m for previous annual layers from the 2016-2019 period (Mauri Pelto and Jill Pelto Photographs)


NORTH CASCADE GLACIER CLIMATE PROJECT 2020-37th Annual Field Program

Field season images from 2019 indicating crevasse stratigraphy, annotated by Clara Deck.

Director: Mauri S. Pelto, mspelto@nichols.edu-Nichols College

Field Artist & Scientist: Jill Pelto, pelto.jill@gmail.com

Who we are? NCGCP was founded in 1983 to identify the response of North Cascade glaciers to regional climate change, particularly changes in mass balance, glacier runoff and terminus behavior.   NCGCP is a field project that has a broader interdisciplinary scope and examines more glaciers than any other program in North America.  It does so cost effectively relying on no permanent camps, helicopter support or salaries for the director. The field season includes no days off and each day is spent completing measurements on glaciers.  The focus is on glacier mapping, mass balance measurement, terminus observations and glacier runoff monitoring.  This program monitors two of the World Glacier Monitoring Service’s reference glaciers. There are ~45 such glaciers in the world with 30 years of continuous measurements. We complete mass balance and terminus observations on Columbia, Daniels, Easton, Ice Worm, Lower Curtis, Lynch, Rainbow and Sholes Glacier with runoff measurements below Sholes and Ice Worm.

Why study glaciers in the North Cascades? Glaciers are one of the world’s best climate monitors and are a critical water resource to many populated glaciated regions. This is particularly true in the North Cascades where 700 glaciers yield 200 billion gallons of summer runoff and glaciers have lost 30 % of their area in the last century.

Field Team 2020:

Jill Pelto is an artist and scientist from New England who grew up loving winter sports and trips to the mountains. She incorporates scientific research and data into paintings and prints to communicate environmental changes. Her multi-disciplinary work weaves visual narratives that reveal the reality of human impacts on this planet, as earlier in July was illustrated on the cover of TIME. She completed both her B.A. degrees in Studio Art and Earth and Climate Sciences and her M.S. focused on studying the stability of the Antarctic Ice Sheet at the University of Maine, spending two field seasons at a remote camp in the southern Transantarctic Mountains. Jill will be joining the project for her 12th field season. She is excited about continuing to document the change in North Cascade glaciers that she has witnessed each of the last ten years — through science and art.

Mauri Pelto has directed the project since its founding in 1984, spending more than 700 nights camped out adjacent to these glaciers. He is the United States representative to the World Glacier Monitoring Service, author of the AGU blog “From a Glacier’s Perspective”, and on the Science Advisory Board for NASA’s Earth Observatory.  His primary job is Dean of Academic Affairs at Nichols College, where he has been a professor since 1989.

Cal Waichler is an environmental science major at Colby College in Maine and is from Winthrop, WA. She looks to bridge the gap between science and the public by creating impactful, accurate climate art and storytelling. This summer’s research goal is to generate building blocks to contextualize her work within two fields: glacier science and climate communication.

Mariama Dryak (she/her) is an earth scientist, science communicator/writer and an advocate for action on creating solutions to the global climate crisis. Mariama is the creator and editor of an environmental advocacy blog Let’s Do Something BIG. and the ‘we persist.’ podcast, which shares the stories of underrepresented people in the earth, ocean and environmental sciences. Mariama received her Master’s from the University of Maine in 2019 in Earth and Climate Science, during which she drew connections between inferred ocean conditions and glacier change along the Antarctic Peninsula. Mariama can most often be found chatting science, going on adventures or getting muddy whilst doing something outdoors.

Columbia Glacier terminus with the 2018 field team.

 Field Partners 2020

Victoria Jarvis and Michelle Tanz are Wilderness Stewardship Fellows who will be gathering information about the Henry M Jackson Wilderness including the glacier. They are looking to understand the Columbia Glacier and our research within the scope of the 5 qualities of wilderness character (untrammeled, undeveloped, natural, solitude and primitive rec, other). They will then be able to incorporate our long-term monitoring efforts into their wilderness character narrative– a synthesized agency document providing insight about the wilderness.

Alia Khan, Western Washington University Cryosphere Studies and Aquatic Biochemistry Lab:

The research team including grad students Molly Peek and Shannon Healy focus on environmental chemistry in the cryosphere, including black carbon and snow algae to document global change of glacier and snow melt in mountainous and polar regions.

Tom Hammond, North Cascade Conservation Council,Will be joining us for the 17th year leveraging his experience with our for understanding the ongoing impact of climate change and our stewardship on the region.

Nooksack Indian Tribe, for the 9th consecutive year we will be conducting field work aimed at providing field validation and streamflow calibration data below Sholes Glacier for the ongoing work of the tribe.

Measuring flow below Sholes Glacier

North Cascade Glacier Climate Project 2019, 36th Annual Assessment


The summer of 2019 found the North Cascade Glacier Climate Project in the field for the 36th consecutive summer monitoring the response of North Cascade glaciers to climate change.  This long term monitoring program was initiated partly in response to a challenge in 1983 from Stephen Schneider to begin monitoring glacier systems before and as climate change became a dominant variable in their behavior.

The field team was comprised of Clara Deck, Ann Hill, Abby Hudak, Jill Pelto and myself.  All of us have worked on other glaciers. The bottom line for 2019 is the shocking loss of glacier volume. Ann Hill, UMaine grad student observed, that “Despite having experience studying glaciers in southeast Alaska and in Svalbard, I was shocked by the amount of thinning each glacier has endured through the last two and a half decades.”  Glaciers are typically noted as powerful moving inexorably.  Clara Deck, UMaine MS graduate, was struck by “the beauty and fragility of the alpine environment and glaciers.”  Fragile indeed in the face of climate change. Abby Hudak, Washington State grad student, looked at both the glacier and biologic communities as under stress, but glaciers cannot migrate, adapt or alter there DNA.

Over the span of 16 days in the field, every night spent in the backcountry adjacent to a glacier, we examined 10 glaciers in detail. All glaciers are accessed by backpacking.  The measurements completed add to the now 36 year long data base, that indicate a ~30% volume loss of these glaciers during that period (Pelto, 2018). Here we review preliminary results from each glacier. Each glacier will have a mass balance loss of  1.5 -2.25 m, which drives continued retreat.  Columbia and Rainbow Glacier are reference glaciers for the World Glacier Monitoring Service, with Easton Glacier joining the ranks later this year. Below and above is the visual summary. Specific mass balance and retreat data will be published here and with WGMS after October 1.

Easton Glacier, Mount Baker.  Terminus has become thin and uncrevassed as a rapid retreat of 15 m per year continued, 405 m retreat since 1990.

Easton Glacier icefall at 2200 m typically has 1.8 m w.e. at the end of the summer, this year it will be 0 m. The overall mass balance will be ~2 m of loss.

Deming Glacier, Mount Baker has now receded over 700 m since our first visit 35 years ago.

On Lower Curtis Glacier a key accumulation source the NE couloir now shows bedrock. Overall by summers end ~25% of the glacier will retain snowcover, far short of what is needed to maintain its volume.

The Lower Curtis Glacier terminus continues to retreat at 8 m/year, but thinning and slope reduction has been more notable.  

In early August the majority of Sholes Glacier has lost its snowpack.  The thin nature of the terminus indicates the glacier is poised for continued rapid retreat that has exceeded 15 m per year during the last 7 years.

Runoff assessment confirmed ablation stake measurement of 11 cm of ablation/day from 8/6-8/8 on Sholes Glacier.

High on Rainbow Glacier there are still plenty of regions lacking snowcover, instead of a thick mantle of snowpack.

Rainbow Glacier was awash in meltwater streams, see video.  This area should have 1 m of snowpack left. Rainbow Glacier has retreated 650 m since 1984.

Just getting to each glacier does involve overcoming various miseries.

A transect across lower Coleman Glacier, Mount Baker indicates 38 m of thinning since 1988.

Limited snowpack remaining on Columbia Glacier, with six weeks of melt left. Lake in foreground expanded dramatically in last two years.  Retreat ~45 m from 2017-2019 and 210 m from 1984-2019, more than 10% of its length.

Upper basin of Columbia Glacier mainly bare of retained snowpack.

Ice Worm Glacier terminates in expanding lake.

Ice Worm Glacier continues to retreat at the top and bottom of the glacier.  Mass loss is leading to a more concave shape each year.

Daniels Glacier had a maximum snowpack of 1.75 m, instead of 4 m.

Foss Glacier measurements discontinued as it disintegrates, only 20% snowcover in mid-August.

Lynch Glacier less than 50% snowcovered with six weeks of melt left.


The team which completed over 1200 mass balance measurements, 40,000 vertical feet and 110 miles of travel across glacier clad mountains.


North Cascade 2019 Winter Accumulation Assessment

April 1 winter accumulation at the longer term North Cascade SNOTEL stations (Fish Lake, Lyman Lake, Park Creek, Rainy Pass, Stampede Pass and Stevens Pass).

For North Cascade glaciers the accumulation season provides that layer of snow, that must then last through the melt season.  A thin layer sets the glaciers up for a mass balance loss, much like a bear with a limited fat layer would lose more mass than ideal during hibernation. The 2019 winter season in the North Cascade Range, Washington has been unusual.  On April 1 the retained snow water equivalent in snowpack across the range at the six long SNOTEL sites is 0.72 m, which is ~70% of average.  This is the fifth lowest since 1984.  The unusual part is that freezing levels were well above normal in January, in the 95% percentile at 1532 m, then were the lowest level, 372 m of any February since the freezing level record began in 1948.  March returned to above normal freezing levels.  As is typical periods of cold weather in the regios are associated with reduced snowfall in the mountains and more snowfall at low elevations.  In the Seattle metropolitan area February was the snowiest month in 50 years, 0.51 m of snow fell, but in the North Cascades snowfall in the month was well below average. From Feb. 1 to April 1, snowpack SWE at Lyman Lake, the SNOTEL site closest to a North Cascade glacier, usually increases from 0.99 m to 1.47 m, this year SWE increased from 0.83 m to 1.01 m during this period.

The Mount Baker ski area snow measurement site has the world record for most snowfall in a season 1140 inches (28.96 m) during the 1998/99 snow season.  The average snowfall is 633 inches (16.07 m) with snowfall this year as of April 15th at 533 inches (13.53 m).  Below is a Landsat image from April 15, 2019 indicating the snowline at ~1000 m in the Nooksack River Valley and 900-1000 m in the Baker Lake valley.

This year for the 36th consecutive year the North Cascade Glacier Climate Project will be in the field measuring North Cascade glaciers, the early signs point towards a seventh consecutive negative balance year.

Freezing levels at Mount Baker, WA from the North American Freezing Level Tracker. February lowest mean freezing level since 1948.


Mount Baker Cloaked in winter snow in 4/15/2019 Landsat image MB=Mount Baker, MS=Mount Shuksan, NR=Nooksack River

35th Annual Field Season Monitoring North Cascade Glaciers Preliminary Assessment


We monitor the response of North Cascade glacier to climate change and the consequent impacts for water resources and the ecosystem, as illustrated here by Megan Pelto and Jill Pelto.

For the 35th consecutive year I headed to the North Cascade Range, Washington to monitor the response of glaciers to climate change. During the course of this study we  observed several of the glaciers we monitor disappear.  Two of the glaciers we monitor are now part of the 42 glaciers comprising the World Glacier Monitoring Service reference glacier network, where annual mass balance has been assessed for more than 30 years consecutively.

The 2018 winter season featured relatively normal snowpack despite a winter of wide temperature fluctuations, Feb freezing levels 400 m below the mean and December 500 m above the mean. Summer melt conditions featured a high freezing levels in May, normal freezing levels in June and high levels in July (NA Freezing Level tracker). The summer melt season through Aug. 20th has been exceptionally warm and dry, which has also helped foster forest fires. The melt rate during the August field season was 35% above normal.

We assessed the mass balance of eight glaciers.  All eight will have significant negative mass balances in 2018. Retreat was measured on six of the glaciers where the terminus was exposed, all had retreated since 2017.

Sholes Glacier Runoff Monitoring Location in early August 2018

This year the field team consisted of:

Mariama Dryak, UMaine graduate student quantifying iceberg melt rates and meltwater fluxes around the Antarctic Peninsula using satellite imagery.  She is the US national committee representative for the Association of Polar Early Career Scientists, co-chair of USAPECS and helps coordinate the USAPECS blog. Mariama is also the creator and editor of an environmental advocacy blog Let’s Do Something BIG., which highlights the need for effective science communication and the need for greater diversity in the earth sciences.

Erin McConnell, UMaine graduate student, who is studying ice core stable isotope records from the Eclipse Icefield, St. Elias Range, Yukon.She has written about the equal importance of communicating science and the science itself..

Jill Pelto, UMaine graduate student studying paleoclimate records recording past ice sheet changes in the Transantarctic Mountains and an artist, joining the field team for the 10th year. Her work has taken her to Antarctica, New Zealand and Falkland Islands and has been widely featured by Earth Issue,  The Smithsonian, and Edge Effects.

Mauri Pelto, Nichols College academic dean, World Glacier Monitoring Service Representative and director of the North Cascade Glacier Climate Project .  I am heading into the North Cascades for the 35th year. The results will from this year will be promptly published with the AGU From a Glaciers Perspective Blog and the North Cascade web site.  A video encapsulation of the field year will also be developed as in past years. Putting the long term record in perspective was the 2018 Water publication on the long term mass balance record.

Observing snowpack thickness retained in August on Rainbow Glacier

Mapping terminus of Lower Curtis Glacier

Terminus of Columbia Glacier with evident forest fire smoke haze.

Easton Glacier Icefall at 2500 m, indicating a typical 2.25 m thick accumulation layer.

How Unusual Was 2015 in the 1984–2015 Period of the North Cascade Glacier Annual Mass Balance?

Sholes Glacier during the first week of August 2015 versus and average year such as in 2017.  Note stream gage and weather station at this site. The greater extent of bare ice enhances ablation as for a given temperature there is a higher ablation rate for ice then snow. Columbia Glacier a WGMS reference glacier viewed from above the glacier at Monte Cristo Pass at the start of August in 2015 and 2016.  Note the lack of retained snow in 2015 and the multiple firn layers exposed. 

This post is a shortened version of the publication out this week in Water.

In 1983, the North Cascade Glacier Climate Project (NCGCP) began the annual monitoring of the mass balance on 10 glaciers throughout the Washington mountain range, in order to identify their response to climate change. Annual mass balance (Ba) measurements have continued on seven original glaciers, with an additional two glaciers being added in 1990. The measurements were discontinued on two glaciers that  disappeared and one was that separated into several sections. This comparatively long record from nine glaciers in one region, using the same methods, offers some useful comparative data in order to place the impact of the regional climate warmth of 2015 in perspective.  This led to the most negative annual balance of the last 26 years on every glacier.

2015 Climate

The 2015 winter accumulation season featured 51% of the mean (1984–2014) winter snow accumulation at six long-term USDA SNOTEL stations in the North Cascades, namely, Fish Creek, Lyman Lake, Park Creek, Rainy Pass, Stevens Pass, and Stampede Pass. This was exceptional as it was the second lowest out of the 32 years of the mass balance observation series. The winter season was exceptional for warmth, being the warmest winter season on record in the state of Washington. The freezing level in 2015 averaged 1645 m in the Mount Baker region from November–March, compared with an average of 1077 m (John Abatzoglou, Freezing Level Tracker). The previous record for the mean November–March freezing level, since the record began in 1948, was 1500 m.

Freezing Level November-March on Mount Baker, WA from Freezing Level Tracker 1948-2017.

In 2015, the mean May–September temperature at Diablo Dam was 2.2 °C warmer than the long term mean, and it was the second warmest to 1958 in the 1950–2015 record. For June–September, the mean temperature was 2.0 °C warmer than the long term mean, and was also second to 1958 as the warmest. The combination of the warmest melt season in over 50 years and the second lowest accumulation season snowpack in the last 30 years was a good indication that the glacier mass balance would be quite negative.
In 2015, the sea surface temperature waters that had developed in the winter of 2013/14, persisted off the coast of the Pacific Northwest, with anomalies generally exceeding 2 °C (Di Lorenzo and Mantua, 2016)

Glacier Mass Balance 2015

The mean annual balance of the NCGCP glaciers is reported to the World Glacier Monitoring Service (WGMS), with two glaciers, Columbia and Rainbow Glacier, being reference glaciers.  The mean Ba of the NCGCP glaciers from 1984 to 2015, was −0.54 m w.e.a−1 (water equivalent per year), ranging from −0.44 to −0.67 m w.e.a−1 for individual glaciers. In 2015, the mean Ba of nine North Cascade glaciers was −3.10 m w.e., the most negative result in the 32-year record. The correlation coefficient of Ba was above 0.80 between all North Cascade glaciers, indicating that the response was regional and not controlled by local factors. In 2015, out of the nine glaciers where the Ba was examined, the AAR was 0.00 on seven of the glaciers, 0.05 on the Rainbow Glacier, and 0.26 on the Easton Glacier. For each glacier, the 2015 Ba was the most negative of any year in their entire record. The South Cascade Glacier had a negative mass balance of −2.72 m w.e. in 2015, which was the most negative Ba reported since the suite of continuous mass balance measurements began in 1959 [USGS, 2017].  The probability of achieving the observed 2015 Ba of −3.10 is 0.34%.

 
Annual mass balance of North Cascade glaciers, note the similar annual response indicating regional climate conditions are the overriding driver of mass balance. 

On June 15, when the automatic weather station and discharge station were installed adjacent to the Sholes Glacier, the snowpack was similar to a typical early August snow cover. On the Sholes Glacier, the AAR fell from 0.55 on 9 July to 0.00 on 9 September. This was the first year since the monitoring had begun in 1984 that the mean AAR in early August was below 0.25. The result was an exposure of the older firn layers and a general decrease in albedo. In early August, the AAR was below 0.1 for all of the glaciers, except for the Easton Glacier. On the Columbia Glacier, the AAR on August 1 was the lowest observed yet at 0.12, with six weeks remaining in the melt season. The early exposure of glacier ice was important as the melt rate was faster, as was indicated by the greater melt factor.  The North Cascade mass balance cumulatively over the last 30 years matches closely the global mean mass balance loss.

Map of North Cascade glaciers observed in this study. 

Comparison of North Cascade cumulative and Global cumulative glacier mass balance


Thirty-third Annual North Cascade Glacier Climate Project Field Season Underway

fig8-1
Base Map of the region showing main study glaciers, produced by Ben Pelto.

From President Reagan to President Obama each August since 1984 I have headed to the North Cascade Range of Washington to measure the response of glaciers to climate change.  Specifically we will measure the mass balance of nine glaciers, runoff from three glaciers and map the terminus change on 12 glaciers. The data is reported to the World Glacier Monitoring Service.  Three glaciers that we have monitored annually have disappeared since 1984.

In 2016 for Mount Baker, Washington the freezing level from January-April was not as high as the record from 2015, but still was 400 m above the long term mean. The snowpack on June 1st was three weeks behind last year’s record melt, but still three to four weeks of head of normal. July has been exceptionally cool reducing this gap. With all the snow measurement stations losing snowcover by July 1, the gap is uncertain until we arrive on the glaciers. This will not be a good year, but will be a significant improvement over last year, likely more in the 2012 or 2013 category.  Each location is accessed by backpacking in and camping in tents.

We will first travel north to Mount Baker and the Easton Glacier, we will be joined by Oliver Lazenby, Point Roberts Press.  We will then circle to the north side where I expect we will be joined by Jezra Beaulieu and Oliver Grah, Nooksack Indian Tribe.  Jen Lennon from the Sauk-Suiattle Tribe and Pete Durr, Mount Baker Ski Patrol are also planning to join us here.   When we head into Columbia Glacier Taryn Black from U of Washington will join us. The field team consists of Mauri Pelto, 33rd year, Jill Pelto, UMaine for the 8th year, Megan Pelto, 2nd year, and Andrew Hollyday, Middlebury College.  Tom Hammond, 13th year will join us for a selected period.

[ngg_images source=”galleries” container_ids=”38″ display_type=”photocrati-nextgen_basic_imagebrowser” ajax_pagination=”1″ template=”/nas/wp/www/sites/blogsorg/wp-content/plugins/nextgen-gallery/products/photocrati_nextgen/modules/ngglegacy/view/imagebrowser-caption.php” order_by=”sortorder” order_direction=”ASC” returns=”included” maximum_entity_count=”500″]

Aug.   1:  Hike into Easton Glacier.
Aug.   2:  Easton Glacier
Aug.   3:  Easton Glacier
Aug.   4:  Hike Out Easton Glacier, Hike in Ptarmigan Ridge
Aug.   5:  Sholes Glacier
Aug.   6:  Rainbow Glacier
Aug.   7:  Sholes Glacier and/or Rainbow Glacier
Aug.   8:  Hike out and into Lower Curtis Glacier
Aug.   9:  Lower Curtis Glacier
Aug. 10: Hike out Lower Curtis Glacier- Hike in Blanca Lake Mail Pickup Maple Falls, WA 98266
Aug. 11:  Hike in Columbia Glacier
Aug. 12:  Columbia Glacier
Aug. 13:  Hike out Columbia Glacier; Hike in Mount Daniels
Aug. 14:  Daniels and Lynch Glacier
Aug. 15:  Ice Worm Glacier
Aug. 16:  Ice Worm Glacier, Hike out Mount Daniels-Hike out

North Cascade Glacier Climate Project 2014 Field Season (31st Annual) Preliminary Results

The 2014 Glacier Field season was our 31st consecutive year working on North Cascade glaciers. After a late winter surge of snowfall, the North Cascades had a slightly above average snowpack as the melt season began in early May. The warm, dry summer to date, could end up being the warmest for the region, currently 2013 was the warmest melt season. The result is glacier melt has been high overall. In the field we measured the mass balance, terminus position, surface elevation and runoff from North Cascade glaciers. This includes assessment of annual retained snow layer thickness in crevasses and overall crevasse depth.

We first examined the Easton Glacier on the south side of Mount Baker, which has now retreated 370 m since 1990. The glacier has retreated 55 m in the last two years. The most interesting change is that the western toe of the glacier has receded beyond its normal drainage channel, and there is no outlet stream from the west side of the glacier. Snowpack below 2100 m was much below normal including on the bench at 1900 m below the main icefall. Above this main icefall snowpack was closer to normal. Snowpack average 4.5 m at 2500 m, assessed in numerous crevasses. The ongoing warm conditions will continue to reduce the snowpack more than the average summer. With typical late summer conditions mass balance will be -1.1 m on Easton Glacier. The Deming Glacier debris cover has now spread across the entire terminus, retreat from 1985 to 2014 is 480 m. The snowline was at 2075 m in early August in the main icefall, which is 100 m higher than normal.
breakfast
Breakfast at camp below Easton Glacier

crevase depth
Jill Pelto assessing the depth of crevasses on Easton Glacier, her sixth year working on glaciers.

crevasse examination
Determination of annual retained snowpack depth using crevasse stratigraphy.

crevasse measure
More snowpack assessment by Ben Pelto and Justin Wright.

ashley
Ashley Edwards descending Easton Glacier lower icefall

melviewMelanie Gajewski visually examining the Easton Glacier profile.

icefall panorama
Mauri Pelto on a serac in Easton Glacier icefall, 31st year working on these glaciers.

The next stop was Helitrope Glacier on the north side of Mount Baker, where we installed of a stream gage below the Heliotrope Glacier. Oliver Grah and Jezra Beaulieu of the Nooksack Indian Tribe installed the gage while we calibrated runoff and assessed the amount of snowcover on the Heliotrope Glacier, the western extension of the Coleman Glacier, and installed ablation stakes. The rise in the snowline over the rest of the summer will identify the ablation of snowcover. The maximum snowpack on Heliotrope Glacier was less than 3.5 m, which means almost the entire glacier will lose snowpack by the end of September up to the ridge above it. The daily runoff from the Roosevelt-Coleman-Heliotrope system during our observations was an impressive 14 million cubic feet per day.The snowline was quite high on Roosevelt Glacier and Coleman Glacier at 2000 m in mid-August. The retreat of Roosevelt in particular is impressive since my first visit in 1985, a retreat has been 450 m over this interval.
heliotrope camp2
Camp at Heliotrope Glacier.

coleman Justin Wright on the Coleman Glacier

helitrope gage
Oliver Grah installing stream gage below Heliotrope Glacier.jill probing Jill Pelto probing snowpack.

Continued warm dry weather led to records numbers of hikers at Artists Point as we headed out Ptarmigan Ridge on the northeast side of Mount Baker to work on Rainbow Glacier and Sholes Glacier. During our first day the east wind pushed forest fire smoke into the area eliminating views. We surveyed the mountain goat herds as usual seeing three herds and a total of more than 60 different goats. With the high temperatures and forest fire haze the number of iceworms emerging at sunset during our population count was also an all time low. Rainbow Glacier had snowpack that was 1.25 m below normal. With typical late summer conditions mass balance will be -1.5 m on Rainbow Glacier. Sholes Glacier already had 15% blue ice exposed, on August 7th. This had expanded to 25% by August 12th. This rapidly expanded to 50% by August 23rd, note Landsat comparison below. It will be 60% by the end of August and then likely close to 80% loss by the end of the summer. With typical late summer conditions mass balance will be -1.6 m on Sholes Glacier. Remember glaciers in this area need 60% snowcover at the end of the melt season to balance their frozen checkbook. On Sholes Glacier we completed 118 measurements of 2014 snowpack depth via probing in this relatively crevasse free glacier.
mountain goatsA herd of 48 mountain goats.

sholes probing snowpack
Snowpack probing on Sholes Glacier.

sholes overvieew 2014 Looking at Sholes Glacier from outlet where stream gage is installed.

sholes outlet
Sholes Glacier outlet with the clearer surface melt runoff versus the turbid basal meltwater stream.

ashley streamflowAshley Edwards measuring streamflow.

sholes landsat 2014
Landsat 8 iamges from 8/7/2014 and 8/23/2014-red line is boundary of bare blue glacier ice where the 2014 snowpack has been lost.

jill sketch Jill Pelto sketching in camp.

megan sketchMegan Pelto sketching in camp.

penstemon Jill’s field sketch of glacier runoff with Penstemon in foreground.

coffeepotMegan’s field sketch of glacier input to rising sea level.

We then headed to Lower Curtis Glacier, on Shuksan where the rain gods had their turn. That night we had one of the top three heaviest rainstorms I have experienced during my 31 years and 600+ nights camping in the North Cascades. Totals by morning exceeded 4 inches. Rain continued lightly during the day, making for a foggy day on the glacier. The avalanche danger was too high due to the warm temperatures even with the rain to survey the terminus. The main basin of the glacier had limited areas with snowpack over 2.8 m, which is how much is needed in mid-August to survive to the end of the melt season. With typical late summer conditions mass balance will be -1.1 m on Lower Curtis Glacier
The forecast of a one day rain event was now extended to two more days. We hiked up to Blanca Lake in the rain, woke up in the rain, hiked to the glacier in the drizzle and completed our measurements. The rain returned during the hike around the lake to camp. Snowpack was low around the lake, on the trail in and seemingly everywhere but on the glacier. Strong avalanching made this the first glacier even close to average in its snowpack. Snowpack was low in the highest basin of the glacier that is not as heavily avalanche fed. With typical late summer conditions mass balance will be -0.6 m on Columbia Glacier. The warm weather was evident in the temperature of the water being much warmer than usual in the stream ford that is required to reach the glacier.
lower curtis 2014 profile Annual layers of the Lower Curtis Glacier terminus.

ben stream Surface stream assessment, Ben Pelto

wet funBen Pelto in his tenth year working on the glaciers, fording stream in wet weather to access Columbia Glacier.

columbia 2014 snowpackSnowpack on Columbia Glacier limited blue ice.

columbia glacier july 20 2014 Blanca Lake and Columbia Glacier.

On Mount Daniel the first surprise was that Deep Lake had changed from the normal blue to a jade green. This was due to the heavy rain, even east of the crest, the previous three days, which also caused the Cle Elum River to be quite high, though the water was also warm. Having hiked passed this lake each of the last 30 years this is the first time it was not a deep blue color. It will be interesting to see how long it is until the color reverts to normal. We hiked up the Daniels Glacier to the main summit of Mount Daniel, then descended the Lynch Glacier before reascending the Lynch Glacier. Both glaciers had below normal snowpack and considerable blue ice exposure. With typical late summer conditions mass balance will be -1.2 m on Lynch Glacier and -1.1 m on Daniels Glacier. Neither glacier receives much avalanche snow. The following day on Ice Worm Glacier snowpack was above normal on the lower half of this small glacier, clearly because of unusually large amounts of avalanche accumulation. The top half of the glacier had 1-2 m of snowpack that will be lost by mid-September. With typical late summer conditions mass balance will be -0.5 m on Ice Worm Glacier lynch glacier downview
View down the Lynch Glacier.

daniels overview
Daniels Glacier vieww

ice worm glacier Ice Worm Glacier viewed across terminus melt pond

marmot ptarmigan
Marmot near camp.

Overall North Cascade glaciers will lose considerable volume. The volume lost is less on glaciers in the southern portion of the range and those with high percentages of avalanche accumulation.

easton profile
Easton Glacier profile.

easton icefall2
Easton Glacier icefall

icefall exit
Melanie Gajewski and Megan Pelto below icefall.

Glacier Ground Truth-2012 Field Season

For the 29th summer in a row we will be measuring glacier mass balance in the field, in the North Cascades, Washington, over the next three weeks, no new posts during this period. Glacier mass balance is the most sensitive measure of glacier response to climate. In the past the only way to determine mass balance was detailed field measurements. Today there is sufficient satellite imagery to provide data that can be used in conjunction with ground truth to determine the mass balance of a glacier using a model. The ground truth we complete provides richer spatial detail than remote sensing can today. Satellite imagery provides excellent big picture and time specific data, but still needs ground truth. For example the National Operational Hydrologic Remote Sensing Center (NOHRSC) now provides daily snowpack and snowmelt maps that are based on satellite imagery and climate models. A snapshot is provided of two of these from early July 2012 in the area of Mount Baker, WA, where we will be working shortly note blue arrows indicating specific glaciers. The first image is the snowpack in snow water equivalent (SWE). It is assessed at over 30 inches remaining. The second is of the snowmelt in SWE for the same area over a 72 hour period ranging from 1.5 to 4 inches. NOHRSC products are not really designed for glaciated elevations or mid-summer conditions, the system has been well verified for most areas of our nation for most times of the normal snowcover season. The Sholes Glacier in summer fits neither. We will be measuring the snowpack at over 500 locations around the blue arrows. We will also be continuing to measure the snowmelt on the same glaciers as the summer progresses. Other satellite images provide a detailed look at a glacier, but are acquired only on occassion. This is indicated by the excellent images in Google Earth from Sept. 2009 and Sept. 2011 of Sholes Glacier which show a much different story in terms of snowpack extent. The blue dots indicate the 2009 snowline, where snow from the winter survived the summer melt season up to that date. In 2009 the glacier was 30% snowcovered at the end of the melt season, in 2011 the glacier was 95% snowcovered. We will be taking over 100 measurements of snow depth on this glacier to provide the detail that allows the pattern of snowcover alone to be used to identify the snowpack distribution and hence mass balance of the glacier.