
For Mount Baker, Washington the freezing level from January-April 20 was not as high as the record from 2015, but still was 400 m above the long term mean. April 1 snowpack at the key long term sites in the North Cascades was 8% above average. A warm spring altered this, with April being the warmest on record. The three-four weeks ahead of normal on June 10th, but three weeks behind 2015 record melt. The year was poised to be better than last year, but still bad for the glaciers. Fortunately summer turned out to be cooler, and ablation lagged. Average June-August temperatures were 0.5 F above the 1984-2016 mean and 3 F below the 2015 mean. The end result of our 33rd annual field season assessing glacier mass balance in the North Cascades quantifies this. Our Nooksack Indian Tribe partners again installed a weather and stream discharge station below Sholes Glacier.
The primary field team consisted of myself, 33rd year, Jill Pelto, grad student UMaine for the 8th year, Megan Pelto, Chicago based illustrator 2nd year, and Andrew Hollyday, Middlebury College. We were joined by Tom Hammond, NCCC President 13th year, Pete Durr, Mount Baker Ski Patrol, Taryn Black, UW grad student and Oliver Grah Nooksack Indian Tribe. The weather during the field season Aug. 1-17th was comparatively cool.
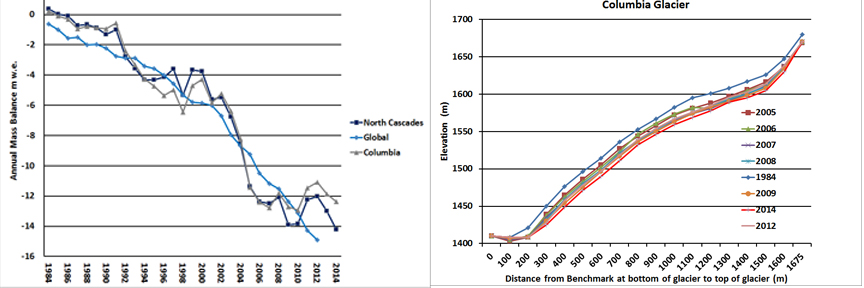
Mass Balance: Easton Glacier provides the greatest elevation range of observations. On Aug 2, 2016 the mean snow depth ranged from 0.75 m w.e. at 1800 m to 1.5 m w.e. at 2200 m and 3.0 m w.e. at 2500 m. Typically the gradient of snowpack increase is less than this. There was a sharp rise in accumulation above 2300 m. This is the result of the high freezing levels. The mass balances observed fit the pattern of a warm but wet winter. The high freezing levels left the lowest elevation glaciers Lower Curtis and Columbia Glacier with the most negative mass balance of approximately 1.5 m. The other six glaciers had negative balances of -0.6 to -1.2 m. This following on the losses of the last three years has left the glaciers with a net thinning of 6 m, which on glaciers averaging close to 50 m is a 12% volume loss in four years. We anticipate with that this winter will be cooler and next summer the glaciers happier. We will back to determine this.
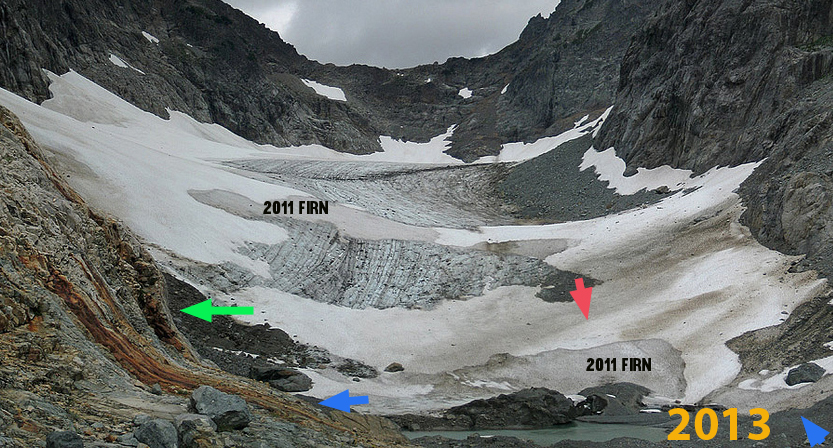
Snowpack loss from Aug. 5-Sept. 22 is evident in the pictures below on Sholes Glacier. Detailed snow depth probing, 112 measurements, of the glacier on August 5th allows determination of ablation as the transient snow line traverses probing locations from Aug. 5. GPS locations were recorded along the edge of blue ice on each of the dates. Ablation during this period was 2.15 m.
Terminus Change: We measured terminus change at several glaciers and found that a combination of the 2015 record mass balance loss and early loss of snowcover from glacier snouts in 2016 led to considerable retreat since August 2015. The retreat was 25 m on Easton Glacier, 20 m on Columbia Glacier, 20 m on Daniels Glacier, Sholes Glacier 28 m, Rainbow Glacier 15 m, Lower Curtis Glacier 15 m. The main change at Lower Curtis Glacier was the vertical thinning, in 2014 the terminus was 41 m high, in 2016 the terminus seracs were 27 m high. The area loss of the glaciers will continue to lead to reduced glacier runoff. We continued to monitor daily flow below Sholes Glacier which allowed us to determine that in August 2016 45% of the flow of North Fork Nooksack River came from glacier runoff. This is turns has impacts for the late summer and fall salmon runs.


 Clearly the area will still be beautiful and we will gain two new alpine lakes with the loss of the glacier. After making over 200 measurements in 2010 we completed a mass balance map of the glacier as we do each year. This summer we will be back again for the 32nd annual checkup. There will be likely be record low snowpack, comparable to 2005 the worst year from 1984-2014.
