Penny Ice Cap Northern Outlet Retreat, Baffin Island

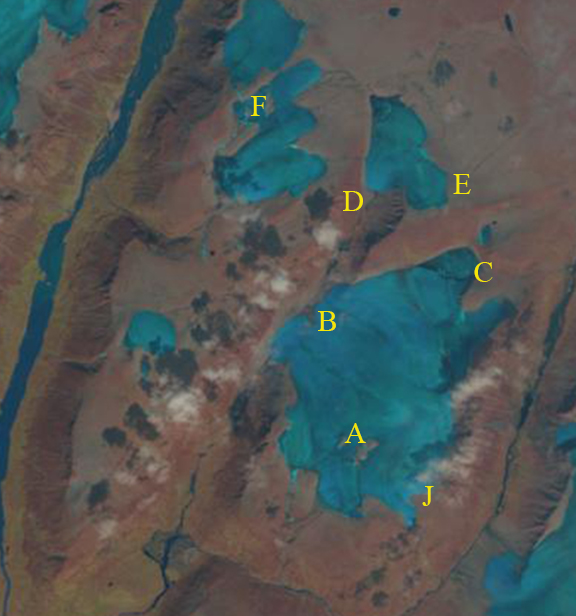
Penny Ice Cap Northern Outlet Glacier #43 in 1989 and 2016 Landsat images. Red arrow indicates 1989 terminus, yellow arrow 2016 terminus.  Two peripheral ice masses are at Point A and B. 

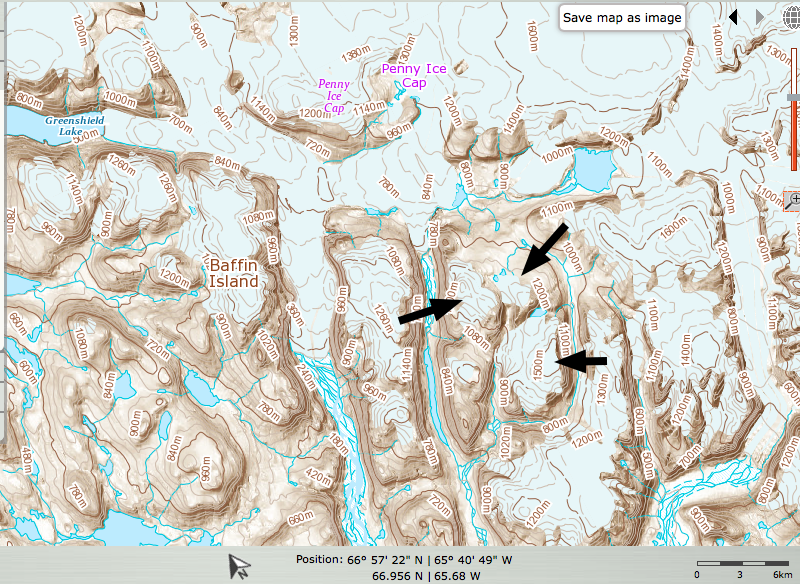
The primary northern outlet from the Penny ice Cap is an unnamed glacier, noted as #43 in the recent study by Van Wychen et al (2015). it is one of two large tidewater outlet glaciers on Baffin Island. Here we examine the response driven by climate change of this glacier from 1989 to 2016 using Landsat and Sentinel Imagery. Van Wychen et al (2015) observe that it is one of the two largest discharging glacier on the island and the Penny Ice Cap, with Coronation Glacier.  They observed peak velocities of over 100 m/year, 20 km upglacier of the terminus, declining to less than 20 m/year in the lower 10 km of the glacier.  Zdanowizc et al (2012) noted that in recent years the ice cap has experienced heightened melt, a longer melt season and that little retained snowpack survives the summer, that most of the retained accumulation is refrozen meltwater  or superimposed ice.  Geodetic methods indicate surface lowering of up to 1 m/year on all ice masses on Baffin Island and Bylot Island between 1963 and 2006 (Gardner et al.2012).

In 1989 the glacier terminated 1 km south of a terminal moraine peninsula that extends most of the way across the fjord. By 2014 glacier retreat is accompanied by the formation of two deltaics areas in front of the glacier, orange arrows in images below.  It is not clear if these are islands, a shoal in the fjord or the head of the fjord. Retreat from 1989 to 2016 is 900 m on the west side of the terminus, 600 m on the east side.  Two peripheral ice masses at Point A and B lack snowcover in 2016 and have lost area as well.  Extensive transverse crevasses develop in the last 700 m upglacier of the terminus, indicating the force imbalance that enables and enhances calving at the ice front, yellow arrow.  The reduced retained snowpack on the Penny Ice Cap is leading to reduced discharge and glacier retreat.  With a high snowline in 2016 indicated by the lack of retained snowpack on ice masses at Point A and B, it is clear this trend is ongoing. The impact is less dramatic than those noted in the Clephane Bay area of Baffin Island.

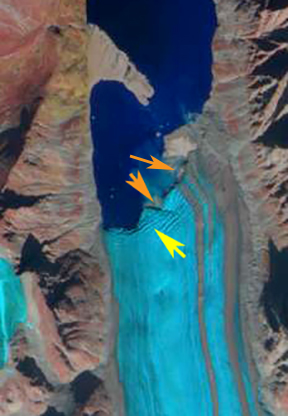
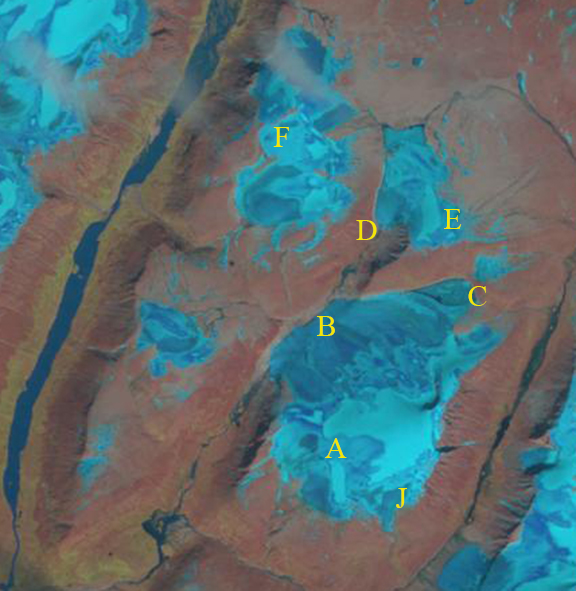
Penny Ice Cap Northern Outlet Glacier in 2016 Sentinel 2 image.  Yellow arrow indicates crevassing triggered by calving processes, orange arrows developing deltaics areas. 

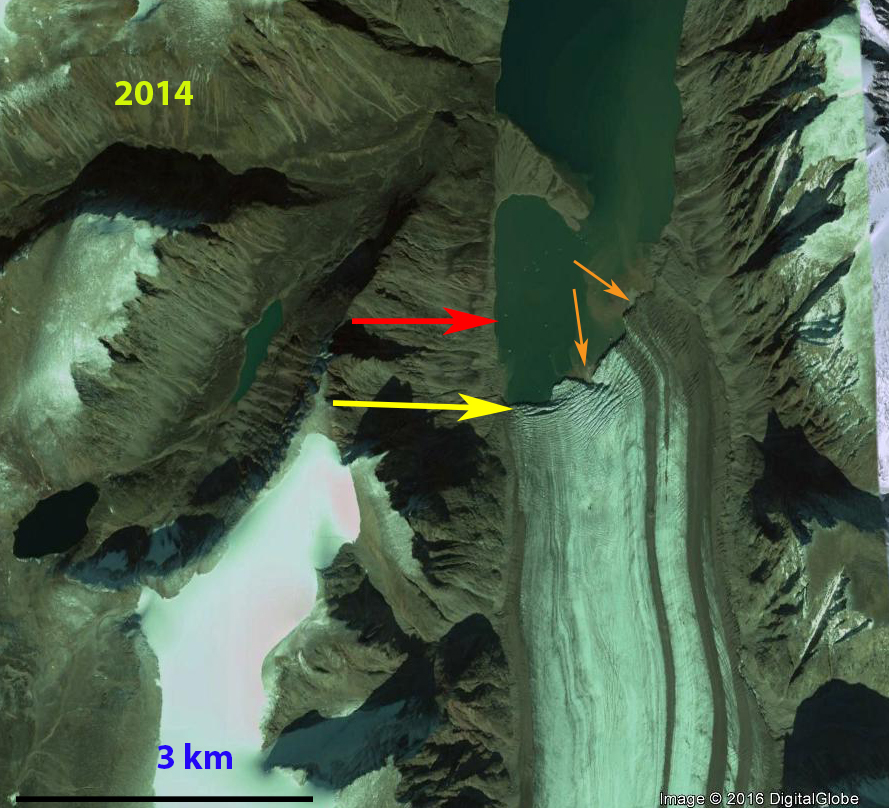
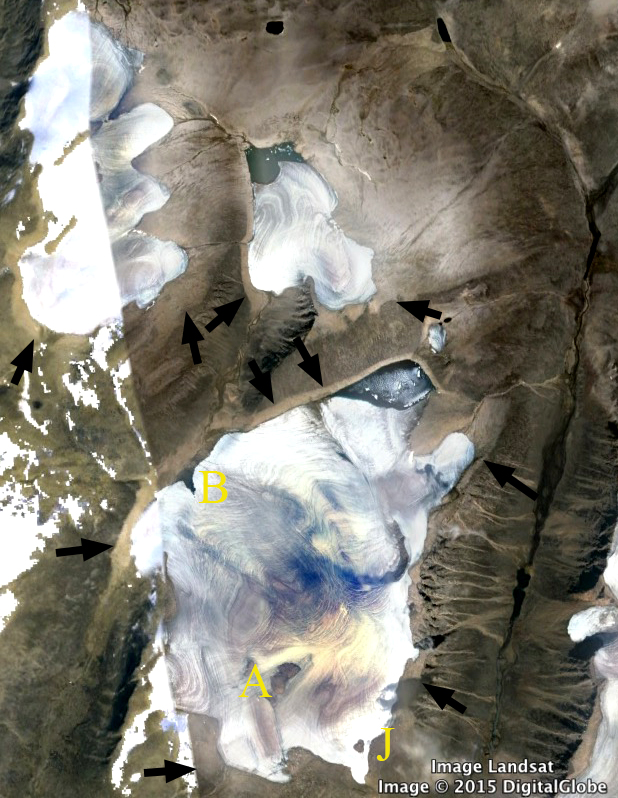
A 2014 Google Earth image of glacier front. Red arrow indicates 1989 terminus, yellow arrow 2016 terminus and orange arrows deltaic land areas building. 

Auyuittuq National Park Ice Cap Downwasting, Baffin Island

Just south of the Penny Ice Cap on Baffin Island in Auyuittuq National Park there are a large number of small ice caps.  We focus on three of these ice caps east of Greenshield Lake.  The region has been experiencing rapid ice loss, with 50 % of the ice cap area lost in the last few decades (Miller et al, 2008).  Miller et al (2008) also observe that these are thin and cold glaciers frozen to their beds with limited flow. Way et al (2015) observed the loss of 18-22% of two larger ice caps on Baffin Island, Grinnell and Terra Incognita.  The ice cap losses are due to reduced retained snowpack. Zdanowicz et al (2012)  found that starting in the 1980s, Penny Ice Cap entered a phase of enhanced melt rates related to rising summer and winter air temperatures across the eastern Arctic. In recent years they observed that 70 to 100% of the annual accumulation is in the form of refrozen meltwater. However, if the snowline rises above the ice cap consistently, as happened at Grinnell Ice Cap than there is no firn to retain the meltwater and superimposed ice formation is limited.  Meltwater has difficulty refreezing on a glacier ice surface. The rise in temperature is illustrated by a figure from Way et al (2015), below

penny ice cap map

Map of region south of Penny Ice Cap from Canadian Topographic maps.

gic summer climate

Figure From Way et al; (2015)

In the 1998 Landsat image the two northern ice caps, with E and F on them, have very little retained any snowpack, but significant firn areas.  The larger ice cap has retained snowpack adjacent to Point A and considerable firn area as well. There is a trimline beyond the glacier margin apparent west of Point B due to recent retreat, but otherwise trimlines are not immediately evident.  In 2000 the two northern ice caps again have very little retained snow, and the larger ice cap retained snow near Point A.  In the 2013 Google Earth image black arrows on the image indicate trimlines recently exposed by glacier retreat.  There is no evident retained snow, and no retained firn is even evident. This suggests the ice caps lacks an accumulation zone.  A close up view, illustrates many years of accumulation layers now exposed, note the linear dark lines, black arrows.  The second closeup view illustrates the area around Point E and D that has been deglaciated.  There also are some new areas of expanded bedrock such as near Point A on the larger ice cap.  The 2014 Landsat image indicates the bedrock has expanded at Point A.  At Point B an area of bedrock is expanding into the ice cap.  At Point C the lake has expanded at.  Ice has melted away from Point D and E. At Point F a new area of bedrock has emerged within the ice cap.  At Point J the new bedrock seen in the 2013 Google Earth image has now expanded to the margin of the ice sheet.  These changes are a result of a thinning ice cap, largely due to increased ablation.  The lack of retained snow cover or firn confirms there is not a consistent accumulation zone and that these ice caps cannot survive current climate (Pelto, 2010).

baffin smi 1998 copy

1998 Landsat image

baffin smi 2000 copy

2000 Landsat image

baffin smi 2013ge copy

2013 Google Earth Image

baffinsmi closeup copy

Google Earth Closeup

baffinsmi closeup2 copy

Google Earth Closeup

baffin smi 2014 copy

2014 Landsat image