Läntagletscher, Switzerland Separates From Rapidly Melting Terminus Lobe

Läntagletscher (L)  in 1990 Landsat image and 2018 Sentinel image.  Red arrow is the 1990 terminus location, yellow arrow 2018 terminus location, Zervreilasee (Z)  and Gufergletscher (G)

Läntagletscher is in the Alps draining into the Zervreilasee and then the Rhone River.  Zervreila is a 22 MW hydropower facility, with a 150 m high arch dam . From 1990-2014 the glacier retreated at a steady rate of ~24 m/year.  The upper portion of the glacier then separated from the lower terminus resulting in an 800 m retreat from 2014-2017 Swiss Glacier Monitoring  (GLAMOS).  GLAMOS has a new website design with good visualizations of glacier change in Switzerland. Here we examine the changes in this glacier from 1990-2018 with Landsat and Sentinel images.

In 1990 the glacier’s upper basin from 3300 m-2700 m feeds a narrow tongue that descends an icefall to the terminus section that extends from 2600 m to 2350 m, and was 1 km long. In 2006 the glacier has retreated ~400 m, but still remains connected to the upper glacier.  In 2013 Google Earth image below the terminus lobe is still connected to the upper glacier.  By 2016 the connection has been lost. The snowline in 2016 also illustrates limited retained snowcover. In 2018 there is limited snowcover remaining on Läntagletscher and Gufergletscher. Läntagletscher has retreated 1400 m since 1990 and is now confined to upper glacier region terminating at 2700 m. In the near future retreat will be slower. The loss of connection to a valley tongue has also been seen at Bas d”Arolla and Sulztalferner.

The continued loss of glacier area will reduce summer glacier runoff into the Zervreila Hydropower project as is the case across Switzerland (Schaefli et al, 2018).

Läntagletscher (L)  in 2006 Landsat image and 2016 Sentinel image.  Red arrow is the 1990 terminus location, yellow arrow 2018 terminus location,  pink arrow is a location where disconnection may occur on Gufergletscher (G).

Google Earth image of Läntagletscher, yellow arrow is the terminus lobe, green arrow the icefall connection and blue arrow the upper glacier.

Zervrielersee and dam, color due to glacially eroded sediments (glacial flour). Image from Micha L. Rieser in 2009.

Breney Glacier Switzerland Accelerating Retreat 1988-2018

Breney Galcier, Switzerland in Landsat images from 1988 and 2018.  Red arrow = 1988 terminus location, yellow terminus =2018 and purple dots the snowline.  B=Breney Glacier, G=Gietro Glacier, L=Lateral Moraine, M=Lac Mauvoisin and O=Otemma Glacier.

Breney Glacier (B) is in the next valley to the north of Otemma Glacier (O) and south of Gietro Glacier (G), it  flows southwest into Lac de Mauvoisin (M). Breney Glacier is one of the glaciers where the terminus is monitored annually by the Swiss Glacier Monitoring Network (GLAMOS:VAW/ETH). Here we examine changes in this glacier from 1988 to 2018 including changes in the terminus using Landsat Imagery.  GLAMOS:VAW/ETH reports that Breney Glacier retreated 175 m from 1988-1999, and a further 625 m from 1999-2015.   The Mauvoisin Dam can produce 363 MW of power, and typically provides 1030 millionKWh of power each year. The reservoir can store 200 million cubic meters of water.

Here we examine Landsat images to identify changes in this glacier during the last three decades 1988-2018.  In 1988 the glacier extended onto an outwash plain at 2600 m and the snowline was at 3300 m.  In 1999 the snowline is at 3200 m, the terminus has experienced limited retreat across the low slope outwash plain.  By 2015 the terminus has retreated to ~2700 m, the snowline is at 3500 m.  In 2018 the snowline is at 3500-3600 m too high to sustain the glacier at its current length.  The glacier has retreated from the outwash plain that is still accumulating sediment.  There is significant retreat from 2015 to 2018, more than 100 m. There are regions of ice cored moraine (ICM).  The current lateral moraine that is visible on both margins of the glacier illustrates the recent rapid thinning and the insulating effect of the debris.  There is limited crevassing on the lower glacier which is dissected by a supraglacial stream, note detailed Google Earth image below. The northern arm of Breney is Serpentine Glacier, which is thinning and appears close to separation from Breney Glacier. The retreat is similar in magnitude to adjacent Otemma Glacier (O) and south of Gietro Glacier (G), all driven by high glacier melt and the resulting high snowlines.  The mass balance of Swiss Glaciers has had a sustained strongly negative trend since 2003 (Huss et al 2015).

Breney Galcier, Switzerland in Landsat images from 1988 and 2018.  Red arrow = 1988 terminus location, yellow terminus =2018 and purple dots the snowline. 

Google Earth image from 2016 of the terminus area of Breney Glacier. K=Kettle, OP=Outwash Plain, T=Terminus, S=Supraglacial stream, ICM=ice cored moraine.

Bas d’Arolla Glacier, Switzerland No Longer Reaches Valley

Bas d’Arolla Glacier in Landsat images from 1990, 2001 and 2017.  Red arrow is 1985 terminus, yellow arrow 2017 terminus location, purple dots annual snowline. A=Bas d’Arolla O=Otemma

Bas D’Arolla Glacier is one of the glaciers where the terminus is monitored annually by the Swiss Glacier Monitoring Network (SCNAT). Here we examine changes in this glacier from 1985 to 2017 including changes in the terminus, snowline elevation and tributary connection during this period using Landsat Imagery. SCNAT reports that the glacier advanced 136 m from 1972-1987, retreated at a rate of 17.6 m/year from 1987-2001, and  23 m/year from 2001-2017.  The main accumulation zone between Pigne d’Arolla and Mont Collon extends from 2900 m to 3400 m, with a saddle to Otemma Glacier at 3000 m. An icefall extends from 2400 m to 2900 m. In 1985 the glacier had a low elevation terminus tongue extending from the base of an icefall at 2400 m to just below 2200 m (see map below).

In 1985 the glacier terminates at the red arrow at an elevation of 2160 m and the snowline is at 2940 m.  In 1990 the terminus had advanced slightly up to 1987 and then retreated slightly with not significant overall change and the snowline is again at 2940 m.  By 2001 the glacier has retreated 220 m, and the snowline is at 2900 m.  In 2015 the snowline is at 3100 m with the saddle to Otemma Glacier not in the accumulation zone.  This saddle should always be snow-covered.  In 2017 the snowline is at 3200 m, the saddle with Otemma Glacier is again exposed and is in fact glacier ice, indicating that snow and firn has been lost and this is no longer part of the persistent accumulation zone.  The main terminus tongue in 1985 that occupied the valley floor and extended 500 m from 2400 m to the terminus is gone, with a total retreat of 600 m since 1985.  The glacier retreat is similar to that of neighboring Otemma Glacier and more substantial than Gietro Glacier, and reflects an annual snowline that is too high to maintain the glacier terminus tongue.  the Bas d’Arolla valley floor is now glacier free. The river discharges into the Rhone River Basin, which has substantial hydropower south of Lac Geneva.  Schaefli et al (2018) observe that of the 50% of Swiss power that comes from hydro, glacier mass loss alone has provided 3-4% of the total, not a sustainable model.  Bliss et al (2014) indicate that the Swiss Alps have passed peak glacier runoff.

Bas d’Arolla Glacier in Landsat images from 1985 and 2017.  Red arrow is 1985 terminus, yellow arrow 2017 terminus location, purple dots annual snowline. A=Bas d’Arolla O=Otemma

Map of the Bas d’Arolla Glacier and Mont Collon area, from Swisstopo

Google Earth image indicating flow, and the fact that the glacier now terminates in the icefall region, no longer reaching the valley floor.

Saleina Glacier, Switzerland Terminus Separation

Saleina Glacier comparison in 1985 and 2015 Landsat images.  The red arrow is the 1985 terminus, the yellow arrow the 2015 terminus and the purple dots the transient snow line in these August images. 

Saleina Glacier is south of Trient Glacier descending a steep eastward oriented valley from Aiguille d’Argentiere on the northern end of the Mount Blanc Range.  The Swiss Monitoring Network has maintained annual observations of the glacier front since 1878.  After a sustained retreat during the first half of the 20th century, the glacier advanced 215 m from 1964-1988.  From 1990 to 2015 the glacier retreated 640 m. 

Here we use Landsat imagery from 1985-2017 and Google Earth images to identify ongoing changes. In 1985 the glacier extended down valley to an elevation of 1850 m, just before the valley turns east.  After 2000 the lower 800 m of the glacier became debris covered, but up to at least 2009 remained crevassed indicating activity.  By 2015 this section of the glacier no longer has crevassing or glacier ice exposed at the surface and has essentially collapsed and is no longer part of the main glacier.  This is illustrated in a comparison of Google Earth images from 2011 and 2015.  Points A,B and C represent the same bedrock locations adjacent to the glacier.  The green arrows indicate a medial moraine on active ice in 2009 and what has become an ice cored moraine ridge without adjacent active ice in 2015.  In 2009 the blue arrows indicate areas of crevassing indicating active ice.  In 2015 the purple arrows indicate buried ice cored moraine as indicated by meltwater wetting the sediments.  The total retreat of the active front from 1985 to 2015 is 1250 m, with the active front at 2300 m.  The retreat has been driven by a rise in the end of melt season snowline. This amount of retreat is similar to that of adjacent Glacier du Tour

In 1985 the snow line in mid-August was at 2900 m, in 2015 in late August the snowline was at 3075 m and in late August of 2017 the snowline is at 3150 m.  The summer of 2003 is when the highest snowlines were reported across the western Alps  (Rabatel et al 2013). That summer of 2003 in mid-August the snowline on Saleina Glacier was at 3050 m in an August snowline comparison of Mont Blanc glaciers. This years snowline will likely end the year as high or higher than 2003, the extensive negative mass balance will drive further retreat.

The 2016 inventory of Swiss glaciers noted several with significant retreats due to separation of stagnant ice areas and active ice.  Saleina Glacier warrants being in this category.


Saleina Glacier in 2017 Landsat image.  The red arrow is the 1985 terminus, the yellow arrow the 2015 terminus and the purple dots the transient snow line on 8/26/2017.


Points A,B and C represent the same bedrock locations adjacent to the glacier in the 2009 and 2015 Google Earth images.  The green arrows indicate a medial moraine on active ice in 2009 and an ice cored moraine ridge without adjacent active ice in 2015.  In 2009 the blue arrows indicate areas of crevassing.  In 2015 the purple arrows indicate buried ice cored moraine as indicated by meltwater wetting the sediments.


Yellow arrows mark the end of the active ice in 2015 on Saleina Glacier. 


Plaine Morte Glacier, Switzerland July 2017 Bare of Snow

Landsat images from 2013, 2014 and 2015 and Sentinel Image from 2017 indicating lack of snowcover on Plaine Morte Glacier (PM).  Nearby Wildstrubel Glacier (W) terminus has separated since 2005.

Glacier de la Plaine Morte  (Plaine Morte: PM) is in the Swiss Alps just north of Crans Montana.  The Crans Montana resort has a lift that ends just above the glacier, and a ski loop traverses the middle of the glacier (see map below).  The glacier has a limited elevation range from 2900-2500 m.  It has a low slope 4 degree or less over the main plateau area of 5 square kilometers between 2650 m and 2800 m.  Huss et al (2013) observed the glacier lost an average of 35 m in thickness from 1954-2011, this represents a greater mass loss than the regional average of 22 m. At the southeast margin of the glacier is Lac des Faverges, that forms and drains each summer which Huss et al (2013)  expect to expand substantially with further retreat and downwasting.  The glacier is just east of Wildstrubel Glacier (W)

What is clear from examining Landsat imagery is that the glacier does not retain substantial areas of snowcover most years.  This means the glacier lacks a consistent accumulation zone and cannot survive (Pelto, 2010).  The warm summer of 2017 has left the glacier without snowcover even though it is only mid-July.  The mass balance loss this year will be substantially over 1 m this year. This has been the case in 2013, 2014 and 2015 as well by the end of August.  The loss of of snowcover is also observed in Landsat images from 2003, 2004 and 2005.  The 2009 image is from Google Earth, Lac des Faverges has not drained yet (F) and the glacier is yet again lacking snowcover.  The glacier is larger than the soon to disappear Cavagnoli and loses its snowpack more often than Basodino.  The glacier cannot survive, but is still large and will not disappear quickly. There is clearly a concentric basin to the right (east) of the PM in the glacier center. Wildstrubel Glacier in 2004 and 2005 terminated beyond the convergence of two glacier tongues, yellow arrow.  In 2015 and 2017 it is evident that retreat has led to a separation of the glaciers. 

Landsat images from 2004,  and 2005 indicating lack of snowpack on Plaine Morte Glacier (PM).  Nearby Wildstrubel Glacier (W) terminus is joined in 2005.

Google Earth image from 2009 of glacier, with Lac Faverges evident (F).

Ski trail map of Crans Montana

Cavagnoli Glacier, Switzerland Fading Away

Google Earth image of Cavagnoli in 2010 and a Sentinel 2 image from Sept. 9  2016.  Ice masses are numbered.  No retained 2016 snowpack, note the lighter colored snow on the upper Basodino Glacier

Cavagnoli Glacier (Ghiacciaio dei Cavagnöö) drains south into Lago dei Cavagnoli (Lago dei Cavagnöö), which is impounded by a dam that is 111 meters high.  The glacier like its neighbor Basodino Glacier  is in the Ticino River watershed and supplies the Robiei/Cavagnoli Hydropower system. The Cavagnoli Hydropower plant can provide 28 MW of power. The Swiss Glacier Monitoring Network noted that glacier area in 1973 was 1.36 square kilometers, when the glacier was a single ice mass.. The Swiss Glacier Monitoring Network has observed the annual retreat of this glacier since 1980, total retreat up through 2013 is 378 m of the main glacier.  The top of the glacier has also been retreating this is a symptom of a glacier that will not survive (Pelto, 2010). Huss and Fischer (2016) indicate that the majority of the small alpine glaciers, less than 0.5 square kilometers will disappear in the next 25 years.

This glacier has no accumulation zone in 2003, 2005, 2007 or 2010 Landsat and Google Earth imagery. The glacier itself by 2010 had separated into five separate ice masses that are each melting quickly away.  The glacier as viewed from below and from directly above in Google Earth Imagery indicates a thin glacier with few crevasses.This has become a reoccurring pattern for this glacier, and also is a sign of a glacier that cannot survive.   In 2010 Google Earth imagery the largest ice mass was 0.4 square kilometers and none of the ice masses appear destined to survive. In 2016 the Sentinel 2 image indicates there are four remaining ice masses, with a combined area of 0.3 square kilometers, with the largest ice mas now at less than 0.2 square kilometers.  There is no retained snowpack in the 2016 Sentinel image either. On the main ice mass there is a meltwater stream from the top to the bottom of the glacier indicating that even the top of the glacier is usually snow free by summer’s end. This glacier is a small relic of its former mapped extent.   The glacier will not persist, but is also an example that even small glaciers in poor health do not disappear quickly.

[ngg_images source=”galleries” container_ids=”47″ display_type=”photocrati-nextgen_basic_imagebrowser” ajax_pagination=”1″ template=”/nas/wp/www/sites/blogsorg/wp-content/plugins/nextgen-gallery/products/photocrati_nextgen/modules/ngglegacy/view/imagebrowser-caption.php” order_by=”sortorder” order_direction=”ASC” returns=”included” maximum_entity_count=”500″]


Basodino Glacier, Switzerland Mass Balance Loss & Hydropower

Basodino Glacier in August and September of 2016 illustrating the upward shift of the snowline in the 15 days between the Landsat (left) and Sentinel (right) image. purple dots mark snowline. 

Basodino Glacier is a small northeast facing slope glacier in the southern Swiss Alps.  The glacier is in the Ticino River watershed and supplies the Robiei Hydropower system. The glacier is in the same basin as Cavagnoli Glacier, which is fading away. The main branch presently covers an area of 1.8 km2 and extends from 2562 to 3186 m.  In 1973 the glacier had an area of 2.3 km2 .  Detailed mass balance investigations have been carried out since 1990.  During this period the glacier has lost more than 11 m w.e. thickness.  In seven years from 1980-2014 the glacier has had an AAR below 10 (Bauder, 2016).  This is indicative of minimal retained accumulation and not a consistent accumulation zone (Pelto, 2010) .  Huss (2012) noted that mean glacier mass balance in the European Alps was −0.31  m w.e./ year from 1900–2011, and −1 m w.e. /year over the last decade.  For Basodino Glacier the loss during this enite period averaged ~-0.2 m w.e./year (Huss, 2012).  The glacier advanced 95 m from 1967-1986 and has retreated 260 m since, front observations are completed and submitted by Claudio Vallegia of Ticino, Sezione Forestale (Swiss-ETHZ, 2016).

Water from glacier melt  is channelled to the Robiei-Zött reservoirs and hydro plants, generating enough electricity for a city. The Cavagnoli and Naret reservoirs at 2310 m feed the Robiei power station, situated 400 m below. The Robiei power station is also capable of pumping the water from the Robiei-Zött up to the higher Cavagnoli-Naret reservoirs.

Basodino Glacier in late August of 2016 had 5-60% of the glacier still in the accumulation zone. two weeks later on Sept. 9, 2016 the glacier had 35% of the glacier in the accumulation zone.  This is the accumulation area ratio, which needs to be above 55% for equilibrium.  For Basodino Galcier 2016 will be another year of mass balance loss and retreat.  The detailed monitoring will provide specific values for each reporting to the Swiss Glacier Monitoring Network system and the WGMS.

[ngg_images source=”galleries” container_ids=”48″ display_type=”photocrati-nextgen_basic_imagebrowser” ajax_pagination=”1″ template=”/nas/wp/www/sites/blogsorg/wp-content/plugins/nextgen-gallery/products/photocrati_nextgen/modules/ngglegacy/view/imagebrowser-caption.php” order_by=”sortorder” order_direction=”ASC” returns=”included” maximum_entity_count=”500″] 

Findelengletscher, Switzerland Retreat & Hydrology Insights from David Collins

findelen compare

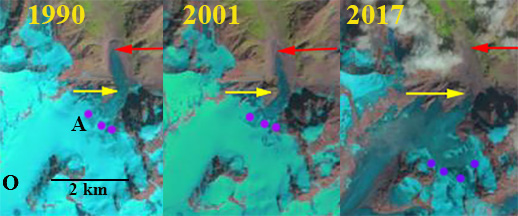
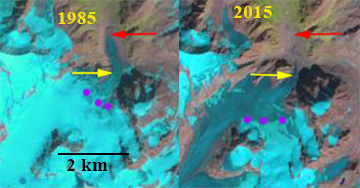
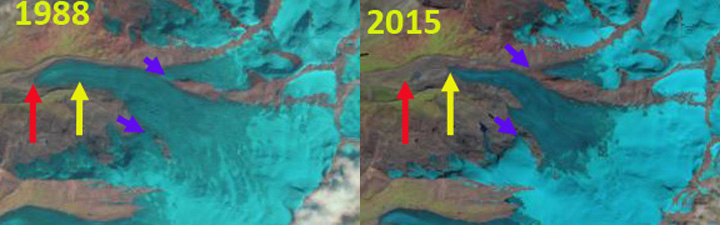
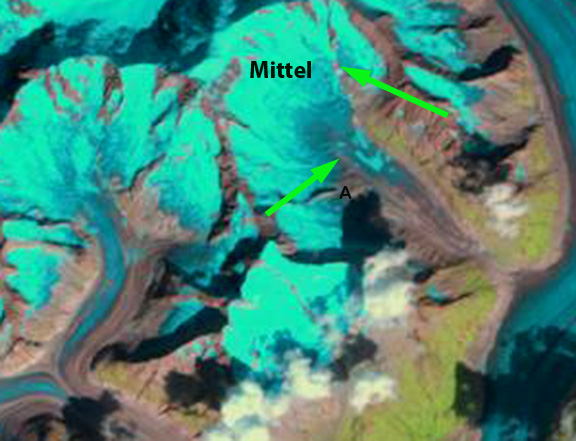
Landsat image comparison of Findelengletscher from 1988 to 2015. Red arrow indicating the 1988 terminus location and yellow arrow the 2015 terminus location.  The purple arrows indicate two tributaries connected to the main glacier in 1988 and now disconnected.

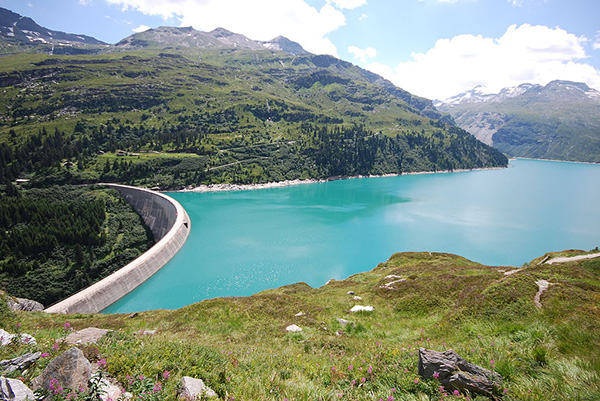
Findelengletscher along with Gornergletscher drains the west side of the mountain ridge extending from Lyskamm to Monte Rosa, Cima di Jazzi and Strahlhorn in the Swiss Alps.  It is the headwaters of the Matter Vispa.  This glacier was also the favorite field location for David Collins, British Glaciologist/Hydrologist from University of Salford who passed away last week. David had a wit, persistence and insight that are worth remembering. This post examines both David’s findings reaching back to the 1970’s gained from a study of glaciers in this basin and changes of the glacier since 1988 as evident in Landsat images. Findelengletscher drains into the Vispa River which supports for hydropower project, with runoff diverted into two hydropower reservoirs, Mattmarksee  operated by the Kraftwerke Mattmark producing 650 Gwh annually, and Lac de Dix operated by Grande Dixence that produces 2000 Gwh annually. There are two smaller run of river projects as well.

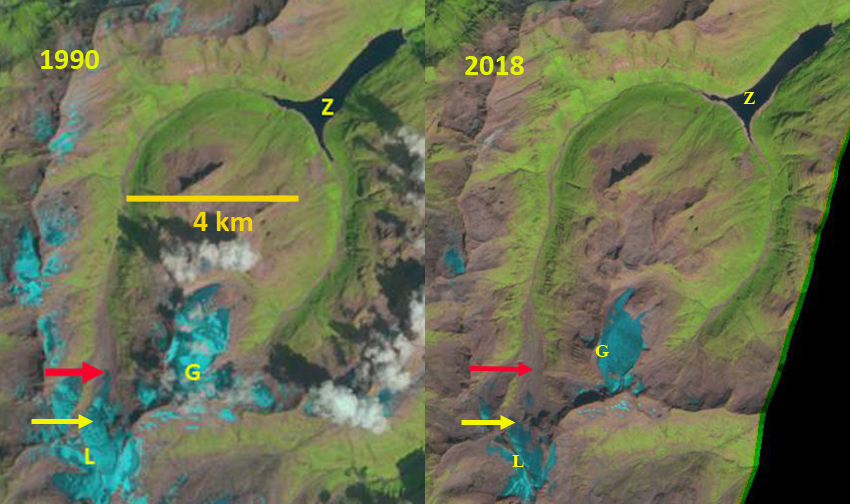
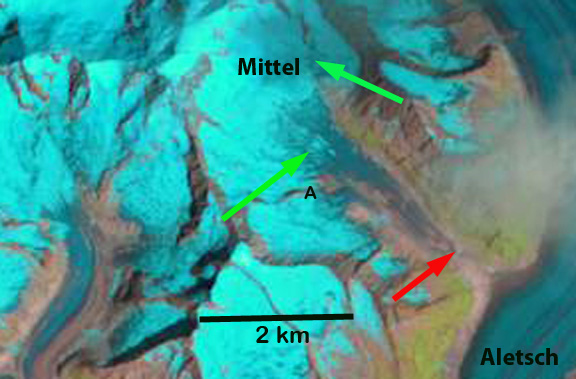
The Swiss Glacier Monitoring Network has monitored the terminus change of Findelengletscher since the 1890’s.  The glacier advanced 225 m from 1979-1986, retreated 450 m from 1988-1999 and retreated 850 m from 1999-2015. This is illustrated above with the red arrow indicating the 1988 terminus location and the yellow arrow the 2015 terminus location.  The purple arrows indicate two tributaries connected to the main glacier in 1988 and now disconnected.  The more limited retreated from 1988-1999 is evident in images below. The retreat is driven by mass losses with Huss et al (2012) noted as 1 m/year in the alps from 2001-2011. The snowline has typically been above 3250 m too high for equilibrium in the last decade. Melt at the terminus has typically been 7-8 m (WGMS).

Collins (1979) in work funded through hydropower looked at the chemistry of glacier runoff and found that glacier meltwater emerging in the outlet stream was enriched in Calcium, Magnesium and Potassium in particular versus non-glacier runoff, this led to a much higher conductivity. Collins (1982) noted the reduction in streamflow below Gornergletscher from summer streamflow events that reduced ablation for up to a week after the event. Collins (1998) noted that  a progressive rise of the transient snow line in summer increases the snow-free area, and hence the area of basin which rapidly responds to rainfall. Rainfall-induced floods are therefore most likely to be largest between mid-August and mid-September and in this period of warmer temperatures and higher snowlines. Collins (2002) Mean electrical conductivity of meltwater in 1998 was reduced by 40%. In the same 60 day period in 1998, however, solute flux was augmented by only 2% by comparison with 1979. Year-to-year climatic variations, reflected in discharge variability, strongly affect solute concentration in glacial meltwaters, but have limited impact on solute flux.  Collins (2006) identified that in highly glacier covered basins, over 60%, year-to-year variations in runoff mimic mean May–September air temperature, rising in the warm 1940s, declining in the cool 1970s, and increasing by 50% during the warm dry 1990s/2000s. In basins with between 35–60% glacier cover, flow also increased into the 1980s, but declined through the 1990s/2000s. With less than 2% glacier cover, the pattern of runoff was inverse of temperature and followed precipitation, dipping in the 1940s, rising in the cool-wet late 1960s, and declining into the 1990s/2000s.. On large glaciers melting was enhanced in warm summers but reduction of overall ice area through glacier recession led to runoff in the warmest summer (2003) being lower than the previous peak discharge recorded in the second warmest year 1947. Collins (2008)  examined records of discharge of rivers draining Alpine basins with between 0 and ∼70% ice cover, in the upper Aare and Rhône catchments, Switzerland, for the period 1894-2006  together with climatic data for 1866-2006 and found that glacier runoff had peaked in the late 1940s to early 1950s.

These observations have played out further with warming, retreat and more observations. Finger et al (2012) examine the impact of future warming on glacier runoff and hydropower in the region.  They observe that total runoff generation for hydropower production will decrease during the 21st century by about one third due glacier retreat. This would result in a decrease in hydropower production after the middle of the 21st century to keep Mattmarksee full under current hydropower production. Farinotti et al (2011) noted that the timing of maximal annual runoff is projected to occur before 2050 in all basins and that the maximum daily discharge date is expected to occur earlier at a rate of ~4 days/decade. Farinotti et al (2016) further wondered if replacing the natural storage of glacier in the Alps could be done with more alpine storage behind dams.

findelen

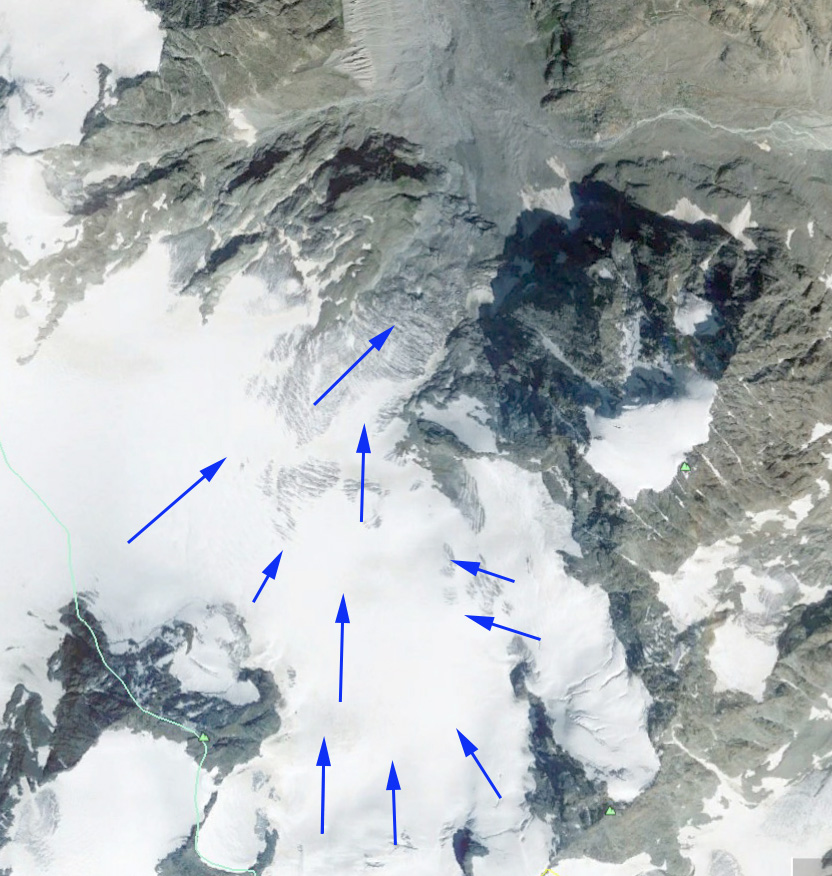
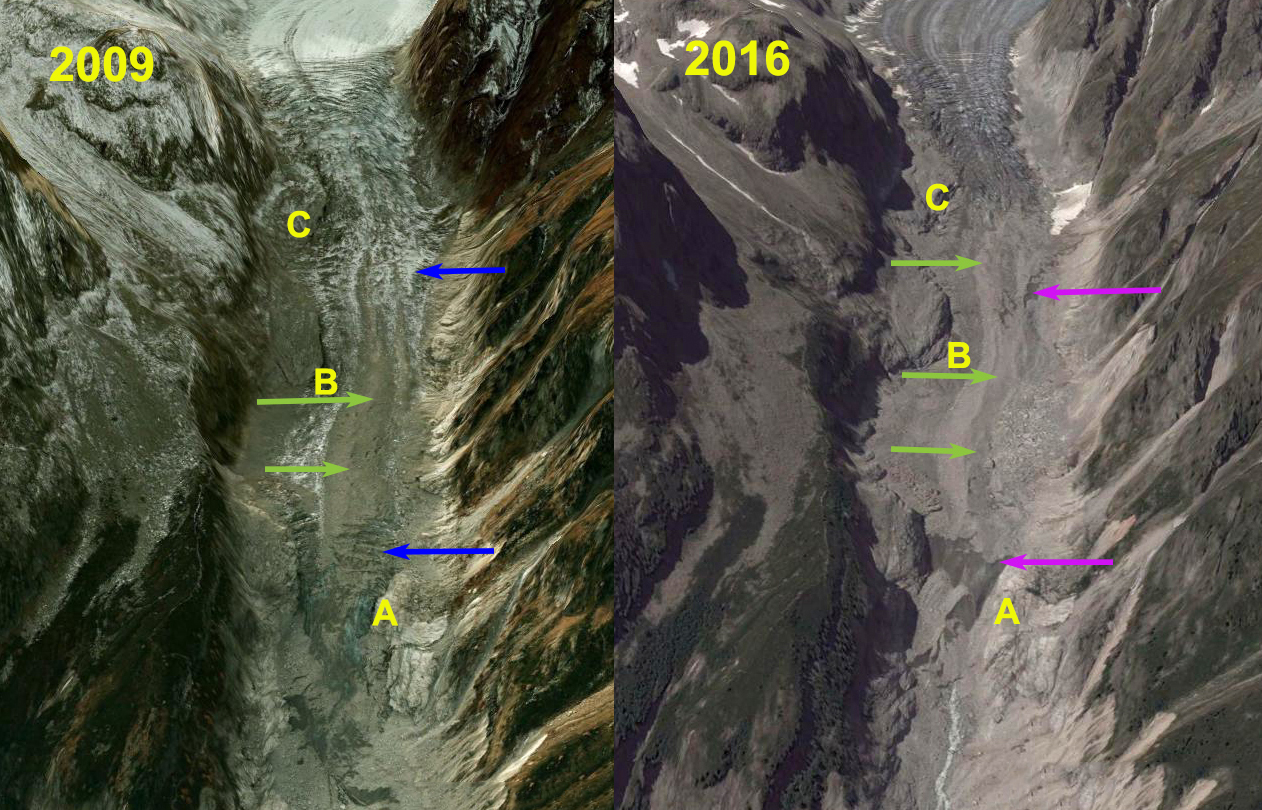
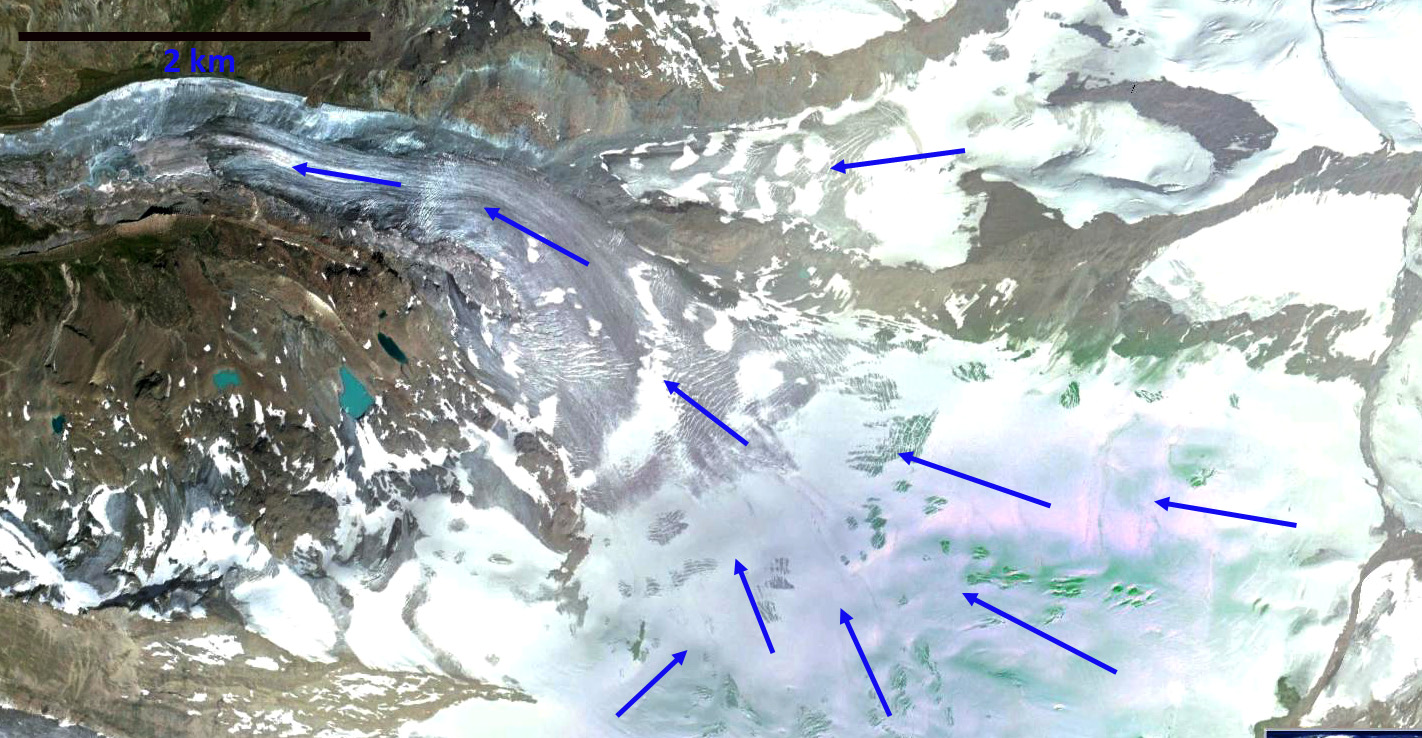
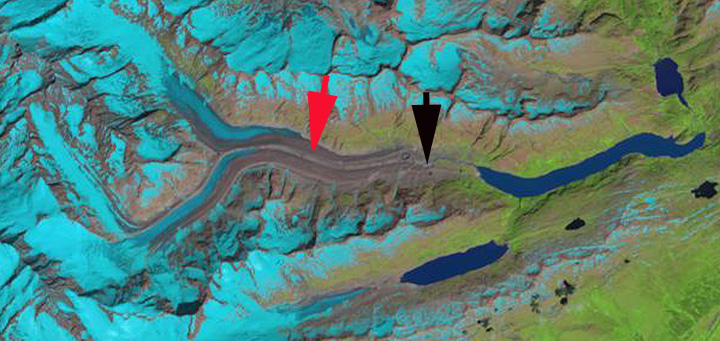
Google Earth image indicating flow of the Findelengletscher.

fiindelen 2 compare

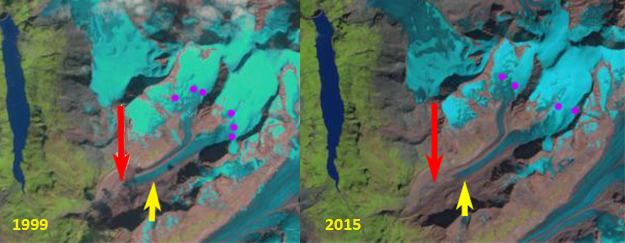
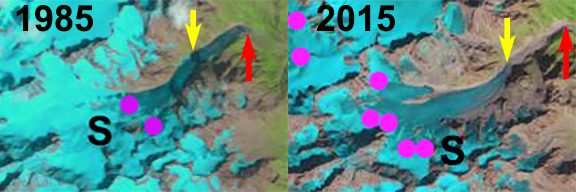
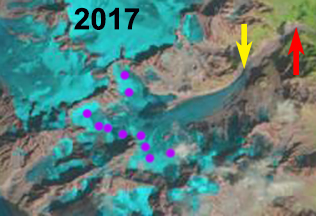
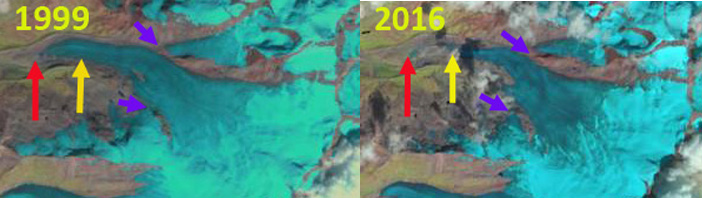
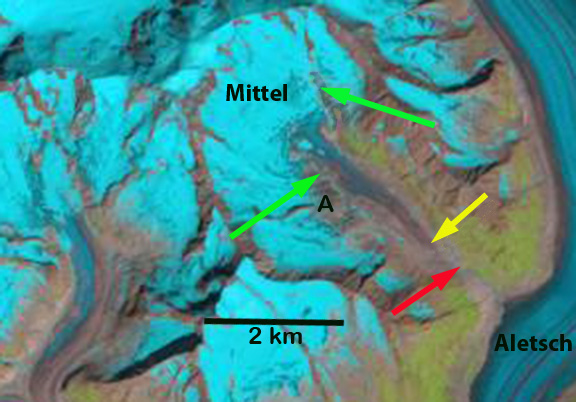
Landsat image comparison of Findelengletscher from 1999 to 2016. Red arrow indicating the 1988 terminus location and yellow arrow the 2015 terminus location.  The purple arrows indicate two tributaries connected to the main glacier in 1988 and now disconnected.

Findelen terminus

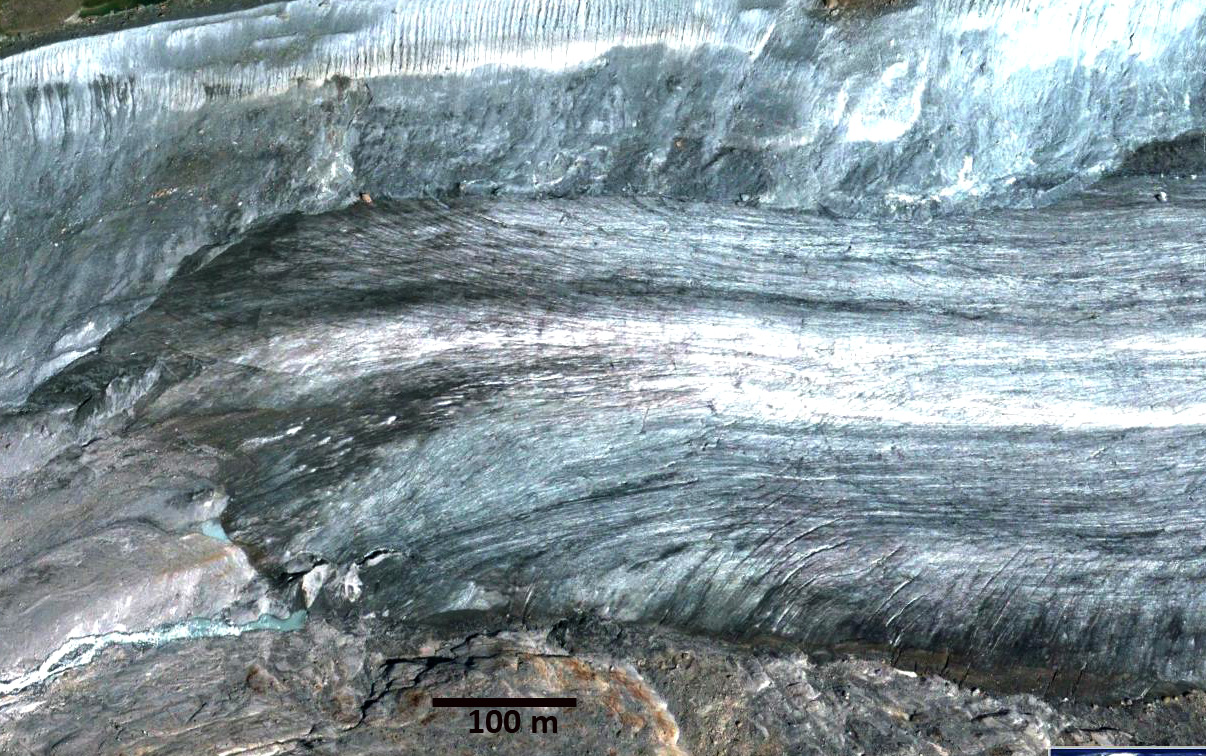
Terminus of Findelengletscher in Google Earth.  The lower several hundred meters has limited crevasses, but is not particularly thin. 


Mittelaletsch Glacier Retreat, Switzerland

Mittelaletsch Glacier was a tributary to the Alps largest glacier Grosser Aletsch, until separation in 1990. The map of the glacier represents changes in the glacier from 1926 to 1957, indicating the connection of the two glaciers at that time. By 1970 Mittel had separated from Grosser, and experienced 420 m of retreat from 1970 to 2000 as noted by the Swiss Glacier Monitoring Network. mittel 1957
Map showing 1957 glacier extent with elevation changes from 1926 in yellow.

Here we examine changes in the glacier using Landsat imagery from 1990 to 2013. In each image an upper and lower green arrow point to the same location where expanding bedrock areas are separating the upper and lower portion of the glacier. Point A is at the lower end of a prominent rock rib. In 1990 the glacier ends at the red arrow separated from Grosser Aletsch by 600 m. At the lower green arrow the glacier is flowing across this slope contributing snow and ice to the lower glacier. In 1999 the area of exposed bedrock between the upper and lower glacier has expanded by at least 500 m at both green arrows. By 2007 Google Earth imagery indicates a continued expansion at the lower green arrow. The glacier terminates at the yellow arrow 1050 m from a connection to the Grosser Aletsch Glacier. The lower 1 kilometer of the glacier is stagnant as seen in the closeup view of the terminus, pink arrow indicates start of stagnant section. In 2013 the glacier has retreated 1400 m from the Grosser Aletsch Glacier, terminating at yellow arrow versus 1990 terminus red arrow. The margin of the Grosser Aletsch has contracted 150-200 m, hence the actual retreat since separation is 1200-1250 m. By 2013 at the lower green arrow the bedrock strip separating this section of the upper and lower glacier has expanded to a length of 1 km. This is equivalent to a company losing income from an important division, or a family losing one income stream. The lower glacier is recieving less snow and ice contribution and will continue to retreat, quickly loseing the stagnant area the comprises the lowest 700-100 m of the glacier. Jouvet et al (2011) reconstruct the behavior of the Aletsch Glacier system to various climate scenarios and find that any scenario leads to 2 km of retreat by 2040 for Grosser Aletsch and somewhat less for Mittelalestch. This glaciers behavior is similar to that of nearby Gauli and Oberaar. mittel 1990
1990 Landsat image

mittel 1999
1999 Landsat image

mittelaletsch ge
2007 Google Earth Image

mittelaletsch profile
2007 Google Earth image

mittel 2013
2013 Landsat image

Cavagnoli Glacier Retreat, Swiss Alps

Ghiacciaio dei Cavagnoli (Ghiacciaio dei Cavagnöö) drains south into Lago dei Cavagnoli (Lago dei Cavagnöö), which is impounded by a dam that was 111 meters high. This hydropower plant provides 174 MW of power. The glacier itself has separated into five separate ice masses that are each melting quickly away. The Swiss Glacier Monitoring Network has observed the annual retreat of this glacier since 1980. A chart of this retreat from the data of the Swiss Glacier Monitoring Network is below. The total retreat of the main ice mass has been 343 meters. The top of the glacier has also been retreating this is a symptom of a glacier that will not survive (Pelto, 2010). The glacier as viewed from below and from directly above in Google Earth Imagery indicates a thin glacier with few crevasses. The five separate ice masses are all indicated by stars. This glacier has no accumulation zone in 2009. This has become a reoccurring pattern for this glacier, and also is a sign of a glacier that cannot survive. This glacier is a small relic of its former mapped extent. when the glacier was a single ice mass. Today the largest ice mass is 0.4 square kilometers and none of the ice masses appear destined for surviving. On the main ice mass there is a meltwater stream from the top to the bottom of the glacier indicating that even the top of the glacier is usually snow free by summer’s end. This glacier is in similar shape to the glaciers in the Rotondo area just to the north

Chüebodengletscher and Ghiacciaio del Pizzo Rotondo, Switzerland nearly gone

Chüebodenhorn is 3,070 meter high in the Lepontine Alps. The Ghiacciaio del Pizzo Rotondo lies at the foot of its north face and Chüebodengletscher is on its south side. Chüebodengletscher is confined to a small cirque, and currently ends in a lake . In several recent years including 2010 the glacier lost all of its snowcover. The glacier is currently 500 meters long and has an elevation range of 75 meters. The lake which fringes the glacier will turn into a circular alpine lake as the glacier melts away. At present the crescent shaped lake is 140 meters wide. The annual layers in this glacier are evident much like tree rings, that the are all emergent at the surface indicates that all the snow and firn that is supposed to cover most of a glacier at the end of the summer, has been lost from all of the glacier. There are at least 75 annual layers evident. The youngest layer (y) is at the top of the glacier and oldest (o) at the bottom.
Ghiacciaio del Pizzo Rotondo is a thin slope glacier. This glacier also has a short elevation span of 80 meters from the terminus to its head in a distance of 500 meters. The glacier is a slope glacier that has little apparent thickness. The glacier will be lost faster than the thicker Chüebodengletscher. Ghiacciaio del Pizzo Rotondo also has lost all of its snowcover, and without a persistent and consistent accumulation zone it cannot survive. These two glaciers are losing mass like many neighboring such as the large Gries Glacier monitored by the In the graph below From the Swiss Glacier Monitoring Network the cumulative mass loss of Gries Glacier has been 20 meters. Swiss Glacier Monitoring Network. This mass loss of Swiss Glaciers led to 86 of the 95 glacier observed to retreat, while six were stationary and three advanced. The lack of an accumulation zone indicates that the glaciers will follow the path of Presena Glacier and Dosde Glacier unlike Oberaar Glacier which retains an accumulation zone.

Oberaar Glacier Retreat and Hydropower

The Oberaar Glacier at the headwaters of the Aare River is one of the key glaciers whose runoff feeds the complex hydropower system built by Kraftwerke Oberhasli (KWO) from the 1930’s thorugh 1979. The Glacier ended in the artificial lake Oberaarsee created by damming the glacier outflow in 1932. Oberaarsee (O) is dominantly a glacier fed reservoir, which is evident in this 2002 image from Jürg Alean This dam is close to two other largely glacier fed reservoirs Grimselsee (G) and Raterichsbodensee (R). The upper watershed of the Aare provides ideal natural conditions for hydropower generation, abundant water, deep broad glacial valleys for water storage and a 1700 m elevation drop from the Oberaarsee down to Innertkirchen. KWO’s constellation of power plants, seven hydro dams, a natural lake and around 130km of water carrying pipes was completed only in 1979. The total output of the KWO system is 1100MW, equivalent of a large nuclear plant. The network that supplies 7% of the hydropower for Switzerland is fascinating as seen in the schematic below from KWO.
Oberaar Glacier has retreated 1500 meters since the building of the dam and now no longer reaches the shores of Oberaarsee. The glacier from 1953-1967 retreated at a rate of 42 meters per year, calving into the lake with the average depth of 17 meters. The presence of the lake enhanced retreat, the glacier velocity was 8 meters per year, while calving retreat was 42 meters per year. The lake did not cause the retreat though, as Gauligletscher the next glacier to the north has experienced a large retreat since 2000. The Swiss Glacier Commission’s retreat history indicate that by the 1970’s the glacier was in shallow water near the edge of the lake and retreat was minor. More recently though the lake is no longer enhancing retreat, the retreat rate has again risen to more than 20 meters per year from 1998-2010. The glacier has retreated 460 meters from the edge of Oberaarsee. By 2013 Landsat imagery indicates the glacier has retreated approximately 1 km from the lake, black arrow indicates terminus and red arrow the end of the stagnant zone. . oberaar 2013 The Swiss Glacier Commission monitored the glacier surface and found the lower section of the glacier below 2700 meters, thinned by 7.3 meters from 2001-2005 representing a volume loss of 13.5 million cubic meters. Given that lower glacier thickness averages somewhere close to 75-100 meters, this was 7-10% of the glacier lost in four years. Compared to the 1960’s the glacier near the terminus has slowed from 8 to 4 meters per year. It is evident that terminus tongue is thin nearly stagnant moving at 2 meters per year in 2005. The glacier thinning is rapid which is also indicated by the degree to which the lateral margin of the glacier is higher due to the higher debris cover. This occurs only during periods of rapid retreat. The retreat will continue due to the recent snow line rise that has reduced the area of the accumulation zone. The glacier has an icefall at 2800 meters and and above this at 3050 meters is a significant consistent accumulation zone; however not large enough to maintain the large lower elevation glacier tongue. This is similar to all Swiss Glaciers, the average mass balance from 2000-2010 has been consistently and substantially negative as reported to the WGMS, -0.8 meters per year. This has led to retreat of 98% of all glaciers in the Alps such as Maladeta, Italyand Ochsentaler in Austria. The Swiss have the best annual terminus survey system and the graph at bottom indicates the percent retreating in red, advancing in blue, and stationary in green. It is clearly a red tide. With glacier area loss the summer melt will decline and summer inflow to Oberaarsee will decline. The total annual inflow is determined by annual precipitation and is not changed by loss of glacier area. This decline in natural glacier storage is one reason KWO is contemplating expanding the reservoir storage of Grimselsee.