Mena Kang West Glacier retreat and lake expansion, Tibet, China


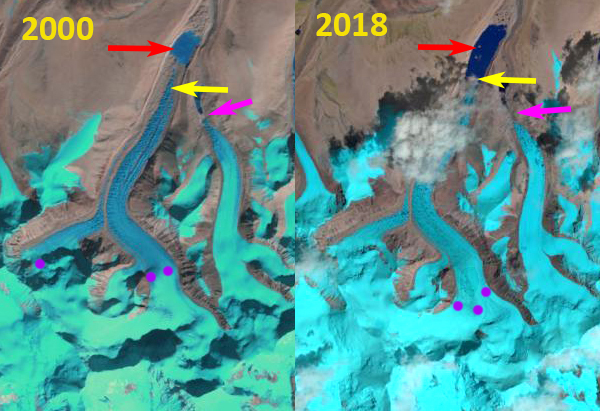
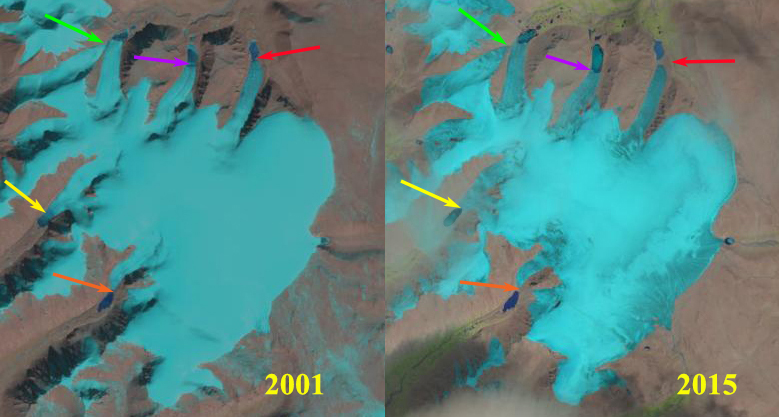
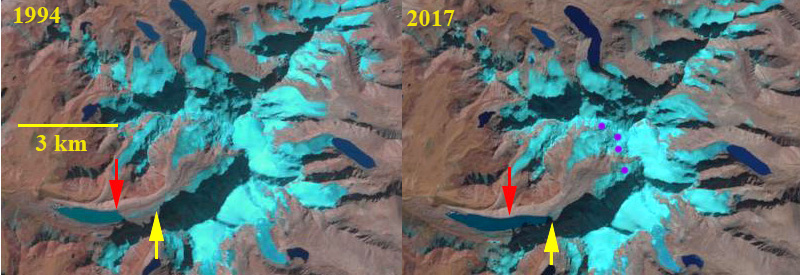
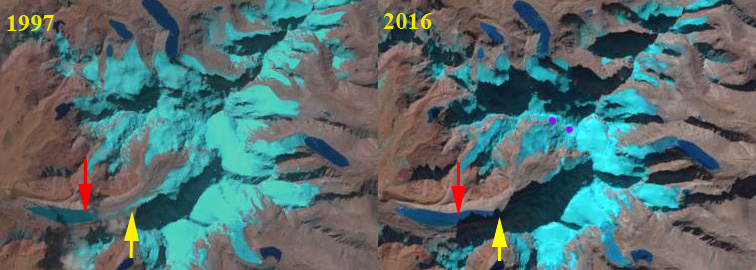
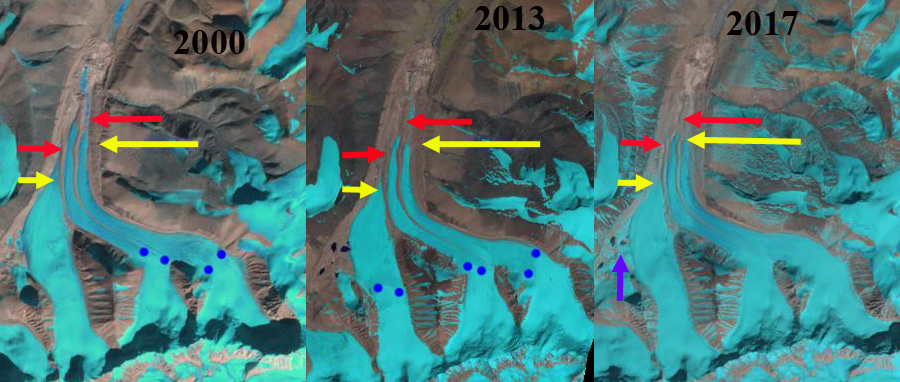
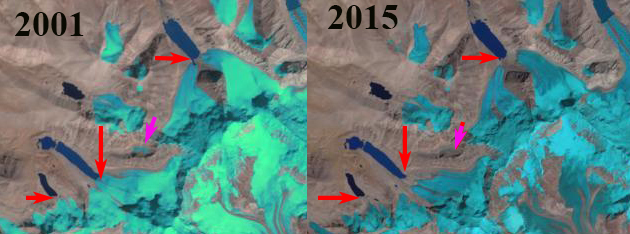
Mena Kang West Glacier in 2002, 2020 and 2021 Landsat images.  Red arrow is the 2000 terminus location, yellow arrow the 2021 terminus location and pink dots the snowline.

“Mena Kang West” Glacier is an unnamed glacier that is to the west of Mena Kang (6140 m) at 28 N, 91.6 W in Tibet, China. The glacier drains into the Nyamjang Chu, which flows south in Arunachal Pradesh, India.  This region has seen the rapid expansion of many proglacial lakes due to glacier retreat. Allen et al (2019) mapped 1291 glacial lakes with an area greater than 0.1 km2, of these 204 posed a glacial lake outburst (GLOF) threat. Nyamjang Chu is not a basin that has experienced a significant GLOF.  This basin does have a proposed hydropower project downstream in Arunachal Pradesh, but the project has not yet begun.  Glacier retreat led to a 20% increase in the number of glacier lakes in the Pumqu region, the adjacent basin to the west (Che et al, 2014).

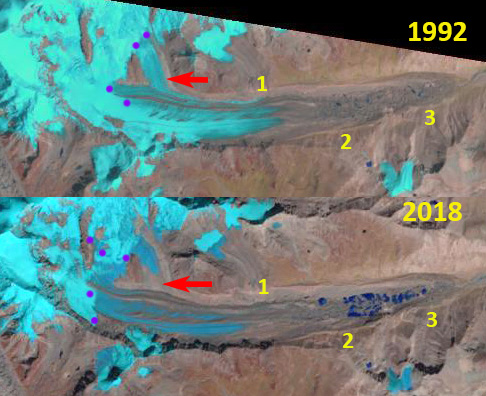
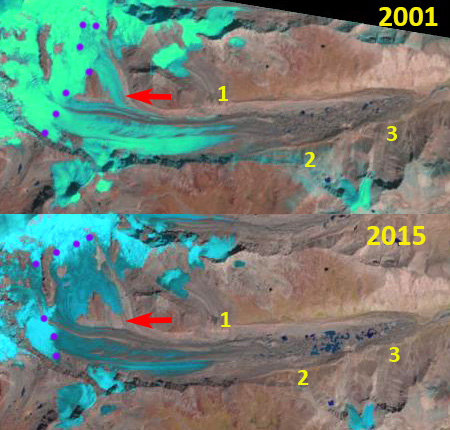
In 2000 the glacier terminates, at ~4820 m, in a 400 m long glacial lake with an area of 1.6 km2. The snowline is near the top of an icefall at 5300 m. In late October 2002, the snowline is at 5100 m, the lake area is 1.7 km2. By 2016 the glacial lake has expanded to 1000 m in length, the terminus is just below a crevassed area (C), indicating the calving front is leading to an acceleration of the glacier near its terminus. The snowline is at the top of the icefall at ~5300 m. In October 2020 a snowstorm has lowered the snowline to 5000 m.  A warm dry early winter and particularly January throughout the region (NASA, 2021), has led to the snowline have risen and remained high at 5300-5400 m from January 16 -January 28, 2021. This is a summer accumulation glacier receiving the bulk of its snowfall in summer, but winter is supposed to be a period with some snowcover and limited ablation.  That was not the case in the snow free winter to the end of January in 2020/21 (Pelto, 2021). By 2020 the glacier has retreated 600 m since 2000 and the lake area has expanded to 0.3 km2. The high snowlines in recent years have been driving further retreat as noted at other glaciers in the area; Shie Glacier and Bailang Glacier.

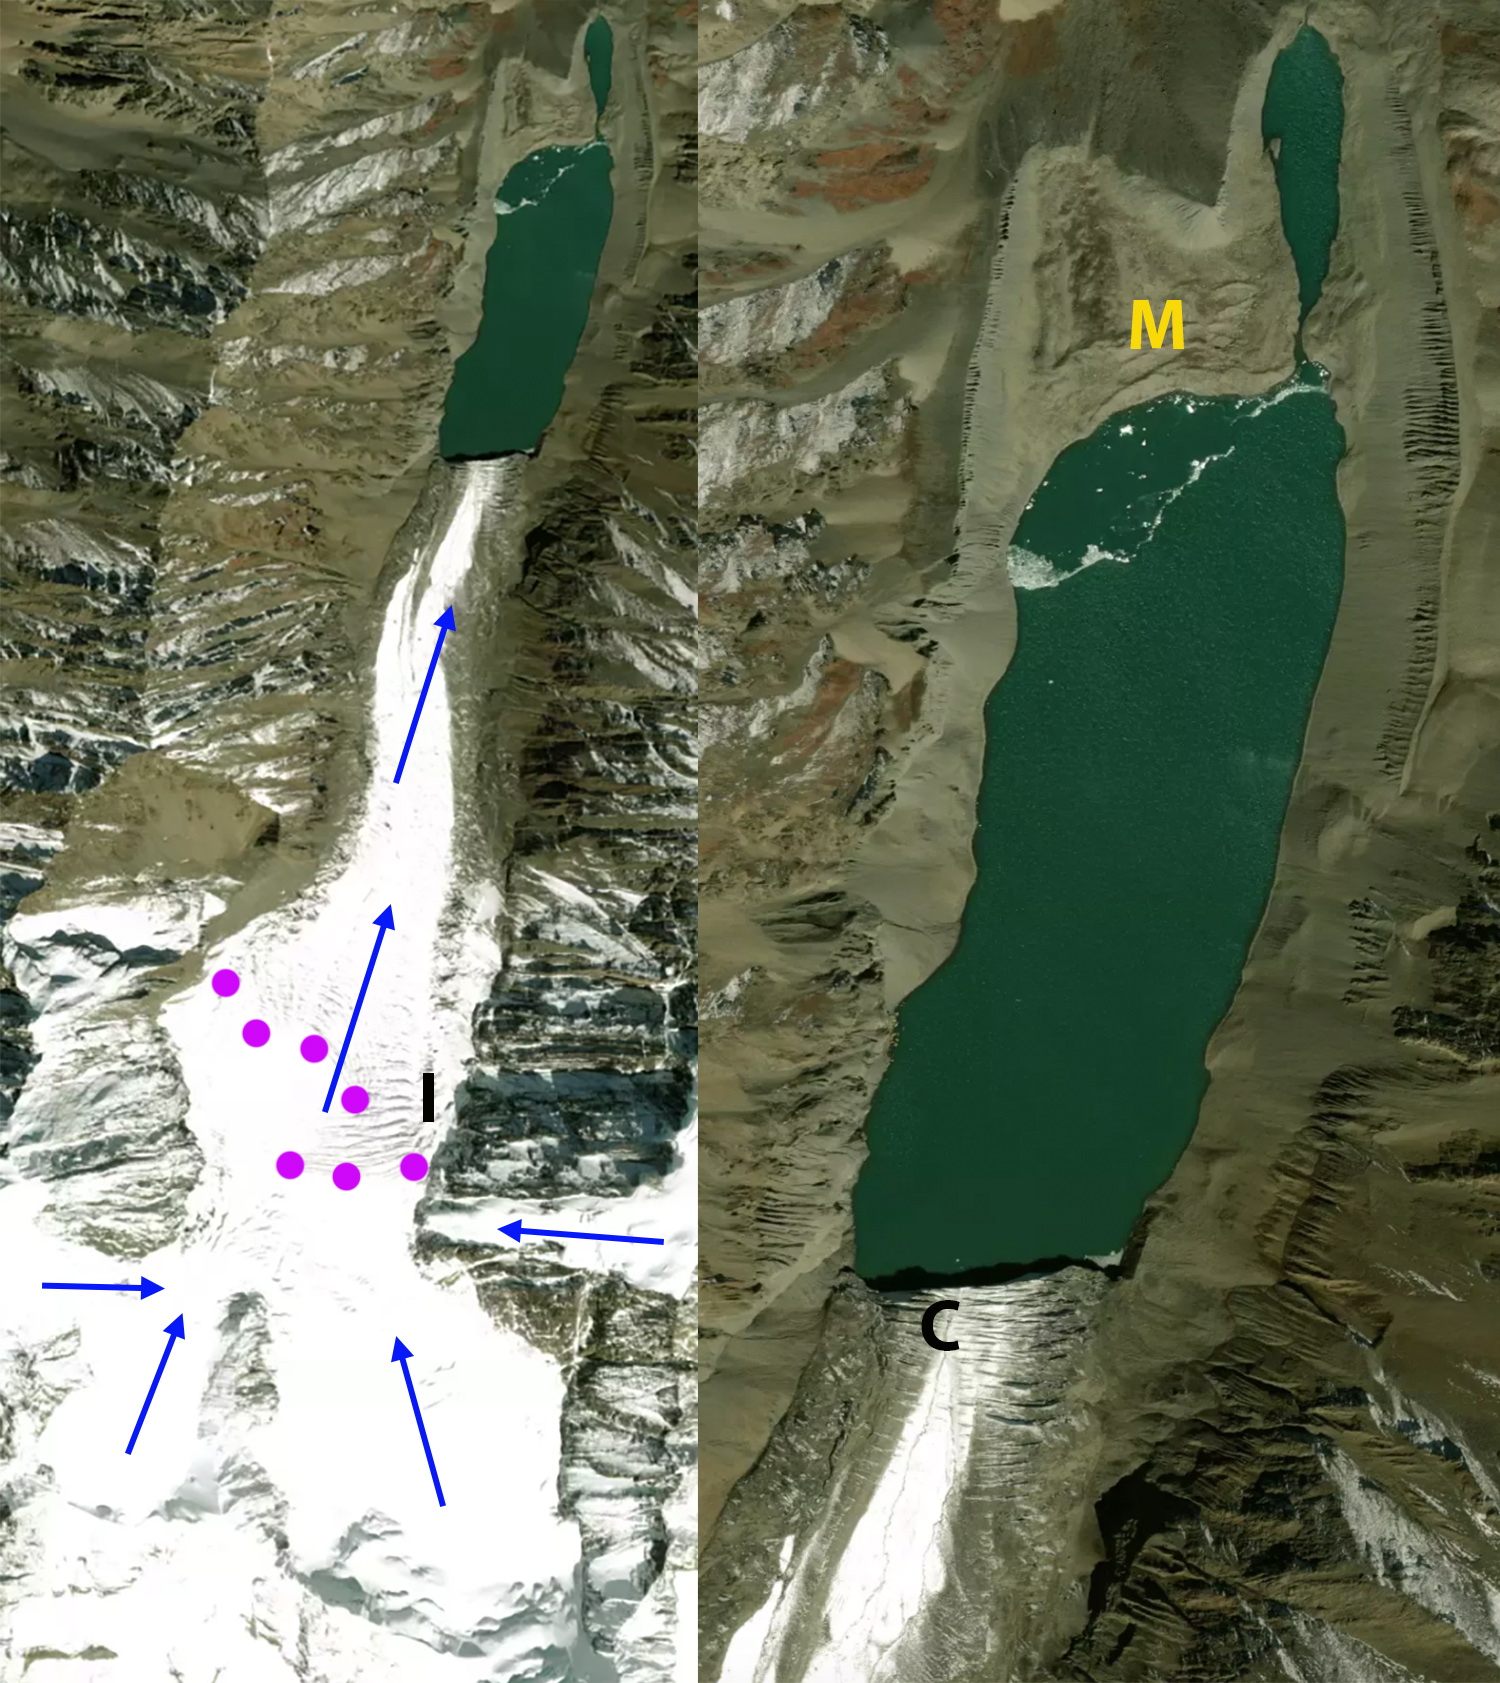
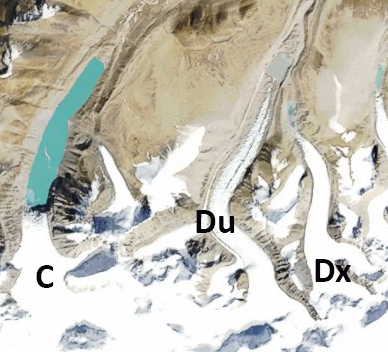
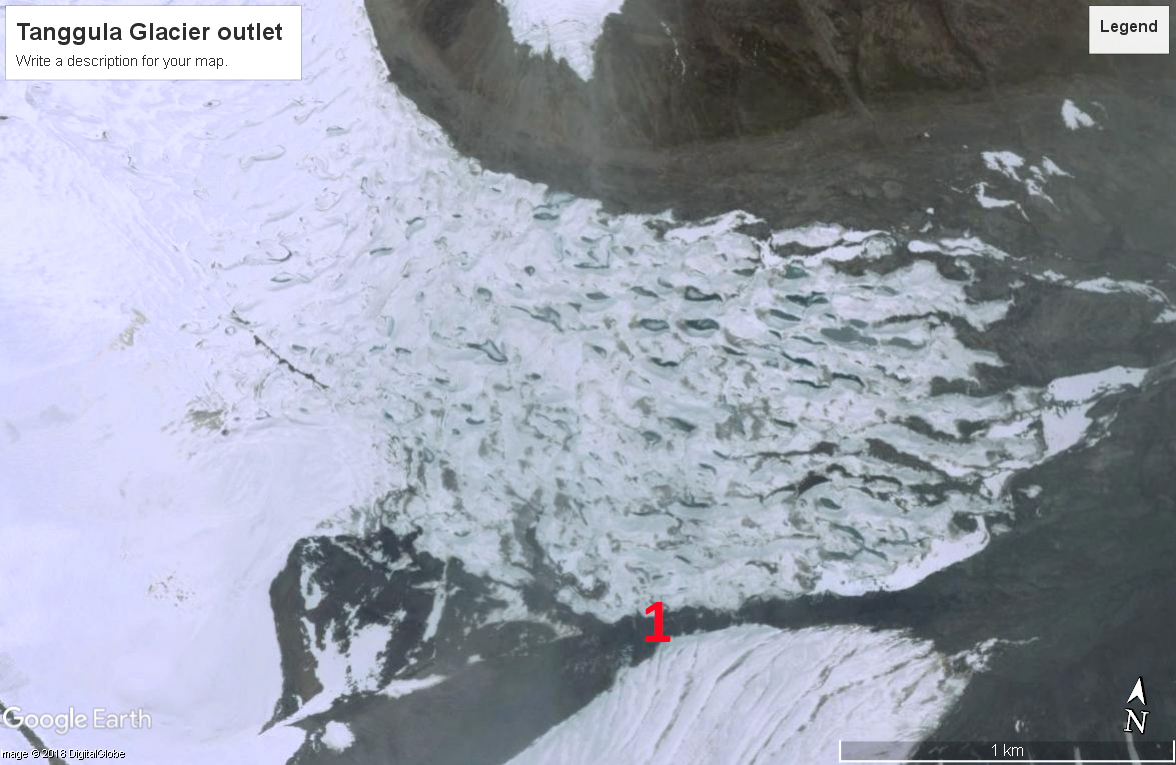
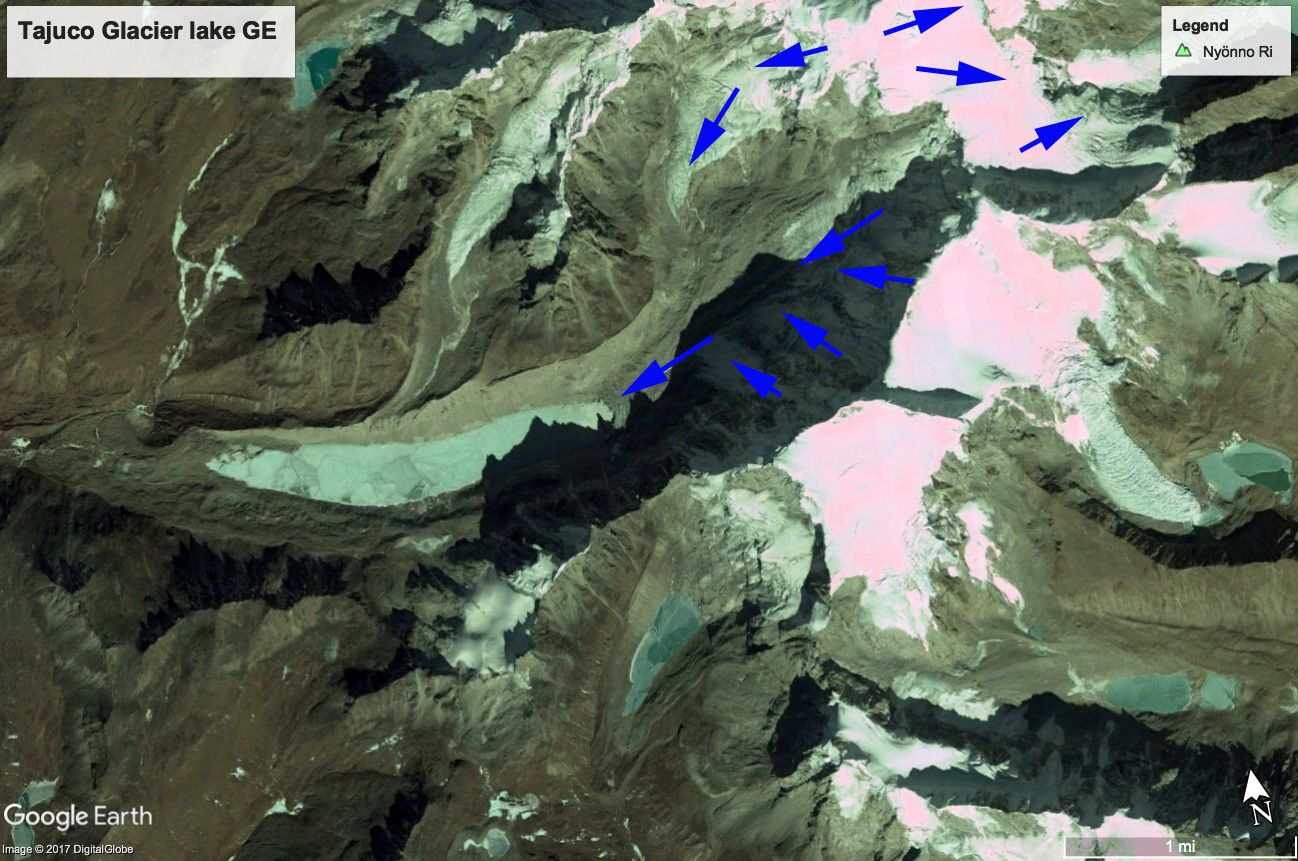
Digital Globe imagery  from 2018 of Mena Kang West Glacier illustrating the Icefall (I) at ~5300 m, the terminus crevasse zone (C), flow directions (blue arrows), snowline (pink dots) and recessional moraines (M). 

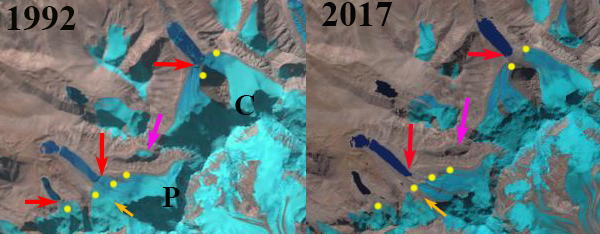
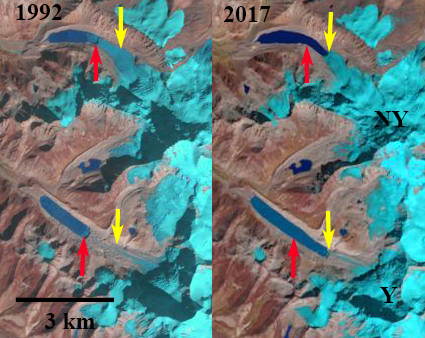
Mena Kang West Glacier in 2000 and 2018 Landsat images and a 2021 Sentinel image.  Red arrow is the 2000 terminus location, yellow arrow the 2021 terminus location and pink dots the snowline.


Jiemayangzong Glacier, Tibet Retreat, Separation and Lake Expansion 1991-2020

Jiemayangzong Glacier in 1991 and 2020 Landsat images.  The red arrow is the 1991 terminus location, yellow arrow is the 2020 terminus location and purple dots mark the snowline. Point A indicates a tributary that has disconnected, while bedrock expanded at Point B. 

Jiemayangzong Glacier drains east from 6200 m peaks along the Nepal-China border. The glacier ends in a lake- Jiemayangzong Tso. Ren et al (2016)  identify this as the headwaters of  the Yarlung Tsangpo (Zangbo), which becomes the Brahmaputra River. The Zangmu hydropower project was completed on the river in 2015, it is a 510 MW project. Here we examine Landsat and Google Earth imagery from the 1991-2014 period. This is a region where Li et al (2011) noted that increasing temperature during the 1961-2008 period, especially at altitude, led to the retreat of glaciers and expansion of glacial lakes in this region. Liu et al (2011) noted that this glacier’s area has decreased 5%, retreating 768m ( 21 m/year), leading to lake expansion of ~64% during the 1974-2010 period.

In 1991 the lake was 1.1 km long, the snowline was at 5500 m near the elevation where the northern tributary joined at Point A.  In 1998 the snowline was at 5600 m, the glacier had not retreated appreciably.  In 2017 tributary A no longer is connected to the main glacier, the snowline is at 5600 m and the lake has expanded to a length of 1.9 km.  In 2020 the snowline in mid-September, with the melt season still going, is at  5700 m. The glacier has retreated 1000 m from 1991-202o a rate of  ~33 m/year. The lake is now 2.1 km long and has an area of  1.3 km2.  The glacier has a wide stable moraine belt (M) and does not pose a GLOF threat. Immediately downstream of the lake is a 10 km2 braided valley/wetland area (W) as well that would mitigate any potential flood hazard. This glaciers retreat is similar to many others draining north into Tibet from the Himalayan crest, Chako Glacier, West Ganglung Glacierand Asejiaguo Glacier

Jiemayangzong Glacier in 1998 and 2017 Landsat images.  The red arrow is the 1991 terminus location, yellow arrow is the 2020 terminus location and purple dots mark the snowline. Point A indicates a tributary that has disconnected, while bedrock expanded at Point B. 

Jieayangzong Glacier (JG) in 2015 Digital Globe image indicating the expanding proglacial lake (JL), moraine belt (M) and large wetland (W)

Drogpa Nagtsang Glacier, China Mass Balance Loss, Separation, Slow Down

Drogpa Nagtsang Glacier change in Landsat image from 1989 and 2018.  Yellow arrow indicates 2018 terminus location, red arrow 1989 terminus location, red dot the lowest elevation of clean glacier ice. Points A-E are the same locations for comparison.

Drogpa Nagtsang Glacier, China is a glacier that is 30 km west of Mount Everest that terminates in an expanding proglacial lake. The glacier begins on the Nepal border at 6400 m, and its meltwater enters the Tamakoshi River. The Upper Tamakoshi Hydropower project is a 456 MW peaking run of river  is a hydropower project on the Tamakoshi that is to be finished in 2019.  King et al (2017) observed the mass balance of 32 glaciers in the Mount Everest area including Drogpa Nagtsang and found a mean mass balance of all glaciers was −0.52 m water equivalent/year, increasing to -0.7 m/year for lake terminating glaciers. Dehecq et al (2018) in an exceptional paper examined velocity changes across High Mountain Asia from the 2000-2017 period identifying a widespread slow down in the region.  The key take away is the same we see for alpine glaciers around the globe, warming temperatures lead to mass balance losses, which leads to velocity slow down, Mass balance is the key driver in glacier response, a sustained negative mass balance leads to thinning, which leads to a glacier velocity declines whether the glacier is in the Himalaya, Alps or Andes. This study simply could not have been completed without the availability and affordability of Landsat imagery.  Here we look at one example in the region that highlights the important findings.

In 1989 Drogpa Nagtsang Glacier had a substantial number of coalescing supraglacial ponds on its relatively flat stagnant debris covered terminus.  At Point A the former tributary is are no longer contributing to the main glacier, while at B, C, D and E there is a still a contribution.  The snowline in 1989 is at ~5450 m.  The clean glacier ice extends almost to the tributary glacier at Point B at 5200 m, red dot. In 1992 the supraglacial ponds have further expanded, but a true proglacial lake has not formed. The snowline is at~5500 m. Quincey et al (2009) observed flow of less than 10 m/a in lower 5 km of glacier in 1996 and peaking at 20-30 m/a 8 km from terminus. By 2015 a 2.7 km long lake has developed.  The clean glacier ice now extends just past Point E at 5350 m.  The snowline is at 5600 m. The tributaries at Point B, C and E no longer reach the main glacier.  At Point D the medial moraines indicate that flow from this tributary has been reduced and now is a smaller contributor to the valley tongue. In 2018 the clean glacier ice extends to just 5400 m.  The lake has expanded to a length of 2.9 km indicating a retreat of the same distance from 1989-2018.  The snowline is exceptionally high at 5700 m. The former tributaries at B, C and E have also markedly retreated away from the main glacier. Only the tributary at Point D is still contributing to the main glacier. The high snowline observed in recent years are an indication that mass balance losses are even larger in this region, which causes further thinning, reduction in velocity, retreat and expansion of debris cover.  King et al (2018) observed the thinning and velocity profile on Drogpa Nagtsang and noted the velocity decreased over time and was stagnant in the debris covered zone, thinning occurred along the entire profile, which began close to the ELA. The stagnant nature of the terminus tongue is evident in the Digital Globe image below from 2017.  The red arrows show a deeply incised supraglacial stream that is over 2 km long, that would only develop on stagnant ice.  This process has played out on other nearby glaciers such as Yanong Glacier  and Lumding Glacier.  The high snowlines have also been observed at the nearby Nup La on Ngozumpa Glacier in recent years and on many glaciers in the Mount Everest region in recent winters such as in 2018.  This indicates continuing mass losses through a greater period of the year.

Drogpa Nagtsang Glacier change in Landsat image from 1992 and 2015.  Yellow arrow indicates 2018 terminus location, red arrow 1989 terminus location, red dot the lowest elevation of clean glacier ice. Points A-E are the same locations for comparison.

Digital Globe image with yellow dots indicating terminus, red arrows a supraglacial stream, blue arrows ice flow direction.  B is the same tributary has noted in the Landsat images above.

Lapche Glacier, China Supraglacial Ponds Transitioning to Lake

Lapche Glacier (Tibet 1), China in 1992 and 2018 Landsat images.  The expansion of supraglacial ponds is evident between Point 2 and 3. A tributary that detaches between 1992 and 2018 is indicated by red arrow.  The end of the clean ice and start of debris cover ice is just below Point 1 in 1992 and well above this Point in 2018. 

Lapche Glacier (Tibet 1), China flows east from Lapche Kang (Lobuche Kang) in the Bum Chu River Basin. King et al (2017) examined the mass balance of 32 glaciers in the Everest region for the 2000-2015 period including the Lapche, which they called Tibet 1, and found a mass loss of ~0.5 m/year, with the loss of lake terminating glaciers at ~-0.7 m/year.  King et al (2017) also observed that a number of these glaciers had nearly stagnant tongues with coalescing and expanding supraglacial ponds. Here we examine the expansion of the supraglacial ponds from 1992 to 2018 using Landsat images.

The lower four kilometers of Lapche Glacier in 1992 is relatively flat with the terminus at 5100 m and four kilometers upglacier at just 5200 m. In this stretch there are several small isolated supraglacial ponds between Point 2 and 3.  At Point 1 is the end of the clean ice section of the glacier, with debris cover obscuring the underlying ice below this point. There is a tributary joining the glacier at the red arrow. In 2001 the snowline is at 5600 m, and there are a few more supraglacial ponds, but with a total surface area under 0.1 square kilometers.  In 2015 the tributary at the red arrow has detached and the area covered by ponds has expanded and now cover ~0.5 square kilometers.  The snowline in 2015  is at 5650-5750 m. In 2018 the supraglacial ponds have largely coalesced, and have an area of ~1.0 square kilometers.  These lakes are on the verge of creating one larger lake as has happened on Rongbuk Glacier .  The debris covered portion of the glacier now begins above Point 1, 1 km upglacier of its 1992 location.  The snowline in 2018 is at 5650-5750 m.

King et al (2018) indicate a velocity of less than 10 m/year in the lower 5 km of the glacier, essentially stagnant.  Point 1 is just over 6 km above the 1992 terminus. The retreat here is difficult to discern, but with the proglacial lake development it will soon be identifiable and in line with that of other glaciers in the area Duiya and Yanong.   Zhang et al (2010) observed the loss of glacier area and lake expansion in the region from 1976-2006 driven by warming.

Lapche Glacier (Tibet 1), China in map view.  Point 1-3 same as in images, ice flow indicated by blue arrows, elevation contours labelled at 51oo and 5200 m. Debris cover beginning noted at DC.

Lapche Glacier (Tibet 1), China in 2001 and 2015 Landsat images.  The expansion of supraglacial ponds is evident between Point 2 and 3. A tributary that detaches between 2001 and 2015 is indicated by red arrow.  

High Glacier Snow Line Post-Monsoon 2018 on Bhutan-China Border

Angge Glacier (A) and Bailang Glacier (B) in China and Chubda Glacier (C) in Bhutan in Post Monsoon 1995 and 2018 Landsat images indicating the snowline purple dots is exceptionally high in 2018.  Red arrow is the 1995 terminus location and yellow arrows the 2018 terminus location. Point 1-3 are glacier passes from China into Bhutan.

The end of the monsoon season leads to finally some clear satellite images of snowlines and glaciers in the Himalaya.  A Landsat image from September 12, 2018 along the China-Bhutan  indicates high snowlines (5500 m) that reach the top of some glaciers and the glacier divide between nations on other glaciers.

Bailang Glacier and Angge Glacier, China are adjacent to the Chubda Glacier, Bhutan.  A These glaciers drain north and south from near Chura Kang on the Bhutan/China border.  Despite being in different nations on different flanks of the Himalaya, the retreat and resultant lake expansion is the same. These are all summer accumulation type glaciers that end in proglacial lakes.  All three lakes are impounded by broad moraines that show no sign of instability for a potential glacier lake outburst flood.  The number of glacier lakes in the region has increased 20%  (Che et al, 2014)   The Chubda Glacier terminates in Chubda Tsho, a glacier moraine dammed lake, Komori (2011) notes that the moraine is still stable and the lake is shallow near the moraine, suggesting it is not a threat for a glacier lake outburst flood.  Jain et al., (2015) noted that in the last decade the expansion rate of this lake has doubled. The glacier feeds the Chamkhar Chu Basin.

Here we examine 1995-2018 Landsat images from the post monsoon period to identify both retreat and the anomalously high snowlines in 2018.  In 1995 the highest observed snowline is at 5300 m, purple dots, Point 1 -3 are glacier passes from China into Bhutan that are snowcovered.  The glaciers terminate at the red arrows.  In 2000 the highest observed snowline is 5250-5300 m. There is limited retreat since 1990. In 2017 the highest observed snowline is at 5300-5350 m.  In 2018 the highest observed snowline is at 5500-5550 m.  The glacier passes at Point 1 and 2 lack any snowcover.  The glaciers at Point 3 have no retained snowcover despite top elevation above 5400 m.  Bailang Glacier has retreated 900 m from 1995 to 2018 that has led to lake expansion.   A retreat 1995-2018 retreat of 800 m of Angge Glacier has led to lake expansion.  A retreat of Chubda Glacier of 800 m  has led to lake expansion from 1995-2018 has led to lake expansion. 

2000 Landsat image from the post monsoon indicating the snowline purple dots.  Red arrow is the 1995 terminus location  Point 1-3 are glacier passes from China into Bhutan.

2017 Landsat image from the post monsoon indicating the snowline purple dots.  Red arrow is the 1995 terminus location  Point 1-3 are glacier passes from China into Bhutan.

Sept. 12 2018 Landsat image indicating the snowline purple dots is exceptionally high in 2018.  Red arrow is the 1995 terminus location and yellow arrows the 2018 terminus location. Point 1-3 are glacier passes from China into Bhutan.

Duiya Glacier, China Retreat Drives Lake Expansion

Duiya Glacier, China in 1990 and 2017 Landsat images.  Red arrow indicates 1990 terminus, yellow arrow the 2017 terminus, pink arrow the terminus area of Duosangpuxi purple dots the snowline

Duiya Glacier, China is in the Pumqu Basin northwest of Mount Everest.  The glacier terminates in an expanding lake.  King et al (2018) report the proglacial lake is dammed by a full moraine loop, and the glacier loses mass via calving as and surface melt.  Here we use Landsat imagery to identify changes from 1990-2018. The Pumqu River becomes the Arun River in Nepal , which has a proposed 900 MW hydropower plant under development .

In 1990 the glacier terminated in a small proglacial lake, 500 m across at 5500 m.  The snowline in 1990 was at 6000 m.  The Duosangpuxi Glacier to the east also terminates in a proglacial lake.  In 2000 the lake has expanded to 800 m in length due to retreat.  The glacier snowline is at 6000 m again.   The Duosangpuxi Glacier to the east has retreated from the lake it formerly terminated in.  By 2017 the glacier had retreated 1020 m a rate of 37 m/year. The lake is now over 1.5 km long.  The snowline in 2017 is at 6200 m.  In September 2018 the snowline has likely not reached its highest elevation but is just below 6200 m.  The terminus is obscured by clouds, but has not changed significantly from 2017.  There icebergs in the lake indicating calving continues.  The high snowline in recent years indicate continued mass loss that will drive further retreat.

King et al (2017) examined the mass balance of 32 glaciers in the Everest region for the 2000-2015 period including the Duiya and found a mass loss of ~0.5 m/year, with the loss of lake terminating glaciers at ~-0.7 m/year.  The retreat of this glacier is like that of Yanong Glacier and Chaxiqudong Glacier whereas Rongbuk Glacier has experienced supraglacial lake expansion, and thinning without as much retreat.

Duiya Glacier, China in 2000 and 2018 Landsat images.  Red arrow indicates 1990 terminus, yellow arrow the 2017 terminus, pink arrow the terminus area of Duosangpuxi purple dots the snowline.

Broader view of the Duiya Glacier (Du) and neighboring glaciers Cuolangma (C) and Duosangpuxi (Dx), each terminating in a lake in 1990. 

Mount Tanggula Glaciers, China Thin and Separate

Changes in outlet glaciers of Tanggula Shan in Landsat images from 1993 and 2015. 

The Tanggula Shan is in the Qinghai-Tibet Plateau at the headwaters of the Yangtze River and host approximately 1000 square kilometers of glaciers. Ke et al (2017)  examined glaciers in the Dongkemadi Region of the Qinghai-Tibet Plateau revealed glacier thinning of 0.56 m/year from 2003-2008.  The area loss of  −0.31 km2/ year from 1976-2013, a 13% change int total area of the glaciers.  Chao et al (2017) examined glaciers in the Geladandong region of the Qinghai-Tibet Plateau and found thinning rates of 0.16 m/year from 2003-2009.  The thinning was a consequent of temperature increases. Inglis (2016)  reported on the ongoing retreats impact on water resources for the Yangtze River.

Here we examine Landsat imagery from 1993-2017 to identify changes at five locations around the Tanggula Icefield. In 1993 outlet glaciers merge at Point 1 and 2. At Point 2 there is a narrow separation between two outlet glaciers. At Point 4 and 5 there is considerable terminus recession of the stagnant hummocky ice (developed in a sublimating environment). Below is a Google Earth image of the glacier at Point #1 illustrating the hummocky nature, Inglis (2016)  also provide imagery of this hummocky ice. In 2015 the snowline is high at 5900 m,  in this early November image.  The terminus of most glaciers is at 5400 m and the head of the glaciers at 6100 m. In November of 2017 the snowline is at 5600 m.  The retreat has been significant, but not rapid in this area. This is similar to the retreat of the Suhai Hu Ice Cap in the Qilian Mountains.

Changes in outlet glaciers of Tanggula Shan in Landsat images from 1995 and 2017. 

Google Earth image of Tanggula Glacier outlet, Point #1. 

Suhai Hu Ice Cap, China Outlet Glacier Retreat

Suhai Hu, Quilian Mountains Ice Cap in 1999 and 2016 Landsat image indicating five different outlet glacier termini that all ended in proglacial lakes in 1999 and all retreated significantly by 2016. 

Here we examine an unnamed icecap that I refer to as the “Suhai Hu” Ice Cap and five of its largest outlet glaciers in the Qilian Mountains in northwest China, with Landsat imagery from 1999-2016.  The northern outlet glaciers drain into the Suhai Hu and the southern outlet glaciers into Quidam Hu. Glaciers in the Gansu Province have shrunk by 36 square kilometers, a 4.2 percent loss, during the past decade Quiang (2016).  Tian et al (2014) report Qilian Mountain glacier area shrank by 30% from 1956 to 2010 and the shrinkage accelerated remarkably in the past two decades.  Yang et al (2015)  Results show that mountain glaciers in China are very vulnerable to climate change with 41% of glaciers having had a high vulnerability in the period 1961–2007.

In 1999 all five outlets, indicated by arrows terminate in proglacial lakes, with the northwest outlet comprise of two tributaries that join just above the terminus.  In 2001 the outlets still terminate in glacier lakes.  By 2015 two of the outlet glaciers at the orange and red arrow have retreated from the proglacial lakes they had terminated in.  The northwest outlet glacier, green arrow, the tributaries had separated.  From 1999 to 2016 the proglacial lake at the purple arrow has expanded from 600 m in length to 850 m.  The lake at the yellow arrow expanded from 450 m in length to 850 m in length from 1999-2016. each of the five outlet glaciers has retreated significantly from 1999-2016.  All 8 summer Landsat images examined indicate the ice cap always has substantial retained snowcover, and will not disappear with current climate. In a close up view of the terminus of the yellow outlet glacier there are prominent crevasses near the calving ice front, green arrow and supraglacial streams , blue arrows. The retreat here is similar to but less than that observed at Gangg’er Glacier in the Shule River Basin, Qilian Mountains. 

Suhai Hu, Quilian Mountains Ice Cap in 2001 and 2015 Landsat image indicating five different outlet glacier termini that all ended in proglacial lakes in 2001 and all retreated significantly by 2015.


Google Earth image at the yellow outlet glacier. Green arrow indicates crevassing near front and blue arrows supraglacial streams. 

Tajuco Glacier Lake, China Expands with Glacier Retreat

Tajuco Glacier terminating in Tajuco Lake retreat in 1994 and 2017 Landsat comparison. Red arrow is 1997 terminus location, yellow arrow is the 2017 terminus location and the purple dots are the snowline in 2017. 

Tajuco Glacier Lake is a moraine dammed glacier lake in the Tingri district of China.  It drains into the Amur River which flows south into Nepal. Shijin et al (2015) reported on the expansion of the lake from 1990 to 2010 expanding from 0.65 square kilometers to 1.14 square kilometers.  They further reported that the Chinese Himalaya had 329 moraine dammed glacier lakes greater than 0.02 square kilometers in area, 116 of these posing a potential hazard, average size of 0.4 square kilometers. The number of lakes across the region is increasing (Kathmandu Post, 2017), though the number of GLOF’s has not.  The greater volume of expanding lakes puts more pressure on the moraine, the moraines if they have any ice core or permafrost can also weaken,  The moraines with time and distance from the glacier also can consolidate and become more stable.

In 1994 Tajuco Lake was 1.85 km long and had an area of about 0.7 square kilometers.  The snowline was at 6400 m.  In 1997 glacier retreat had led to an expansion of the lake to 2.05 km.  By 2016 the glacier retreat had led to expansion of the lake to a length of 3 km.  The snowline is at 6500 m near the crest of the glacier.  By 2017 the glacier had retreated 1200 m from 1994 to 2017, a rate of 24 m/year. The snowline was again at 6500 m near the crest of the glacier.  The high snowline indicates a glacier that will not survive. retreat will continue to expand the lake.  It is likely based on the Google Earth imagery below that the lake will not increase by more than 500 m in length, area in 2017 is 1.20 square kilometers. The retreat and lake expansion is similar to that of other glaciers on the north side of the Himalaya Range in China; Chaxiqudong Glacier, Chutanjima Glacier and Yanong Glacier. The high snowlines have been observed on nearby Rongbuk Glacier at Nup La and on Gangotri Glacier.

Tajuco Glacier terminating in Tajuco Lake retreat in 1997 and 2016 Landsat comparison. Red arrow is 1994 terminus location, yellow arrow is the 2017 terminus location and the purple dots are the snowline in 2016. 

Google Earth image of Tajuco Glacier illustrating flow. 

Zhongni Glacier Retreat, China and Hydropower

Zhongni Glacier changes from in Landsat images from 1994 to 2015. The red arrow is the 1994 terminus, yellow arrow the 2015 terminus, purple dots the snowline and purple arrows lakes adjacent to the margin of the western glacier in 1994.

Zhongni Glacier is 15 km northwest of Gangotri Glacier just across the border into China.  The glacier drains in to the Langgen Zangbo, which becomes the Sutlej River in India. The Sutlej River has a 1000 MW  Karcham Wangtoo hydropower plant and a 300 MW Baspa hydropower plant (see below). 

The glacier is comprised of three main tributaries separated by two prominent medial moraines.  The width of the medial moraine extending to the main terminus is over 200 m. Here we use Landsat imagery to identify the glacier changes from 1994 to 2017.

The western tributary acts as a separate glacier and in 1994 has several adjacent small melt lakes, purple arrow terminating with a narrow band of ice at the red arrow.  The snowline is at ~5900 m.  The eastern two tributaries extends 700 m  further downvalley before terminating. In 2000, there has been retreat of 100-200 m of the western tributary and main glacier, and the snowline is at 5750 m.  In 2013 the snowline is at 5800 m.  In 2015 the snowline is at 5750 m.  By 2015 the western tributary margin has receded from the lakes at the purple arrow. The snowline in 2015 is at 5750 m.  In each case the images are far from the fall and the snowline during the post-monsoon season is not the highest elevation.  In 2017 there is new snowfall in late November obscuring the snowline.  Overall retreat from 1994-2015 of the eastern tributary has been 500 m and of the western tributary 900 m.  The western tributary has also lost 200 m of width at the purple arrow. On nearby Gangotri Glacier, India it has been observed that the ablation season has been extending through fall into early winter. The retreat is less pronounced than glaciers terminating in pro-glacial lakes such as Chutanjima Glacier

Zhongni Glacier changes from in Landsat images of 2000, 2013 and 2017. The red arrow is the 1994 terminus, yellow arrow the 2015 terminus, purple dots the snowline and purple arrows lakes adjacent to the margin of the western glacier in 1994.

Zhongni Glacier in 2012 with the snowline at 5900 m in Digital Glacier imagery. Purple arrows indicate medial moraines.

The Karcham Wangtoo Hydropower (lower yellow arrow) and Baspa Hydropwer station (upper yellow arrow) which both have small reservoirs.

Chaxiqudong Glacier, Tibet Retreat From Lake & Tributary Separation

Chaxiqudong Glacier (C) at right and Paqu Glacier (P) at left in Landsat images from 1992 and 2017.  The red arrow indicates the terminus in 1992 and the yellow dots the 2017 margin.  Purple arrow indicates a glacier that disappeared and orange arrow separation of Paqu Glacier. Both glaciers no longer reach the lake. 

Chaxiqudong Glacier and Paqu Glacier are located in a sub-range north of the Nepal-China border.  Chaxiqudong Glacier is adjacent to Longmiojian Glacier. The glaciers drain into Nepal entering the Bhote Khosi River.  The Bothe Khosi had a hydropower project that has been put out of service by a 2015 earthquake and 2016 flood event.    King et al (2017) observe significant surface lowering in the ablation zone of both glaciers (Figure 2), though less than on neighboring larger glaciers.  Zhang et al (2010) observed the loss of glacier area and lake expansion in the region from 1976-2006. Here we examine Landsat imagery from 1992 to 2017 to observe changes. 

Chaxiqudong Glacier terminus in 1992 is in a proglacial lake at the junction of a pair of tributaries red arrow). Paqu Glacier has a wide terminus in a proglacial lake (red arrow).  By 2001 Chaxiqudong Glacier has separated with the eastern tributary still at the margin of the proglacial lake and the western tributary having receded from the lake. Paqu Glacier still is in contact with the lake on a narrow front on the west margin of the lake. By 2015 both tributaries of the Chaxiqudong Glacier have receded significantly from the lake.  Paqu Glacier has retreated from the lake and has separated into two sections, orange arrow.  By 2017 Chaxiqudong Glacier has retreated 400 m since 1992, no longer terminates in a lake and has separated into two glaciers (yellow arrow).  Paqu Glacier has retreated 5oo m no longer terminates in a lake and has separated into two glaciers (yellow arrow).  The retreat of each glacier has occurred without significant calving indicating a retreat driven by negative surface mass balance.  The retreat is less than on the larger Yanong and North Yanong Glacier to the east that also end in lakes still. The retreat of these glaciers from the lakes also reduces the threat of glacier lake outburst floods, as both the risk of  calving and avalanches caused rapid water level change have declined. At the purple arrow is a small cirque glacier in 1992.  This glacier still exists in 2001, but has disappeared by 2015. 

Chaxiqudong Glacier at right and Paqu Glacier at left in Landsat images from 2001 and 2015.  The red arrow indicates the terminus in 1992.  Purple arrow indicates a glacier that disappeared. Both glaciers no longer reach the lake. 

Yanong Glacier, Tibet Retreat Lake Expansion 1992-2017

Yanong Glacier and North Yanong glacier in Landsat images form 1992 and 2017.  Red arrows indicate 1992 terminus and yellow arrows the 2017 terminus. 

Yanong Glacier  and North Yanong Glacier drain northwest from the western flank of Cho Oyu on the Nepal-China border and are in the Tama Khosi watershed.  The glacier terminates in an expanding proglacial lake like a number of neighboring glaciers Drogpa NagtsangRongbuk Glacier and Lumding Glacier King et al (2017) observe that both Yanong and North Yanong have had large negative balances of -.76 m/year and -0.62 m/year respectively.  They also note surface lowering of 3 m per year in the lower ablation zone.  Zhang et al (2010) observed the loss of glacier area and lake expansion in the region from 1976-2006. Here we examine Landsat imagery from 1992 to 2017 to observe changes.

In 1992 the Yanong Glacier and North Yanong Glcier terminate at the red arrows.  The proglacial lake at Yanong is 1.7 km long and is 1.3 km long at North Yanong. By 2001 significant retreat of 200-200 m has occurred on each glacier.  By 2015 Yanong Glacier has retreated east of the a former tributary from the north. The North Yanong glacier is now wider at the terminus than in 2001. In 2017 the proglacial lake at Yanong Glacier is 2.8 km long indicating a retreat since 1992 of 1100 m.  The North Yanong Glacier proglacial lake is 2.1 km long indicating a retreat since 1992 of 800 m.  The steep crevassed nature of North Yanong Glacier right to the terminus suggests the glacier is nearing the end of the lake basin.  The Yanong Glacier has a low slope terminus area that suggests the lake will continue to expand.  The Upper Tamakoshi Hydropower project is a 456 MW peaking run of river  is a hydropower project on the Tamakoshi that is just to be finished in 2018.

Yanong Glacier and North Yanong glacier in Landsat images form 2001 and 2015.  Red arrows indicate 1992 terminus and yellow arrows the 2017 terminus. 

Digital Globe image of Yanong Glacier note the low slope terminus tongue below steep crevassed icefall section, red arrows.

Digital Globe image of  North Yanong Glacier note the l steep crevassed icefall section, red arrows that leads right to the terminus.