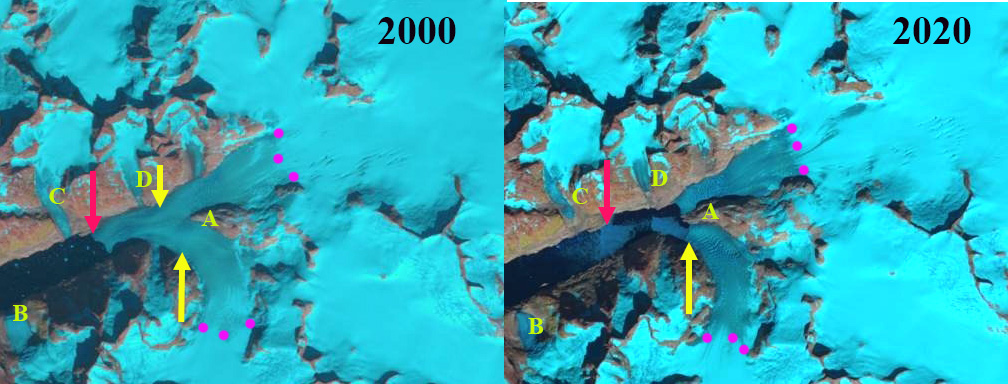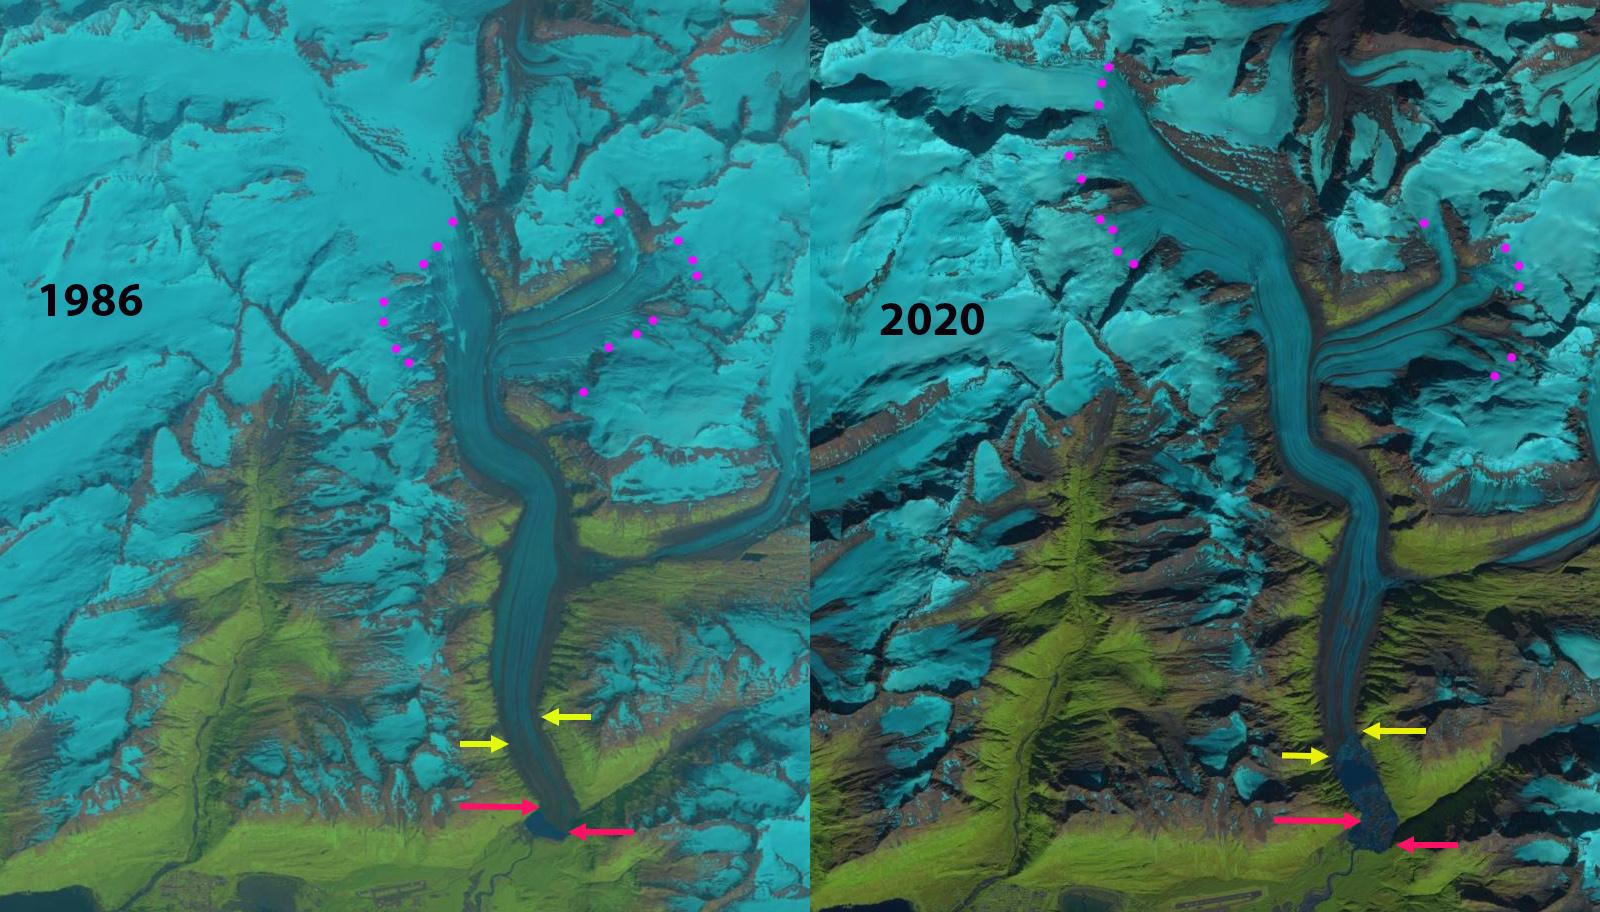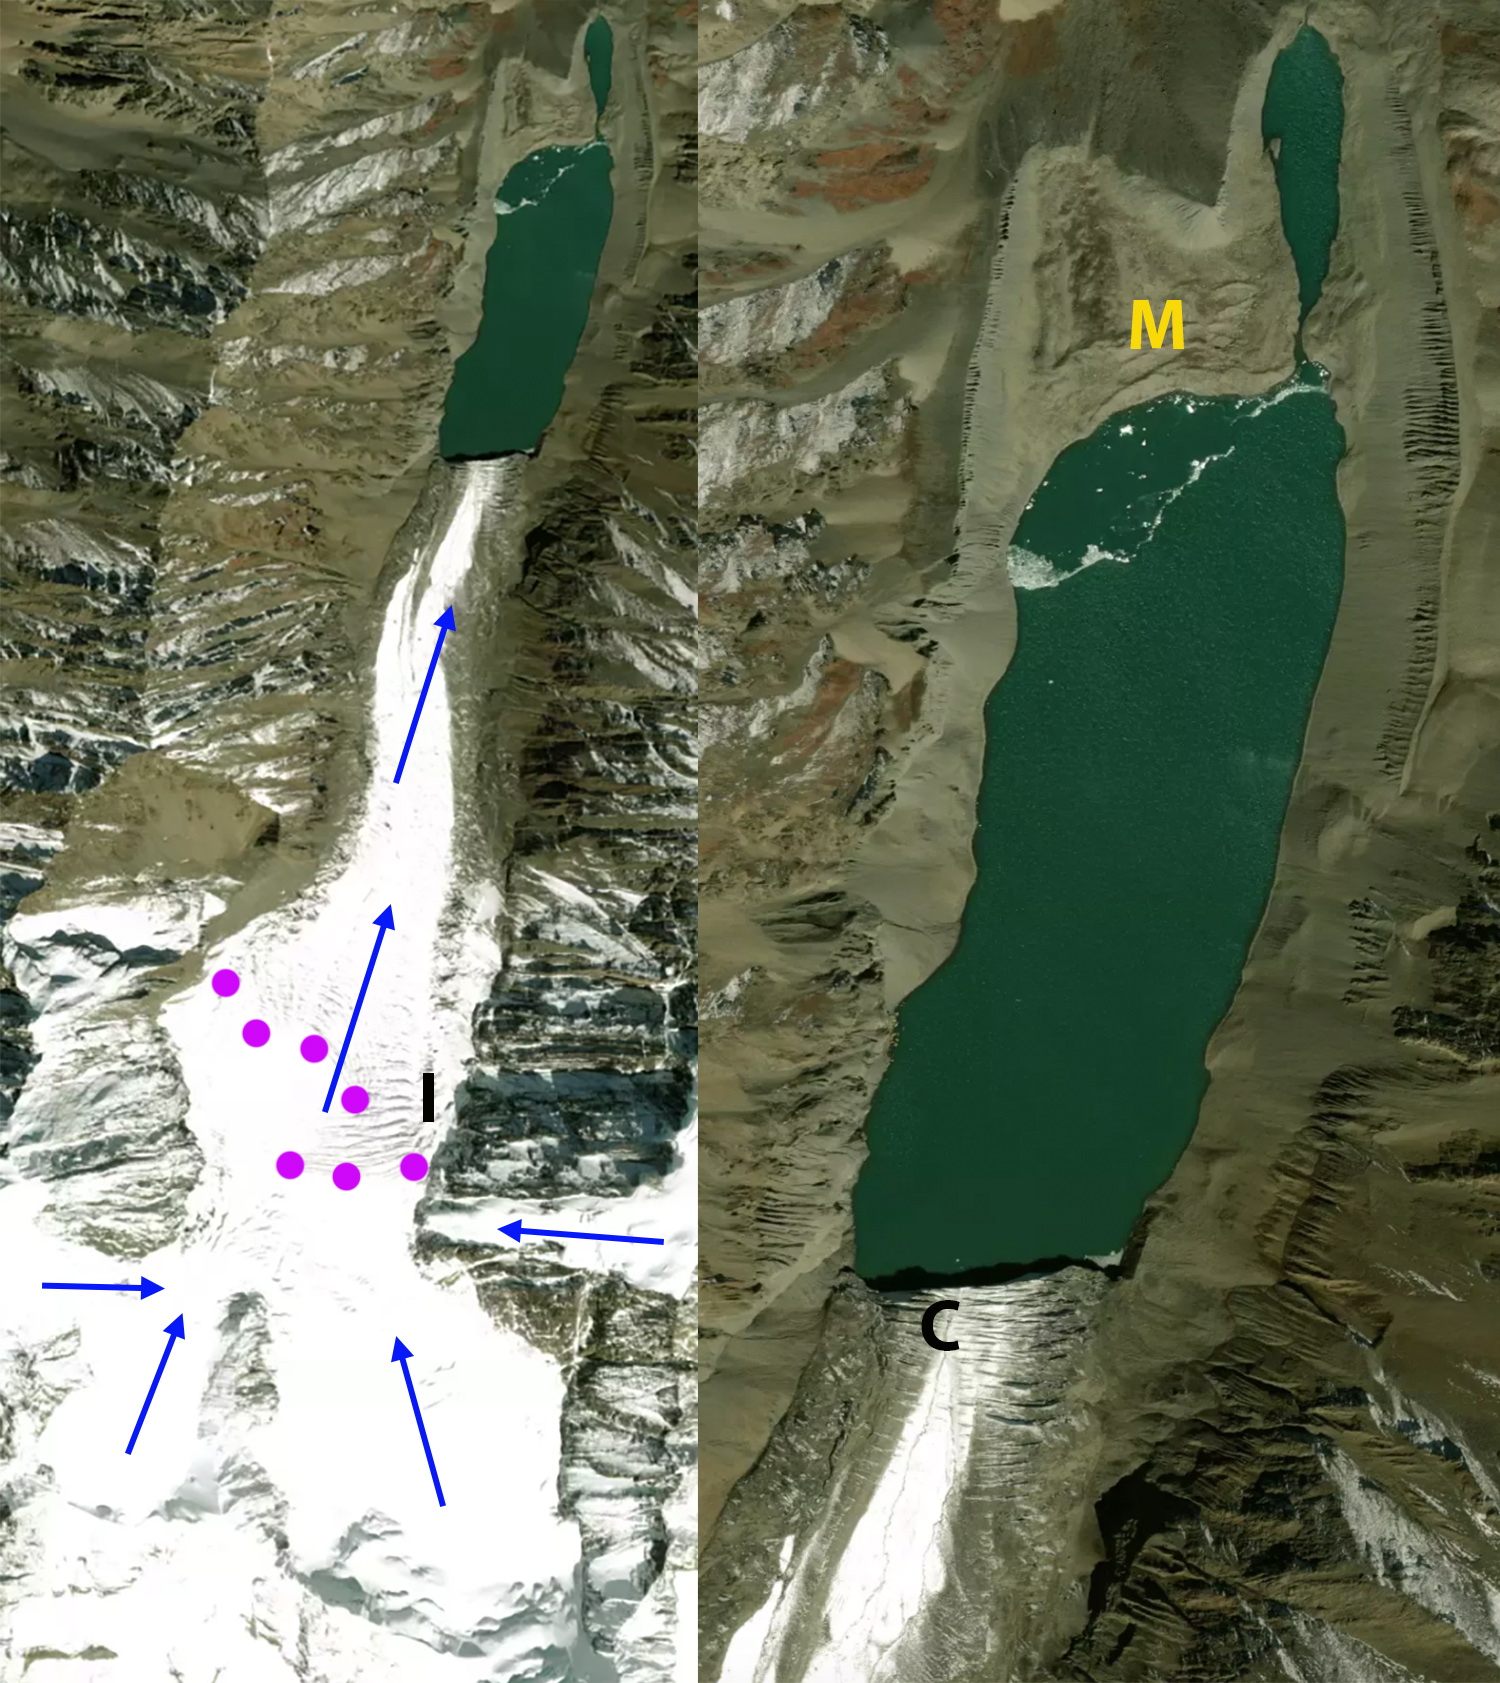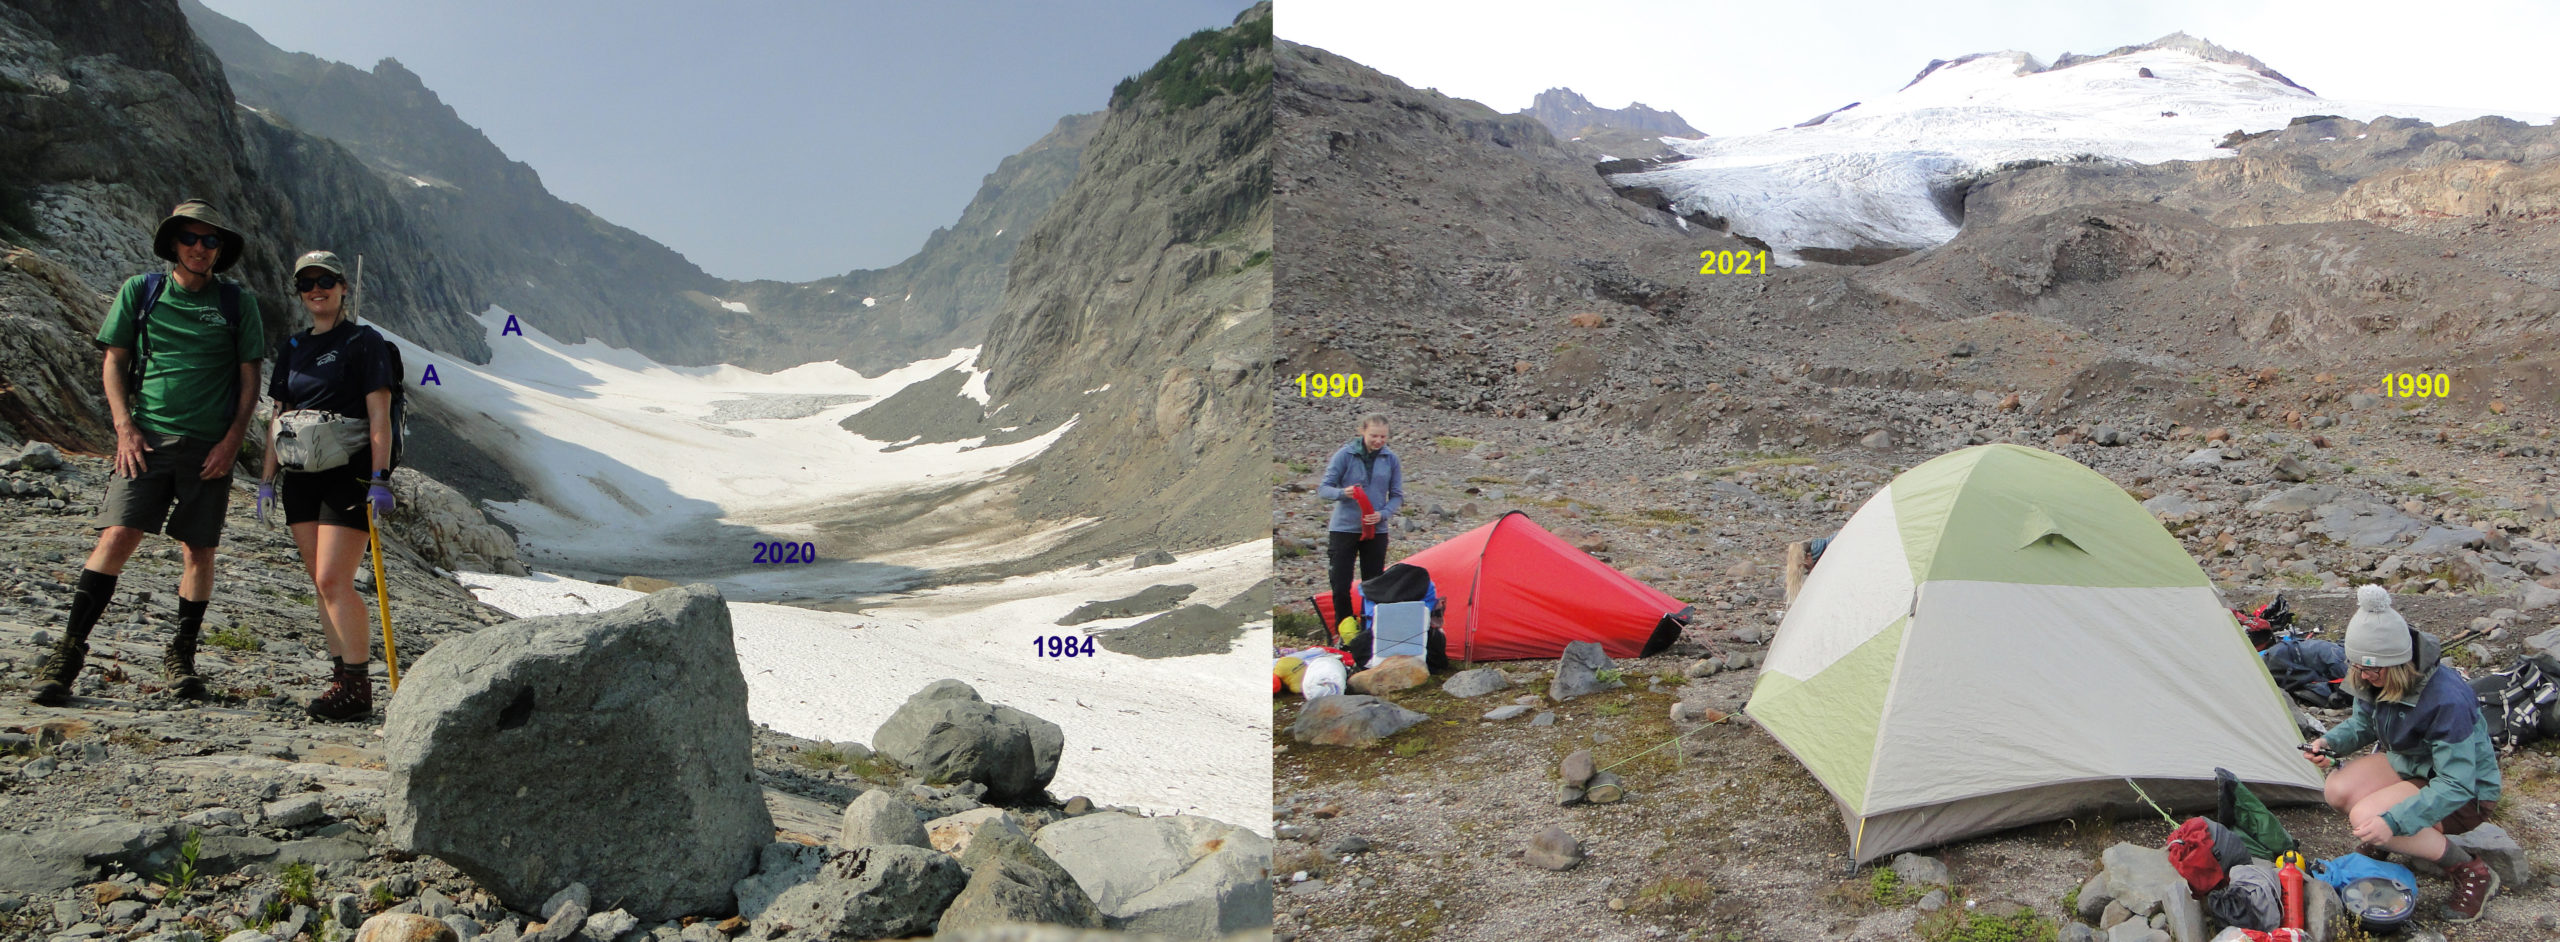
Terminus of Columbia Glacier on left with 1984 terminus location noted. Observe the avalanche fans (A) and the relatively high snowcover on 8-2-2021. At right is Easton Glacier on 8-11-2021 with the location of the 1990 terminus indicated, 440 m of retreat to the 2021 terminus position. The glacier has only 38% snowcover at this time, which is better illustrated below.
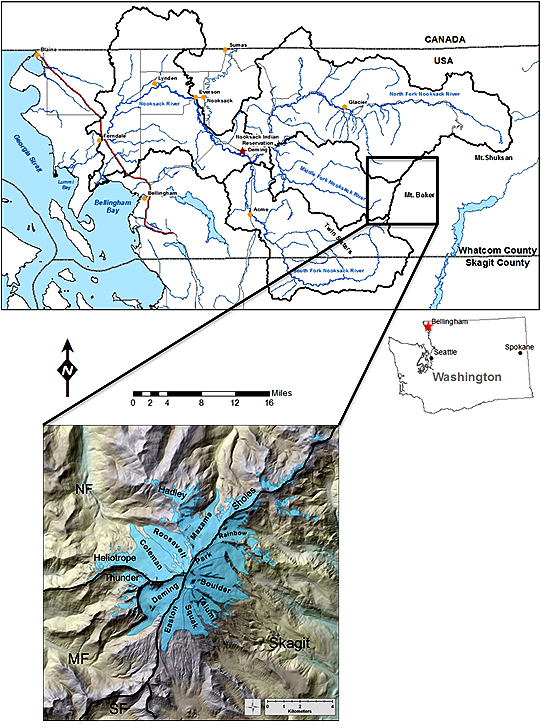
Columbia and Easton Glacier in the North Cascade Range of Washington are two of the reference glaciers for the World Glacier Monitoring Service. We have monitored their mass balance in the field for 38 and 32 years consecutively. This year Ashley Parks, Sally Vaux, Jill Pelto and I worked on all of the glaciers with Abby Hudak, Rose McAdoo and Ben Pelto joining us for either Easton or Columbia Glacier. In 2021 a combination of an above average winter snowfall and a record summer melt has led to a different story of mass balance for the two glaciers. At Mount Baker and Stevens Pass winter snowpack on May 1 was 116% and 115% of normal (NWAC, 2021). From June 1-Aug. 17 the mean average temperature is similar to 1958 and 2015, and well above every other year. With the maximum temperature exceeding 80 F on 17 days during this period at Stevens Pass ( 3950 ft, 1200 m), each of those days represents exceptional melt conditions. Our observations indicate 11-14 cm of snowpack melt on glacier during exceptionally warm days like this. Just the melt from these 17 days would equate to half of the average summer melt for a North Cascade glacier (Pelto, 2018). The earlier summer heat wave has led to exposure of greater higher albedo and faster melting glacier ice, which is why such a heat wave is more impactful than in late summer.
Columbia Glacier occupies a deep cirque above Blanca Lake ranging in altitude from 1400 meters to 1700 meters. Kyes, Monte Cristo and Columbia Peak surround the glacier with summits 700 meters above the glacier. The glacier is the beneficiary of heavy orographic lifting over the surrounding peaks, and heavy avalanching off the same peaks. Standing on the glacier is a bit like being in the bottom of a bath tub, with avalanche slopes extending up both sides, predominantly on the west side. The last half of January 2021 was a dry period in the region, with an extensive crust forming on the snowpack. This was followed by 106 inches of dry snowfall from Feb. 4 to Feb. 20,and then 34 inches of wet snowfall and even rain through Feb. 24 This generated extreme avalanche danger and numerous climax avalanches in the Stevens Pass region.
NWAC’s avalanche forecast on 2/20 for Stevens Pass indicated that, “We haven’t seen rain above 3,500ft or so since mid-January, so one of the main concerns is that slabs 5-10′ feet thick may begin to come crashing down. The avalanche cycle(s) may last through the day Monday. In any case, very large storm slabs and wet loose avalanches are expected to continue to run from steep slopes through Monday as our once beautiful cold, dry snow becomes overloaded by wet, heavy rain and snow.”
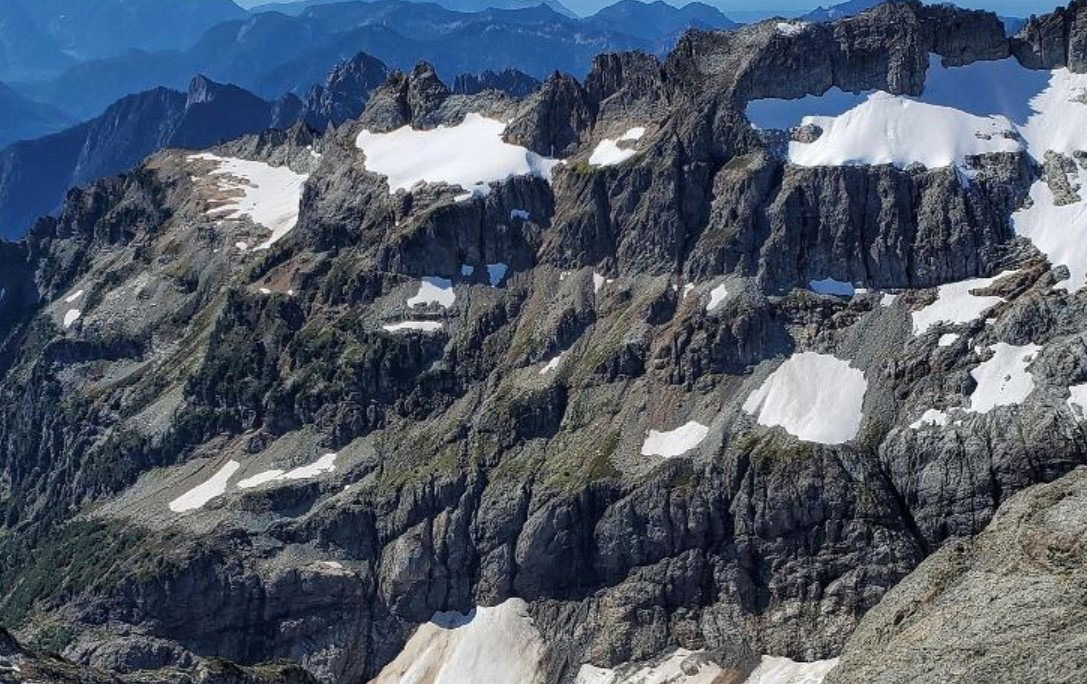
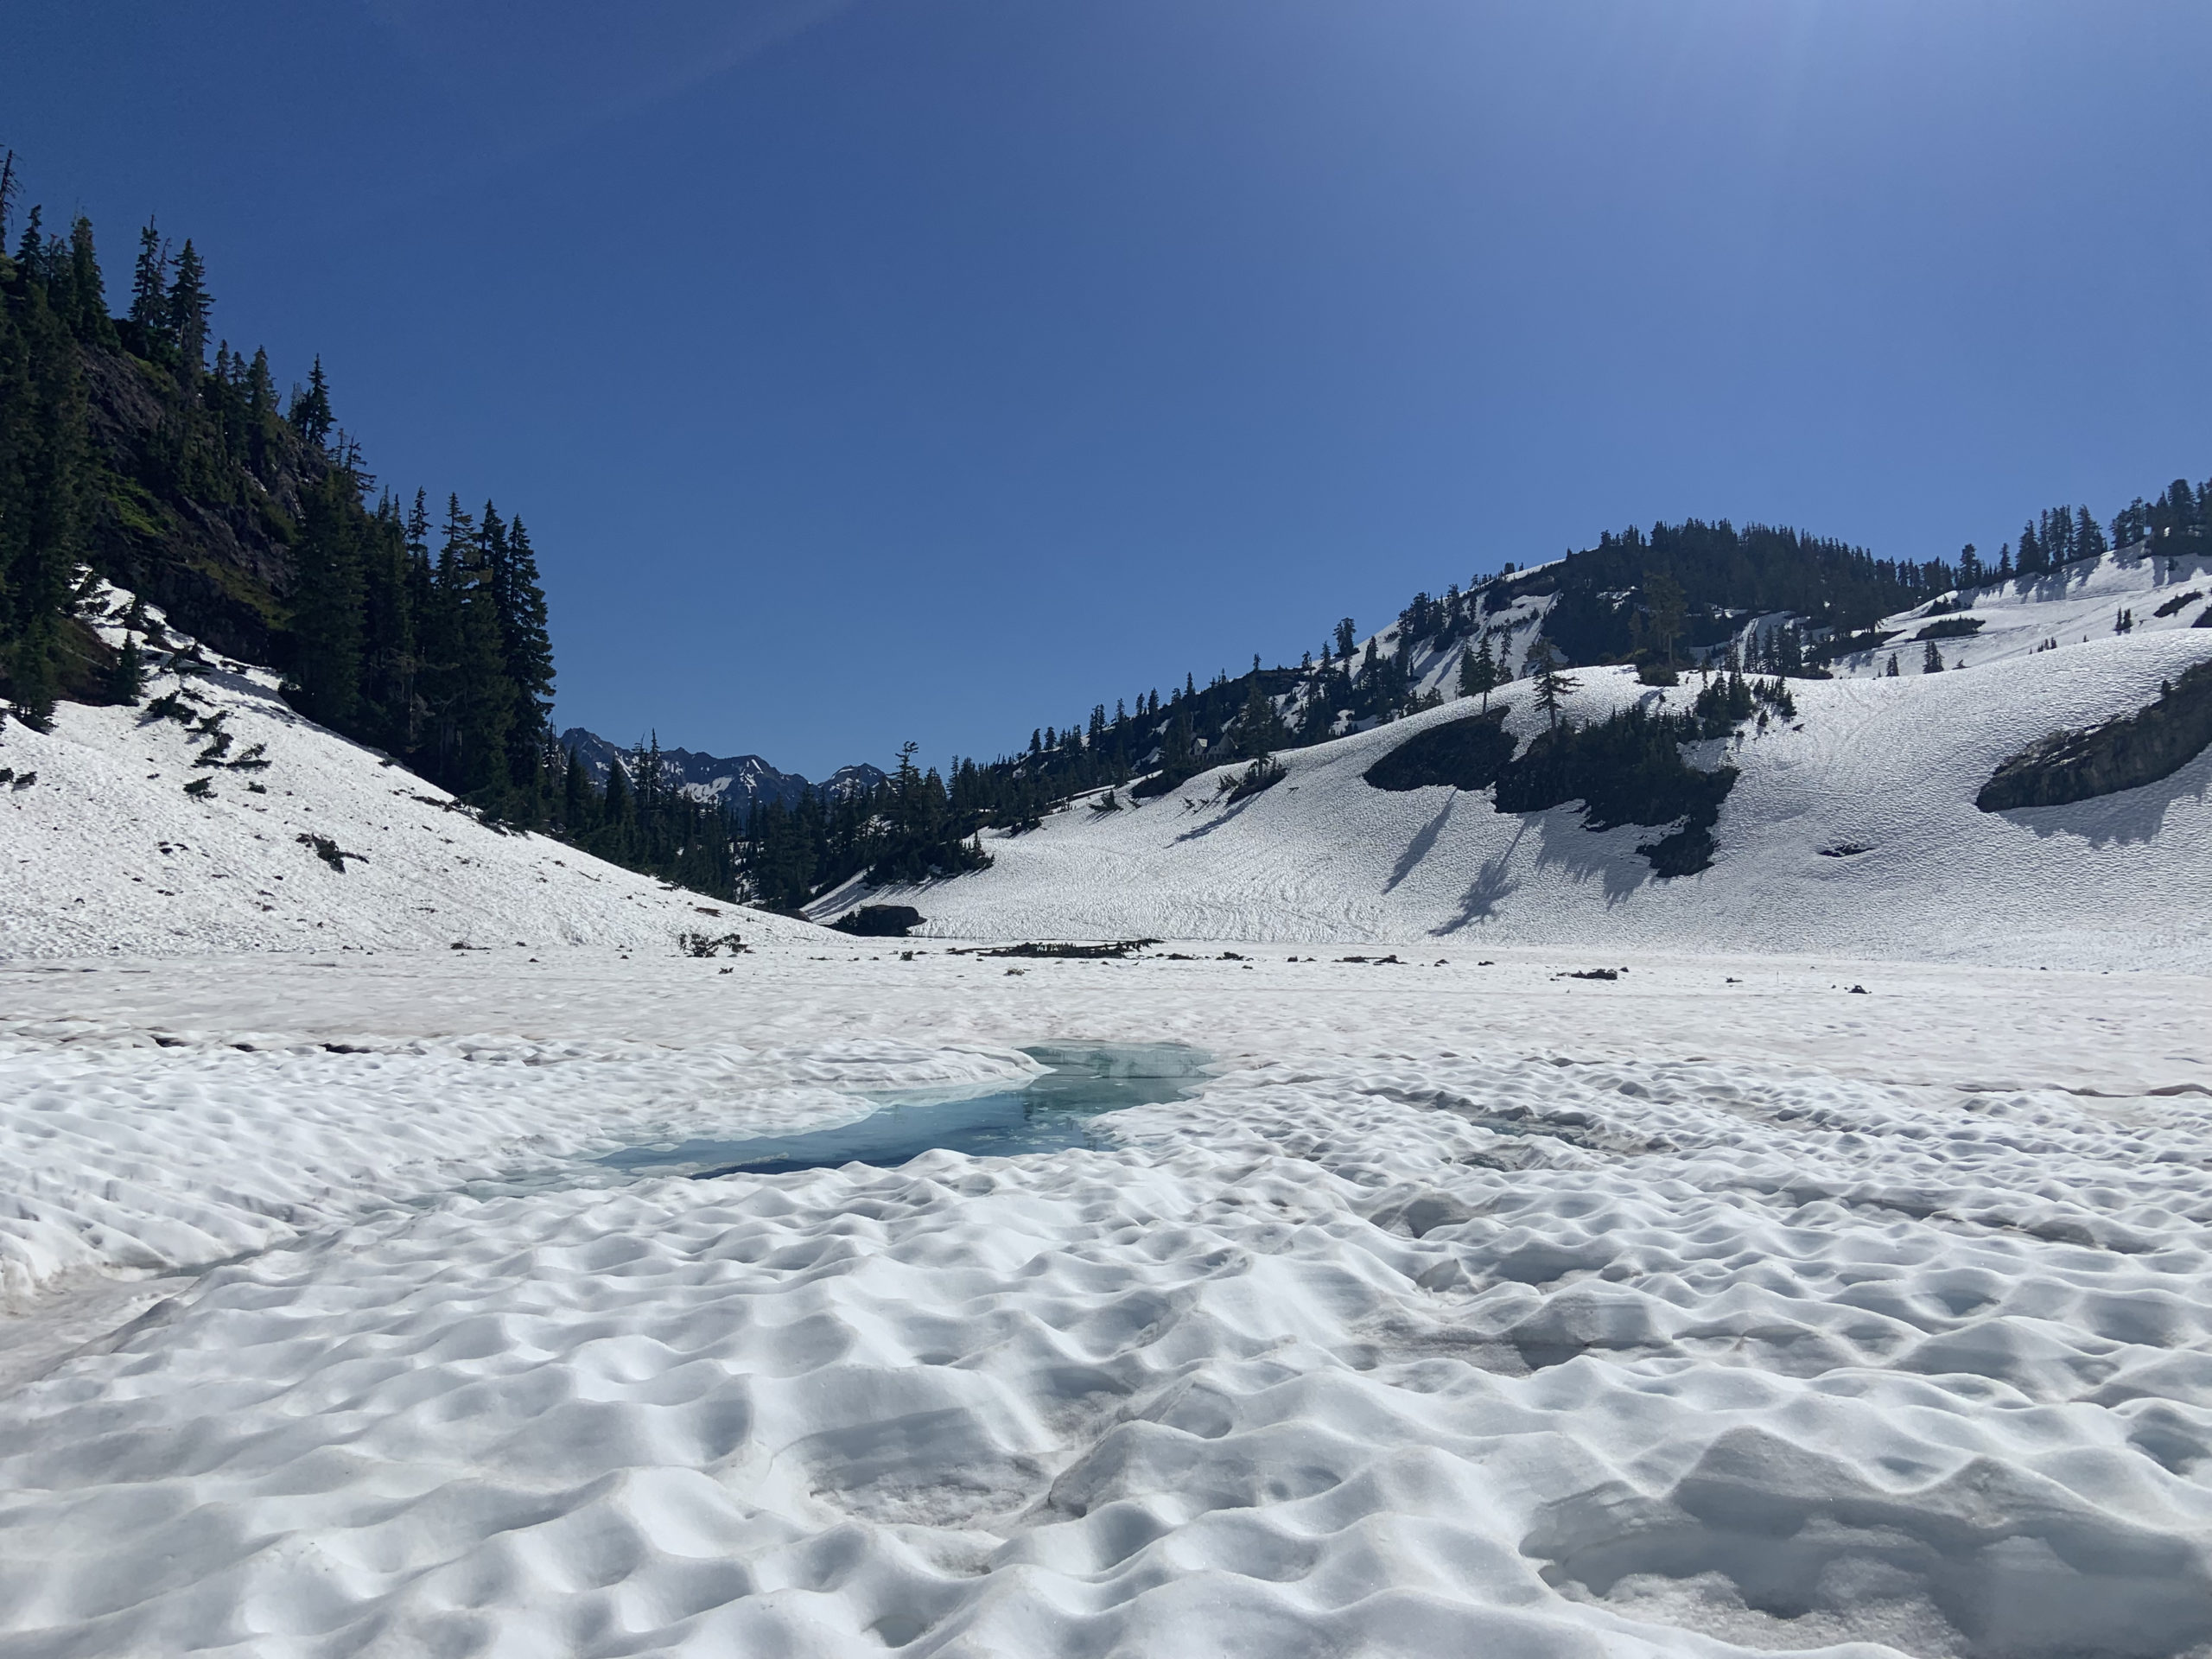
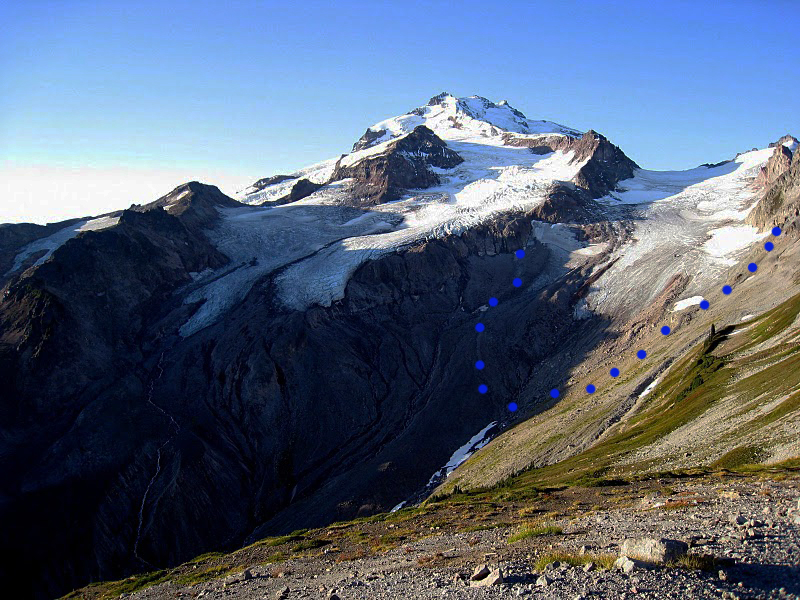
The avalanche slopes with many pockets above Columbia Glacier in Aug. 2020, one fan can be seen bottom center. These have to filled each winter season before slides occur, in 2020 avalanching was limited.
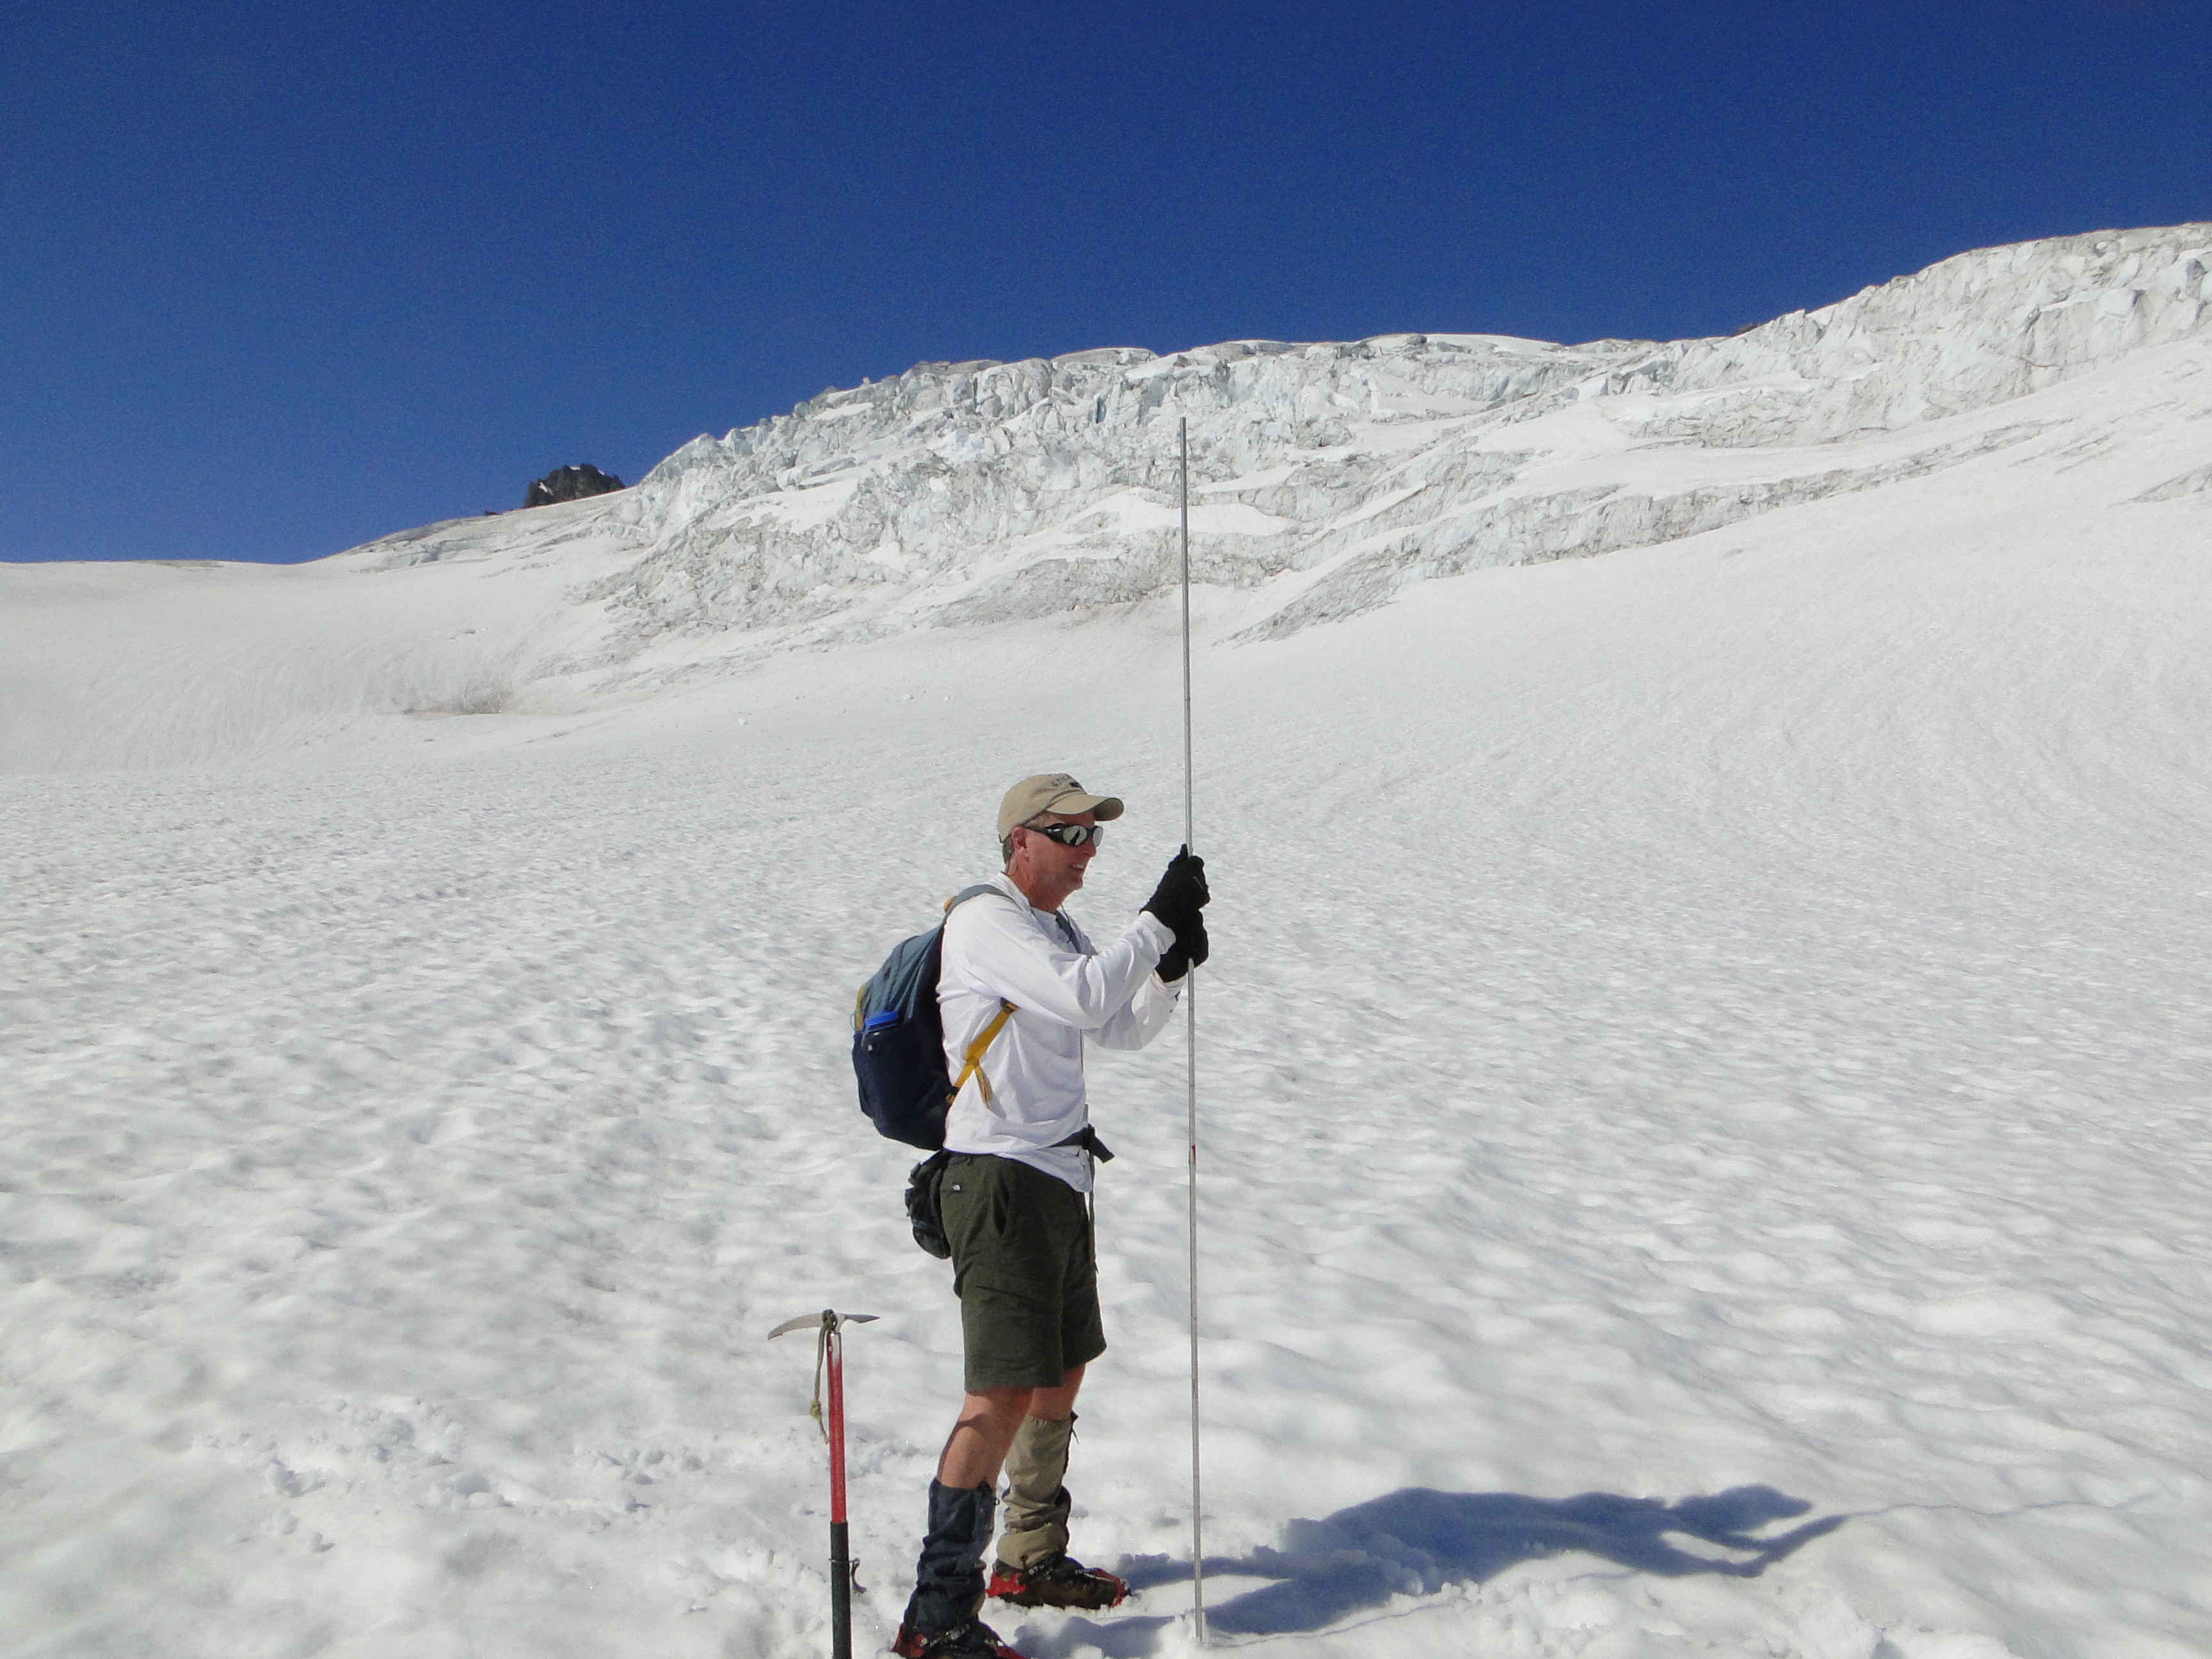
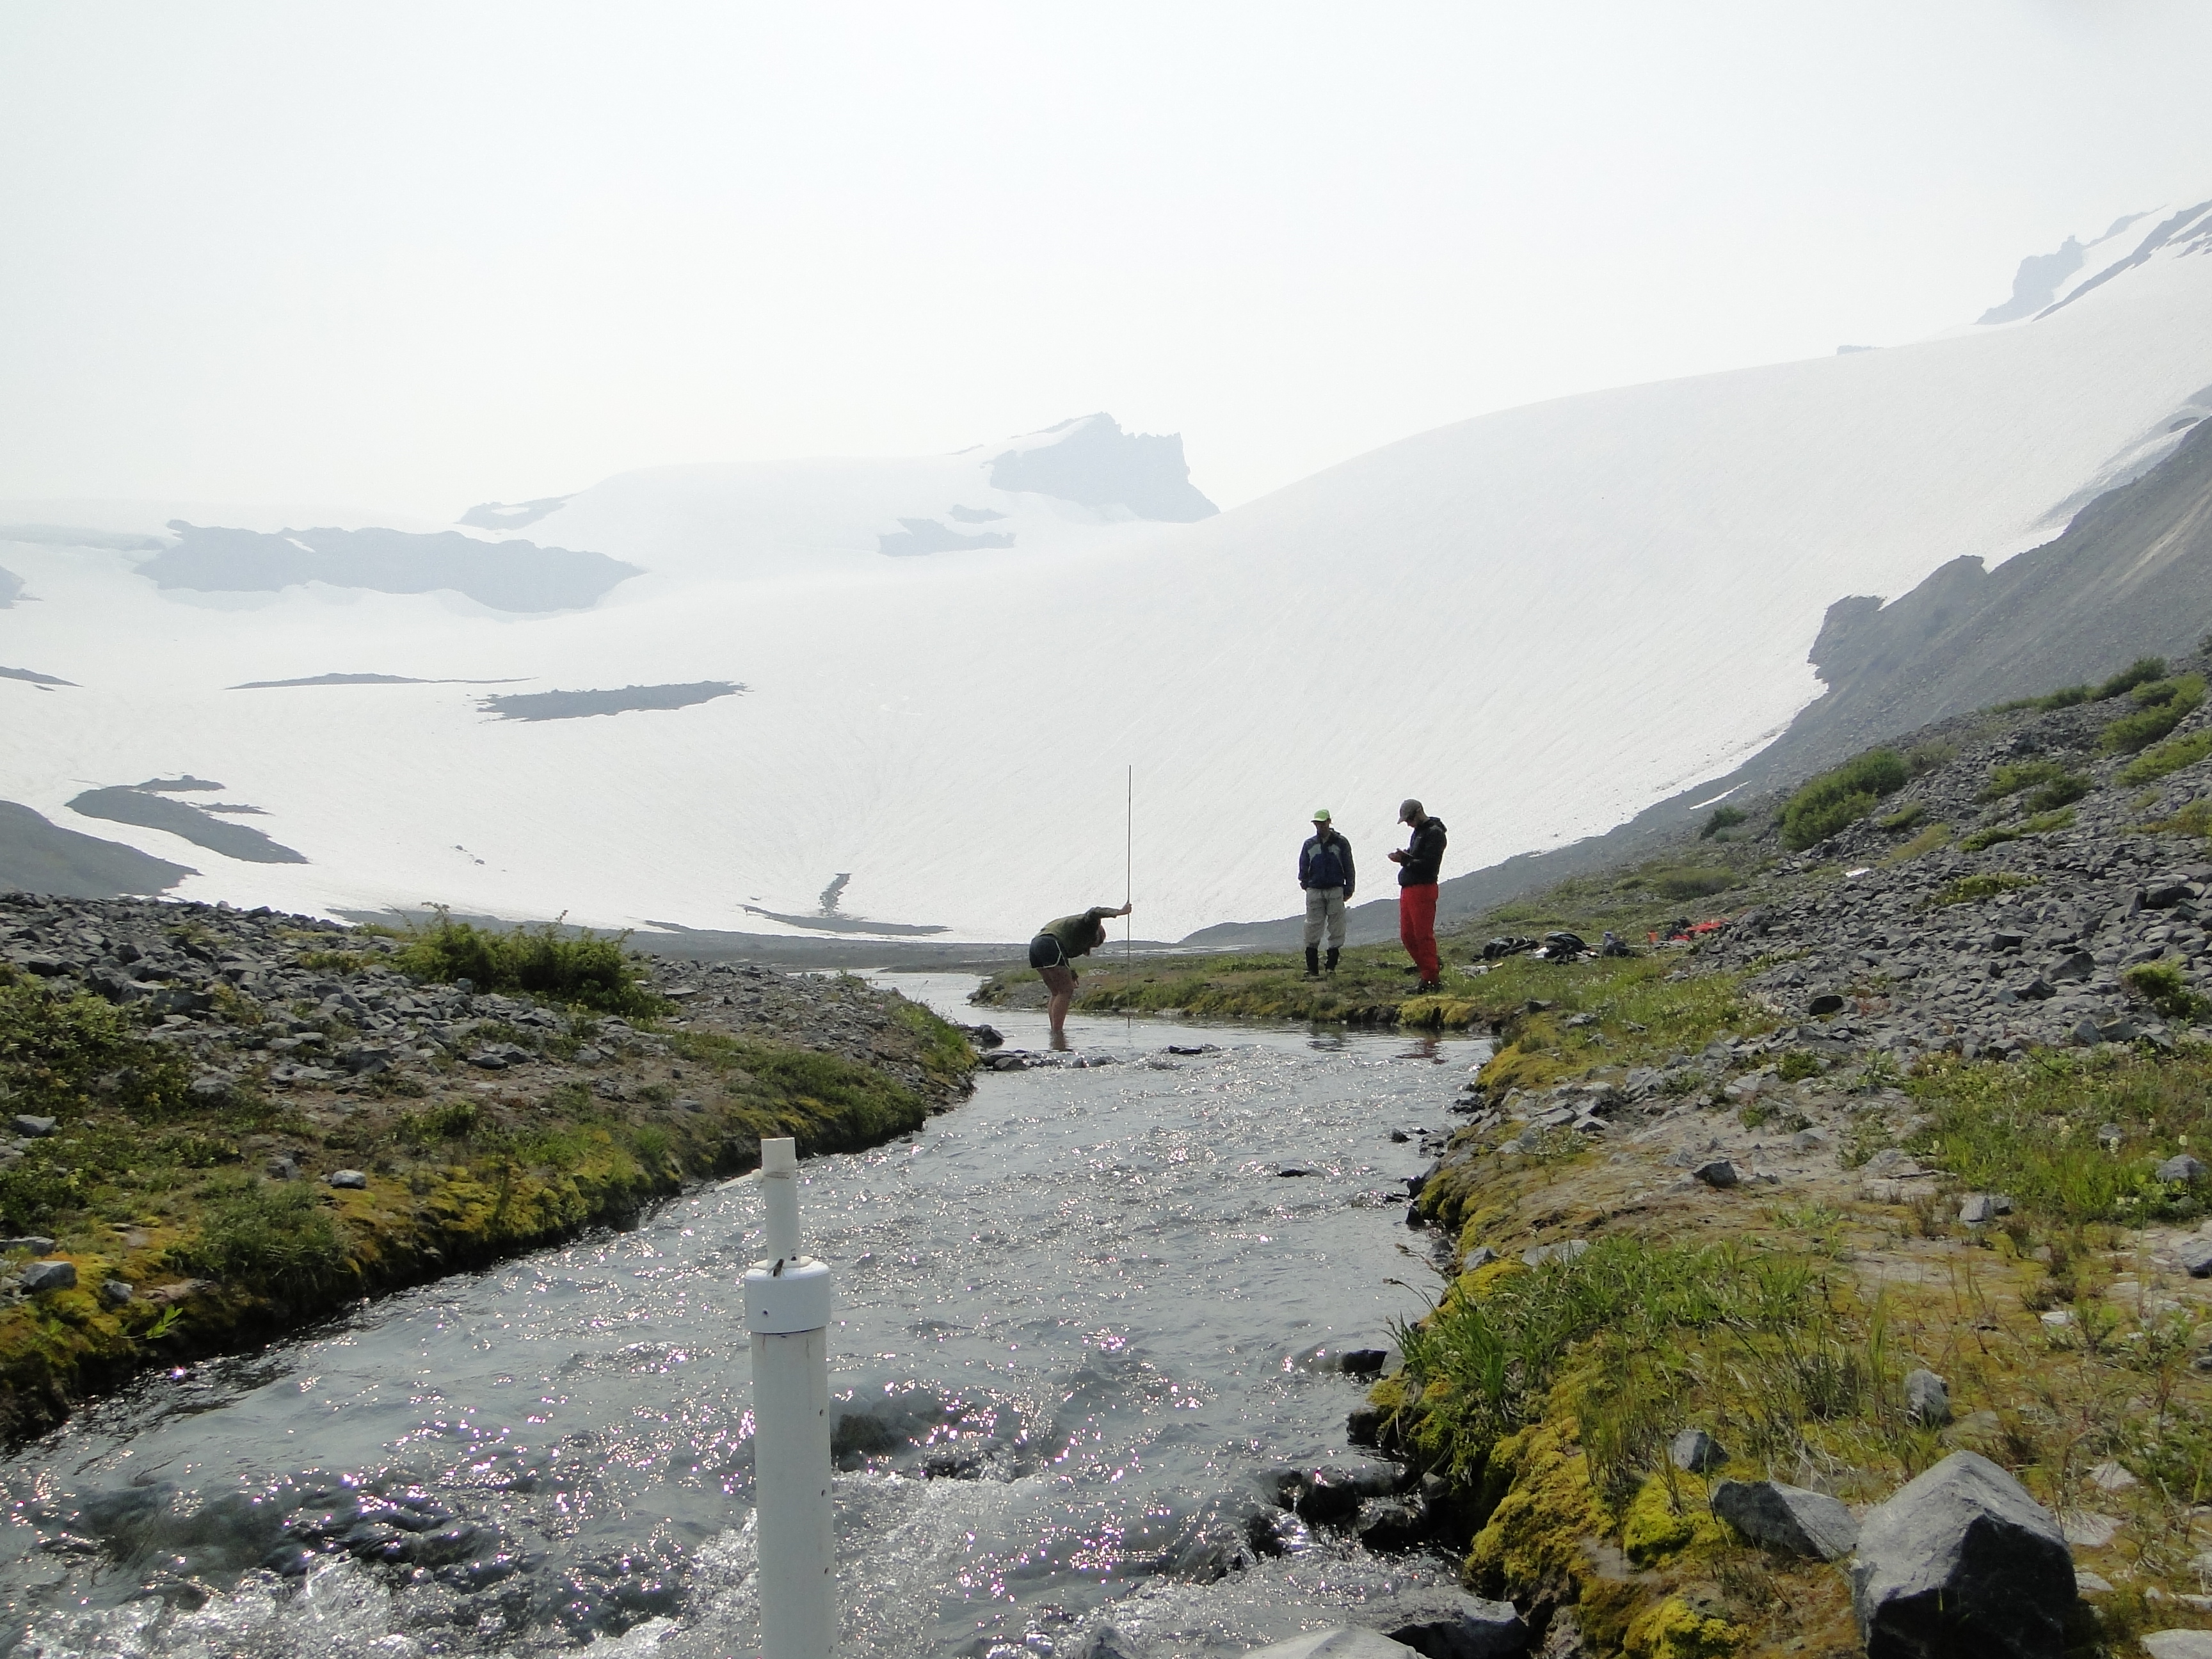
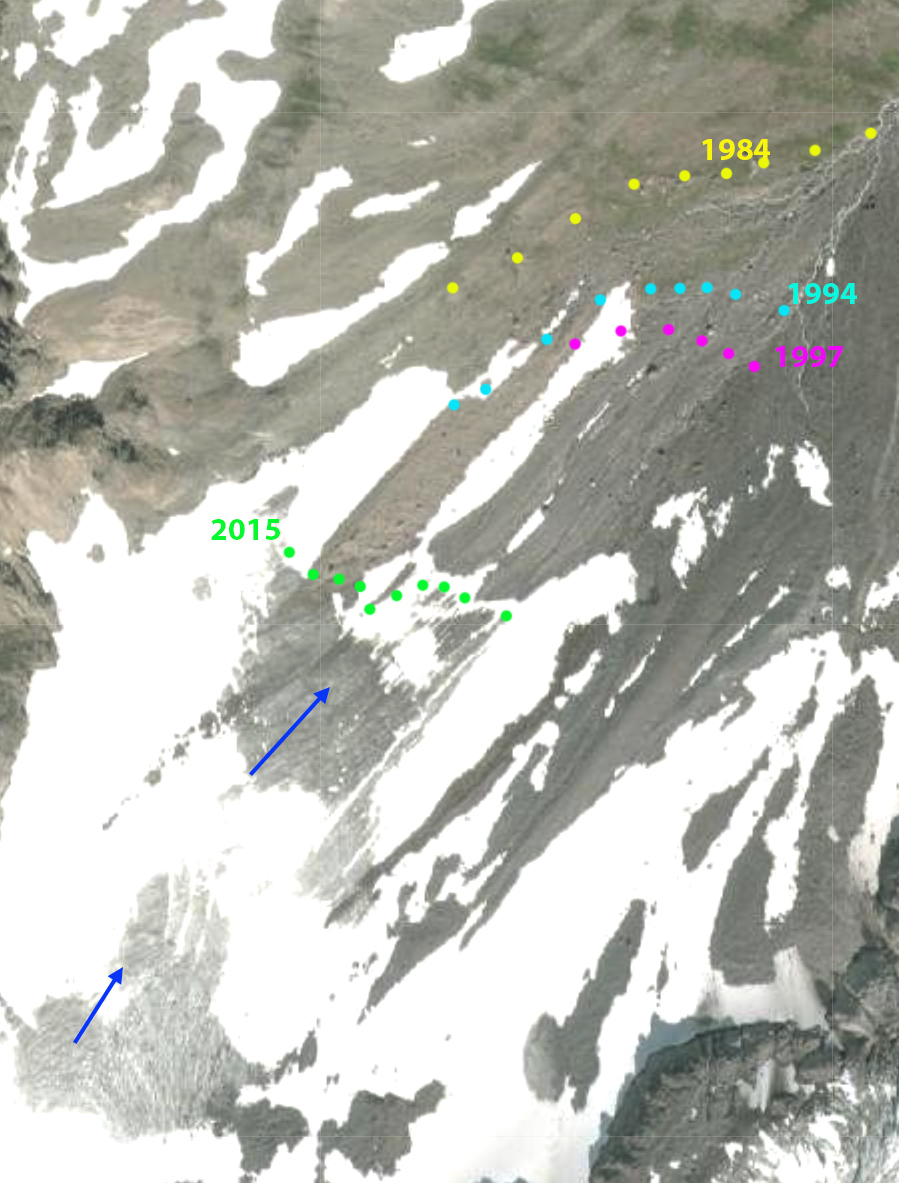
As we headed up onto Columbia Glacier on Aug. 1, 2021 we noted a significant number of large avalanches had descended near and onto the glacier. The glacier was 87% snowcovered, including the terminus area. This is well above the recent early August average. As is the case every year we measure snow pack depth in a grid across the entire glacier. Snow depth in the three biggest west side avalanche fans averaged 4.9 m, 25% above normal. The three largest fans comprise an area of 0.14 km2, yielding a volume of 686, 000 m3 swe. The melt season ends in another month, however, due to this substantial avalanching that will keep this section of the glacier covered in snow, Columbia Glacier will have a small-moderate negative mass balance.

Ashley Parks, Jill Pelto and Sally Vaux measuring snow depth in the Columbia Glacier avalanche fans.

The three primary avalanche fans each had a slope of 23 degrees. Here we are spaced out at 50 m intervals mapping the size of the fan.
Easton Glacier on the south flank of Mount Baker does not recieve avalanche accumulation, and the regions above 2500 m, typically have significant wind scouring, that leads to little increase in mass balance with elevation above this elevation on the upper glacier. There are both basins where snow is preferetially deposited by wind and convex regions where snowpack is scoured. In 2021 enroute to the glacier terminus we observed considerable stunted alpine vegetation, that emerged and then did not grow. This was prevalent on rocky slopes that were exposed during the heat wave. The example below is of Lupine with the growth from last year now brown and flat indicating the stunted size this year.
Stunted Lupine, each patch is typically 20-30 cm high and equally broad. Here the plants are 3-5 cm high.
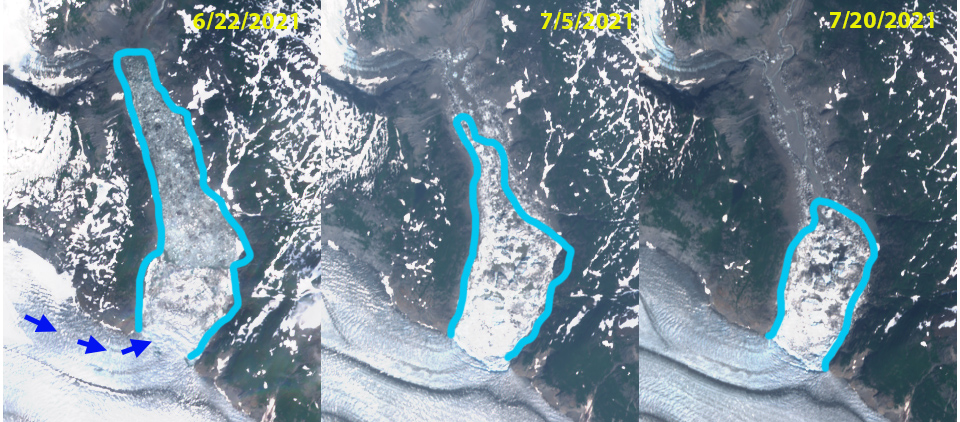
On Aug. 11, 2021, the glacier had only 38% snowcover, with more than 50% of the area above 2500 m having lost all winter 2021 snowcover. By summer’s end the glacier will certainly have the lowest percentage of snowcover of any year since we began monitoring in 1990. The bench at 2000 m typically has 2.75 m of snowpack on Aug. 10, and this year was 50% bare, with an average depth of 0.25 m. The icefall above also lacked snowcover as well. There are a number of pockets/basins, where wind deposition increased snow depth and this snowpack will be retained.
The observations across the range illustrated that glaciers or areas of glaciers that do not have enhanced deposition from wind drifting or avalanching are either bare already or will be by the end of August. The full extent of the loss on Columbia and Easton Glacier from this summer will be evident in a month. What is apparent is that the losses from Easton Glacier will be extraordinary. More frequent heat waves continue to plague alpine glaciers, these can even occur in winter such as on Mount Everest in January 2021 (Pelto et al. 2021)

View of the lack of snowcover in the icefall at 2000-2300 m on Easton Glacier. The lack of snowcover above this point is also evident in the upper image.
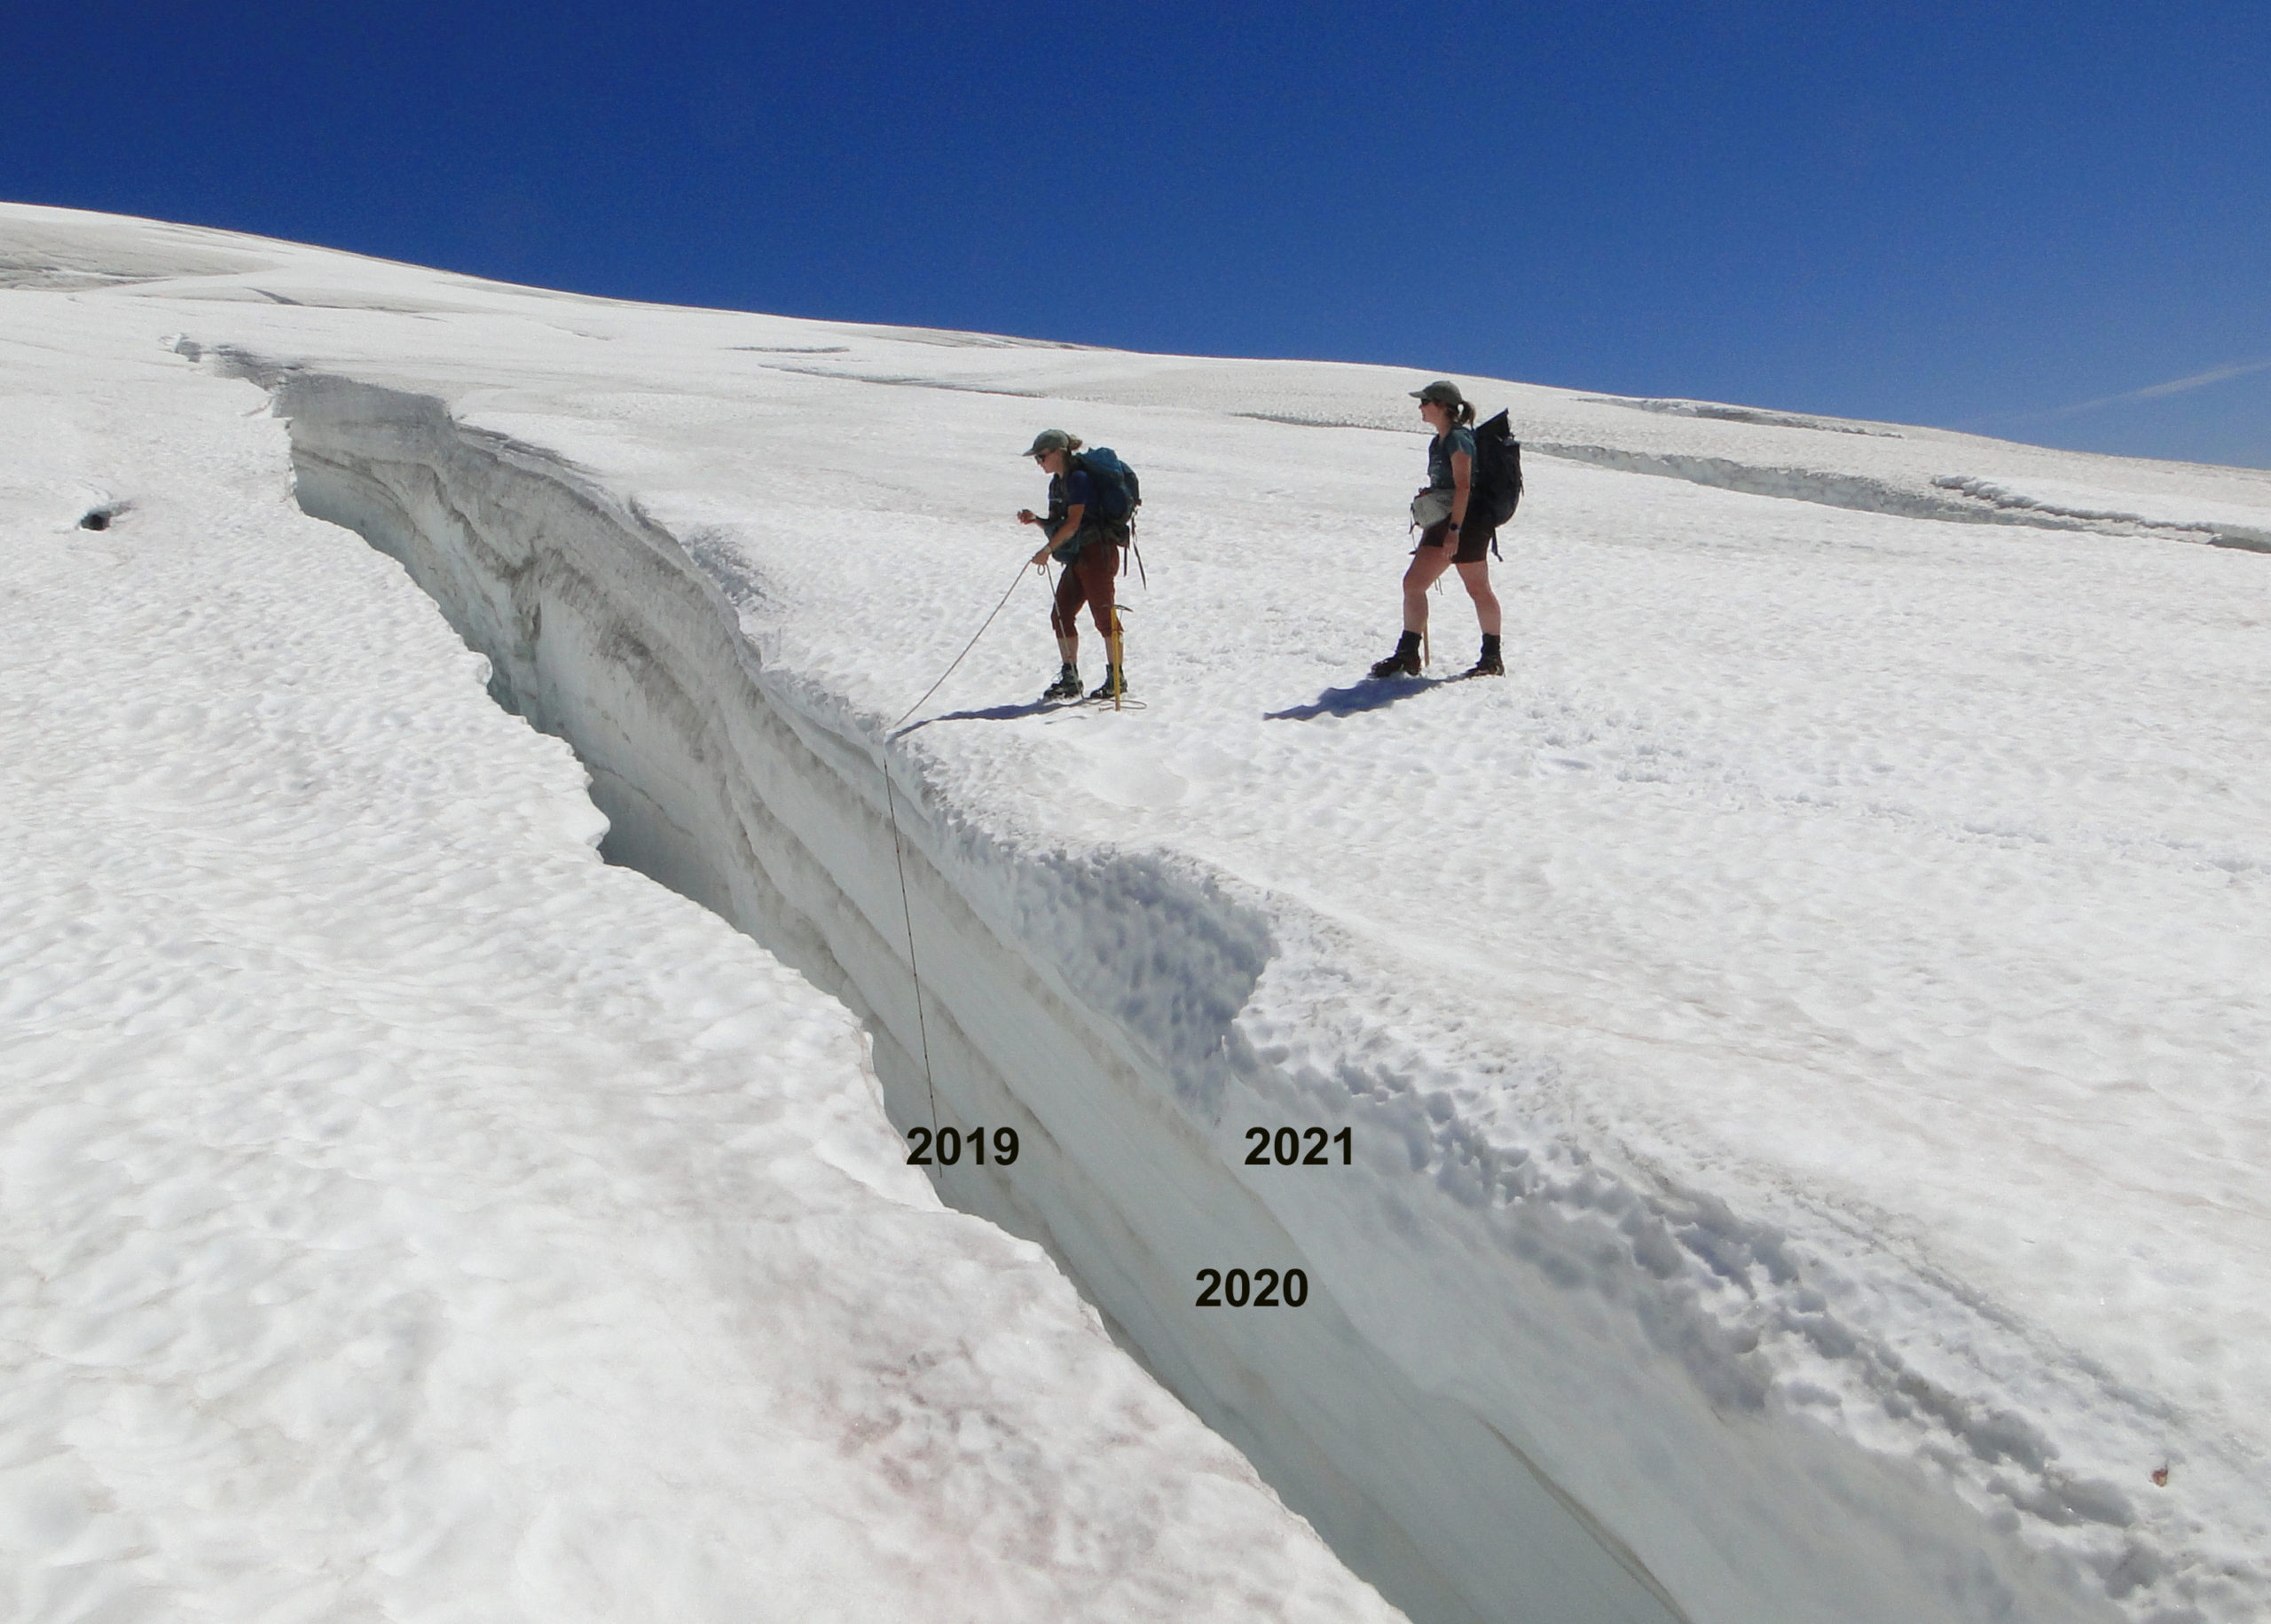
Rose McAdoo and Jill Pelto measuring the 2021 snowpack at 2350 m is alareay thinner than the 2020 or 2019 retained snowpack and will be gone by the end of the month.
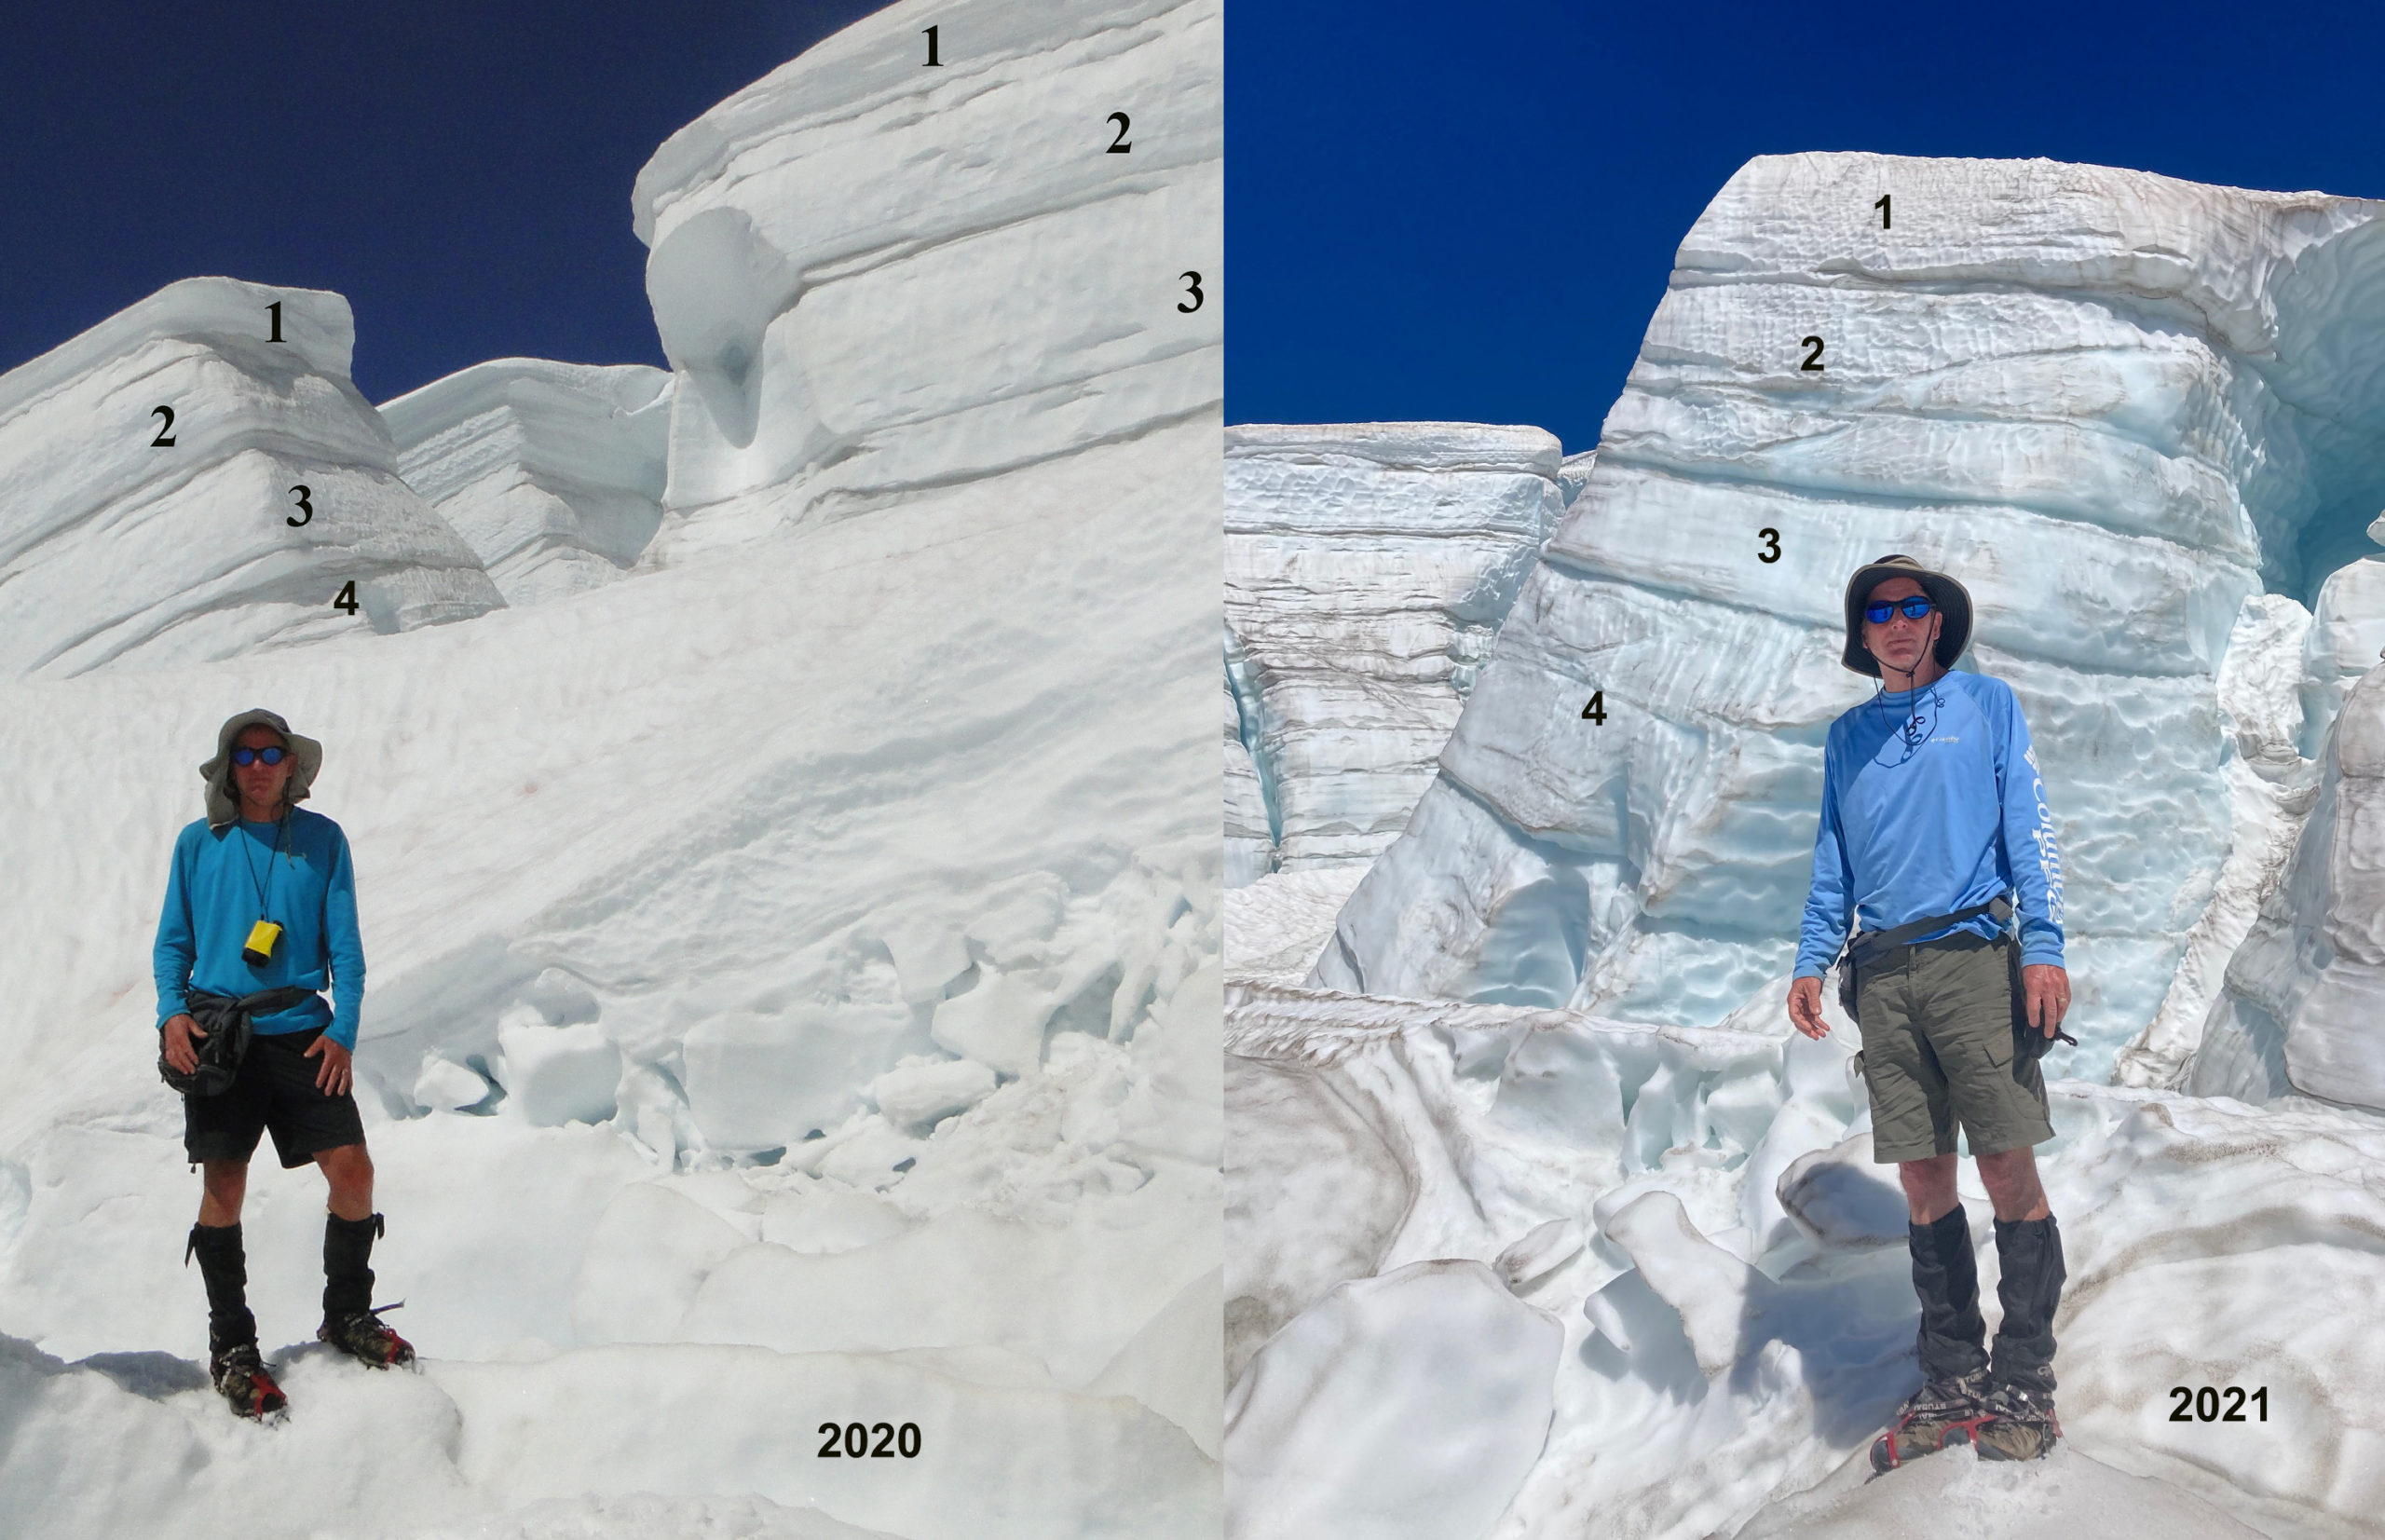
In 2021, I am in front of the same serac as in 2020, down slope. The average retained accumulation at this 2600 m location in the laterally extensive layers is 2-2.2 m. This year there will no retained accumulation.
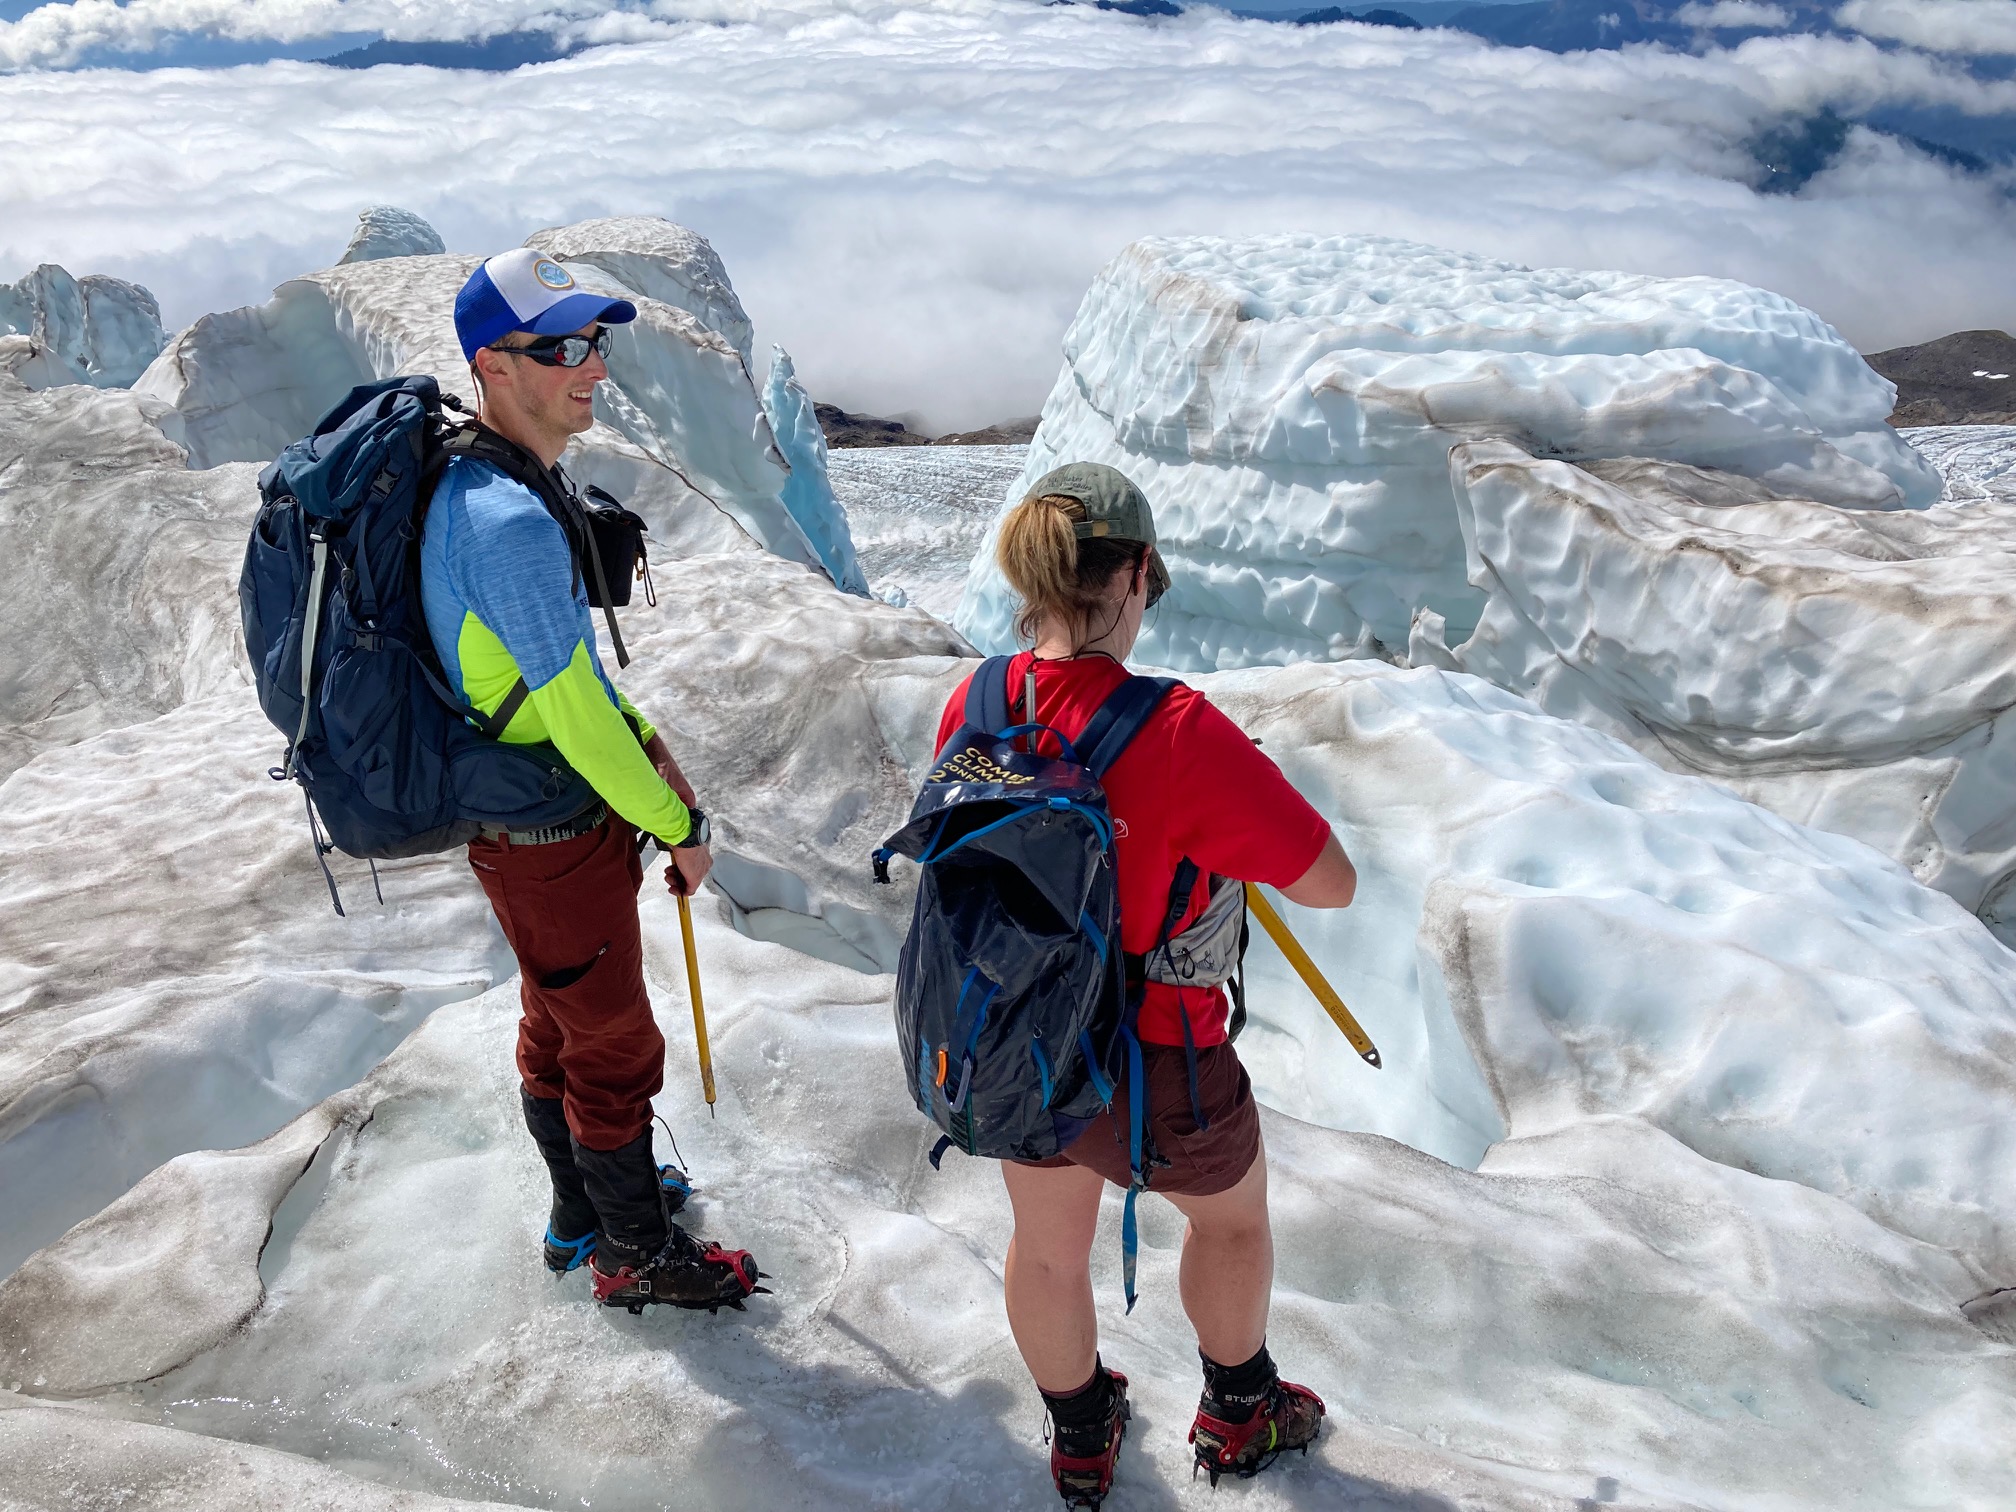
Ben and Jill Pelto amongst the seracs where snowpack should be extensive, but in 2021 they are standing on 2020 firn.