Norrearm Fjord Glacier Retreat, Greenland

norrearm-compare

Apostelens Glacier in Norrearm Fjord Landsat comparison from 1999 to 2016. Red arrows are the 1999 terminus location, yellow arrows the 2016 terminus location and purple arrows indicate an expanding bedrock ridge.

“Apostelens” Glacier drains east from a peak of the same name into an arm of Norrearm Fjord, which in turn is part of Lindenow Fjord in southern Greenland. The glacier is a short distance north of Kangersuneq Qingordleq, where recent retreat has led to glacier separation. The glacier is soon to lose its tidewater connection as has occurred at Tasermiut Fjord to the west.  This will result in a decline in iceberg production as well.

Here we examine Landsat imagery from 1999-2016 to identify glacier change.  In 1999 the Apostelens arm of Norrearm Fjord is largely filled by the glacier which extends to within 2.5 km of Norrearm Fjord, red arrow.  The tongue contains numerous ogives formed each year due to seasonal velocity changes through an icefall.  This is evident in the Google Earth image from 2004, where 24 ogives are evident on the low slope glacier tongue, in 1999 the number is over 30. By 2013 the glacier has retreated nearly 2 km from the 1999 terminus position, red arrow. In 2012 Google Earth imagery indicates increased crevassing near the front and the loss of most ogives.  New ogive formation is also hard to distinguish.  By 2016 the glacier has retreated 2.6 km and is nearing the headward limit of the fjord arm.  The collapse of the fjord tongue and its associated ogives indicates the loss of 30 years worth of volume flux that emerged from the icefall that generated the ogives.

Greenland tidewater outlet glaciers in this region have experienced substantial retreat since 1990, Weidick et al (2012) and Howat and Eddy (2011).  Murray et al (2015) examined 199 tidewater glaciers in Greenland and noted significant retreat of 188 of them.  Apostelens Glacier was not one of these, and soon will not be a tidewater glacier to be included in the list.

norrearm-ge

Apostelens Glacier in Norrearm Fjord Google Earth comparison from 2004 and 2012. Red arrows are the 2004 terminus location, and yellow arrows the 2012 terminus location.  Note ogives in 2004 and loss of them in 2012. 

norrearm-map

Map of the Norrearm Fjord region and Apostelens Glacier, with blue arrows indicating flow. 

Nevado Soral, Bolivia Glacier Retreat Separation Imminent 1988-2016

nevado soral compare

Landsat comparison from 1988 to 2016 of Nevado Soral Glaciers, Bolivia.  Red arrow is the 1988 terminus, yellow arrow the 2016 terminus, orange arrow is the glacier junction and the purple arrow areas of rock expansion indicating upglacier thinning.

Nevado Soral is in the Cordillera Apolobamba Range of the Bolivian Andes.  A significant valley glacier flows south from the mountain joining a northward flowing glacier shortly above the terminus.  The combined runoff of these glaciers drains in to Laguna Suches, which is transected by the Bolivia-Peru Border.  Cook et al (2016)  quantify the importance of the Bolivian Andes Glaciers for  water supply for Andean cities and mountain communities.  They used Landsat satellite imagery to identify an overall areal shrinkage of 228 km2 (43%) across the Bolivian Cordillera Oriental between 1986 and 2014, including 43% in the Cordillera Apolobamba, where Nevado Soral is located.  Retreat has led to a growing number of lakes, although the number of ice-contact lakes has decreased.  Vuille et al (2008) noted that air temperature in the Andes has increased by approximately 0.1 °C/decade, with only two of the last 20 years being below the 1961–90 average.  Soruco et al 2009) observed glacier change in the Cordillera Real of Bolivia and determined  that between 1963 and 2006 the mass of these glaciers has clearly been decreasing since 1975 without any significant acceleration of this trend over recent years.  The net result was that  glaciers lost 43% of their volume between 1975 and 2006. On nearby Chaupi Orko Glacier retreat has been less extensive, but several new lakes have formed in the last two decades.

In 1988 the junction where the north and south flowing glacier meet and turn west is 800 m wide, orange arrow.  The main glacier terminus is at m, red arrow. The purple arrows indicate areas where no bedrock is exposed. In 1999 there is 250-300 m of retreat and bedrock is still not exposed at the purple arrows.  By 2016 the main terminus has retreated 800 m since 1988.  The junction of the glacier is only 300 m wide.  The purple arrows indicate locations where bedrock has been exposed by glacier thinning. A Google Earth closeup below indicates significant ablation hollows, and few surface streams, suggesting that sublimation is an important means of ablation on the glacier.  The narrow junction of the two glaciers will soon melt, leaving two separate glaciers.

suches glacier ge

Terminus zone of Nevado Soral Glacier.  Purple arrows indicate ablation hollows are as common as stream channels.  This typifies an area where sublimation is a significant source of ablation.

nevado soral landsat


Landsat comparison from 2012 and 2015 of Nevado Soral Glaciers, Bolivia.  Red arrow is the 1988 terminus, yellow arrow the 2016 terminus and the purple arrow areas of rock expansion indicating upglacier thinning.

laguna suches

Nevado Soral Glacier drains into Laguna Suches.

Semienova Glacier, Kyrgyzstan Area, Volume, Velocity Decline

semienova-compare-landsat

Landsat comparison of Semenova Glacier in 1998 and 2016.  Red arrow is the 1998 terminus, yellow arrow is the 2016 terminus and purple are locations where tributaries are separating from each other or disconnecting from the main glacier.

Semienova Glacier is a valley glacier in the northeast corner of Kyrgyzstan draining into the Sary Dzhaz (Aksu) River which then flows into the Tarim Basin, China. Farinotti et al. (2015) used three approaches to assess glacier change in the Tien Shan from 1961 to 2012.  The results converge on an overall loss of glacier area of 19-27%,a glacier spatial extent of 2960 square kilometers.  They further observed that it is primarily summer melting that has driven the change.  Sorg et al (2012)  showed that glacier shrinkage is most pronounced in peripheral, lower-elevation ranges near the densely populated regions, where summers are dry and where snow and glacial meltwater is essential for water availability. Shifts of seasonal runoff maximum have already been observed in some rivers, and further summer runoff reductions are expected. Li et al (2014) identify a reduction in velocity of a number of large glaciers, including Semienova Glacier  in the Tien Shan from 2007-2011 that is likely due to mass losses.  Semienova Glacier had a peak velocity 10 km above terminus at 12 cm/day, declining to less than 2 cm day in the last 1-2 kilometers.

From 1998 to 2016 the glacier has retreated 500 m, this is a relatively modest retreat for a glacier of this size.  Debris cover has expanded and supraglacial stream networks have expanded indicating an increasingly stagnant terminus tongue, supporting the low velocity observations. There are three tributaries that joined the glacier in 1998, at the 3 eastern most purple arrows, have detached from the main glacier by 2016.  This indicates reduced contributions to the main glacier tongue. The two purple arrows on glaciers flowing into the valley from the south are located where two formerly joined glaciers are increasingly separated. The snowline in the glacier separating the melt zone and accumulation zone was at 4000 m in 2002, 2013 and 2016.  The retreat of glaciers in the region has also been observed in the Barskoon Mountains and Petrov Glacier.

semienova-9-15-2016-sentinel

Sentinel image of Semienova Glacier in 2016.  Black arrow is 1998 terminus, white arrow the 2016 terminus and black dots the snowline in 2016. 

semienova-2013

Landsat images of Semenova Glacier in 2002 above and 2013 below.  Red arrow is the 1998 terminus, yellow arrow is the 2016 terminus and purple are locations where tributaries are separating from each other or disconnecting from the main glacier.  Purple dots indicate the snowline. 

semienova-2002

Hornopirén Glaciers, Chile in Spectacular Retreat

hornopiren-landsat-compare

Landsat comparison of Rio Blanca Glaciers in Hornopirén National Park, Chile from 1985 to 2016.  Red arrow 1985 terminus, yellow arrow 2016 terminus, purple dots the snowline and purple arrows expanding bedrock areas amidst the glacier.

Hornopirén National Park is in the Los Lagos region of Chile.  The park is host to a number of glaciers that are in rapid retreat.  Davies and Glasser (2012) mapped the area of these glaciers with 113 square kilometers in 1986 and 96 square kilometers in 2011.  The retreat of the largest glaciers in the park is nothing short of spectacular in recent years.  Here we examine Landsat imagery to identify changes in two or the larger valley glaciers from 1985-2016.  These glaciers from the headwaters of the Rio Blanco and are designated Rio Blanco North (RBN) and Rio Blanco South (RBS).  Rio Blanco enters the ocean just east of the community of Hornopirén.

In 1985 the two glaciers merged just before the western terminus of the icefield at 820 m, red arrow. The snowline was at 1300 m. There is also an eastern outlet of RBN, terminating at the north end of a basin, red arrow. By 1998 RBN and RBS had separated by over 1 km with the formation of a new lake at the former terminus. The eastern terminus of RBN has begun retreat and is now ending in a proglacial lake.  RBS is developing a nunatak at the purple arrow. The snowline was again near 1300 m.  By 2016 RBN has retreated 4.5 km, and now terminates at 1200 m, yellow arrow.  The deglaciated valley now hosts three alpine lakes that did not exist in 1985.  The eastern terminus of RBN has retreated 1100 m and is still terminating in an expanding alpine lake, yellow arrow. By 2016 RBS had retreated 3.4 km since 1985, terminating at 1180 m, yellow arrow. The nunatak in the lower section of RBS, purple arrow, has continued to expand.  RBN has lost 56% of its length since 1985 and RBS 37% of its length.The snowline in 2015 and 2016 is at 1600-1700 m.  This leaves only a small percentage of the glacier area above the snowline.  The large valley glaciers that just 30 years dominated the headwaters of Rio Blanco have lost much or their area and will soon be small slope glaciers clinging to the highest peaks.  Retreat here is more extensive than seen 100 km to the northwest at Calbuco Volcano and for the Northern Patagonia Icefield.

hornopiren-glaciers

Landsat comparison of Rio Blanca Glaciers in Hornopirén National Park, CVhile from 1998 to 2015.  Red arrow 1985 terminus, purple dots the snowline and purple arrows expanding bedrock areas amidst the glacier.

hornopiren-terminus

East Terminus of Rio Blanca North, with the newly formed lake.  This terminus is above 1300 m and has retreated largely via iceberg calving.

RG150-17.01019 Glacier Retreat, Southern Patagonia Forms Lake


peel-landsat-compare

Retreat of RG150 indicated in Landsat images from 1984, 2001 and 2015.  Red arrow indicates 1984 terminus and yellow arrow 2015 terminus. 

RG150 is a 3.5 km long glacier in Bernardo O’Higgins National Park on the western edge of the Southern Patagonia Icefield, Chile.  RG150 is an unnamed glacier given this designation as part of the Randolph Glacier Inventory.  The glacier terminates in a lake that drains into Seno Andrew.  Willis et al (2012) observed that between February 2000 and March 2012 that the Southern Patagonia Icefield is rapidly losing volume and that thinning extends even to high elevations.  The mass balance loss is occurring at a rate of −20.0 ± Gt/year, which is +0.055 mm/year of sea level rise. The retreat has been driven by increasing calving rates from the 1975-2000 to the 2000-10 period (Schaefer et al, 2015). The pattern of retreat is consistent between these glaciers and the region as noted by Davies and Glasser (2012), annual rates of shrinkage in the Patagonian Andes increased in from 0.10% year from 1870-1986, 0.14% year from 1986-2001, and 0.22% year from 2001-2011. Davies and Glasser (2012), note the all the glaciers in the complex inclusive of RG150 had their fastest retreat period from 2001-2015. Glasser et al (2016) observed both an increase in glacier proximal lakes and in debris cover on glaciers with glacier retreat from 1987-2015. These losses have led to retreat such as at Balmaceda Glacier,  Glaciar Marconi and Glacier Onelli.  Here we examine Landsat imagery from 1984 to 2015 to identify glacier change and the formation of a new lake.

In 1984 there was no glacier lake at the terminus, with the lower 1 km of the glacier being a low sloped glacier tongue.  By 2001 a small proglacial lake had developed 250-300 m long.  In 2005 the glacier retreat had led to continued lake expansion.  The glacier had filled the lake with numerous small icebergs.  By 2015 the glacier still terminates in the proglacial lake that is not 850-900 m long.   The glacier retreat of 850 m since 1984 is 20-25% of the total glacier length.  The low slope region is minimal in length in 2015 indicating the lake basin is almost complete.  This will lead to a reduced rate of retreat.  This is a very cloudy region, and the images here are not at the end of the melt season.  Hence, the equilibrium line altitude can be ascertained.  At the crest of the glacier 1300 m, there are a number of wind sculpted features that are 400-600 m long, attesting to the strong westerly winds in the region. RG150 has significant retained accumulation each year and can survive the current climate.

peel-ge-compare

Retreat of RG150 indicated in Google Earth images from 2005 and 2015.  Red arrow indicates 1984 terminus and purple arrows indicate wind features at the top of the glacier.

peel-oblique

RG150  in Google Earth image looking upglacier in 2015.  Red arrow indicates 1984 terminus and yellow arrow 2015 terminus and purple arrows indicate wind features at the top of the glacier.

Barnes Ice Cap, Baffin Island Evident Response to Climate Change

barnes-melt-trails-2016

Barnes Ice Cap transect and closeup of divide area in August 2016.  Black dots indicate summit divide of the ice cap. Notice the channels extending away from the divide.  These are not stream channels, as they are too wide, but they are meltwater formed valleys that are preferred pathways for the meltwater transport.

Barnes Ice Cap located in the center of Baffin Island, Canada covers an area of ~5800 km2.  The ice cap is approximately 150 km long, 60 km wide and has maximum ice thickness of ~730 m and a maximum ice elevation of 1124 m above sea level (asl) at the summit of the north dome (Andrews, 2002).  They also note a retreat of the southeast margin of 4 m/year from 1961-1993 on the southeast margin (Jacobs et al 1997).  Dupont et al (2012) identified that the melt season increased from 66 days fro the 1979-87 period to 87 days from 2002-2010. They also noted that ICESat altimeter data indicated the thinning of the BIC at a mean rate of 0.75 m/year for the 2003–2009 period. Gilbert et al (2016) Figure 5 indicates the ELA was at 950 in the 1960-80 period and is at 1100 m from 2002-2010 this leaves  a limited accumulation zone area. observe that  Barnes  Ice Cap has nearly lost its accumulation area over the last 10 years, in part due to the longer melt season.  The glacier does tend to not retain snowcover the accumulation zone consists of superimposed ice at the crest. Papasodoro et al (2016) noted that glacier wide balances were −0.52  m w.e./year from 1960 to 2013 and doubled to −1.06m w.e./year from 2005 to 2013. They also   The drainage channel development suggests meltwater transport from versus refreezing of meltwater in 2016.

bic-com%5bpare

Landsat comparison of the northwest margin of the Barnes Ice Cap in 1990 and 2016.  Red arrows indicate terminus locations in 1990. Purple arrows indicate an area of stream development parallel to the ice front.  The bright area at the margin of the ice cap is Pleistocene ice (Andrews, 2002). 

Here we examined Landsat imagery from 1990-2016 to illustrate the retreat of the northwest region of the icecap and to take a look at the 2016 melt features and lack of any retained snowcover on the ice cap. In 2016 the melt channels from the divide at the crest of the ice cap are impressive.  There is no retained snowcover at the summit of the ice cap even on August 9th with several week left in the melt season. The melt pathways visible in the imagery from 2016 extend 10 km downslope from the crest of the icecap. In 1990 the ice cap terminated at the red arrows, this included contact with a peninsula in Nivlalis Lake and an island in Conn Lake.  By 2011 and 2014 the glacier had retreated from the locations.  In 2016 the total retreat of the margin has been 600 m at Nivalis Lake, 1100 m at the island in Conn Lake and 450 m further east at the red arrow halfway to Bieler Lake.  This is a slow retreat rate compared to many glaciers, but represents a much higher rate than before 1990, with rates of 18-42 m/year.  There is a new section of river parallel to the ice cap margin between Conn and Bieler Laker.

2016-barnes-transect

barnes-2011-nw

2011 Landsat image of northern margin indicating retreat from the 1990 postiion red arrows.

barnes-nw-2014

2014 Landsat image of northern margin indicating retreat from the 1990 postiion red arrows.


Hagafellsjokull, Iceland Reflects Langjokull Thinning & Retreat

hagafellsjokull-compare

Landsat comparison of the terminus of Hagafellsjökull from 2000 and 2016.  The red arrows are the 2000 terminus, the yellow arrows the 2016 terminus.  Purple arrows indicate upglacier thinning. 

Langjökull is the second largest iceap in Icalnd with an area of over 900 square kilometers. The mass balance of the icecap has been reported since 1997 and his lost over 1 m per year during this period (WGMS, 2016).  Pope et al (2010) noted that the icecap has lost an area of 3.4 ± 2.5 km2 yr-1 over the decade from 1997-2007.  Pope et al (2010) noted that the loss of ice volume confirms previously published predictions that Langjökull will likely disappear within the next 200 years if current trends continue. A key outlet of  Langjökull is  Hagafellsjökull which terminates in Hagvatn. Hagafellsjökull ended a sustained post Little Ice Age retreat in 1970.  The ensuing advance of approximately 1 km ended by 2000.  Here we examine Landsat imagery from 2000-2016 to identify recent changes in this outlet glacier.

In 2000 the glacier terminated on an island in Hagavatn, red arrow.  The east margin of the glacier featured several locations where secondary termini overflowed a low ridge on the east side of the glacier.  By 2006 the glacier had retreated 500-600 m from the island.  By 2016 the terminus had retreated across its entire width by 800-850 m, 50 m/year, yellow arrows.  A closeup view from the Iceland online map application illustrates the 2014 terminus red dots. The end of the glacier has a low slope, low velocity and is debris covered.  The western side has terminated on land during this entire period and has approximately the same retreat rate as the eastern half that still ends in the expanding lake. There is little evidence of iceberg release into the lake, which helps explain the similar retreat rate. The low slope and upglacier thinning noted at the purple arrows indicate the retreat will continue.  In 2014 the transient snowline reached near the head of the glacier at over 1100 m.  In 2000, 2006 and 2016 the snowline with several weeks left in melt season ranged from 859-950 m. The retreat is similar to that of Norðurjökull another outlet of the Langjökull and Porisjokull.

langjokull-south-outlet-ge-2010

Google Earth view of the terminus of Hagafellsjökull in 2014. Red arrow is the 2000 terminus position and yellow arrow the 2014 position.

 hagafellsjokull-ismap

Online Iceland Map Viewer indicating the terminus of Hagafellsjökull in 2014, red dots.

hagafellsjokull-tsl

2006 and 2014 Landsat images of Hagafellsjökull indicating the transient snowline off the image in 2014 and at 850 m in 2006.

Thulagi Glacier, Nepal Retreat and GLOF Potential


thulagi-compare

Thulagi Glacier change in Landsat images from 1991 and 2016.  Red arrow is 1991 terminus, yellow arrow 2016 terminus and purple arrow increasingly exposed bedrock rib amidst icefall.

Written With Prajjwal Panday: @prajjwalpanday

Thulagi Glacier terminates in a lake referred to both as Thulagi and Dona Lake. ICIMOD (2011) has identified this as a potential threat for a glacier lake outburst flood (GLOF) and has conducted extensive fieldwork there.  Thulagi Lake is southwest of Mt..Manaslu in western Nepal at an altitude of 4,044 masl. Here we report on the identified threat and use Landsat imagery to identify changes in the glacier. Thulagi Lake has attracted much attention because two hydropower projects have been developed downstream on the Marsyangdi river basin, Marsyangdi Hydropower Project (69MW) and the Middle Marsyangdi Hydropower Project (70MW). Thulagi Lake began to form about 50 years ago and ICIMOD present field investigations showed that from 1995 to 2009, the length of Thulagi Lake had increased from 1.97 to 2.54 km, due to retreat and the lake area increased from 0.76 to 0.94 sq.km. ICIMOD (2011) did a bathymetric survey of Thulagi Lake using an inflatable boat. The volume was calculated to be 35.3 million cu.m in 2009 an increase from 31.75 million cu.m in 1995. The small increase despite significant area increase was because of a surface elevation lowering rate from 2003-2009  of 0.3 to 0.5 m/yr. They found the moraine walls were sinking, but more slowly at a rate of about 0.1 m/yr:  The glacier experienced substantial retreat of 1.65 km from 1958 to 1995.

From 1991 to 2016 the glacier has retreated 750 m a rate of 30 m/year.  The debris cover extends from the terminus 4.25 km upglacier  to 4500 m.  The low slope indicates the lake will continue to expand and the rate retreat should remain high. The bedrock rib is in the icefall that extends from 5600 m to 4600 m, purple arrow. The rock rib at 5000 m in the midst of the icefall is more exposed in Landsat images from 2012 to present than from 1988-2001.  This suggests some thinning.  All images indicate snowcover is persistent above 5800 m. The glacier terminus continues to calve into the lake as seen in the 2012 Google Earth Image, the 40 m high ice front calves only small icebergs that ICIMOD did not deem sufficiently large to trigger a GLOF event by the surge waves. They also noted that temporary blockage of the lake outlet by river ice, snow barriers, or lake ice debris, appears unlike.

Khanal et al (2015) examined the total value at risk under the modeled GLOF scenario of US $406.73 million for Thulagi. The estimated maximum flow was 4736 m3 /second for Thulagi. The majority of this potential damage was to the two hydropower projects.  They noted 125 buildings and  100 acres of irrigated land at risk. A group of Nepali and US scientists carried out stability assessment of Thulagi Lake and its moraine after the April 2015 7.8 magnitude earthquake (USAID, 2015). They noted that the main moraine complex at the end of the lake is relatively stable (black arrow), while the end moraine is less stable (purple arrow). The earthquake caused some slumping of the outlet at the terminal moraine and some deterioration of this moraine. Overall the hazard due to the declining water level would offset some or all of this moraine deterioration in terms of overall risk of a GLOF. Although local people are aware of the deteriorating nature of the terminal moraine at Thulagi, community discussions revealed less concern regarding the possibility of an outburst flood (USAID 2015). However, there is a demand for risk reduction activities such as installation of early warning systems, lowering of lake levels, and development of community-based disaster response plans. There is a general consensus for a science-base community driven approach to address and find solutions for these types of lakes where communities and stakeholders participate starting from research to action.

The retreat of Thulagi Glacier is similar but less rapid than many Himalayan glaciers terminating in lakes; Thong Wuk, West Barun, Lumding and Lhonak

middle-marsyangdi

Middle Marsyangdi Hydropower Station and reservoir in Google Earth

marsyandi

Marsyangdi Hydropower Station and reservoir in Google Earth

thulagi-outlet-copy

Thulagi Lake outlet.  Black arrow points to main moraine complex.  Purple arrow to the less stable terminal moraine.

thulagi-ge

Thulagi Lake in 2012 Google Earth image.  Yellow arrow is recently calved ice and purple arrow indicates bedrock within icefall.

Desolation Valley, Alaska, Conversion from Glacier to Lake


desolation-compare

Retreat of Desolation-Fairweather Glacier from 2010-2016 in Landsat images.  The red arrow indicates 2010 terminus positions, yellow arrow the 2016 terminus. Pink arrow a delta exposed by lake level lowering. D=Desolation Glacier.

Desolation Glacier flows west from the Fairweather Range into Desolation Valley where in 1986 it joined with the Fairweather Glacier flowing from the north and the Lituya Glacier flowing from the south to fill the valley with glacier ice.  This is no longer the case, the valley once known for its long relatively flat area of largely debris covered ice, is mostly a lake now.  The valley has developed along the Fairweather Fault. Molnia (2007) noted that the tidewater termini of Lituya Glacier advanced ∼ 1 km since 1920 and continued to advance up to 2000 as it built an outwash plain reducing calving. Larsen et al (2015) noted thinning rates of 3 m per year for the Desolation Valley from Desolation Glacier north to Fairweather Glacier in the last decade (1994-2013).  Alifu et al (2016) identified that Desolation Glacier and Fairweather Glacier have lost 2.6% and 2.2% of their glacier area, respectively from 2000-2012. Only minor surface area changes were seen in Lituya Glacier during this period. They also noted that the mean snow line altitude of Fairweather, Lituya and Desolation increased by 120–290 m. Since 2012 extensive ice loss of the Desolation-Fairweather complex has occurred.  This is similar to the large rise in the transient snowline/equilibrium line noted by Pelto et al (2013) on nearby Brady Glacier.

In 1986 The Desolation Valley was filled with glacier ice from Fairweather Glacier to Liutya Bay.  By 2010 the southern half of the valley from Lituya Glacier to the outlet of Desolation Glacier into the valley had opened up and the terminus of Desolation Glacier and Lituya Glacier were at the red arrows, this represented a 5.3 km section of glacier lost. In 2013 the northern half of the valley filled by the Desloation-Fairweather Glacier was breaking up but still ice filled.  The Google Earth image from 2014 illustrates how broken up.  By 2016 the collapse was total and the new terminus is at the yellow arrow a 5.5 km retreat since 2010, this is a loss of 6.5 square kilometers of ice. The lake level also dropped which led to exposure of a lacustrine delta that had been submerged in 2013 and 2014, pink arrow. The lake has expanded in area, but lost in mean depth.  Will this continue to be a lake with continued retreat or become a braided river valley as the Fairweather Glacier continues to thin and retreat?  Desolation Glacier is no longer calving and its retreat rate should slow.  The terminus of the Fairweather Glacier should continue to retreat via calving in a fashion similar to glaciers around the world terminating in extensive lakes. Just to the north the North Fork Grand Plateau Glacier also experienced a large recent retreat with Landsat imagery in 2013 and 2014 indicating extensive calving from 2013 to 2015 and a retreat of 3.0 km, 1.5 km/year.  Fingers Glacier  is another nearby glacier that also is experiencing widespread retreat.  More images of the region are in a field blog on the region.

desolatiion-1986-2013

Retreat of Desolation-Fairweather Glacier from 1986 and 2013 in Landsat images.  The red arrow indicates 2010 terminus positions, yellow arrow the 2016 terminus. Pink arrow a delta exposed by lake level lowering. D=Desolation Glacier.

desolation-breakup

Google Earth image from 2014 of the disintegrating debris covered glacier.


Coley Glacier Retreat, James Ross Island, Antarctica

coley-compare

Coley Glacier terminus comparsion in Landsat images from 2000 (red arrows) and 2016 (yellow arrow)  indicating a retreat of 2 km along the western side and 1 km along the eastern side.  Purple dots indicate the transient snowline and the purple arrow an area of debris exposed with glacier thinning. 

Coley Glacier is a tidewater glacier on the northeast side of James Ross Island near the tip of the Antarctic Peninsula. Davies et al (2012) observed that 90% of the glaciers of the Northern Antarctic Peninsula including James Ross Island retreated from 1988-2001 and 79% from 2001-2009. They further observed that the rapid shrinkage of tidewater glaciers on James Ross Island would continue due to their low elevation and relatively flat profiles. Rohss Bay Glacier is one example of this having retreated 15 km from 1999-2009 (Glasser et al, 2011).  Barrand et al (2013) note a strong positive and significant trend in melt conditions in the region, driving the retreat.

Coley Glacier in 2000 had a relatively straight calving front running across the embayment. The front represents the joining of four tributary glaciers.  The snowline was generally below the top of the escarpment just west of Point C, the elevation of this lower glacier reach is below 200 m.  This fits the low elevation low slope criteria noted by Davies et al (2012).  By 2016 the glacier has developed a concave glacier front with the northern tributary almost separating the retreat ranges from 2 km on the west side to 1 km on the east side.  The snowline is above the escarpment at 400 m. A comparison below of 2001 and 2015 indicates that the snowline in 2015 was also near 400 m and above the escarpment. A map of the region from the USGS (Ferigno et al.,2006) illustrates the retreat from the 1960’s to 2000.  Nývlt et al (2010)  reported on the retreat and changes on two glaciers on the north side of James Ross Island.coley-tsl-compare

Coley Glacier terminus comparison in Landsat images from 2001 and 2015.  Red arrows is the 2000 terminus and yellow arrows the 2016 terminus.  Purple dots indicate the transient snowline and the purple arrow an area of debris exposed with glacier thinning. 

coley-glacier-map
COASTAL-CHANGE AND GLACIOLOGICAL MAP OF THE TRINITY PENINSULA AREA AND SOUTH SHETLAND ISLANDS, ANTARCTICA: 1843–2001
USGS (Ferigno et al.,2006)


Ross Ice Shelf Shear Zone-Research Focus of Gordon Hamilton

shear-zone-3

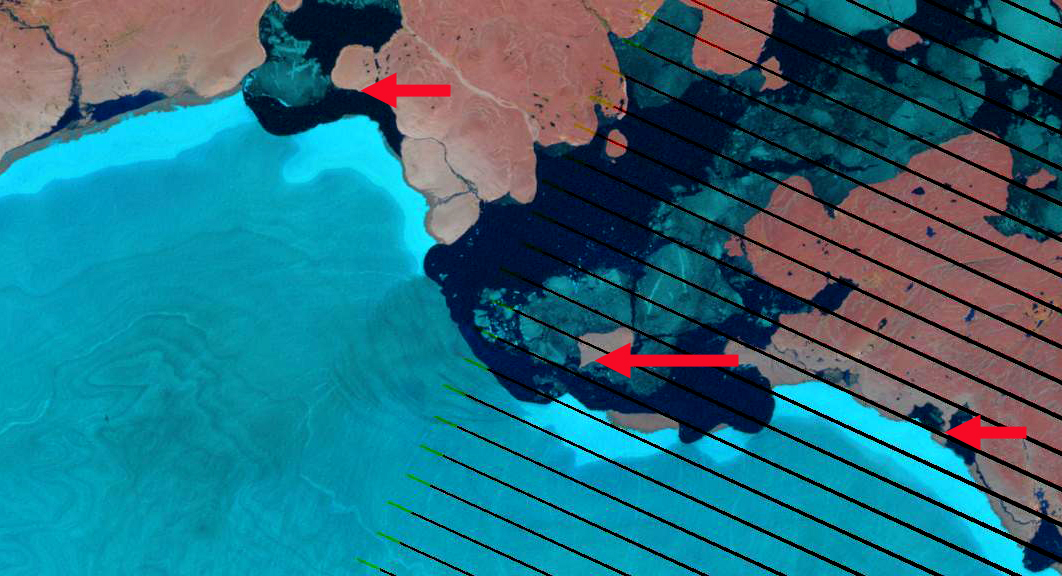
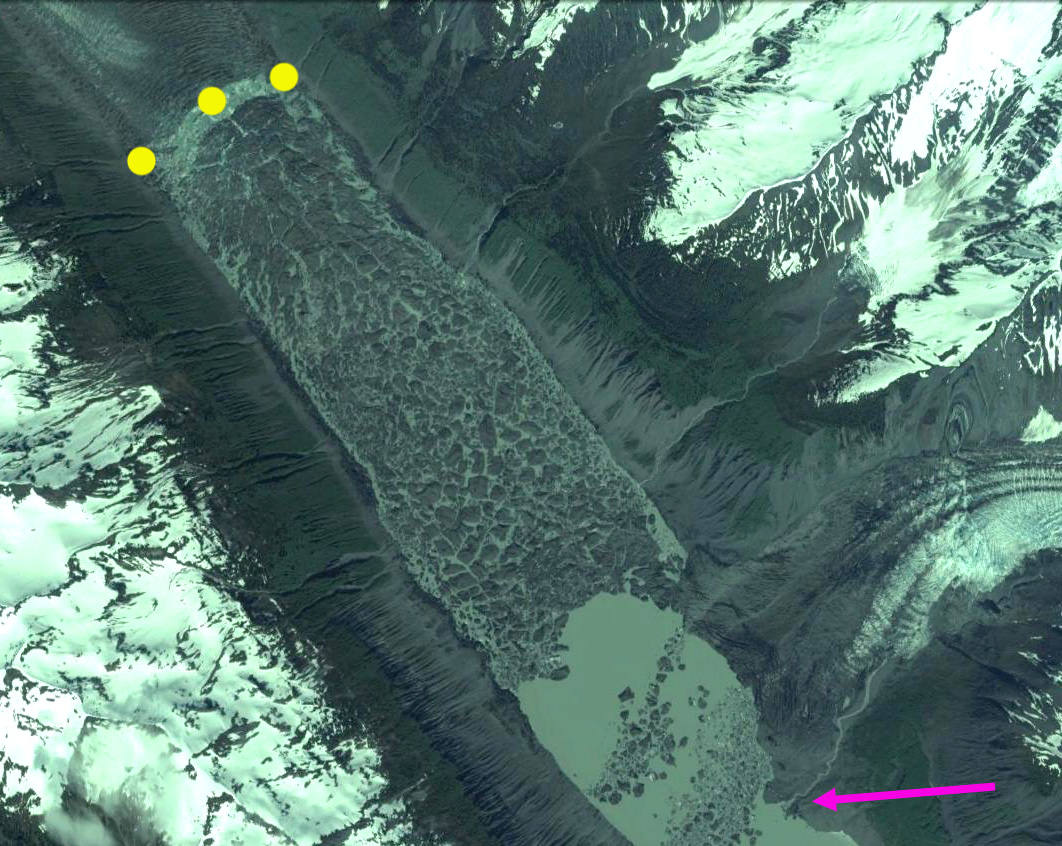
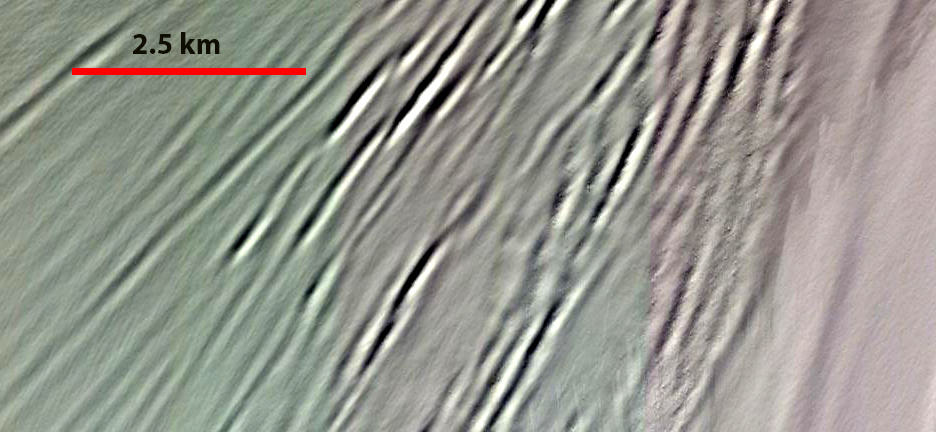
Satellite Image of the Shear Zone:  The crevasses do have a surface representation, but are not generally open. 

Gordon Hamilton lost his life on Saturday Oct. 22, 2016 conducting research in the shear zone between the Ross Ice Shelf and McMurdo Ice Shelf.  I had the pleasure of working with and reviewing Gordon’s work; hence, it seems important to elaborate on the research that had brought researchers to this cold and hazardous corner of our planet.

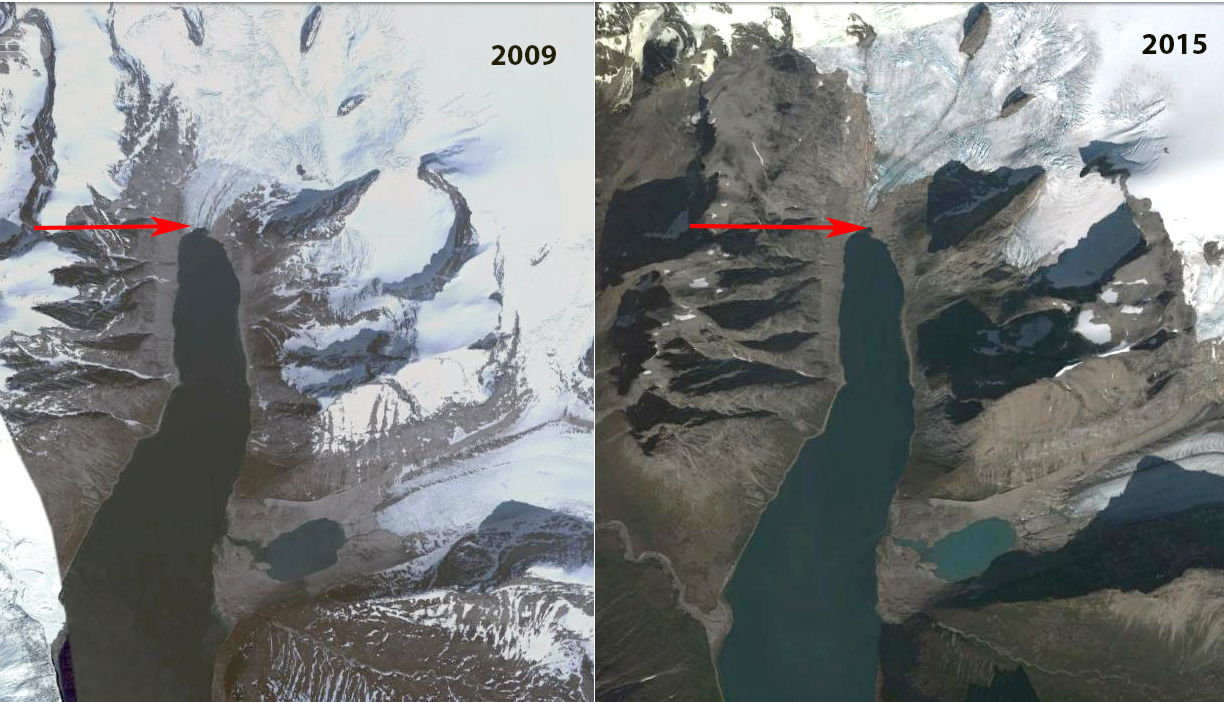
Peter Rejcek of the  Antarctic Sun provided an excellent context for this work two years ago.  The Ross Ice Shelf is the world’s largest ice shelf at ~470,000 square kilometers. This floating ice shelf buttresses many faster flowing outlet glaciers that feed into it. Removal of the ice shelf would allow these glaciers to accelerate as has been seen after other ice shelves are lost, which could lead to enough drainage of the ice sheet to raise sea level 4 or 5 meters. The Ross Ice Shelf is in turn stabilized by pinning points.  Such pinning points include Roosevelt Island and the shear zone. This shear zone represents a region of high shear and velocity change between the two ice shelves. Shear represents friction which helps pin the ice shelf. Gordon Hamilton was the principal investigator on a three-year project to map this shear zone and determine the mechanics. His hypothesis was without the shear zone the Ross Ice Shelf further south would slowly disintegrate.  Without the ice shelf a glacier like Byrd Glacier which drains an immense area, 1,070,000 square kilometers, of East Antarctica could double its speed. Gordon was quoted by Peter Rejcek “The places that really control the future of the ice sheet are hard-to-access places, like shear margins or the underside of the ice shelf or the middle of crevassed outlet glaciers,” he added. “It’s hard to get good data sets there”.  But that is exactly what he was continuing to do, getting the data that would us be able to model and forecast future behavior of the this region, which in turn is crucial to both the East and West Antarctic Ice Sheets.


shear-zone-field-area

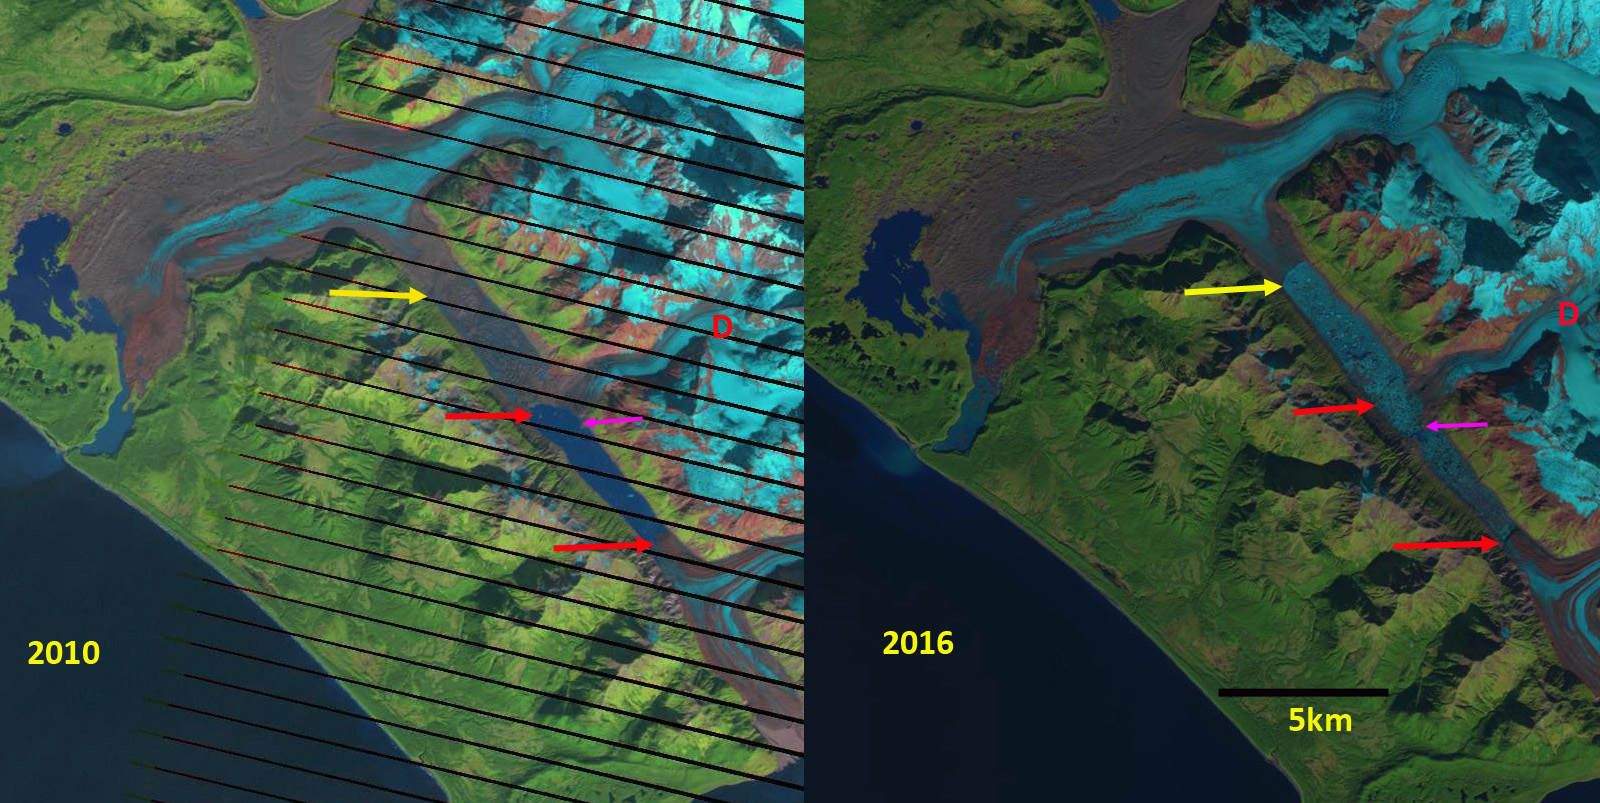
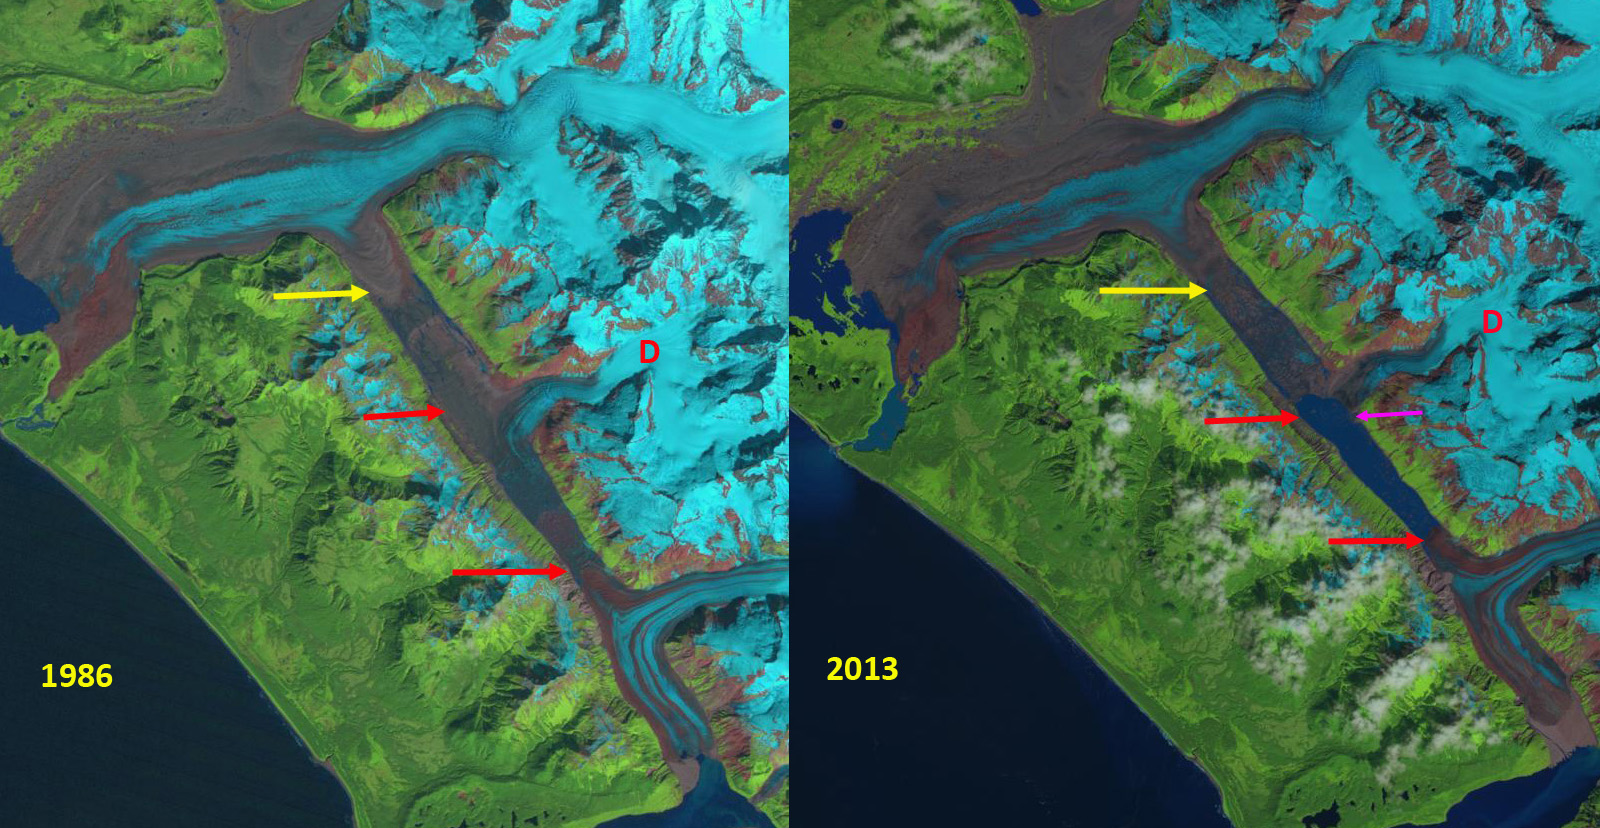
Left: Landsat image of field area from Feb. 2016. Red arrows indicate shear zone. 

Right: MODIS image from Oct. 23, 2016 illustrating the shear zone, red arrows.

To understand what was happening required detailed mapping of the crevasses within the shear zone.  Gordon had noted that the sub-surface crevasses and the visible surface crevasses did not seem to match up well in 2014.  This suggested an unusual flow pattern that could indicate instability within the shear zone. To examine and map the crevasses required detailed GPS and ground penetrating radar observations (GPR).  Because of the danger a pair of Robot rovers were utilized that could do the bulk of the mapping. The robot rovers were developed by Jim Lever, a mechanical engineer with the U.S. Army Cold Regions Research and Engineering Laboratory (CRREL), in conjunction with the Thayer School of Engineering at Dartmouth College. The robots were used to prepare a safe route through the shear zone for the South Pole Traverse route and research in the area.  In fact the two teams last week were camped close by and working together to identify and re-mediate crevasses on the route. Arcone et al (2016) noted that the lightweight robotic vehicles had towed the GPR equipment on 100 parallel transects over a 28km2 grid spanning the shear zone.

Some of their initial findings were presented at the AGU last fall (Kaluzienski et al, AGU, 2015).  The GPR surveys had allowed detailed mapping of the internal structures of the  Shear Zone.  This identified crevasses both in the upper firn and in accreted marine ice at a depth of approximately 170 meters. They also found a  spatial correspondence between near-surface and basal crevasses indicating that local lateral shear generated both. The distribution and orientation of the crevasses was consistent with predictions from a model.  This suggests that the mismatch in crevasses that would suggest instability is not present. This work also indicates that high-resolution modeling can be used to predict the locations of basal crevassing which will lead to an improved understanding of ice-shelf mass balance processes.  More images for the field area are in the field reports from Polartrec.

yeti-pb

Deploying the robot on the ice shelf Photo Credit: Jim Lever

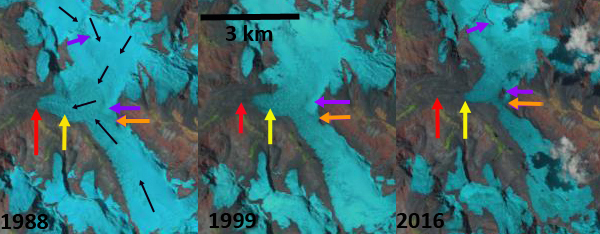
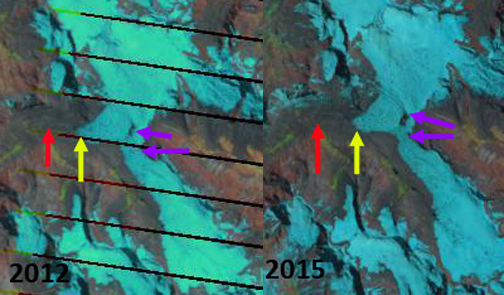
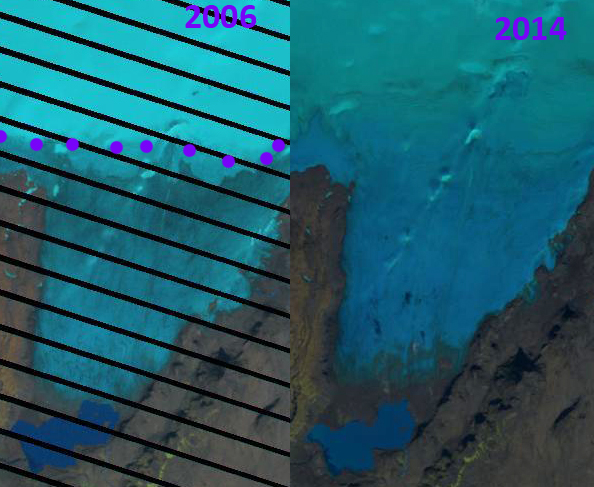
Insights on crevasses and what they could tell us about ice sheet behavior was a passion for Gordon. In Greenland he had been examining ways to use crevasse development to understand changing dynamics of tidewater outlet glaciers.  The work conducted near Raven Camp after crevasses appeared in the skiway in 2012 was quite similar to the shear zone work in Antarctica. They installed stakes located with GPS including several continuously recording stations. This would allow determination of flow speed changes through the summer and if extensional flow had caused the formation of crevasse further inland. Understanding crevasses both for transportation needs and ice sheet behavior.

2009-crevasses-gis

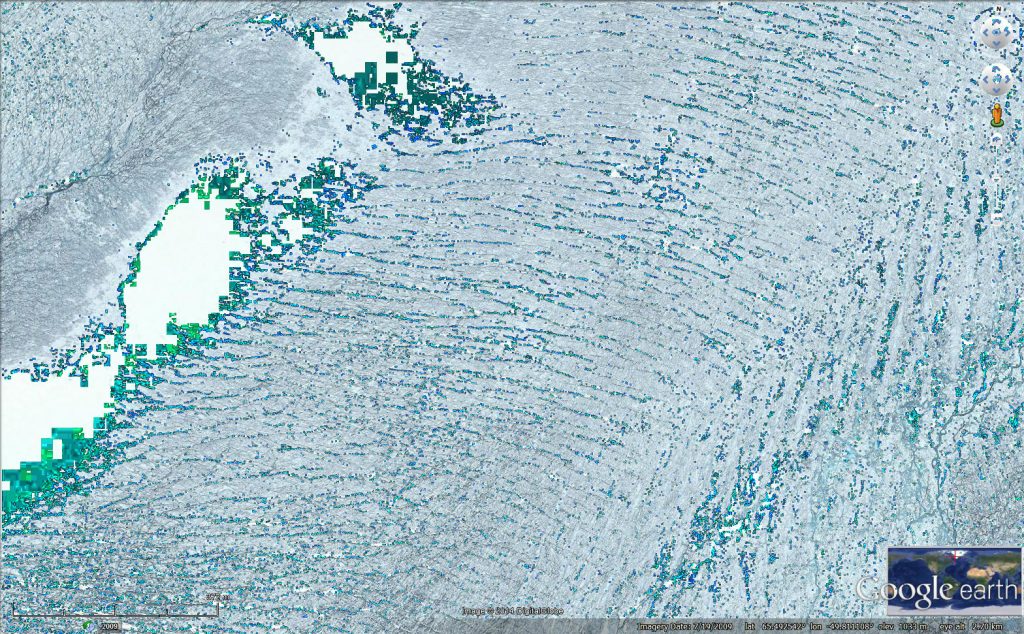
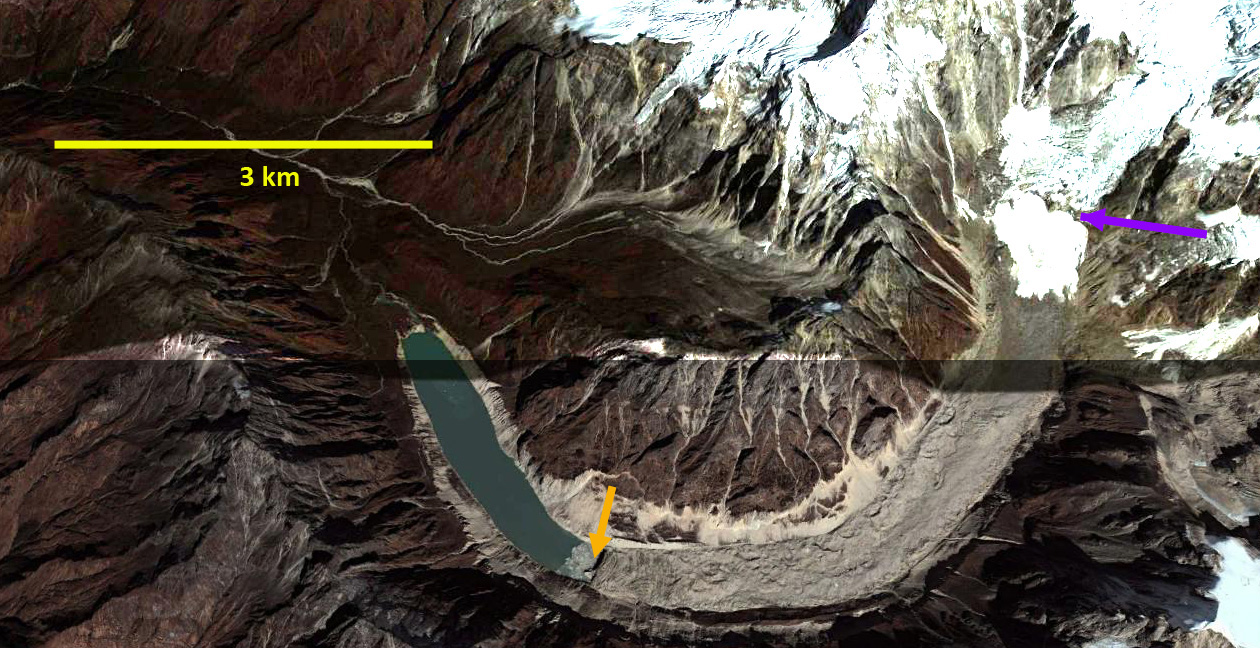
Crevasse Mapping in Greenland from a preliminary study with Gordon Hamilton- from Jill Pelto


Tasermiut Fjord, Greenland loses its Glacier Connection


tasermiut-compare-ls

Landsat image sequence from 1999-2016.  Red arrows mark the 1999 terminus, yellow arrows the 2016 terminus and the purple arrow a tributary that detaches from Semitsiaq (S). Tasermiut Sermeq (T) retreats from the fjord. 

Tasermuit Fjord in southern Greenland is noted for its beauty, and until recently the fjord terminated at a glacier front. Currently no glacier reaches to the fjord. The retreat over the last two decades is similar to neighboring glaciers Kangersuneq Qingordleq and Qaleriq.  The loss of direct glacier connection is also occurring at Alangordlia. Here we examine Landsat images from 1999-2016 to observe glacier change. At the head of the fjord is Sermeq Tasermiut and on the east side is Sermitsiaq.

In 1999 the Sermitsiaq Glacier terminated at the eastern end of a small lake, red arrow.  Tasermiut Sermeq terminated in the fjord, red arrow.  By 2002 Sermitsiaq had retreated from the lake, while Tasermiut Sermeq still reached the fjord.  In 2013 Tasermiut Sermeq had retreated from the fjord and Sermitsiaq had retreated substantially from the lake and also had a significant tributary from the north detach, purple arrow. In 2016 Sermitsiaq has retreated 700 m since 1999, yellow arrow.  Biggs (2011) had noted a 610 m retreat of the glacier from 1987-2009, a slower rate than since 1999. Tasermiut Sermeq has retreated 300 m since 1999,and has a narrow steep tongue that will melt back quickly in the near future.

Murray et al (2015) examined 199 tidewater glaciers in Greenland and noted significant retreat of 188 of them. This is changing fjord dynamics, which will in the case of Tasermiut affect the marine biology, which has not been studied in any detail yet. Students on Ice 2014 Arctic Expedition provides exceptional imagery of this fjord and the Nanotarlik region.

tasermiut-ge-compare

Google Earth imagery of the region. illustrating the loss of fjord connection after 2009.

tasermiut-map

Map of the region