Greenland Fjord Going Ice Free

qororssup copy
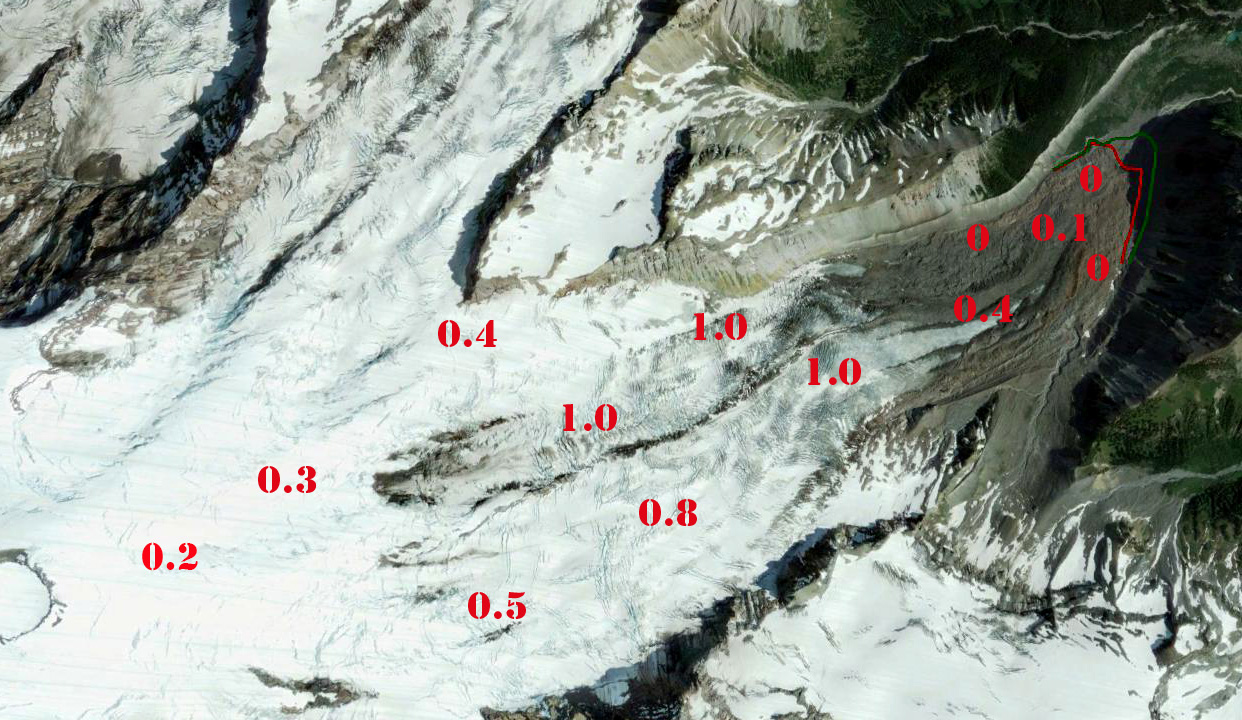
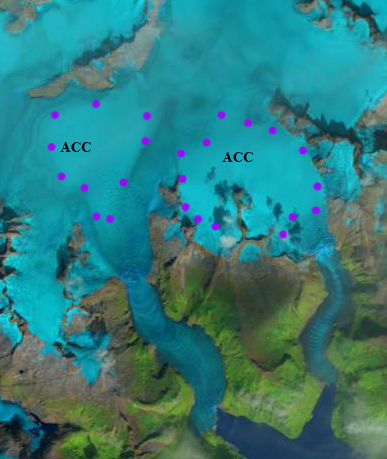
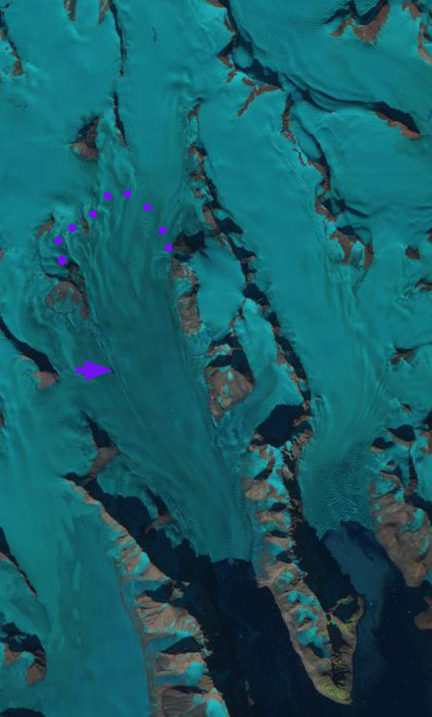
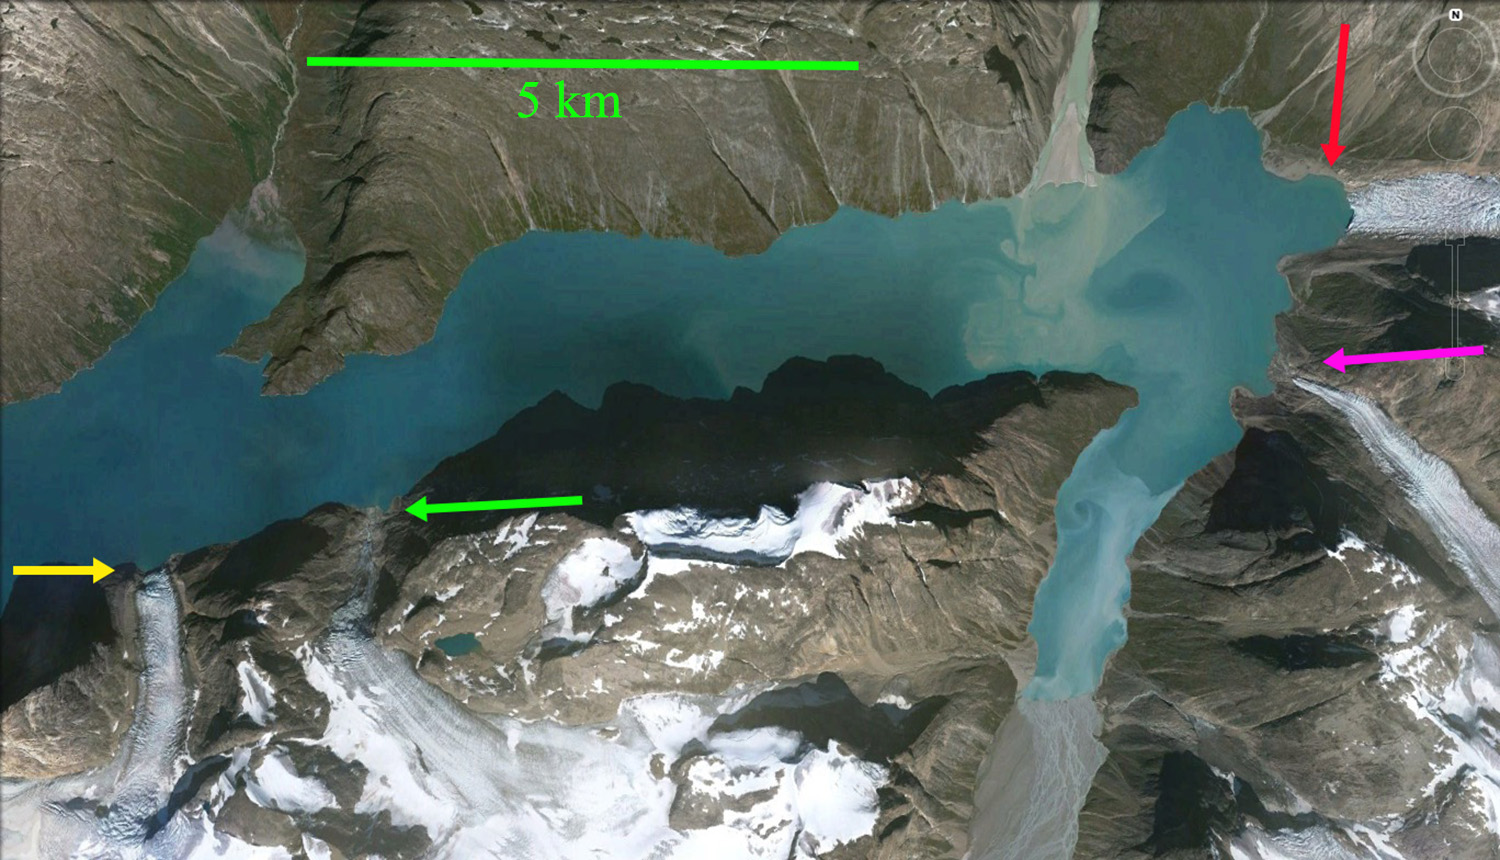
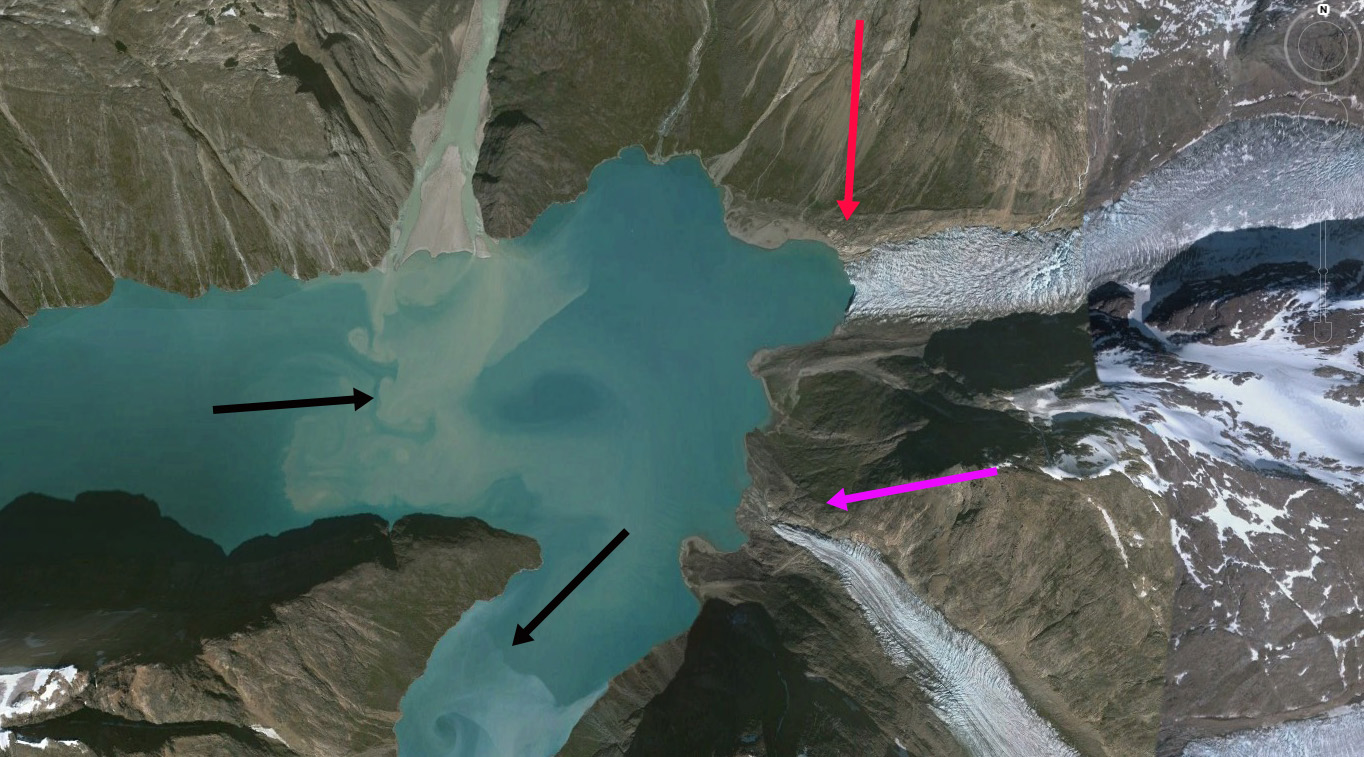
Google Earth image from 2010 of Alangordlia Fjord

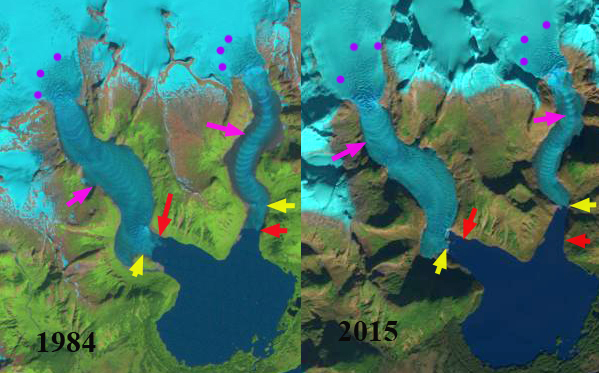
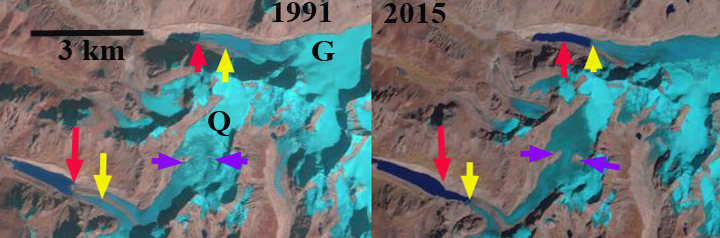
At the AGU 2015 meeting a clear change from 15 years ago is the interdisciplinary nature of most research featured in most sessions.  In the glacier sessions there is physical oceanography, biology, climatology etc.to add in.  I will examine a SW Greenland Fjord, Alangordlia to illustrate this.  In 1987 Landsat image there are four glaciers reaching tidewater in the fjord and two significant glacial fed streams contributing plumes of sediment. By 2015 two of the glaciers, green arrow and pink arrow, have retreated from contact with the fjord. The glacier at the yellow arrow will lose contact with the fjord quite soon, and the glacier at the red arrow has reduced width of contact and will retreat from the fjord in the near future. A closeup using Google Earth from 2010 illustrates the terminus of each glacier, below.

qororssup Landsat
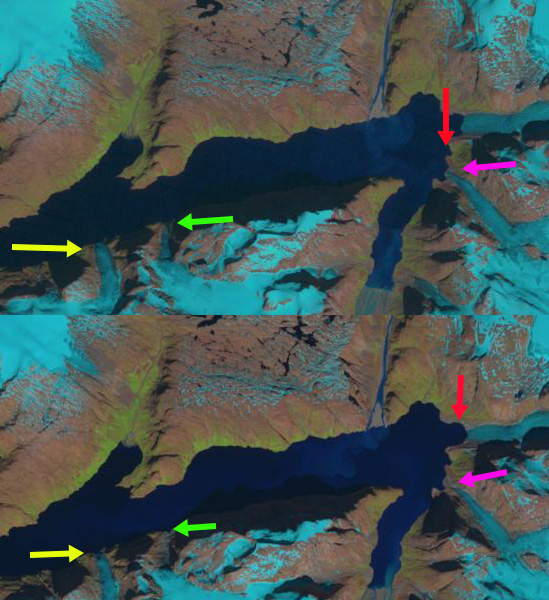
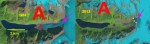
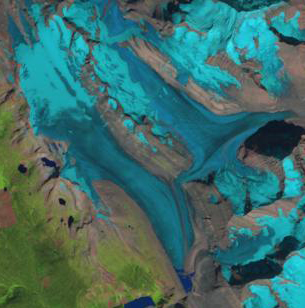
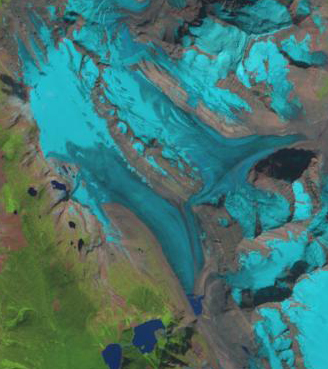
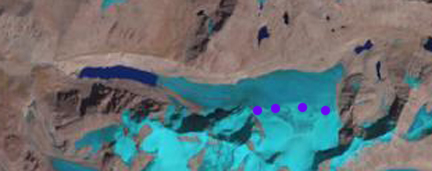
Landsat comparison image from 1987 above and 2015 below.

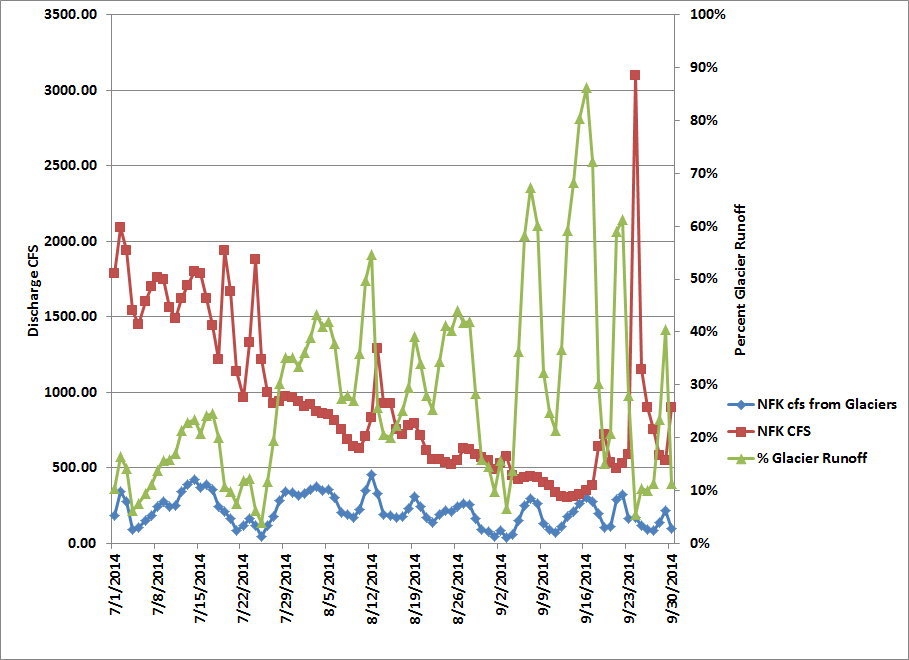
As glacier melt increased in Greenland after 2000, the glacier runoff would have increased along with the sediment and nutrient flux from these streams (McGrath et al., 2010).  These plumes can be seen and even quantified using satellite imagery. The fjord outflow would increase mostly in the near surface layer as the water is fresh.  This would increase the deep water inflow of salty water (Straneo et al., 2011).  The water entering the fjord would be warmer if there is no shallow sill preventing entry. With greater flow and more nutrients the biology of the system would be altered.  Peterson et al (2015) note a summer phytoplankton bloom coinciding with the increase of summer glacier runoff.  In Svalbard examination of biology in front of glaciers by (Lydersen et al, 2013) identify that kittiwakes, fulmars, ivory gulls  and glaucous gulls are common in large numbers in the so-called “brown zone”, the area in front of tidewater glaciers that is ice-free due to currents and muddy due to suspended sediments, such as in Alangordlia.  The further observe that Animals at these sites typically have their stomachs full of large zooplankton or fish and that the brown zones are also foraging hotspots for ringed seals.  If these were larger glaciers with deep bottoms, this water would enhance melting (Chauché et al, 2014).  In this case the thin glaciers would not be much affected. The glacier retreat of these minor glaciers follows the trend of major glaciers. Murray et al (2015) examined 199 tidewater glaciers and noted significant retreat of 188 of them. This resulted in a major increase in overall mass loss from Greenland, which  quadrupled from 1992- 2001 to 2001-2011, yielding a 7.5 mm net contribution to sea-level rise from 1992-2011( Moon , 2014).  The updated response is the Arctic Report Card that will be discussed today at the AGU15 Meeting h (Tedesco et al, 2015).

qororssup bottom
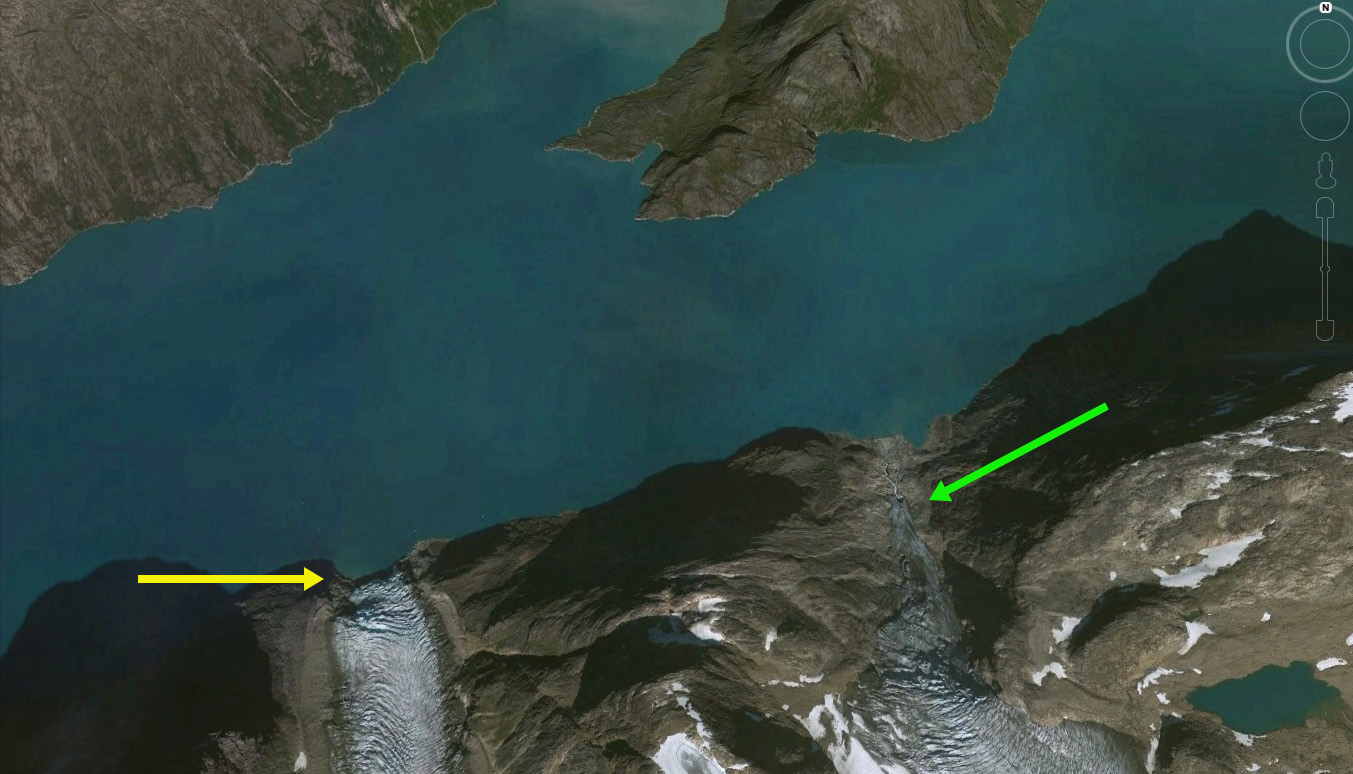
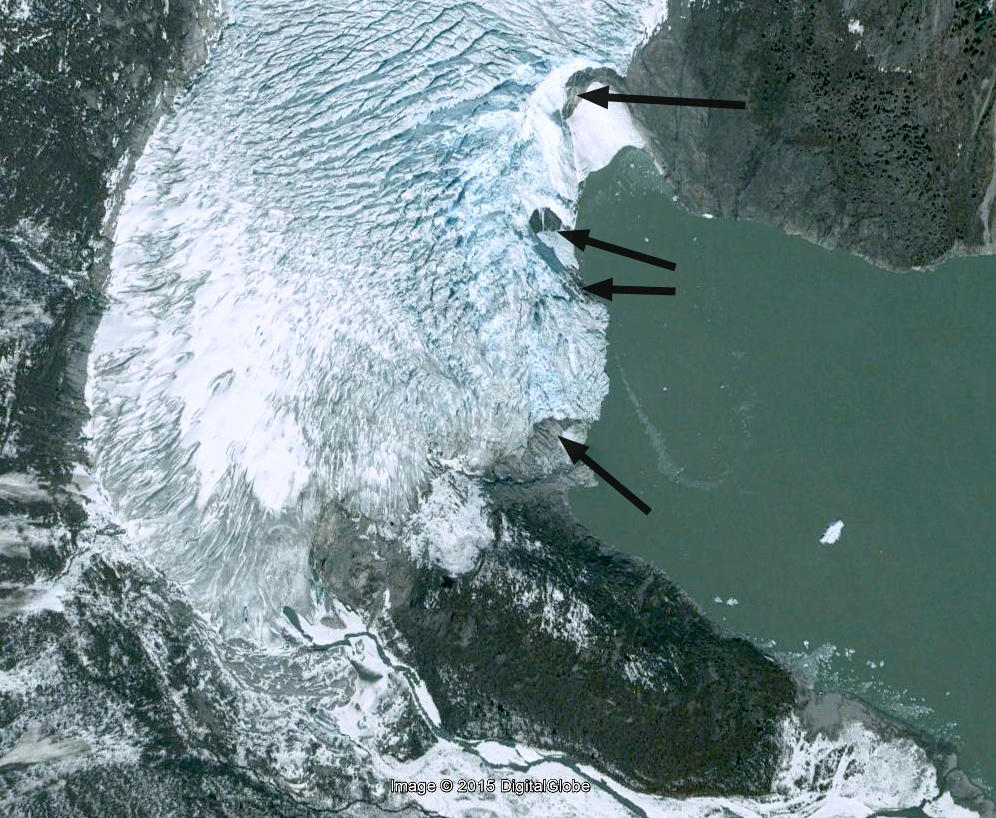
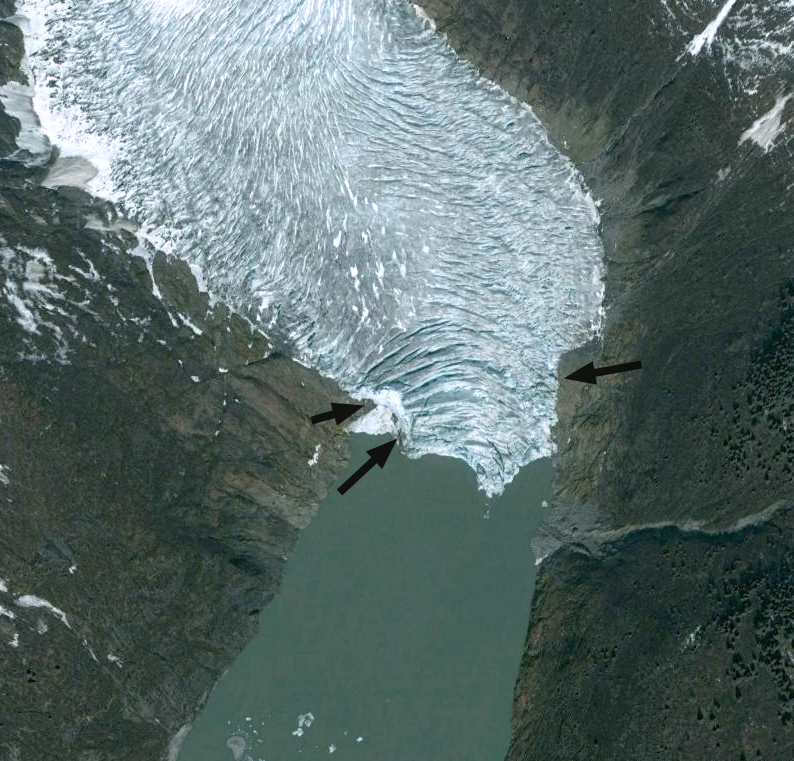
2010 Google Earth of glaciers on the south side of Alangordlia
qororssup end
2010 Google Earth of glaciers at the east end of Alangordlia
qoror map
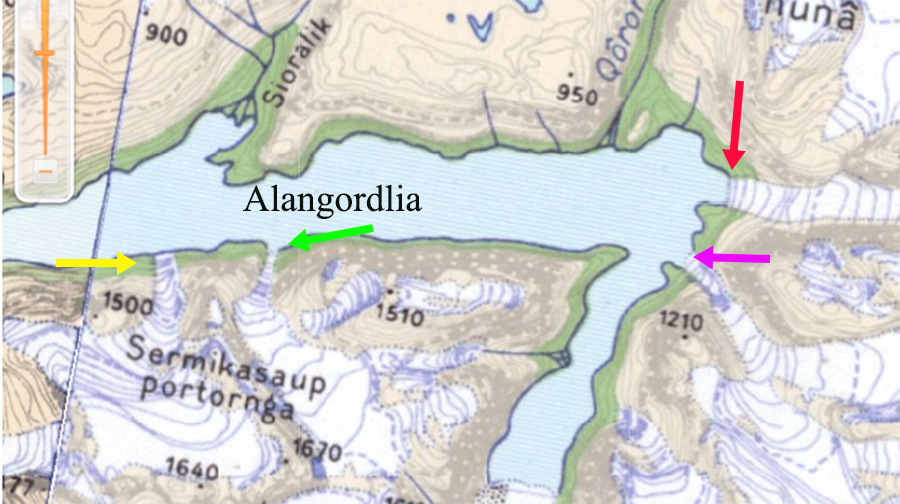
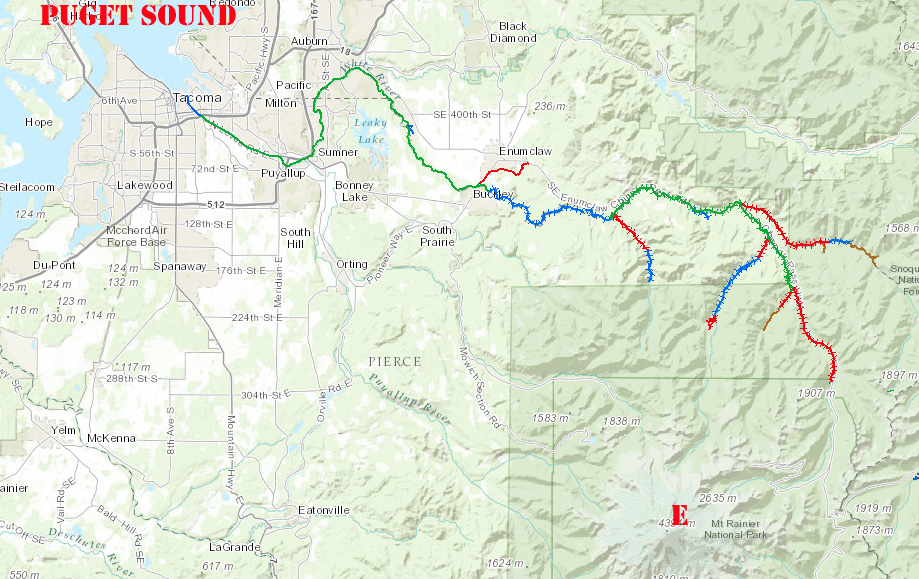
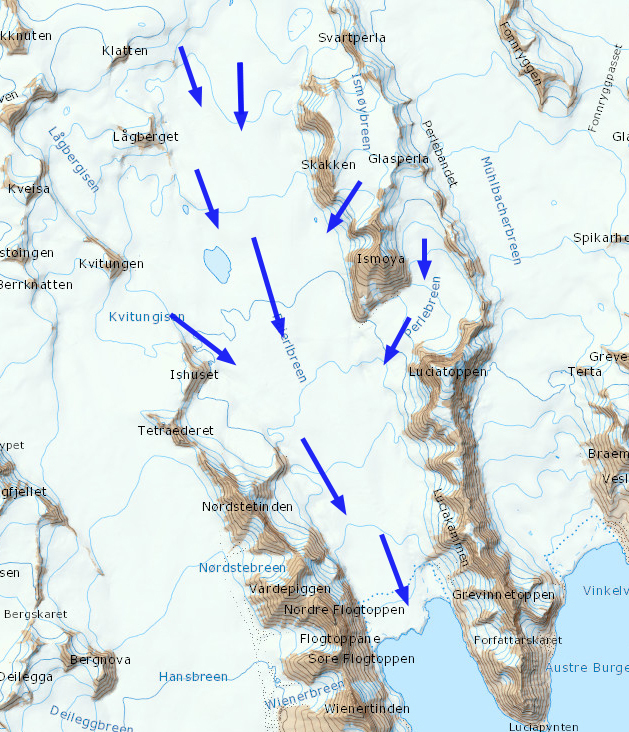
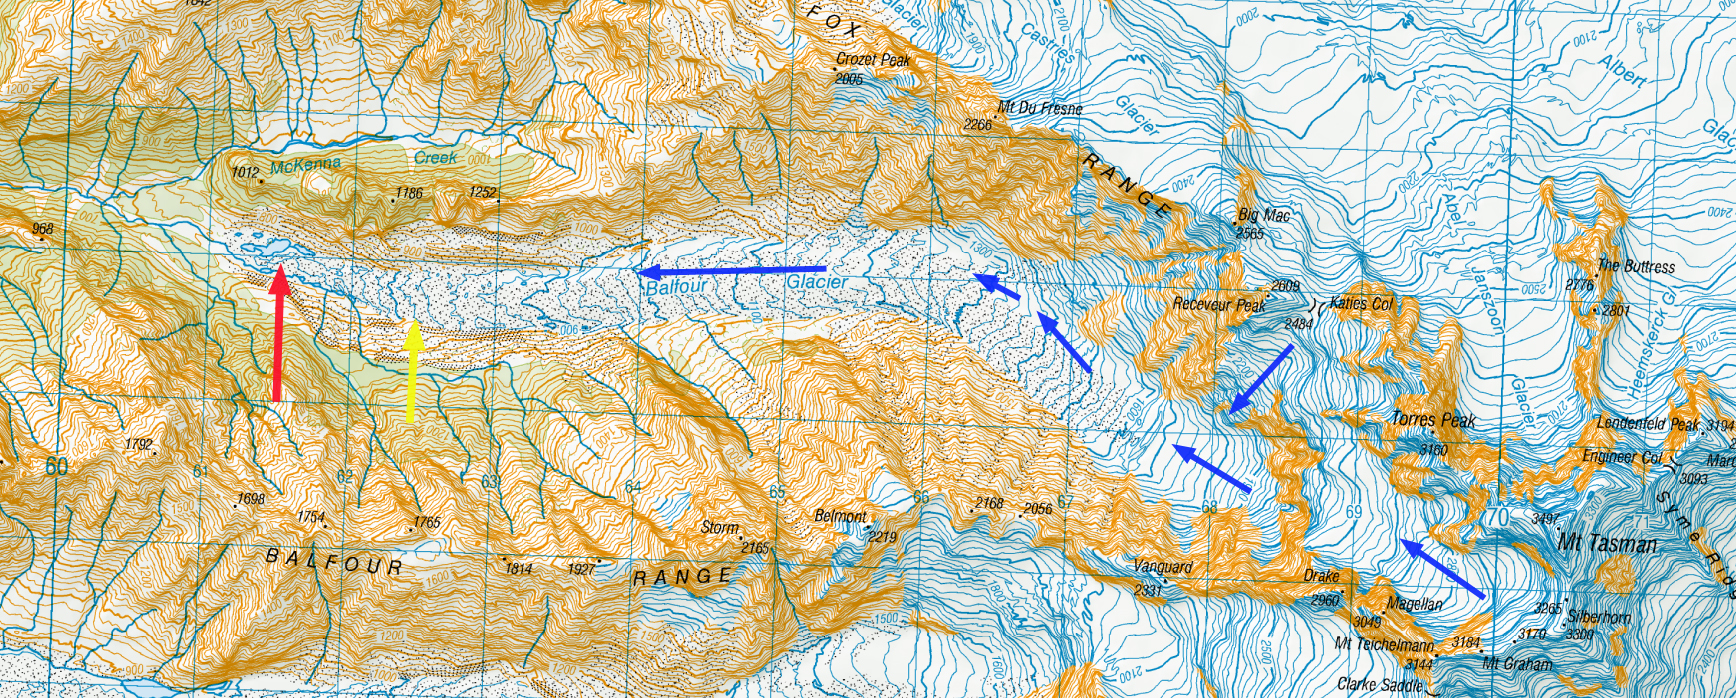
Topographic map of region from NunaGIS

Emmons Glacier, Washington Velocity Map Signals its Future

emmons compare

1966 Aerial image taken by Austin Post, USGS, red arrow indicates discharge stream. Emmons Glacier in 2005, red arrow indicates discharge stream, blue arrow lower limit of clean ice and green arrow region of peak velocity.

Emmons Glacier descends the northeast side of Mount Rainier into the White River, and is its largest glacier by area  The river is host to pink, chum, coho and chinook salmon, note distribution map below. The lower glacier is heavily debris covered from a landslide off of Little Tahoma in 1963, the glacier was advancing at the time and continued to advance into the early 1980’s , maintaining the advanced position until 1994. Retreat was negligible from 1994-2003.  Since 2003 retreat has increased but is still modest.  Thinning of the ablation zone has been ongoing and has been more significant than retreat. The National Park Service mass balance work led by Jon Riedel indicates an approximate 10 m thinning from 2003-2014.

white river salmon

White River chinook salmon distribution from the Washington Department of Fish and Wildlife SalmonScape, green=rearing, red= documented spawning blue=documented presence. 

A recent paper by  Allstadt et al (2015) examines velocity on this glacier using terrestrial radar interferometry.  There key observations are that: Emmons has a slow velocity near the summit < 0.2 m per day , high velocities over the upper and central regions 1.0–1.5 m per day and stagnant debris-covered regions near the terminus < 0.05 m  per day.  That glacier movement is mostly via sliding. Lastly that there is a large seasonal decrease from July to November.  The late summer slowdown is typical of alpine glaciers, where despite peak melt, the drainage system is well developed and basal water pressure is reduced as a result.

The image below indicates velocity distribution in a cursory fashion compared to the excellent detail of Allstadt et al (2015). The glacier has had a negative mass balance in recent years and this combined with the lack of glacier movement near the terminus, indicates this section of the glacier will continue to melt away, slowed by the insulating debris cover.  Google Earth images from 1994 and 2012 indicate an approximately 200 m retreat in the glacier center, and evident thinning in the region up to the yellow arrows. In 2015 record melt was observed in the North Cascades and at least through mid-summer on Mount Rainier.  Currently the area of the glacier has not decline enough to reduce late summer streamflow which would impact salmon during the low flow period.

emmons velocity copy

Velocities noted by Allstadt et al (2015) displayed on Google Earth image.

emmons 1994

1994 Google Earth Image, red is 2012 terminus position, green the 1994 terminus position

emmons 2012

2012 Google Earth Image, red is 2012 terminus position, green the 1994 terminus position

Climate Driven Retreat of Mount Baker Glaciers and Changing Water Resources

breakfast2

We have spent 300 nights in a tent just on this mountain collecting data from 1984-2015 in this study that the book documents.

This post has the same title as a book released last month as part of the Springer Briefs in Climate Studies series.  The nice thing about publishing research emerging from 30 years of field research in a book  is that I had a chance to include 104 figures in 107 pages.   Here I give a brief synopsis of the book and a key figure from each of the six chapters.This book presents the impact of climate change on Mount Baker glaciers, USA, and the rivers surrounding them. Glaciers are natural reservoirs that yield their resource primarily on warm dry summer days when other sources are at their lowest yield. This natural tempering of drought conditions will be reduced as they retreat. Mount Baker, a volcano in the Cascades of Washington, is currently host to 12 principal glaciers with an area of 36.8 km2. The glaciers yield 125 million cubic meters of water each summer that is a resource for salmon, irrigation and hydropower to the Nooksack River and Baker River watersheds. Recent rapid retreat of all 22 glaciers is altering the runoff from the glaciers, impacting both the discharge and temperature of the Nooksack and Baker River. Over the last 30 years we have spent 270 nights camped on the mountain conducting 10,500 observations of snow depth and melt rate on Mount Baker. This data combined with observations of terminus change, area change and glacier runoff over the same 30 years allow an unusually comprehensive story to be told of the effects of climate change to Mount Baker Glaciers and the rivers that drain them.

Red Channel|Green Channel|Blue Channel

Chapter 1: Panchromatic sharpened Landsat image of the glacier of Mount Baker in Aug. 2014, rendered by Ben Pelto (UNBC).  

We have worked on each of these glaciers except Thunder Glacier.  After advancing from 1950-1979, the glaciers have all been in retreat, in 2015 the average retreat was 390 m since 1985. 

easston compare

Chapter 2 Comparison of Easton Glacier from our base camp in 2003 and 2015, where we have spent over 90 nights.  We measure the retreat of each glacier in the field as they respond to climate change.

fig 3-23

Chapter 3 looks at mass balance of glaciers in the area including the Sholes Glacier Daily ablation measurements over the last 30 years allow determination of a relationship between daily melt and air temperature. Other factors matter, but  air temperature does yield a good relationship.

nfk glacier contributiion


Chapter 4 Glacier runoff provides a critical water resource to the Nooksack River.  We measure meltwater runoff from Sholes Glacier and observe glacier melt on several glaciers in the basin.  This allows determination of the contribution of glaciers to the watershed.  In 2014 contributions from glaciers exceeded 40% of total North Fork Nooksack River streamflow on 21 days after Aug. 1.   This is a critical period for salmon migration in the watershed.

fig 5-6

Chapter 5 Glacier runoff is measured below the Sholes Glacier in conjunction with Oliver Grah and Jezra Beaulieu, Nooksack Tribe.  This is the record for part of the 2014 field season at the gage site.

fig 6-22

Chapter 6  Deming Glacier in 2011 Google earth image illustrating retreat. The glacier has retreated 420 m from 1979 to 2015. 


Vilkitkogo Glacier Rapid Retreat, Novaya Zemlya 1990-2015

vilkitskogo compare

Figure 7.4.  Vilkitskogo South Glacier (Vs) and Vilkitskogo North Glacier (Vn) compared in 1990 and 2015 Landsat images.  Red arrows indicate 1990 terminus positions, yellow arrows 2015 terminus positions and purple arrows upglacier thinning.

Vilkitskogo Glacier has two termini that were nearly joined in Vilkitsky Bay in 1990.  The glacier flows from the Northern Novaya Zemlya Ice Cap to the west coast and the Barents Sea. The glacier has been retreating like all tidewater glaciers in northern Novaya Zemlya (LEGOS, 2006).  Carr et al (2014) identified an average retreat rate of 52 meters/year for tidewater glaciers on Novaya Zemlya from 1992 to 2010 and 5 meters/year for land terminating glaciers. For Vilkitskogo they indicate retreat into a widening fjord, and that the south arm has a potential bathymetric pinning point. The increased retreat rate coincides with the depletion of ice cover in the Barents Sea region and a warming of the ocean. Both would lead to increased calving due to more frontal ablation and notch development similar to at Svalbard (Petlicki et al. 2015)

The north and south glaciers both terminated at the mouth of their respective fjords in 1990, with the southern arm ending on a small island/peninsula extension. In 1994 there is limited evident retreat.  By 2001 embayments had developed particularly along the peninsula separating them.  By 2015 Vilkitskogo North has retreated 5000 m along the northern side of the fjord and 4000 m along the south side since 1990.  This fjord has no evident pinning points, and the rapid calving retreat should continue.  Vilkitskogo South has retreated 1000 m on the west side and 1800 m on the east side.The retreat has exposed a new island in the center of the glacier.  The glacier is currently terminating on another island.  Retreat from this pinning point will allow more rapid retreat to ensue.  Upglacier thinning is evident in the expansion of bedrock areas and medial moraine width, purple arrows. This indicates the retreat will be ongoing. There is still a large are of snowcover across the summit of the ice cap each year. The retreat has the same unfolding story as Krivosheina, Nizkiy and Glasova Glacier

vilkitskogo1994

1994 Landsat Image

vilkitskogo 2001

2001 Landsat image

Twin Glacier, Alaska Retreats from Twin Lake

twin glacier compare

Landsat image comparospm pf 1984 and 2015.  The yellow arrow indicates 2015 terminus, red arrow the 1984 terminus, pink arrows the ogives and purple dots the snowline on the day of the image.

Twin Glacier is an outlet glacier of the Juneau Icefield flowing south into the Taku River valley, terminating in Twin Lake.  There are two terminus arms the East and West Twin Glacier are receding up separate fjords, though they are fed from a joint accumulation zone.  The Juneau Icefield has been a focus of study by the Juneau Icefield Research Program since 1946.  This program led to my first visit to the glacier as a member of the program in 1982 and again in 1984. Both glacier arms have pronounced ogives formed in the icefall that descends from the accumulation zone into the valley reach ablation zone. Ogives form annually from the seasonal variation of velocity through the icefall. An examination of the change in Juneau Icefield glaciers using Landsat images from 1984 and 2013 identify a significant retreat that has continued into 2015.

The West Twin has retreated 600 m from 1983 to 2013, at an elbow in the fjord. Elbows like this are often good pinning points that are a more stable setting.  This elbow also represents the point at which the glacier terminus is pulling out of the lake that it is calved into for over a century.  The bedrock at the terminus is evident in both 2006 imagery and a 2015 image from the Wings Airways five glacier seaplane discovery tour, black arrows.  The glacier will no longer be calving, which should also slow the retreat rate.

west twin 2006 ge
Google Earth Image 2006
west twin float plane
2015 Wings Airways image

The East Twin is the  narrower glacier and drops more quickly in elevation. The glacier has retreated 900 m from 1984 to 2015. The terminus has calved into Twin Lake for over a century, but in 2015 the width of the terminus calving into the lake has declined to 150 m from 600 m in 1984.  The bedrock exposed on either side of the terminus indicates the terminus is on the verge of retreating from the lake.  The black arrows indicate both bedrock at the glacier front, but also the trimlines left from recent thinning.  The Google Earth image from 2006 and the 2015 image from the Wings Airways five glacier seaplane discovery tour.

In 2015 the snowline was particularly high, the accumulation zone usually covers the entire reach of the broad high elevation accumulation zone, not the pockets indicated by the purple dots. The declining mass balance identified by the Juneau Icefield ongoing mass balance program, which the high snowlines is indicative of is what is driving the retreat (Pelto et al, 2013).

east twin 2006
Google Earth Image
east twin float plane
Wings Airways Image

twin glacier 2015 acc

August 2015 Landsat image of Twin Glacier.  The purple dots outline the accumulation zone where snowpack was retrained from 2015.

A Voice for Glaciers at COP21

During the last six years From a Glaciers Perspective has published 520 Posts examining the response of glaciers to climate change.  No hyperbole has been needed to use words such as disappear, fragmented, disintegrated, and collapse.  Glacier by glacier from the fragmentation of glaciers to the formation of new lakes and new islands has emphasized the changing map of our world as glaciers retreat.   The story details change, but the story remains the same; glaciers are poorly suited for our warming climate, and their only response is to hastily retreat to a point of equilibrium, which many will not attain, and some have already ultimately failed. The Gallery below is a mere snippet of the changes that are occurring. These are illustrations of why our paper this year led by the World Glacier Monitoring Service team was titled Historically unprecedented global glacier decline in the early 21st century. As the UN Climate Change Conference 2015 in Paris, COP21 begins, since no glaciers are invited, there story must be told in pictures, data and our words.

Data: World Glacier Monitoring Service Mass Balance Time Series for Alpine Glaciers.


_summary-2012-2013-2014.xlsx

Pictures


Words:

After 34 consecutive summers working on glaciers, there is occasion to speak as more than just a scientist, since glaciers do not have a voice people hear.

Paierbreen Rapid Calving Retreat, Svalbard

paierbreen compare
1990 and 2014 Landsat images indicating Paierbreen (P), Muhlbacherbreen (MU) and Hansbreen (H). The red arrow and red dots indicate the 1990 terminus location and yellow arrows and yellow dots the 2014 terminus location. The purple arrow indicates the location of a supraglacial lake that was persistent in the 1990’s but is no longer evident in 2013, 2014 and 2015.

From 1990 to 2014 all four of the glaciers terminating along the north coast of Hornsund have retreated significantly: Hansbreen (H), Paierbreen (P), Muhlbacherbreen (MU), Storbreen. Svalbard is host to 163 tidewater glaciers with a collective calving front of 860 km (Błaszczyk et al, 2009). Nuth et al (2013) determined that the glacier area over the entire archipelago has decreased by an average of 80 km2 per year over the past 30 years, a 7% reduction. In the most recent period 1990-2007, terminus retreat was larger than in an earlier period from 1930-1990, while area shrinkage was smaller. Hornsund is a fjord that in 2014 almost cuts through the southern Island of Svalbard. The Institute of Geophysics Polish Academy has maintained a Polish Research Station in Hornsund since 1957.  The 1984 map, from the University of Silesia, of the glaciers and geomorphology document the extent of the glaciers in 1983. A more detailed examination by the same researchers, Blaszczyk et al. (2013) reported the total area of the glacier cover lost in Hornsund Fjord area from 1899–2010 was approximately 172 square kilometers. This groups ongoing research, Petlicki et al (2015) , identified the impact of a waterline notch that enhances calving at Hansbreen. This study identifies the importance of water temperature and reduced sea ice cover in the fjord.

Paierbreen in 1990 terminated in Burgerbutka with a 1900 meter long calving front. At the purple arrow a supraglacial lake existed that is also seen in the TopoSvalbard Map. The snowline on Paierbreen is further upglacier of the calving front than for the adjacent glaciers indicating a lower surface slope. By 2014 the glacier has retreated 2200 m with the current terminus at a narrow point in the fjord.  Beyond this point the fjord again expands, which will enhance calving and retreat.  There is no significant step in glacier slope indicating where the tidewater limit is, given the low slope, it is not likely close to the current ice front.  The calving front is 1600 m wide in 2014. The supraglacial lake is only a sliver in 2013 and 2014. The snowline in the Landsat image from 2013 is at 450 m. The story of retreat here is the same as at Samarinbreen and Hornbreen
paierbreen 2013
2013 Landsat Image

paierbreen map
Topographic Map from TopoSvalbard

paierbreen aerial
Satellite Image from TopoSvalbard

Dismal Glacier, British Columbia Prospects Match Name

dismal
Landsat image comparison from 1988 and 2015, red arrow indicates 1988 terminus and yellow arrows 2015 terminus. Purple arrows indicate thinning upglacier.

Dismal Glacier flows north from Mount Durrand in the Selkirk Range of British Columbia.  It drains from 2500 m to 1950 m and its runoff flows into Downie Creek that is a tributary to the Columbia River and Revelstoke Lake.  This lake is impounded by the BCHydro Revelstoke Dam which is 2480 MW facility.  Here we examine Landsat images from 1988 and 2015 to identify changes in this glacier.  The glacier snowline in the mid-August image of 2015 is at 2400  m just above a substantial icefall.  The glacier has retreated 640 m from 1988 to 2015.  The eastern extension at 2200 to 2300 m of the glacier noted by a purple arrow, has lost considerable area, indicating thinning even well above the terminus  elevation. Note thinning of this section of the glacier by 2015 after it joins the main glacier, it is separated by a medial moraine. The terminus in the 2009 Google Earth image has a low slope and is uncrevassed.  This indicates the terminus reach is relatively inactive, but does not appear stagnant.   Tennant and Menounos (2012) examined changes of the Rocky Mountain glaciers just east of this region and found between 1919 and 2006 that glacier cover decreased by 590 square kilometers, 17 of 523 glaciers disappeared and 124 glaciers fragmented into multiple ice masses. This will happen at Dimsal Glacier as it has at Cummins Glacier.  Bolch et al (2010)  observed a 15% area loss from 1985-2005 in this region.  The snowline has been above the icefall at 2400+ m in 2013, 2014 and 2015, indicative of negative mass balance that will lead to continued retreat.  The glaciers name is not due to its future prospects, but its future prospects are indeed dismal.
dismal glacier ge
revelstoke-dam-powerhouse-columbia-river-place
BCHydro image of Revelstoke Dam

dismal glacier
Google Earth image of Dismal Glacier terminus in 2009. Red arrow indicates 1988 terminus position, black arrows various recessional moraine features.

Cummins Glacier Fragmentation, British Columbia


cummins compare 2015Comparison of the Cummins Glacier from 1986 to 2015.  Purple arrows indicate upglacier thinning and disconnection. Red arrow indicates 1986 terminus position.  Note the lack of snowcover in 2015. 

The Cummins Glacier is part of the Clemenceau Icefield Group in the Rocky Mountains of British Columbia. The Cummins Glacier via the Cummins River feeds the 430 square kilometer Kinbasket Lake, on the Columbia River.  The lake is impounded by the 5,946 MW Mica Dam operated by BCHydro.  Jiskoot et al (2009) examined the behavior of Clemenceau Icefield and the neighboring Chaba Icefield. They found that from the mid 1980’s to 2001 the Clemenceau Icefield glaciers had lost 42 square kilometers, or 14% of their area.  Tennant and Menounos (2012) examined changes of the Rocky Mountain glaciers and found between 1919 and 2006 that glacier cover decreased by 590 square kilometers, 17 of 523 glaciers disappeared and 124 glaciers fragmented into multiple ice masses.  Here we examine the Landsat images from 1986-2015 to illustrate that Cummins is one of those fragmenting glaciers.

cummins map

Cummins Glacier on the western side of the Clemenceau Icefield shares a connection with Tusk Glacier.

In 1986 Cummins Glacier had a joint terminus with the main southeast flowing branch and the west flowing branch terminating at the red arrow.  The glacier also had a substantial connection, purple arrow,  with Tusk Glacier that flows east terminating northeast of Tusk Peak.  There are other connections with other high elevation accumulation areas, purple arrows.  In 2013 and 2014 Cummins Glacier had less than 20% retained snowcover by the end of the melt season.  Typically 50-65% of a glacier must be snowcovered at the end of the summer season to be in equilibrium.  In 2015 conditions were even worse with no retained snowcover, in fact there is only minor patches of retained firn from previous years.  The lack of a persistent accumulation zone indicates a glacier that cannot survive the climate conditions (Pelto, 2010).  By 2015 a proglacial lake had formed at the terminus that is 500 m long, representing the retreat during the thirty year period.  The west flowing portion of the Cummins has detached from the larger branch.  The connection to Tusk Glacier is nearly severed, and in terms of flow is effectively ended. Retreat of the margin higher on the glacier is also evident at each purple arrow. Tusk Glacier is no longer connected to Duplicate Glacier, and has retreated to the north side of Tusk Peak.  The dominant change in Cummins Glacier has been thinning, it should now be poised for a more rapid retreat.

The result for Kinbasket Lake of the loss of the collective large area is a reduction in summer glacier melt and summer glacier runoff. The annual runoff which will be dominated by annual precipitation would not change just because of the glacier loss as noted in cases like the Skykomish Basin (Pelto, 2011) and on Bridge River (Stahl et al 2008).

cummins 2013

2013 Landsat image indicating 20% retained snowcover with a month left in the melt season.

cummins 2014

Landsat image 2014 about 25% retained snowcover with three week left in the melt season.

apex-watershed

Google Earth Image of Cummins Glacier location to Kinbasket Lake.

Why Glaciers are not like Swiss Cheese


There have been a number of quotes indicating that glaciers/ice sheets are like swiss cheese. Swiss cheese has holes and has little structural strength, and is often used as a metaphor to imply weakness. In the ablation zone of many glaciers there are holes, moulins, that are typically 0.5-10 m wide. A moulin is a narrow, tubular conduit in a glacier that provides a pathway for water to travel from the glacier’s surface towards the glacier base. A moulin is carved by an active flow of water, which has considerable energy as it falls. The volume of water cannot be refrozen in most cases, as there is just too much of it. As a result the water that enters a moulin eventually exits the glacier usually at the glacier base. I have observed hundreds of moulins and routinely measure their depth each summer and the ability of water communicated into them to be transmitted through the glacier using dye. Our measurements on the alpine glaciers of Alaska and Washington document typical depths of the first near vertical drop of 5-30 m. Many if not most moulins form by taking advantage of a crevasse or former crevasse via hydrofracturing. Crevasse depths are not often much greater than 30 m which is likely related to the the initial vertical drop of most moulins. At that point the moulin will access an internal drainage system. We find that the velocity of surface streams on a glacier within a kilometer of the terminus are an order of magnitude faster than the the streams of the englacial-subglacial stream system. Below is video footage from within moulins using a GoPro and of surface streams feeding into moulins in the North Cascades filmed this summer.

Moulins are not points of weakness that lead to collapse of adjacent ice. They do not develop sinkholes. They are more like a pinprick in diameter compared to the thickness of a glacier. For the Greenland Ice Sheet Das et al (2008) identified moulins delivering water to the base where the ice was 1000 m thick, the moulins less than 10 m in diameter. Joughin et al (2013) note that moulins are tied into extensive stream networks and are sparsely distributed in the lake-dominated region of the Greenland Ice Sheet. They are both small in size compared to the glacier and typically far apart, not like swiss cheese. Smith et al (2015) note this same fact mapping 532 streams all ending in moulins in an area of 6812 square kilometers. Clason et al (2015) examined the hydrology of the Leverett Glacier of western Greenland and found in their modelling a density of moulins below 1000 m is 1-3 per square kilometer and above 1000 m is less than 0.2 per square kilometer. Again the moulins are the key to delivering most meltwater to the glacier base, but are small and widely spaced compared to glacier area. McGrath et al (2011) examined a watershed on Sermeq Avannarleq, West Greeenland that had a single large mouline that was key to drainage. They found numerous englacial fractures 40-70 m below the surface in the moulin system. They further note the widespread existence of refrozen englacial voids and fractures from an old moulin. This suggests the lack of overall structural weakness imparted by moulins.

Moulins are quite important to the hydrologic system of a glacier in the ablation zone as they are such an efficient means of directing surface meltwater to the glacier base. This meltwater can accelerate the flow of a glacier, by increasing basal water pressure. If the hydrologic system is insufficient to easily transfer the water towards the glacier terminus, this leads to a high water pressure, and the water acts like a lubricating fluid. However, if the hydrologic system is sufficiently developed in part by the moulins, then the meltwater simply flows through sufficient tunnels at the base of the ice, with limited basal water pressure and do not lead to acceleration. This potential to both raise and limit ice velocity is why moulins are such an important area of research.

Balfour Glacier, New Zealand Retreat 1990-2015

Balfour Glacier drains west from Mount Tasman in the Southern Alps of New Zealand.  The ablation is a low slope, 8 km long debris covered tongue extending from the terminus near 800 m to 1600 m.  The glacier is fed by avalanching off of Mount Tasman to the west, the southern flank of the Fox Range to the north and the northern flank of the Balfour Range to the south.  Gjermundsen et al (2011) examined the change in glacier area in the central Southern Alps and found a 17% reduction in area mainly from reductions of large valley glaciers such as Balfour Glacier. The volume loss of New Zealand glaciers is reported as 36% from 1978 to 2015, from 54 cubic km to 34 cubic km.

balfour map

Topographic map of Balfour Glacier area of New Zealand from http://www.topomap.co.nz/ . Blue arrows indicate flow, red arrows at 1990 terminus and yellow arrow at 2015 terminus

In 1990 the glacier ended at 700 m with a snowline at 1600 m. The lower 18 km of the Balfour Glacier is debris covered. Only the upper 8 km has snowcover.  In 2015 the terminus has retrated 1250 m, the snowline is at 1800 m, with the lower 20 km debris covered. The terminus reach has continued to appear stagnant from 1990 to 2015.  Balfour Glacier has not developed a significant proglacial lake at its terminus, which has limited the retreat compared to Tasman Glacier or Mueller Glacier. Google Earth indicates the retreat of stagnant debris. The main glacier meltwater outlfow issues from the glacier at the yellow arrow in 2012, 600 m above the terminus.

balfour compare

Landsat Analysis of 1990 above and 2015 Below of Balfour Glacier.  Red arrow is at 1990 terminus and yellow arrow at 2015 terminus.  The purple arrows indicate area of thinning upglacier. 

balfour 2006

2006 Google Earth image of Balfour Glacier above and 2012 image below.  The red arrow is at the terminus location in 2006, the yellow arrow is at the 2012 location where the glacier stream issues from beneath the glacier. The purple arrows

balfour 2012

Glacier Retreat expands Gelhaipuco Lake

gelhaipuco compare

Fig. H. Gelhaipuco Glacier (G) and Qangzonkco Glacier (Q) change from 1991 to 2015, red arrow indicates 1991 terminus, yellow arrow 2015 terminus and purple arrow indicates areas of thinning.

Gelhaipuco is a glacier moraine dammed lake at the headwaters of the Natangqu River in the Pumqu Basin, Tibet, China. In 1964 the lake had an outburst flood that resulted in severe damage and economic losses in the Chinese Tibet and downstream in the Arun valley in Nepal. The flood occurred after a heavy rainstorm with the rising lake overtopping and eroding the moraine dam significantly.  Today the water level is lower than the 1964 pre-flood water level. The glacier that ends in it is unnamed, but is referred to here as Gelhaipuco Glacier. Che et al (2014) reports that glaciers in the basin lost 19% of total area since the 1970’s and that the retreat rate increased in the 2001-2013 period.  The number of glacier lakes has increased from 199 to 254 since the 1970’s.  Of these 19 are deemed dangerous including Gelhaipuco (Che et al, 2014) . The lake has an estimated volume of ~25 million cubic meters and is a risk for a glacier outburst flood.The Arun River has a proposed 900 MW hydropower plant under development in Nepal.  In 1991 the glacier terminates at the red arrow in the lake, which was 750 m long. By 2015 glacier retreat had expanded the lake to 1500 m. The glacier retreat of 800 m is occurring in a lake that is maintaining consistent width.  The retreat is fueled by high snowlines such as in 2015, the snowline was at 5800 m, with no retained snowpack across the glacier divide to a separate terminus that flows east.  The terminus reach of the glacier has crevassing within 250 m calving front, indicating the role of iceberg calving.  The glacier lacks crevasses above this point for a kilometer, indicating the limited velocity to support the current level of melting and calving.  retreat will continue and the lake volume will continue to increase in the next decade.  The upvalley lake limit will likely be reached within the next kilometer of retreat.

gelhaipuco dam

Gelhaipuco lake and its unconsolidated moraine dammed lake.  Note the elevation listed near the former shoreline and the current outlet stream.

gelhaipuco 2015

Snowline on Gelhaipuco Glacier in 2015 at purple dots-5800 m.  Note there is no retained accumulation across the glacier divide from the east to west terminus.