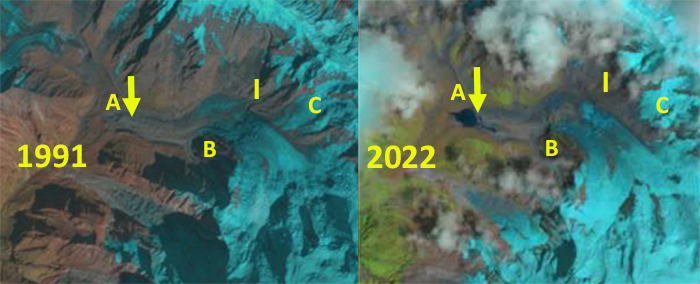
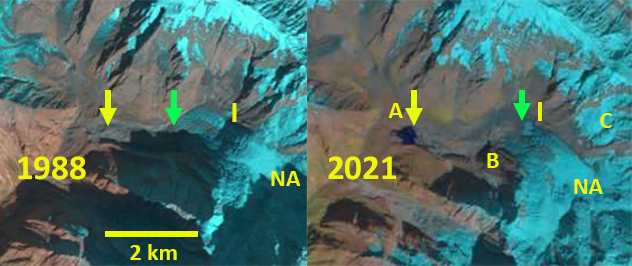
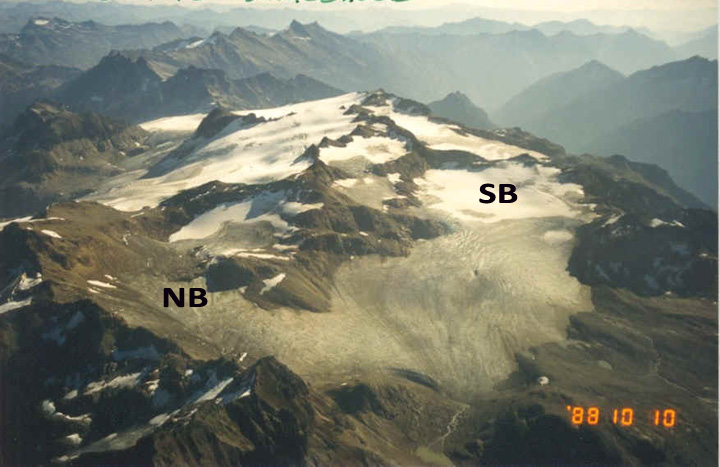
The glaciers of Tenderfoot Mountain in 1987 and 2022 Landsat images illustrating the decline in area and fragmentation. Tenderfoot Glacier B-C has lost more than 70% of its area and fragmented. Glacier D and E have experienced recession along their broad lower margins. Glacier F has disappeared
Tenderfoot Mountain has an array of glaciers on its flanks that have been rapidly losing area and fragmenting. One of these is Tenderfoot Glacier (B-C) that feeds into the Lardeau River in the Kootenay Lake Watershed. The glacier filled a north facing basin with an area of km² in the 1980’s topographic map of the area. This is a region where glaciers are struggling. Bevington and Menounos (2021) inventory of glaciers in Western Canada identified an increase rate of loss in this Southern Interior Range from 6.6 km²/year during the 1984-2010 interval to 22.1 km² per year from 2011-2020. They identified for the region that 14,329 glaciers larger than 0.05 km2 existed in 1985, of these 13,270 glaciers larger than this threshold remained by 2020, this represents an 8% decline in the number of glaciers. They also identified an +300% increase in fragmentation of glaciers. Here we examine a sequence of Landsat images from 1987-2022 to illustrate the changes in the Tenderfoot Mountain region that and suppliment with a Sentinel 2022 false color satellite image.
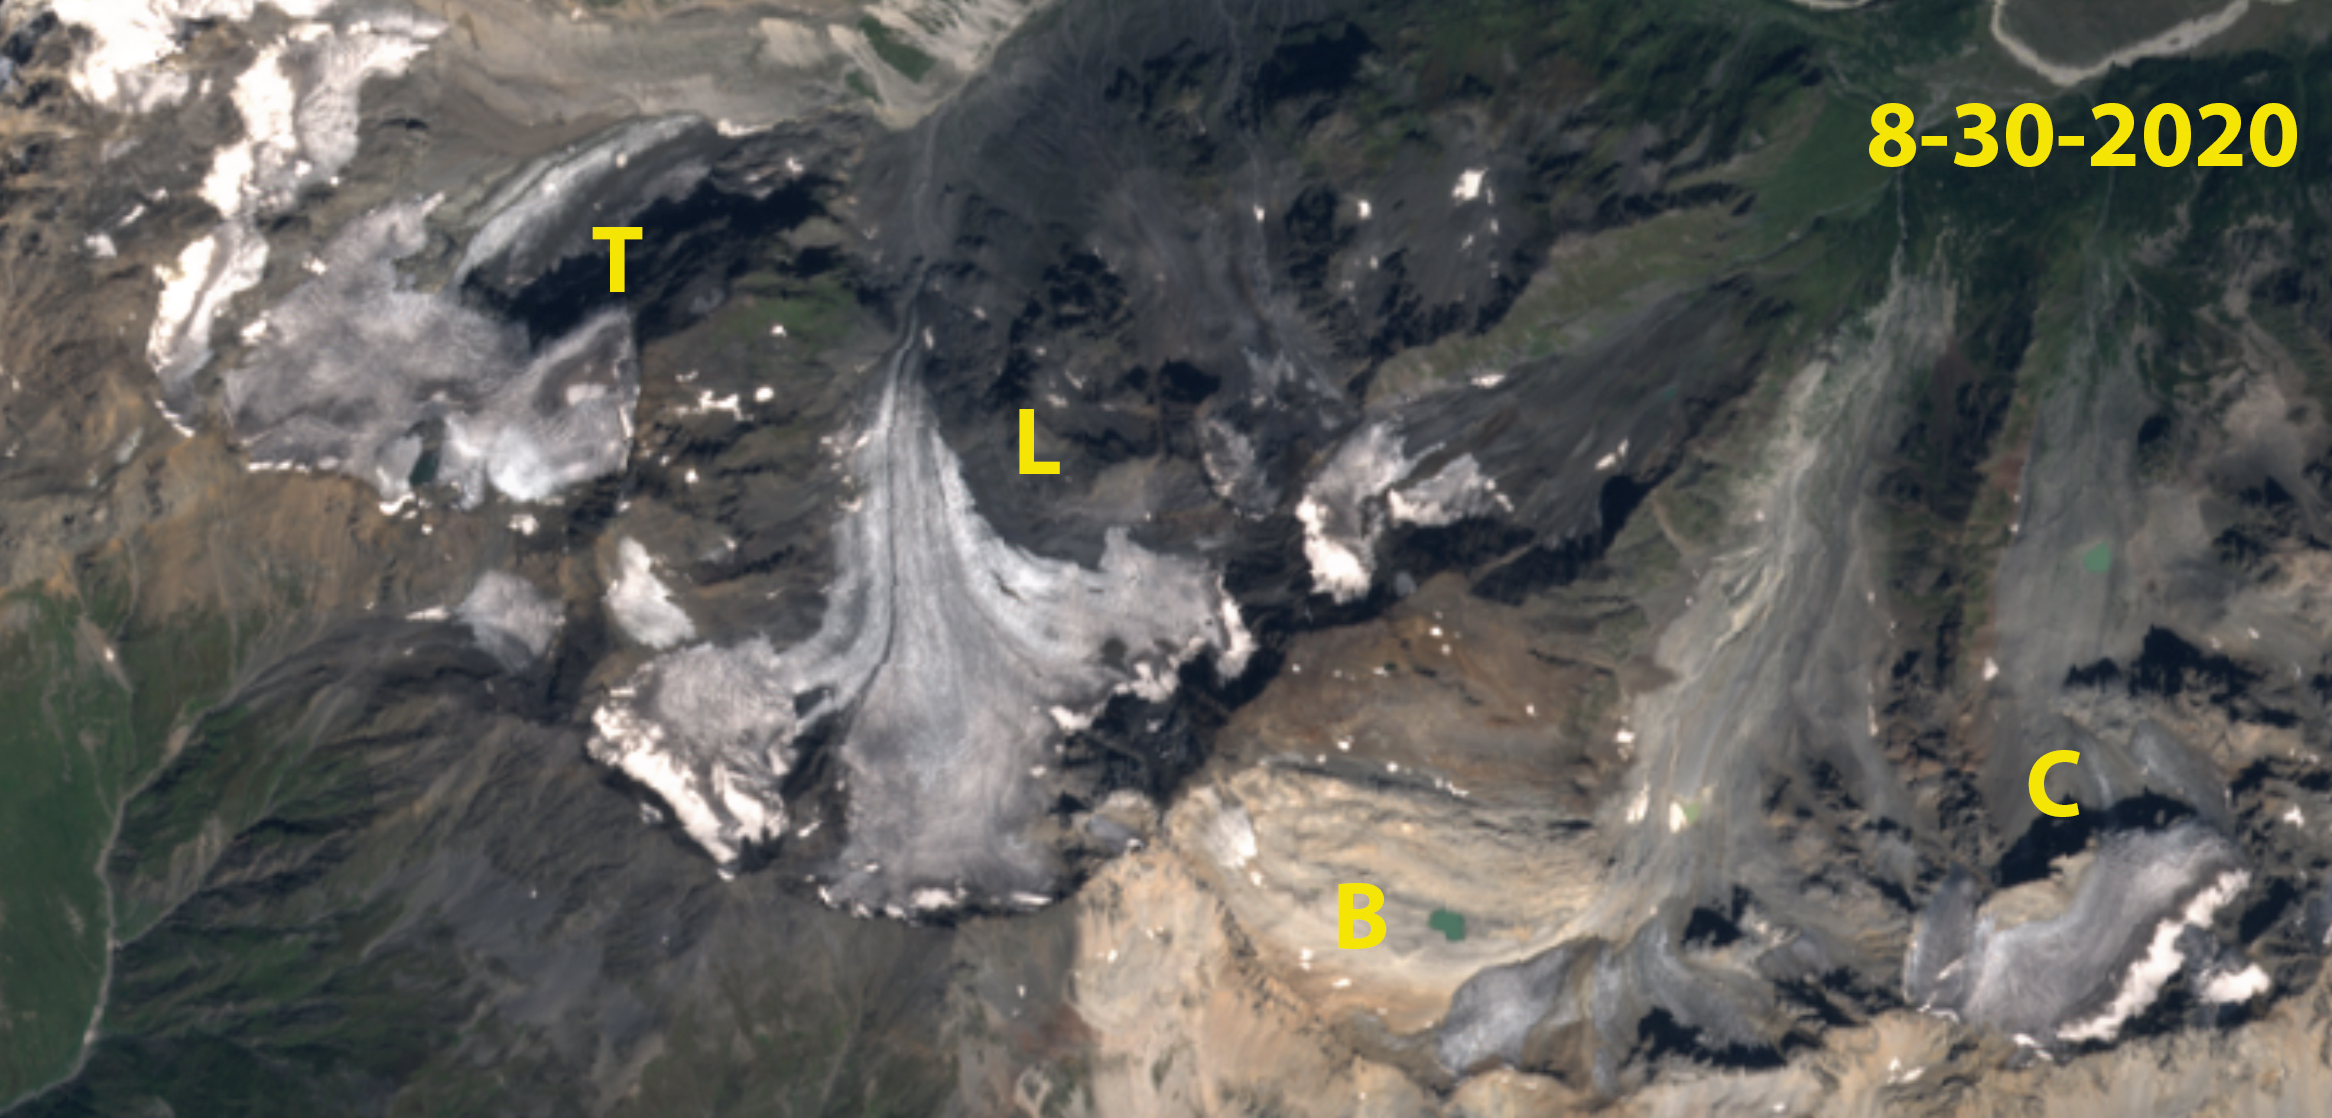
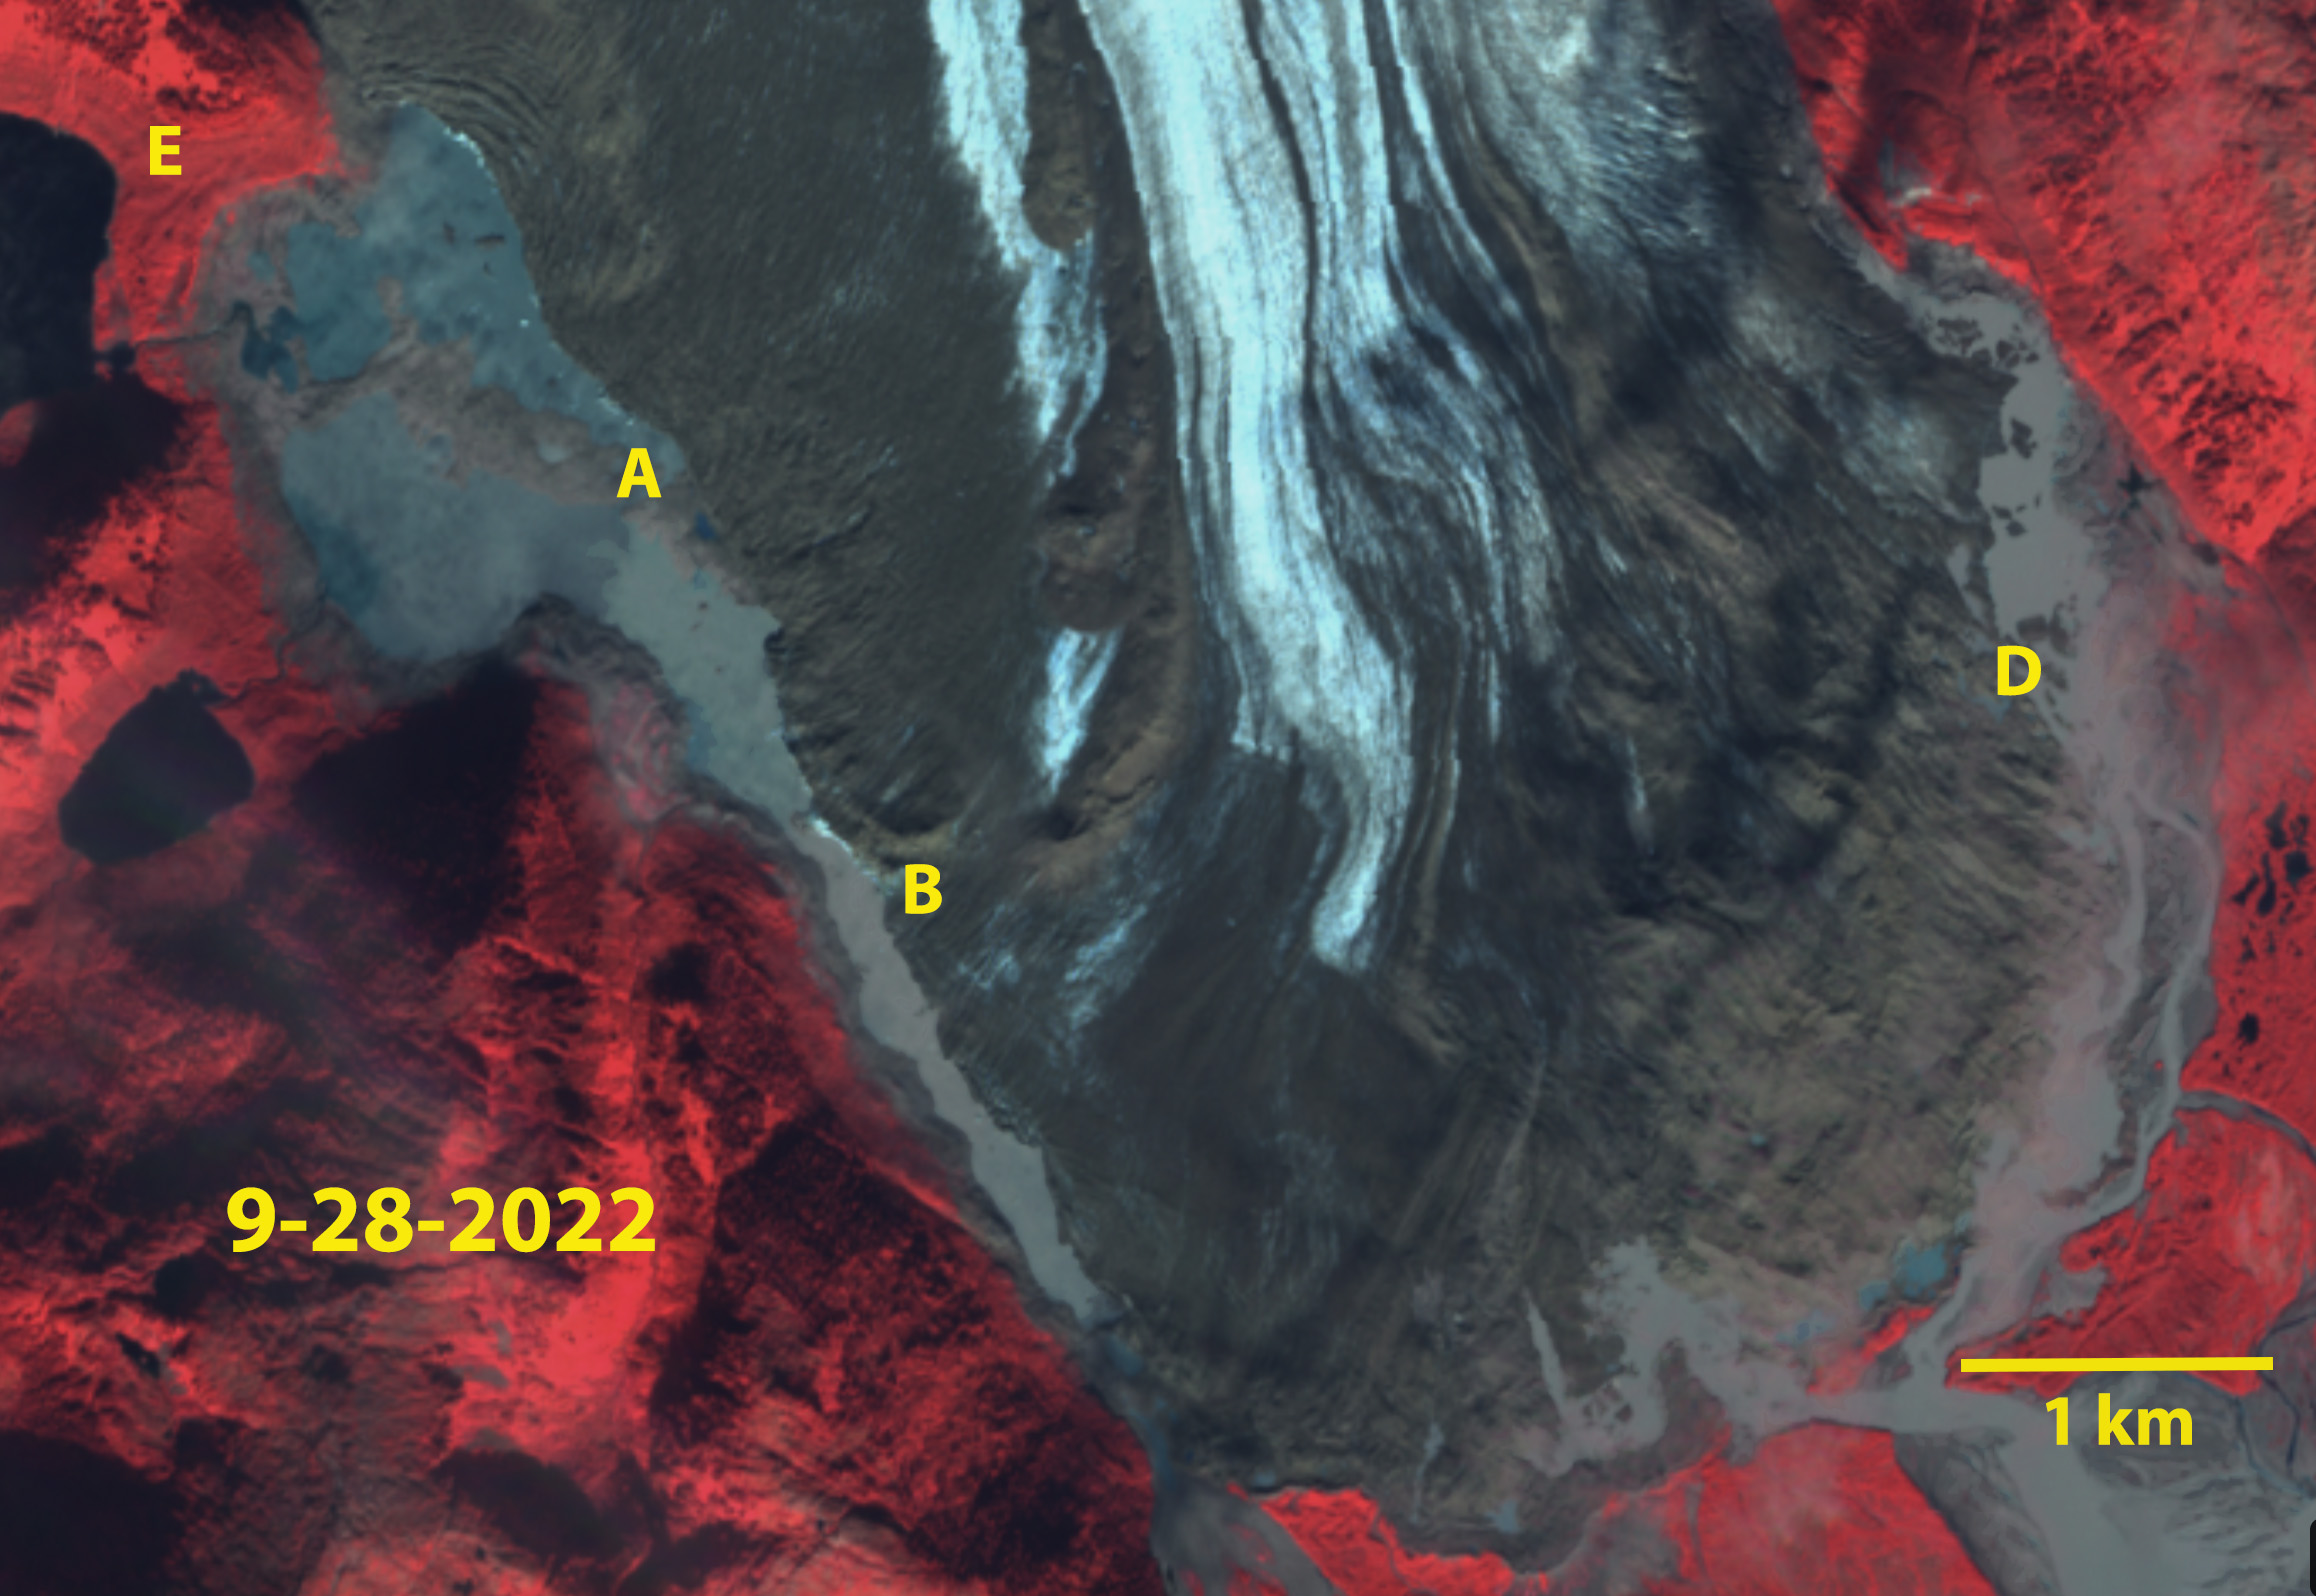
In the National Topographic map the area of Tenderfoot Glacier had an area of 1.8 km² with the eastern tributary C feeding the main glacier (B). By 1987 the eastern Tributary (C) is nearly disconnected from Point B. There is a small cirque glacier at Point F. The glacier at Poit A is 0.6 km². In 1987 the combined area of the slope glaciers (D and E) is 5.0 km². In 1998 the Tenderfoot Glacier has not retained any snowcover illustrating why this glacier is more prone to both fragmentation and disappearing. By 2015 Point A glacier is beginning to fragment as well. By 2022 the Tenderfoot Glacier has three fragments with a combined area of 0.5 km², a 70% loss in area since 1987. The glacier at Point A has declined to 0.3 km². The glacier at Point F is gone. The combined area of Glacier D and E had declined to 3.4 km² a 30% decline. Tenderfoot Glacier did not retain any snowcover in 2021 or 2022, illustrating that it cannot survive even present climate. The Lardeau River is known Kokanee salmon . The Kokanee salmon population collapsed in Kootenay Lake after 2014 from 1 million to ~12,000 in 2017, rebounding somewhat to 90,000 in 2020 before declining again to 24,000 in fall 2021 (Nelson Daily, 2021).
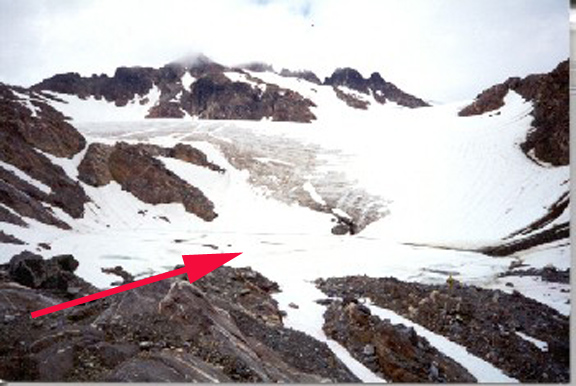
Kokanee Glacier is another example of a struggling glacier in the region that Ben Pelto has monitored since 2014, too often with little snowcover by the end of summer, see below.
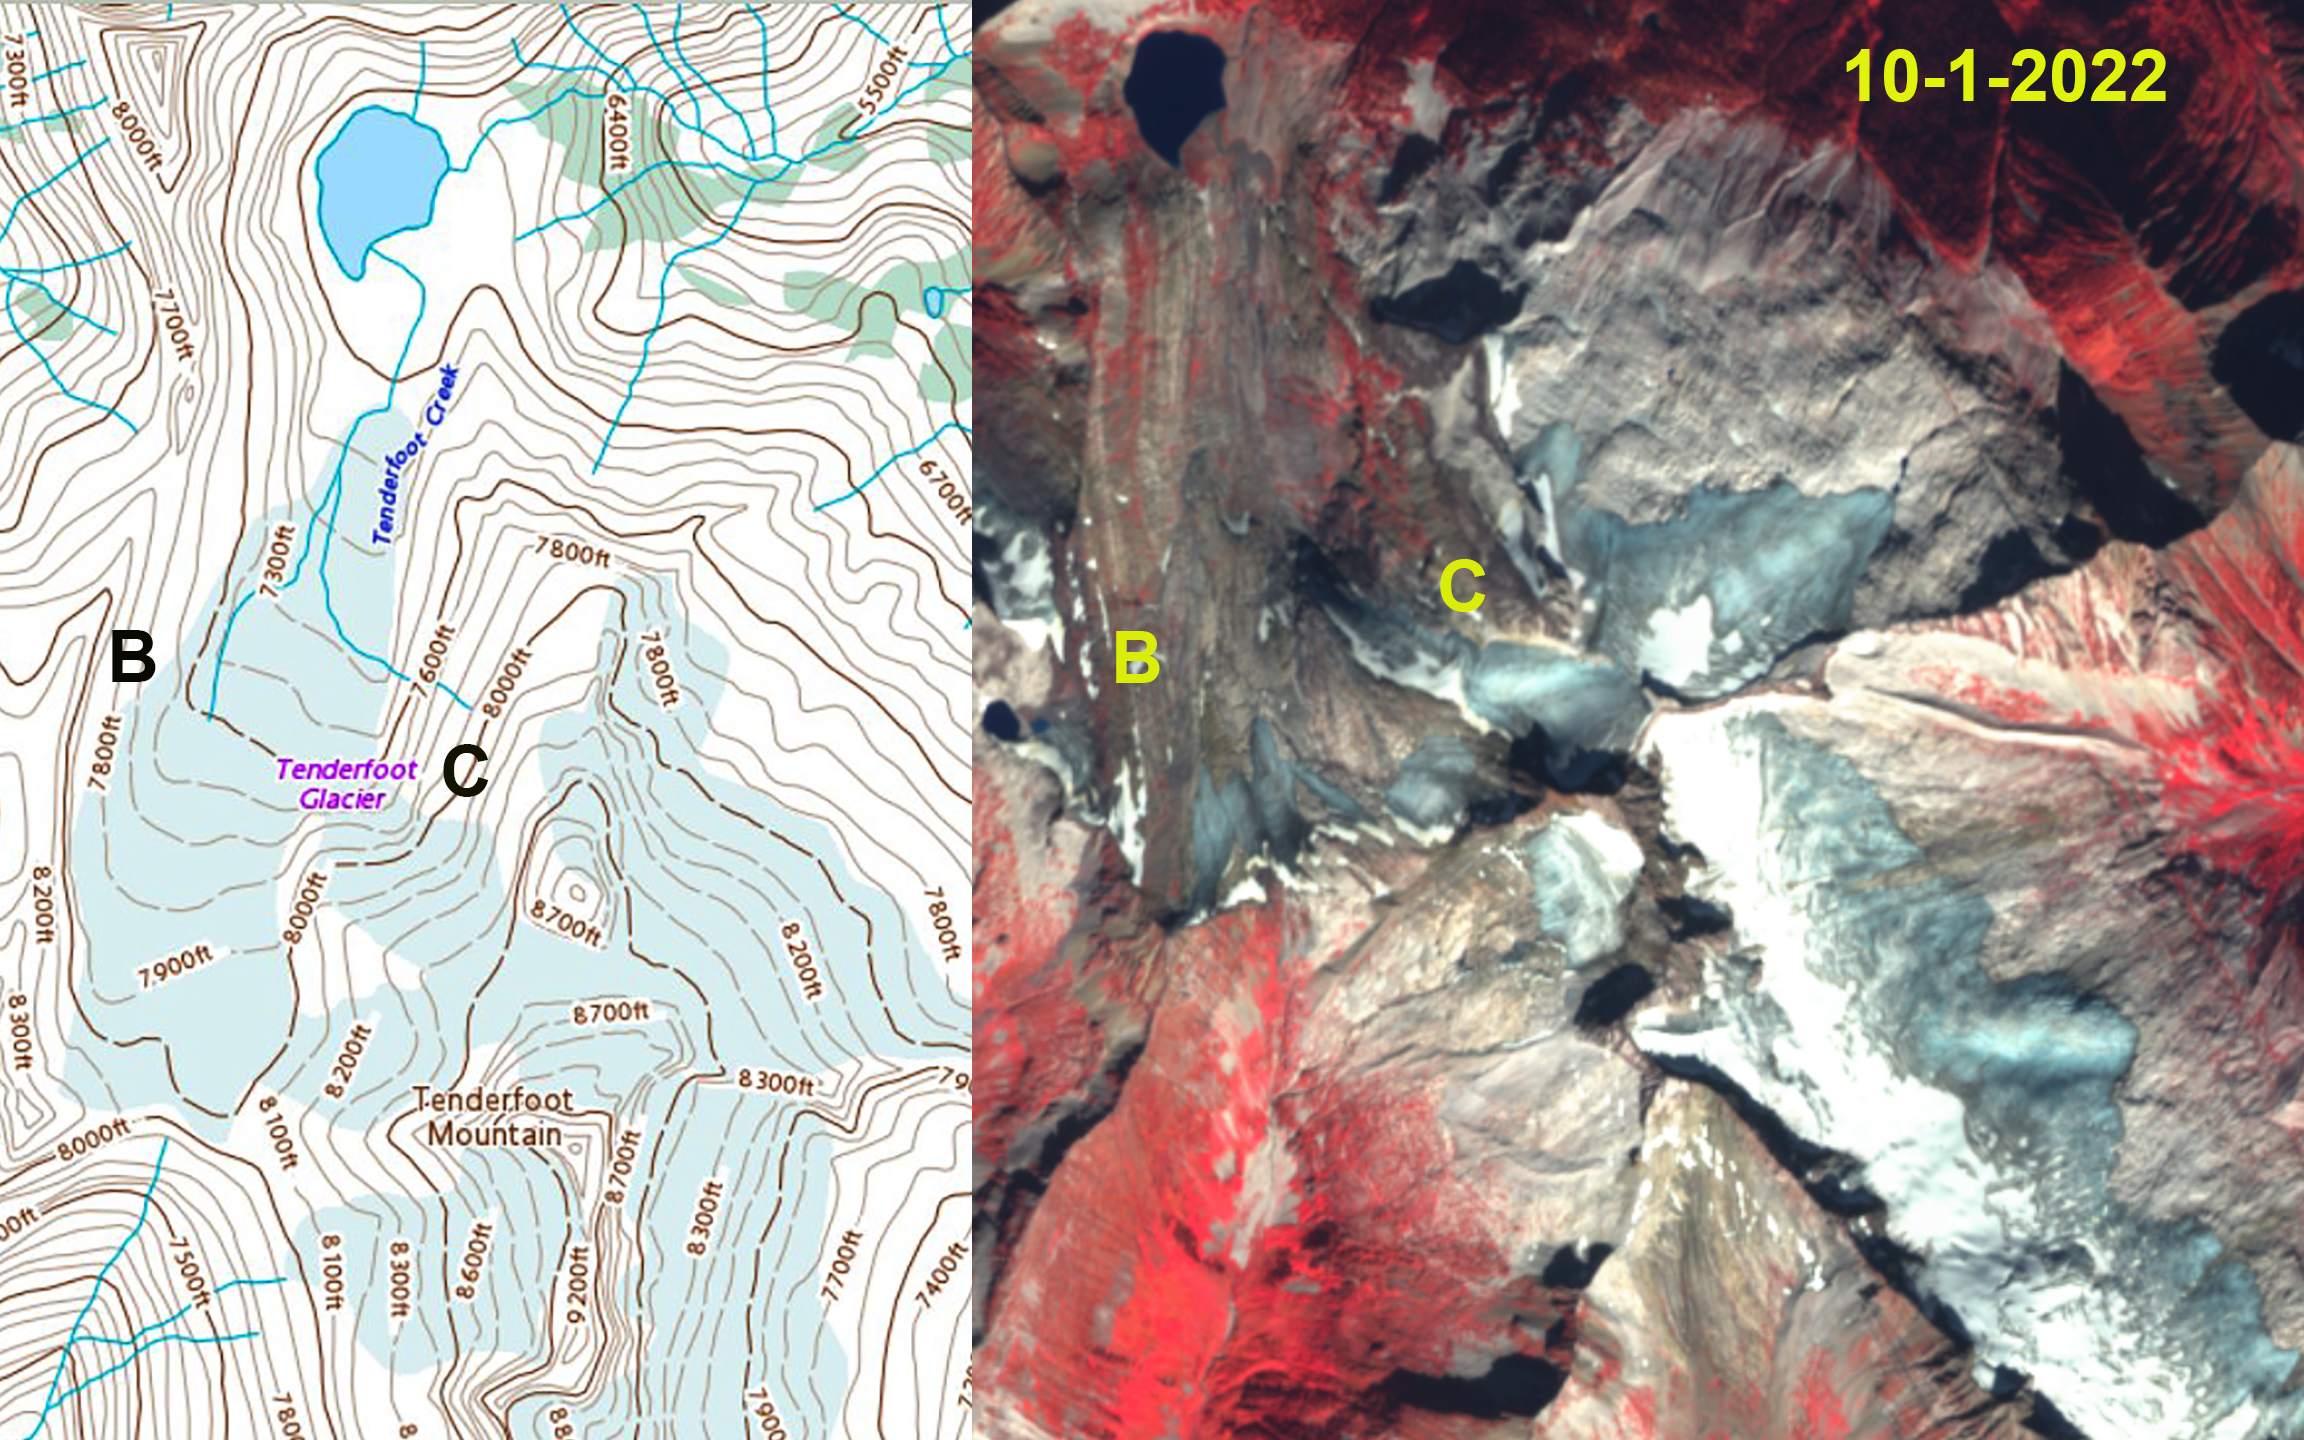
Tenderfoot Glacier in Canadian Topographic map and October 1, 2022 false color Sentinel image. Point B and C indicate two segments of the Tenderfoot Glacier that have now fragmented.
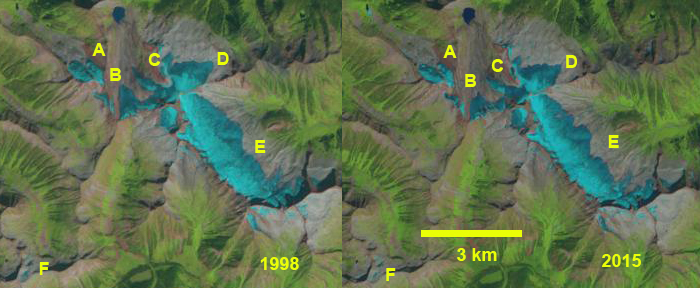
The glaciers of Tenderfoot Mountain in 1987 and 2022 Landsat images illustrating the decline in area and fragmentation. Tenderfoot Glacier B-C has lost more than 70% of its area and fragmented. Glacier D and E have experienced recession along their broad lower margins. Glacier F has disappeared.

Kokanee Glacier in 2021 stripped bare of snowcover, with a relatively dirty surface (Ben Pelto-image).