
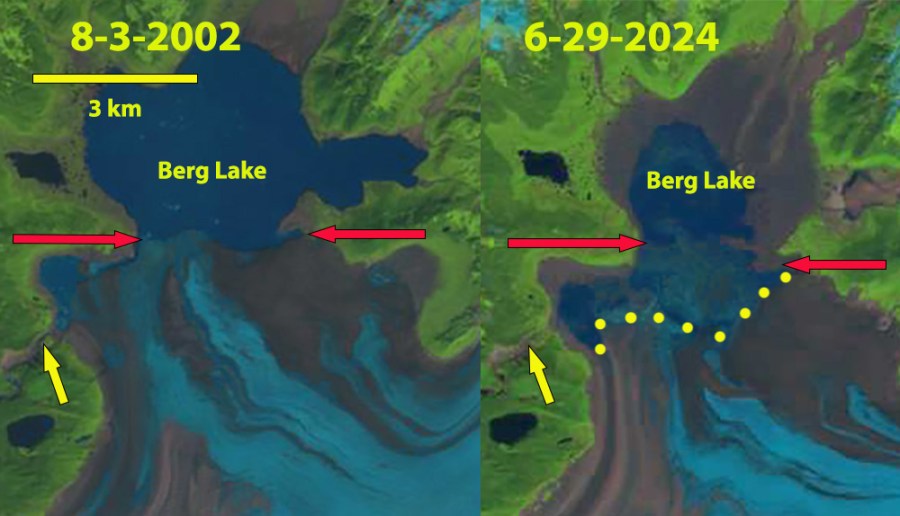
Burroughs Glacier in 1986 and 2022 Landsat images. The red arrow marks the west margin and the yellow arrow the east margin in 1986. Yellow dots mark the outline of the glacier in 2022. Glacier area declined from 12.5 km² to 1.5 km² during this 36 year period.
Burroughs Glacier in Glacier Bay National Park, Alaska has been retreating without pause since 1892 when it was part of the Muir Glacier complex. The glacier is unusual in that it has not had an accumulation zone over the last century, where snow persists through the year. Without an accumulation zone a glacier cannot survive (Pelto, 2010). Mickelson (1971) summarized the retreat of the glacier from 1892-1960. In 1892 the Burroughs ice plateau was assessed as a 10 km by 25 km ice cap. By 1960 it had thinned by as much as 750 m and its calving margin had retreated 27 km.. By the 1970’s the glacier was essentially stagnant (Molnia, 2008). In 1982 I briefly visited the western terminus, which provided a still imposing slope, made more so by the rain and clouds lowering onto its surface.
Here we examine the glacier in Landsat imagery from 1986 to 2022 to illustrate the retreat, the lack of snowcover and the thinning. In the 1948 map of Burroughs Glacier, the glacier is 12.1 km long, and much of the glacier is already stagnant, the glacier has both a north and south terminus, purple arrows. To the west of Burroughs Glacier is Plateau Glacier (P).
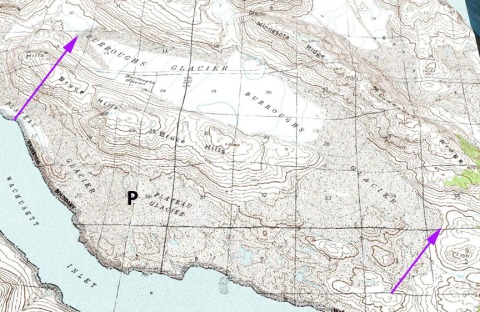
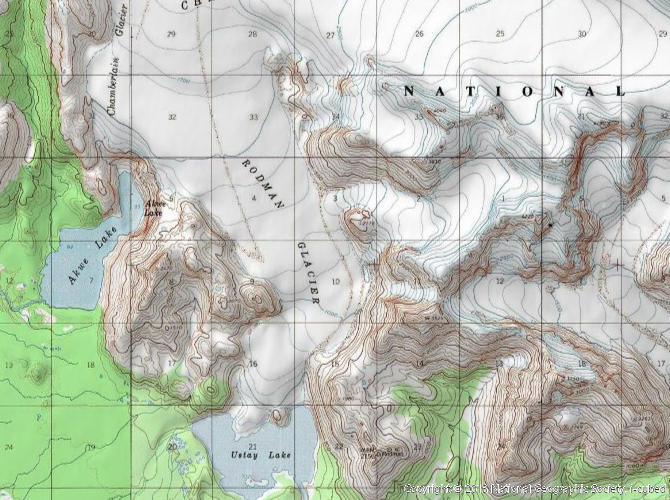
Burroughs Glacier in 1948 USGS map.
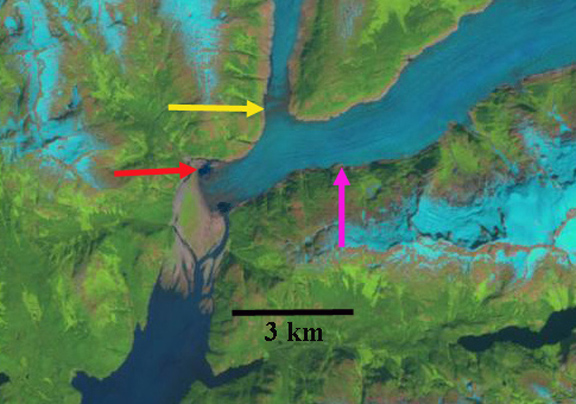
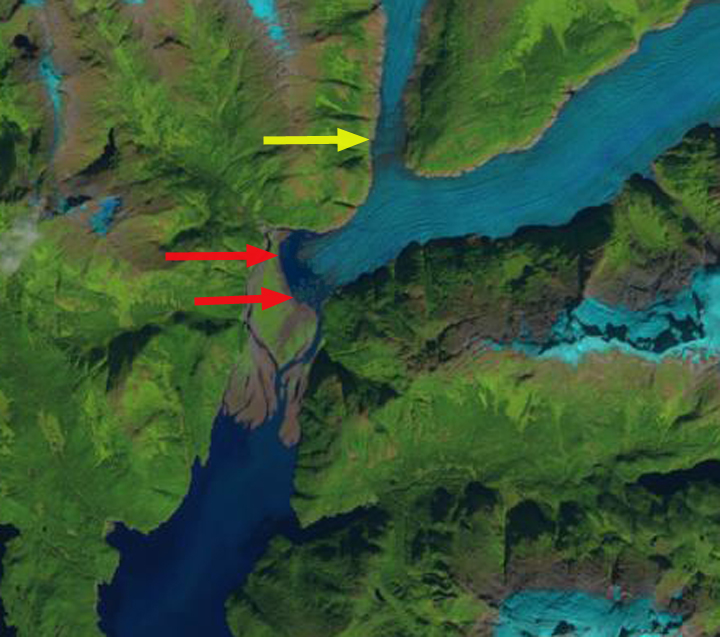
In 1948 Burroughs Glacier has an area of 22 km² and is 12.5 km long, with the crest of the glacier at ~1500 feet. In 1986 Burroughs Glacier has an area of 12.5 km² and has no snowcover by mid-summer. The glacier terminates in proglacial lakes at both the north and south terminus red and yellow arrow respectively, and is 9 km long, purple arrows indicate 1948 terminus. By 1986 Plateau Glacier has only three small remnants marked by P, surrounding these vegetation is still limited, with considerable expanse of bare glacial sediments. By 2003 Plateau Glacier is gone and vegetation is filling in most of the area that was still bare sediment in 1986. In 2003 Burroughs Glacier again lacks any snowcover. The southern terminus has retreated 2.2 km from the lake, and the northern terminus has retreated into a second lake basin. The glacier is 6.3 km long, half of its length in 1948. In 2004 snowcover is again lacking anywhere on the glacier. In 2010 snowcover is lacking and retreat has continued shrinking the glacier to 5.4 km in length. The glacier was assessed with an area of 2.8 km² and a median elevation of 313 m (1025 feet) by GLIMS. In 2013 the glacier lacks snowcover in this September Landsat image even though snow has returned to the surrounding mountains. This indicates how far below the snowline the glacier lies. Portions of a glacier are supposed to be the first locations that receive snowcover. The terminus has continued to retreat and the glacier was 4.6 km long in 2013. The northern terminus was retreating into a third basin of the proglacial lake. Vegetation has reclaimed almost all of the Plateau Glacier area and has reclaimed the region deglaciated by Burroughs Glacier before 2003. By 2022 the glacier area has been reduced to 1.5 km², this is just 12% of its area remaining from 1986 and 1% of the 1892 area. The length of the glacier in 2022 is 2.3 km, only 50% of the lenght just a decade ago, and ~20% of the 1948 length.
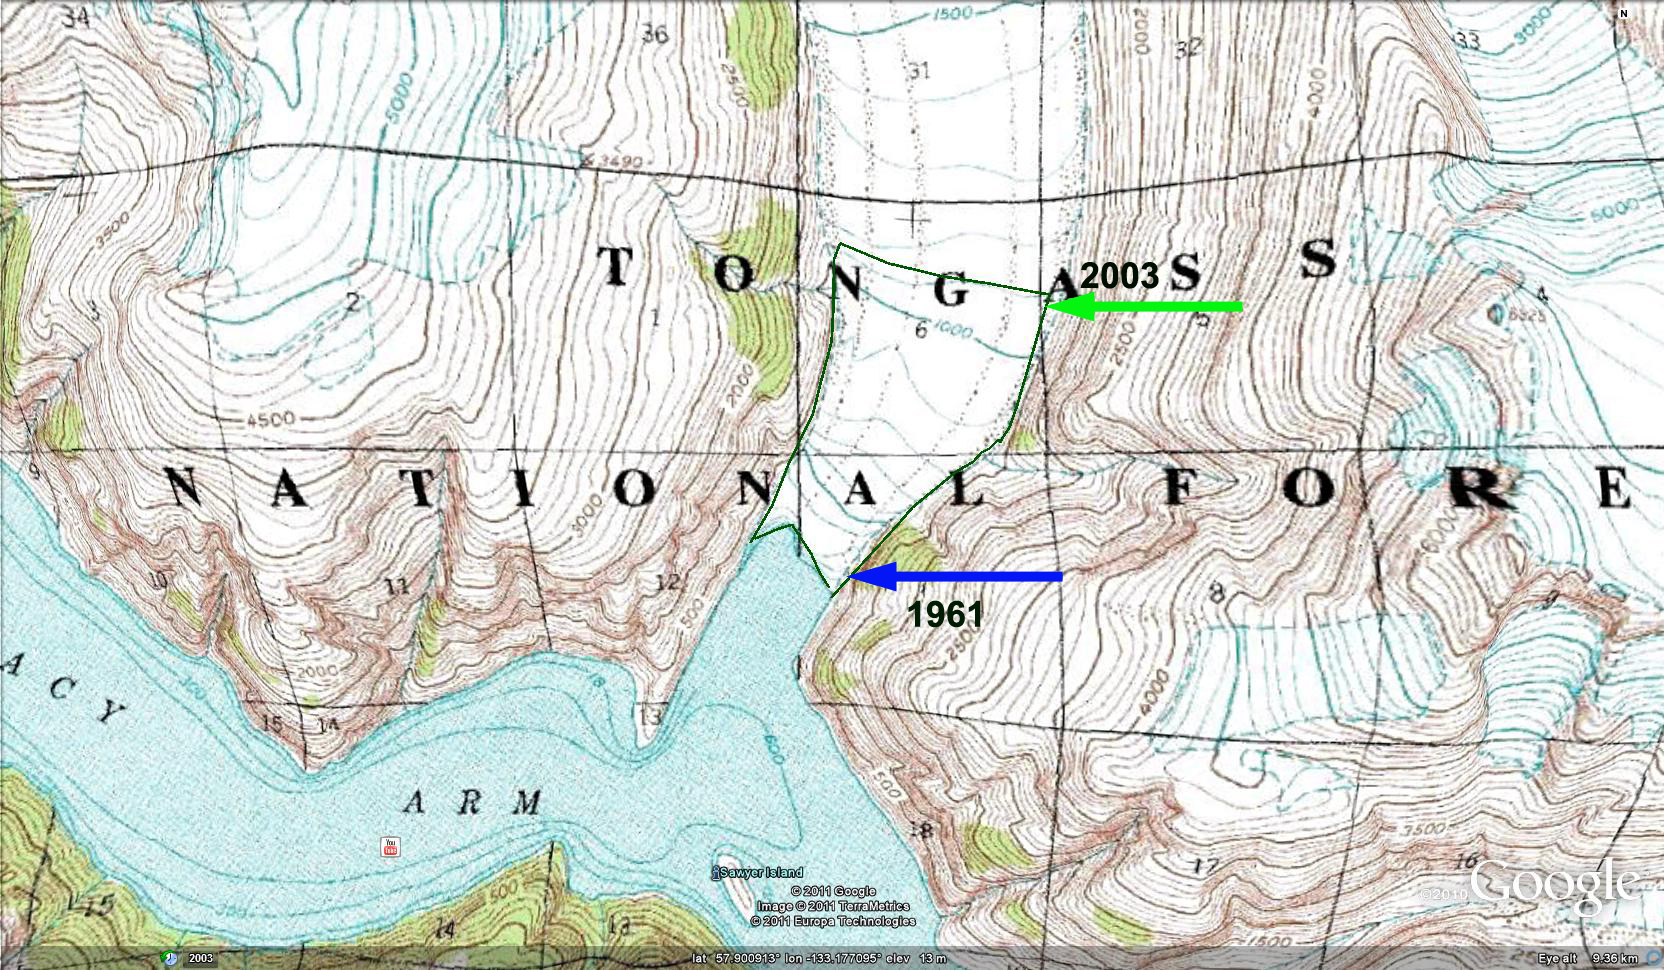
Thinning of this glacier from 1948-2016 is evident from a comparison of topographic maps. Thinning in remaining glacier are averages 225 m during this period, that is a rate of ~3.3 m/year. Larsen et al (2007) had found a thinning rate of ~3 m/year for the 1948-2000 period.

Overlay of 1948 (blue labeled contours) and 2014 elevation map (Brown labeled contours) for Burroughs Glacier.
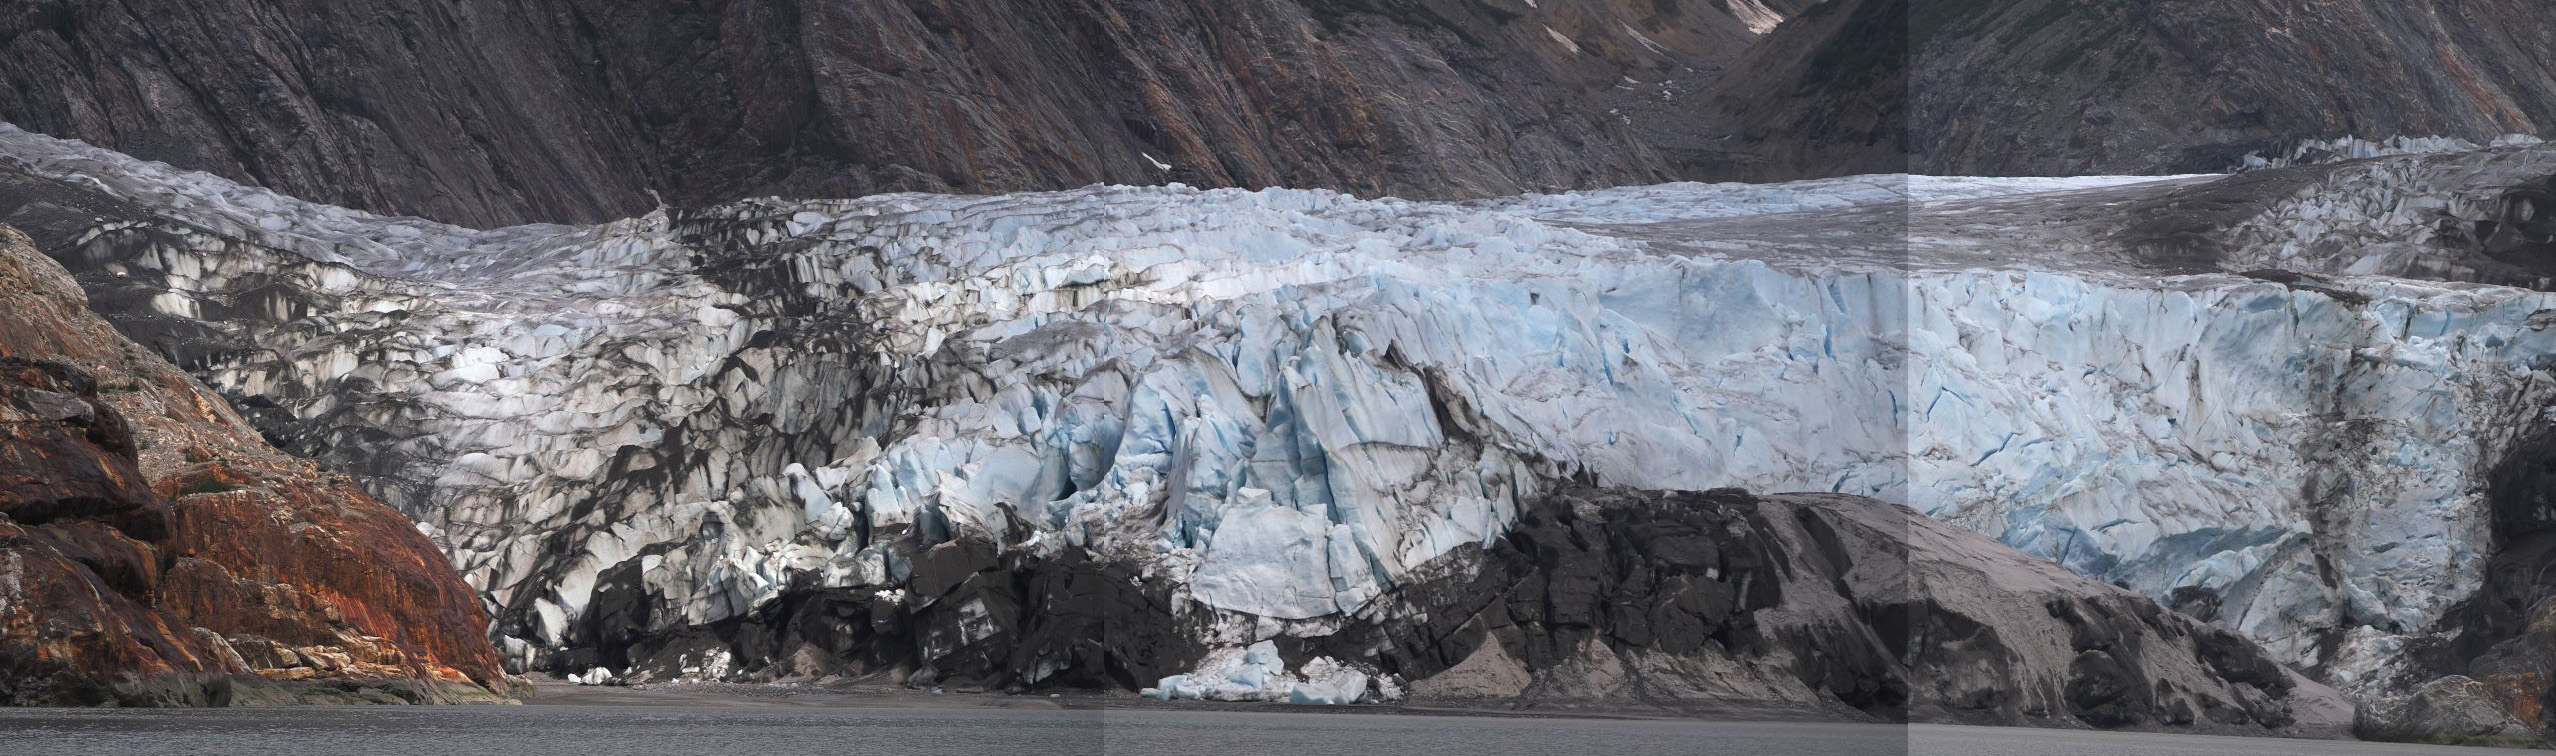
Burroughs Glacier has not been in equilibrium with climate since the end of the Little Ice Age. Its retreat has been hastened by the rising snowline of the last decade note by Pelto et al (2013) on Brady Glacier. This glacier area has declined by 88% since 1986, with volume loss being even larger. Retreat usually increases as elevation declines and as the size of the remnant ice declines. There is no debris cover or persistent snowcover to slow the loss. Thus, it seems likely this glacier will be gone within 25 years. The 2011 Google Earth image at bottom indicates no snow, the reduced albedo from the dirty surface and a few crevasses near the margin that are collapse features. This is unlike nearby glaciers that are retreating significantly but not disappearing, like Brady Glacier, Geikie Glacier, Yakutat Glacier and Riggs Glacier.
r.
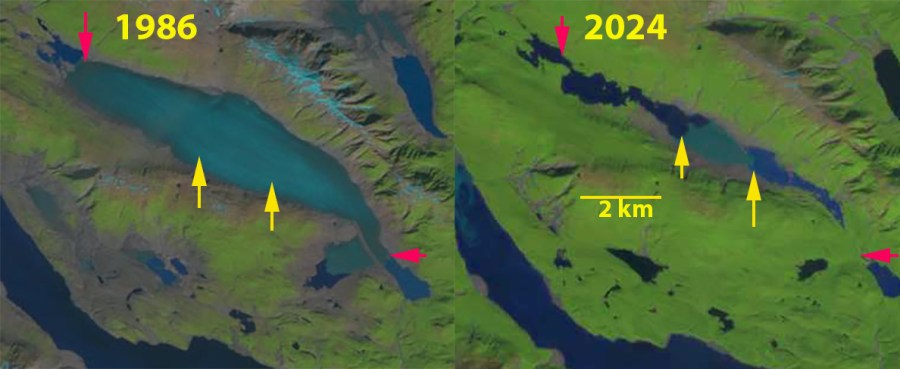
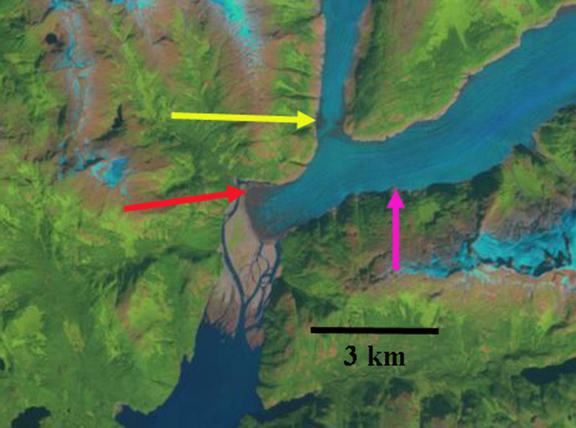
1986 Landsat image of Burroughs Glacier. The purple arrows mark the 1948 margin, red arrow the west margin in 1986 and the yellow arrow the east margin.

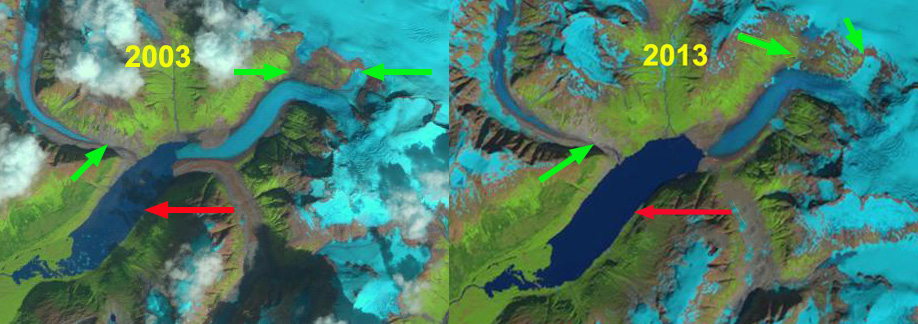
2003 Landsat image of Burroughs Glacier. The red arrow marks the west margin in 1986 and the yellow arrow the east margin.

2004 Landsat image of Burroughs Glacier. The red arrow marks the west margin in 1986 and the yellow arrow the east margin.

2010 Landsat image of Burroughs Glacier. The red arrow marks the west margin in 1986 and the yellow arrow the east margin.

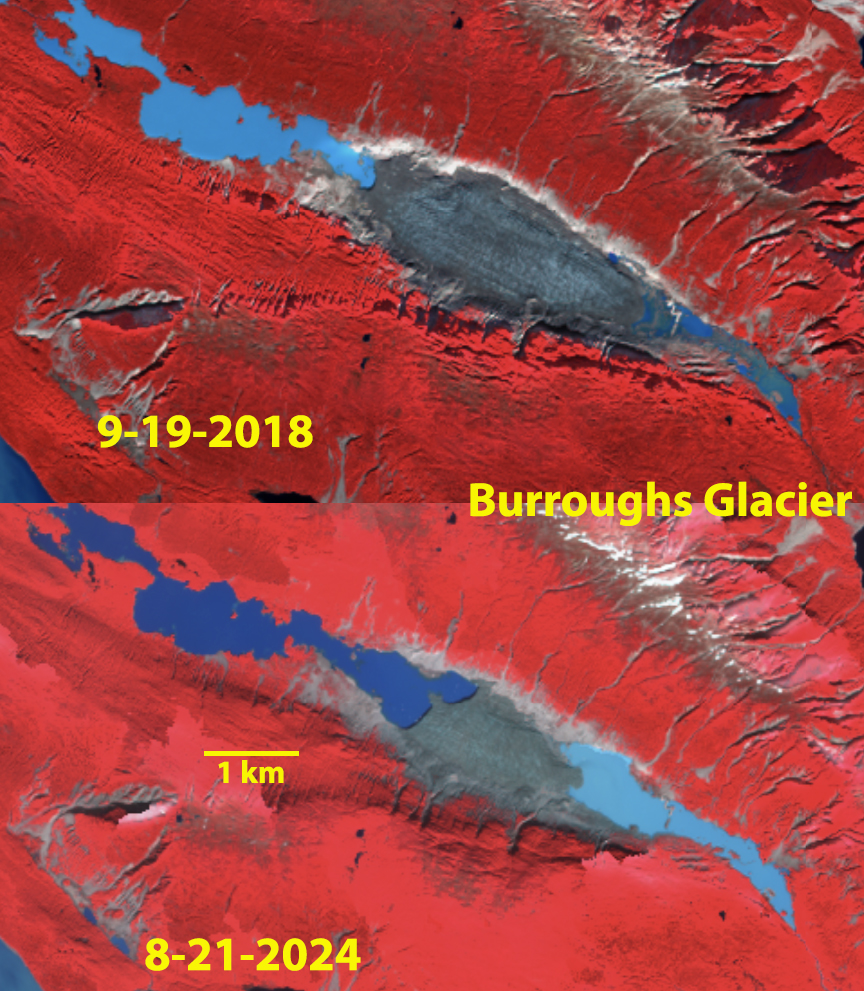
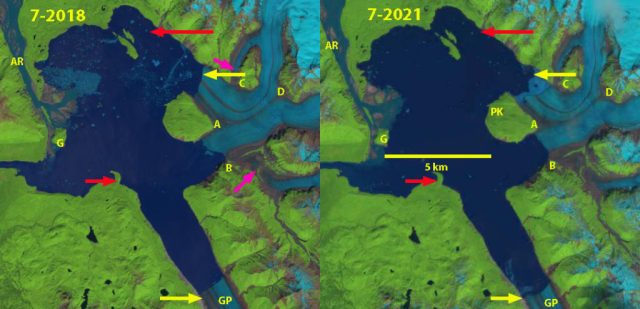
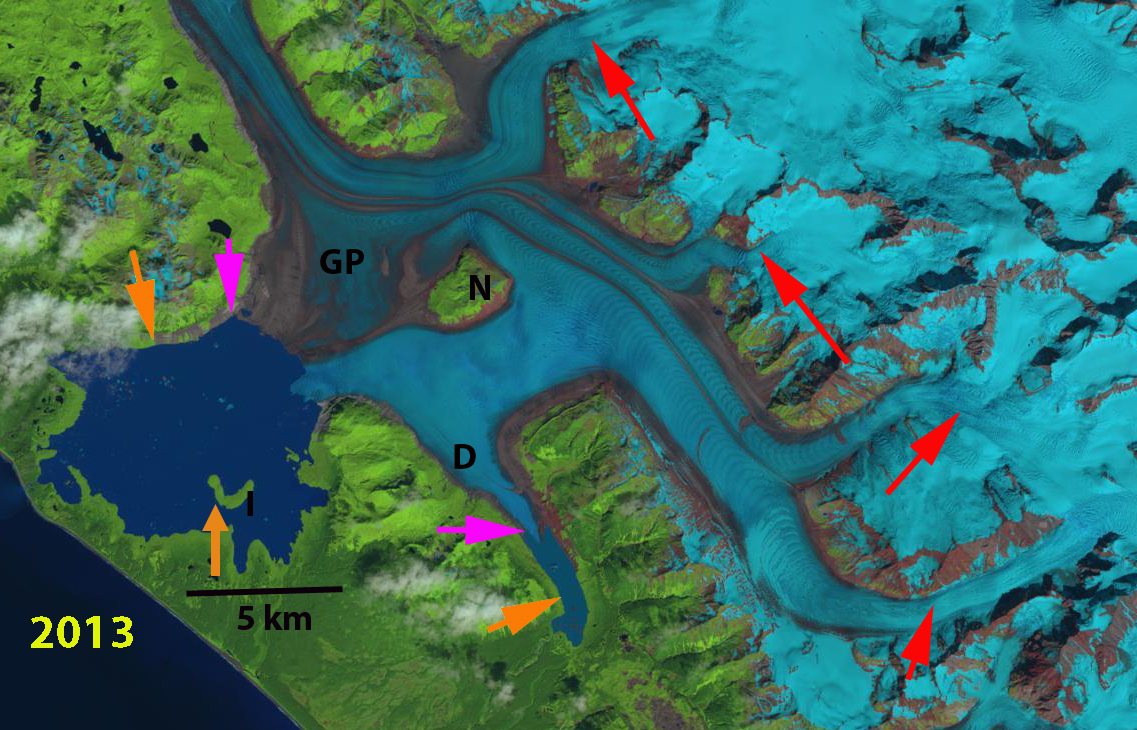
2013 Landsat image of Burroughs Glacier. The purple arrows mark the 1948 margin, red arrow the west margin in 1986 and the yellow arrow the east margin in 1986, pink arrows the 2013 margin.

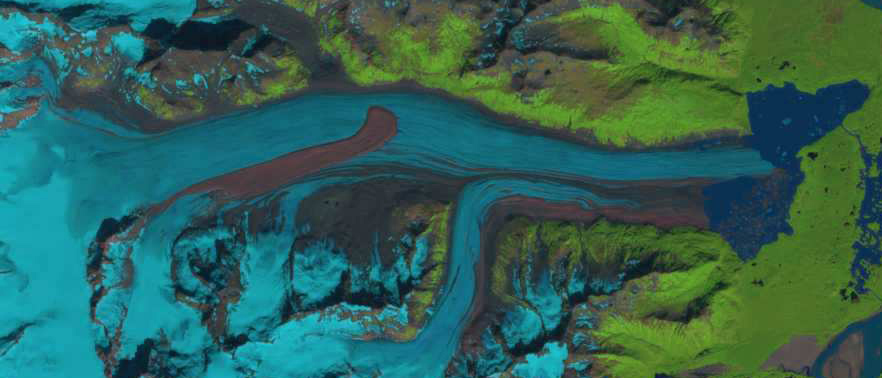
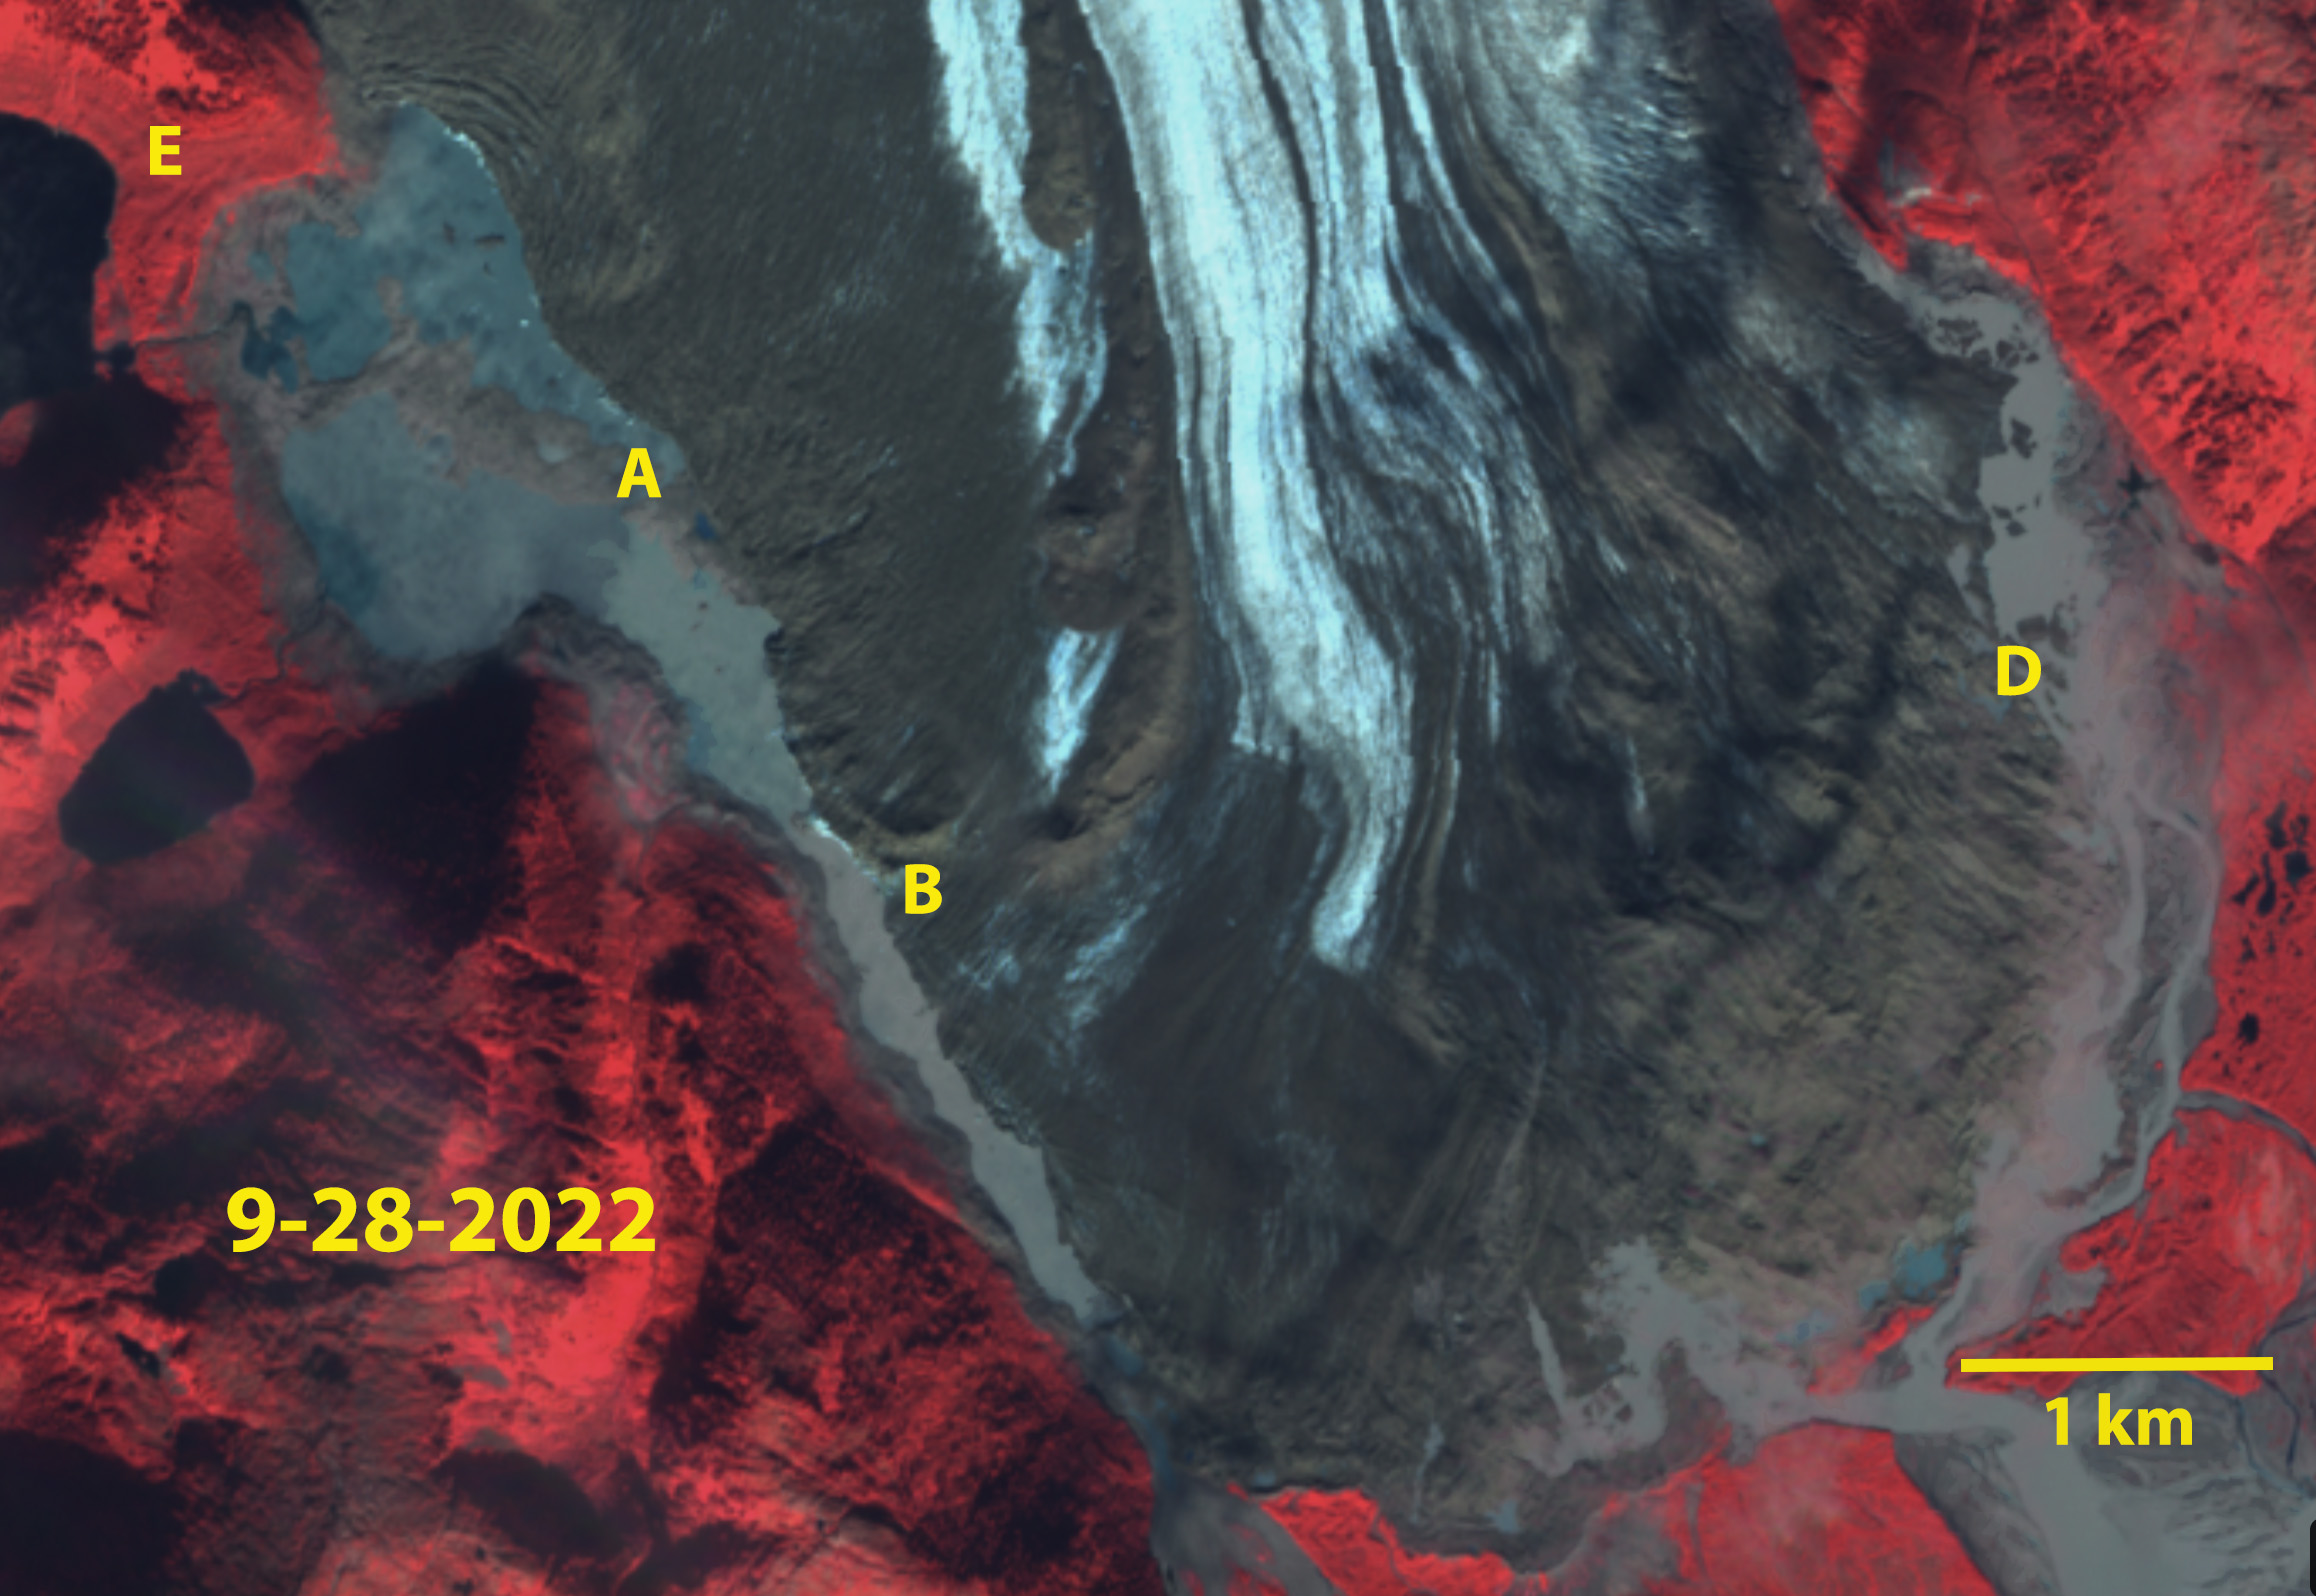
2022 false color Sentinel image of Burroughs Glacier. The ice is dirty but not debris covered at this point.

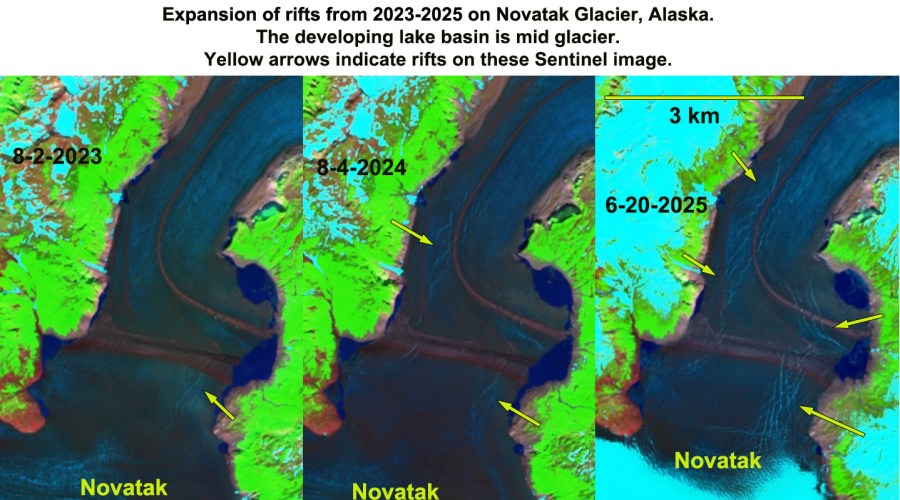

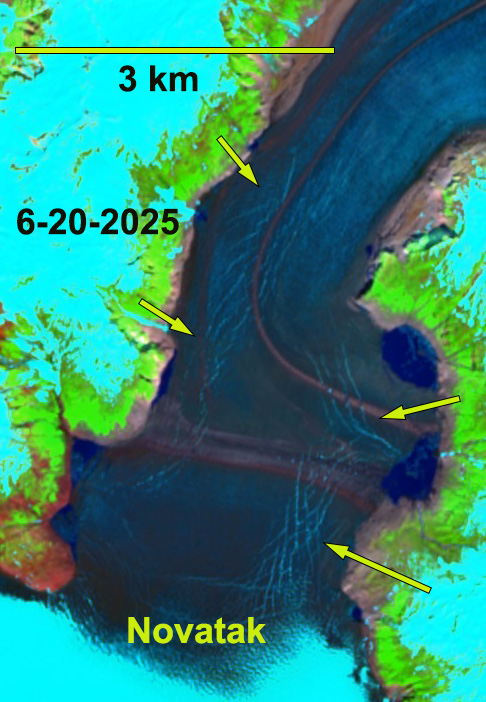


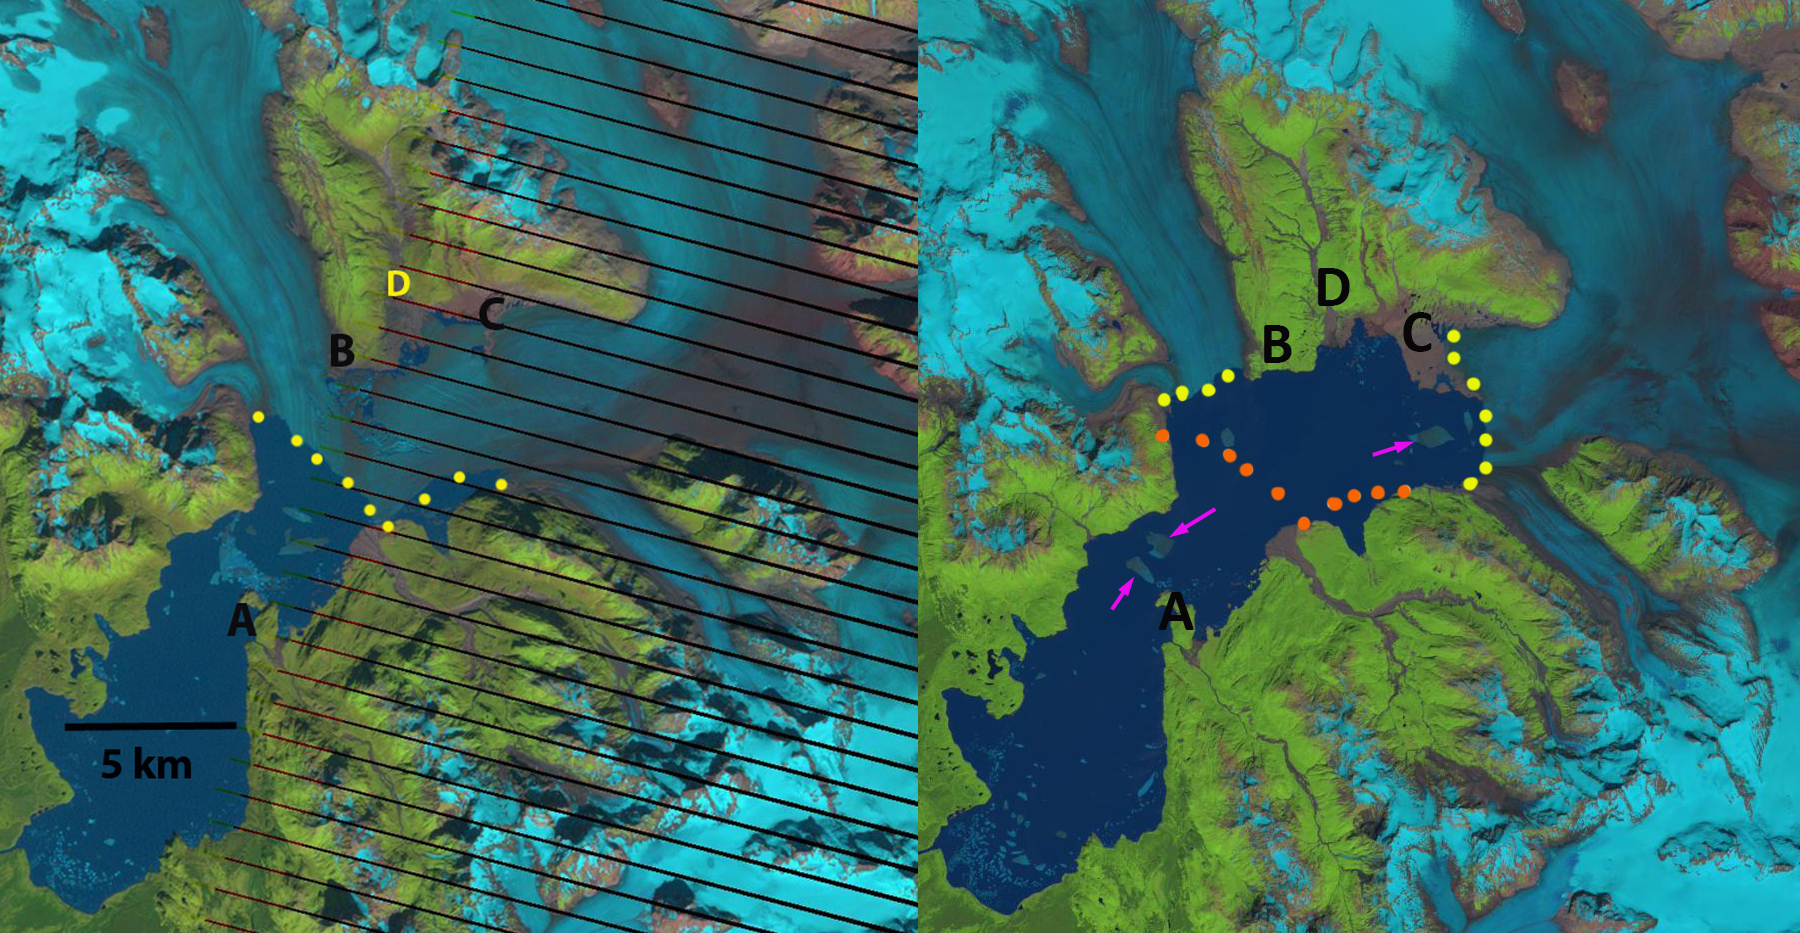

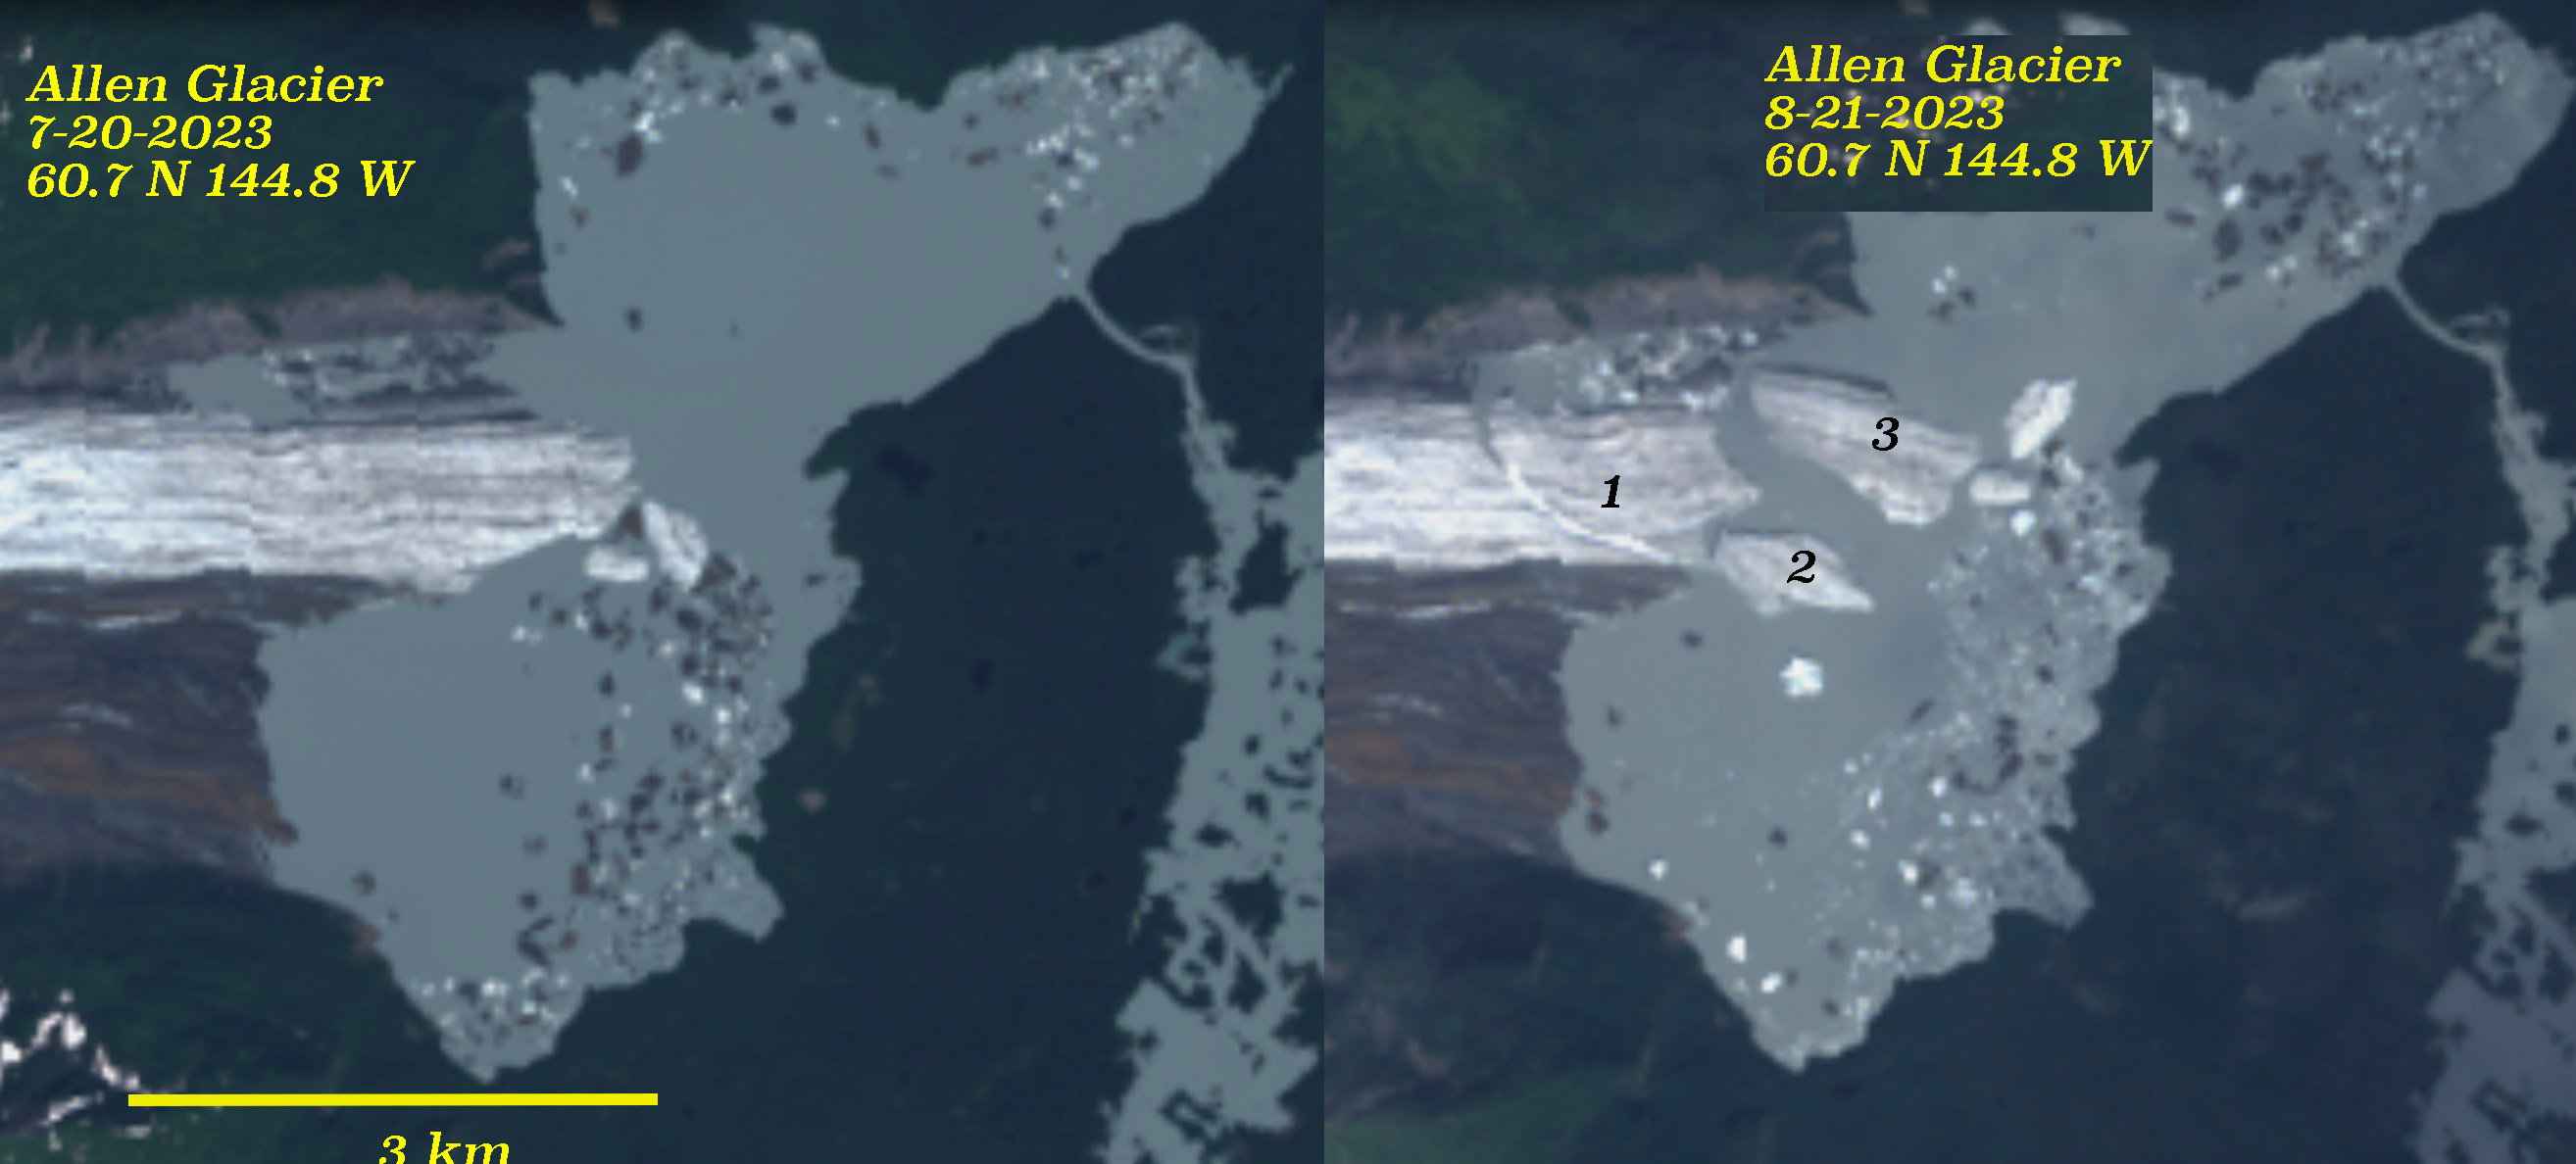
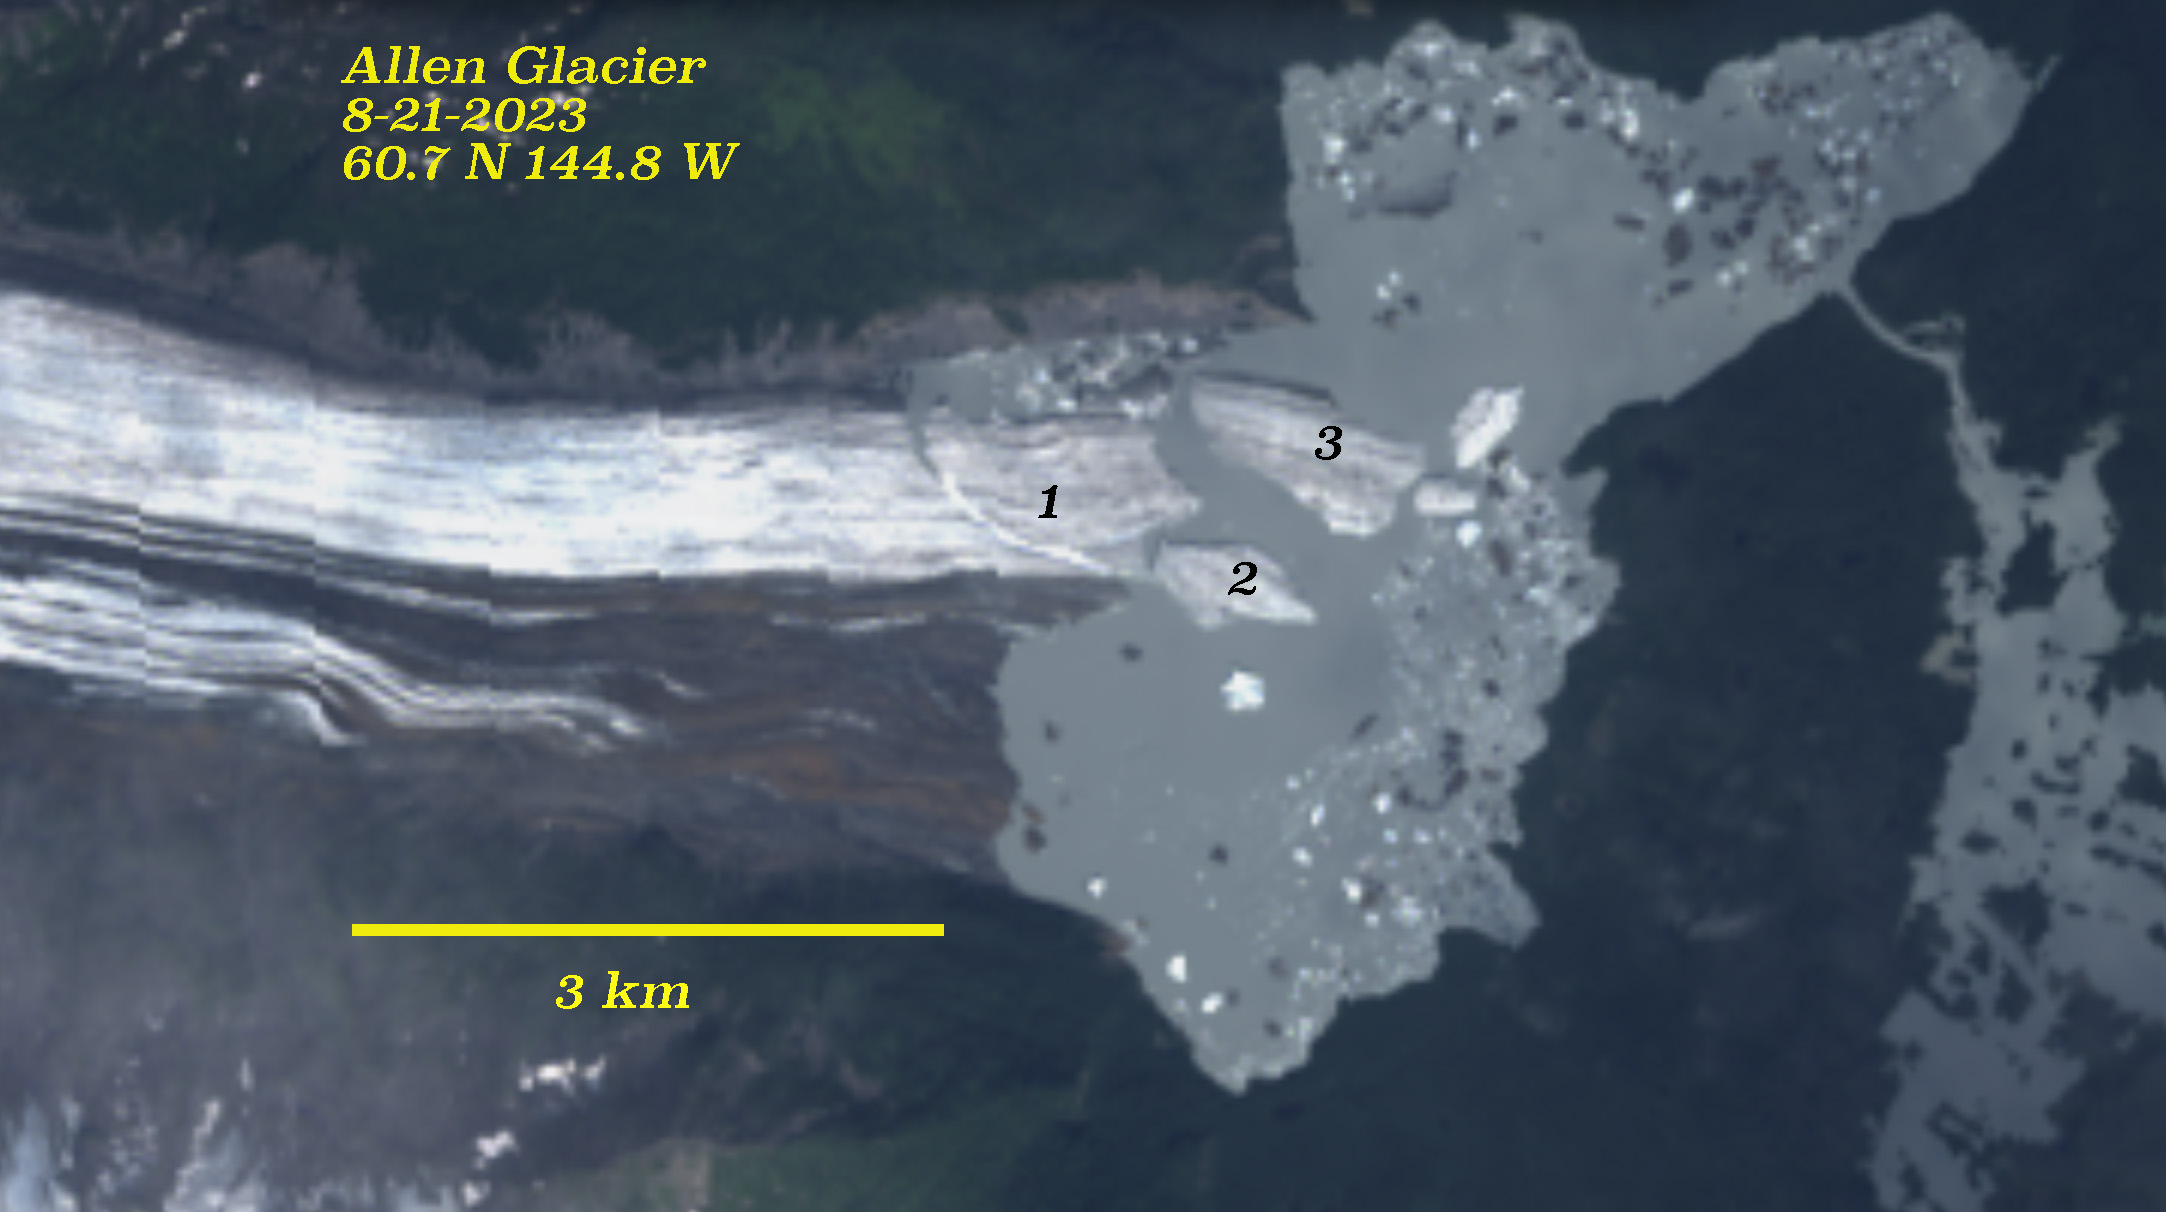
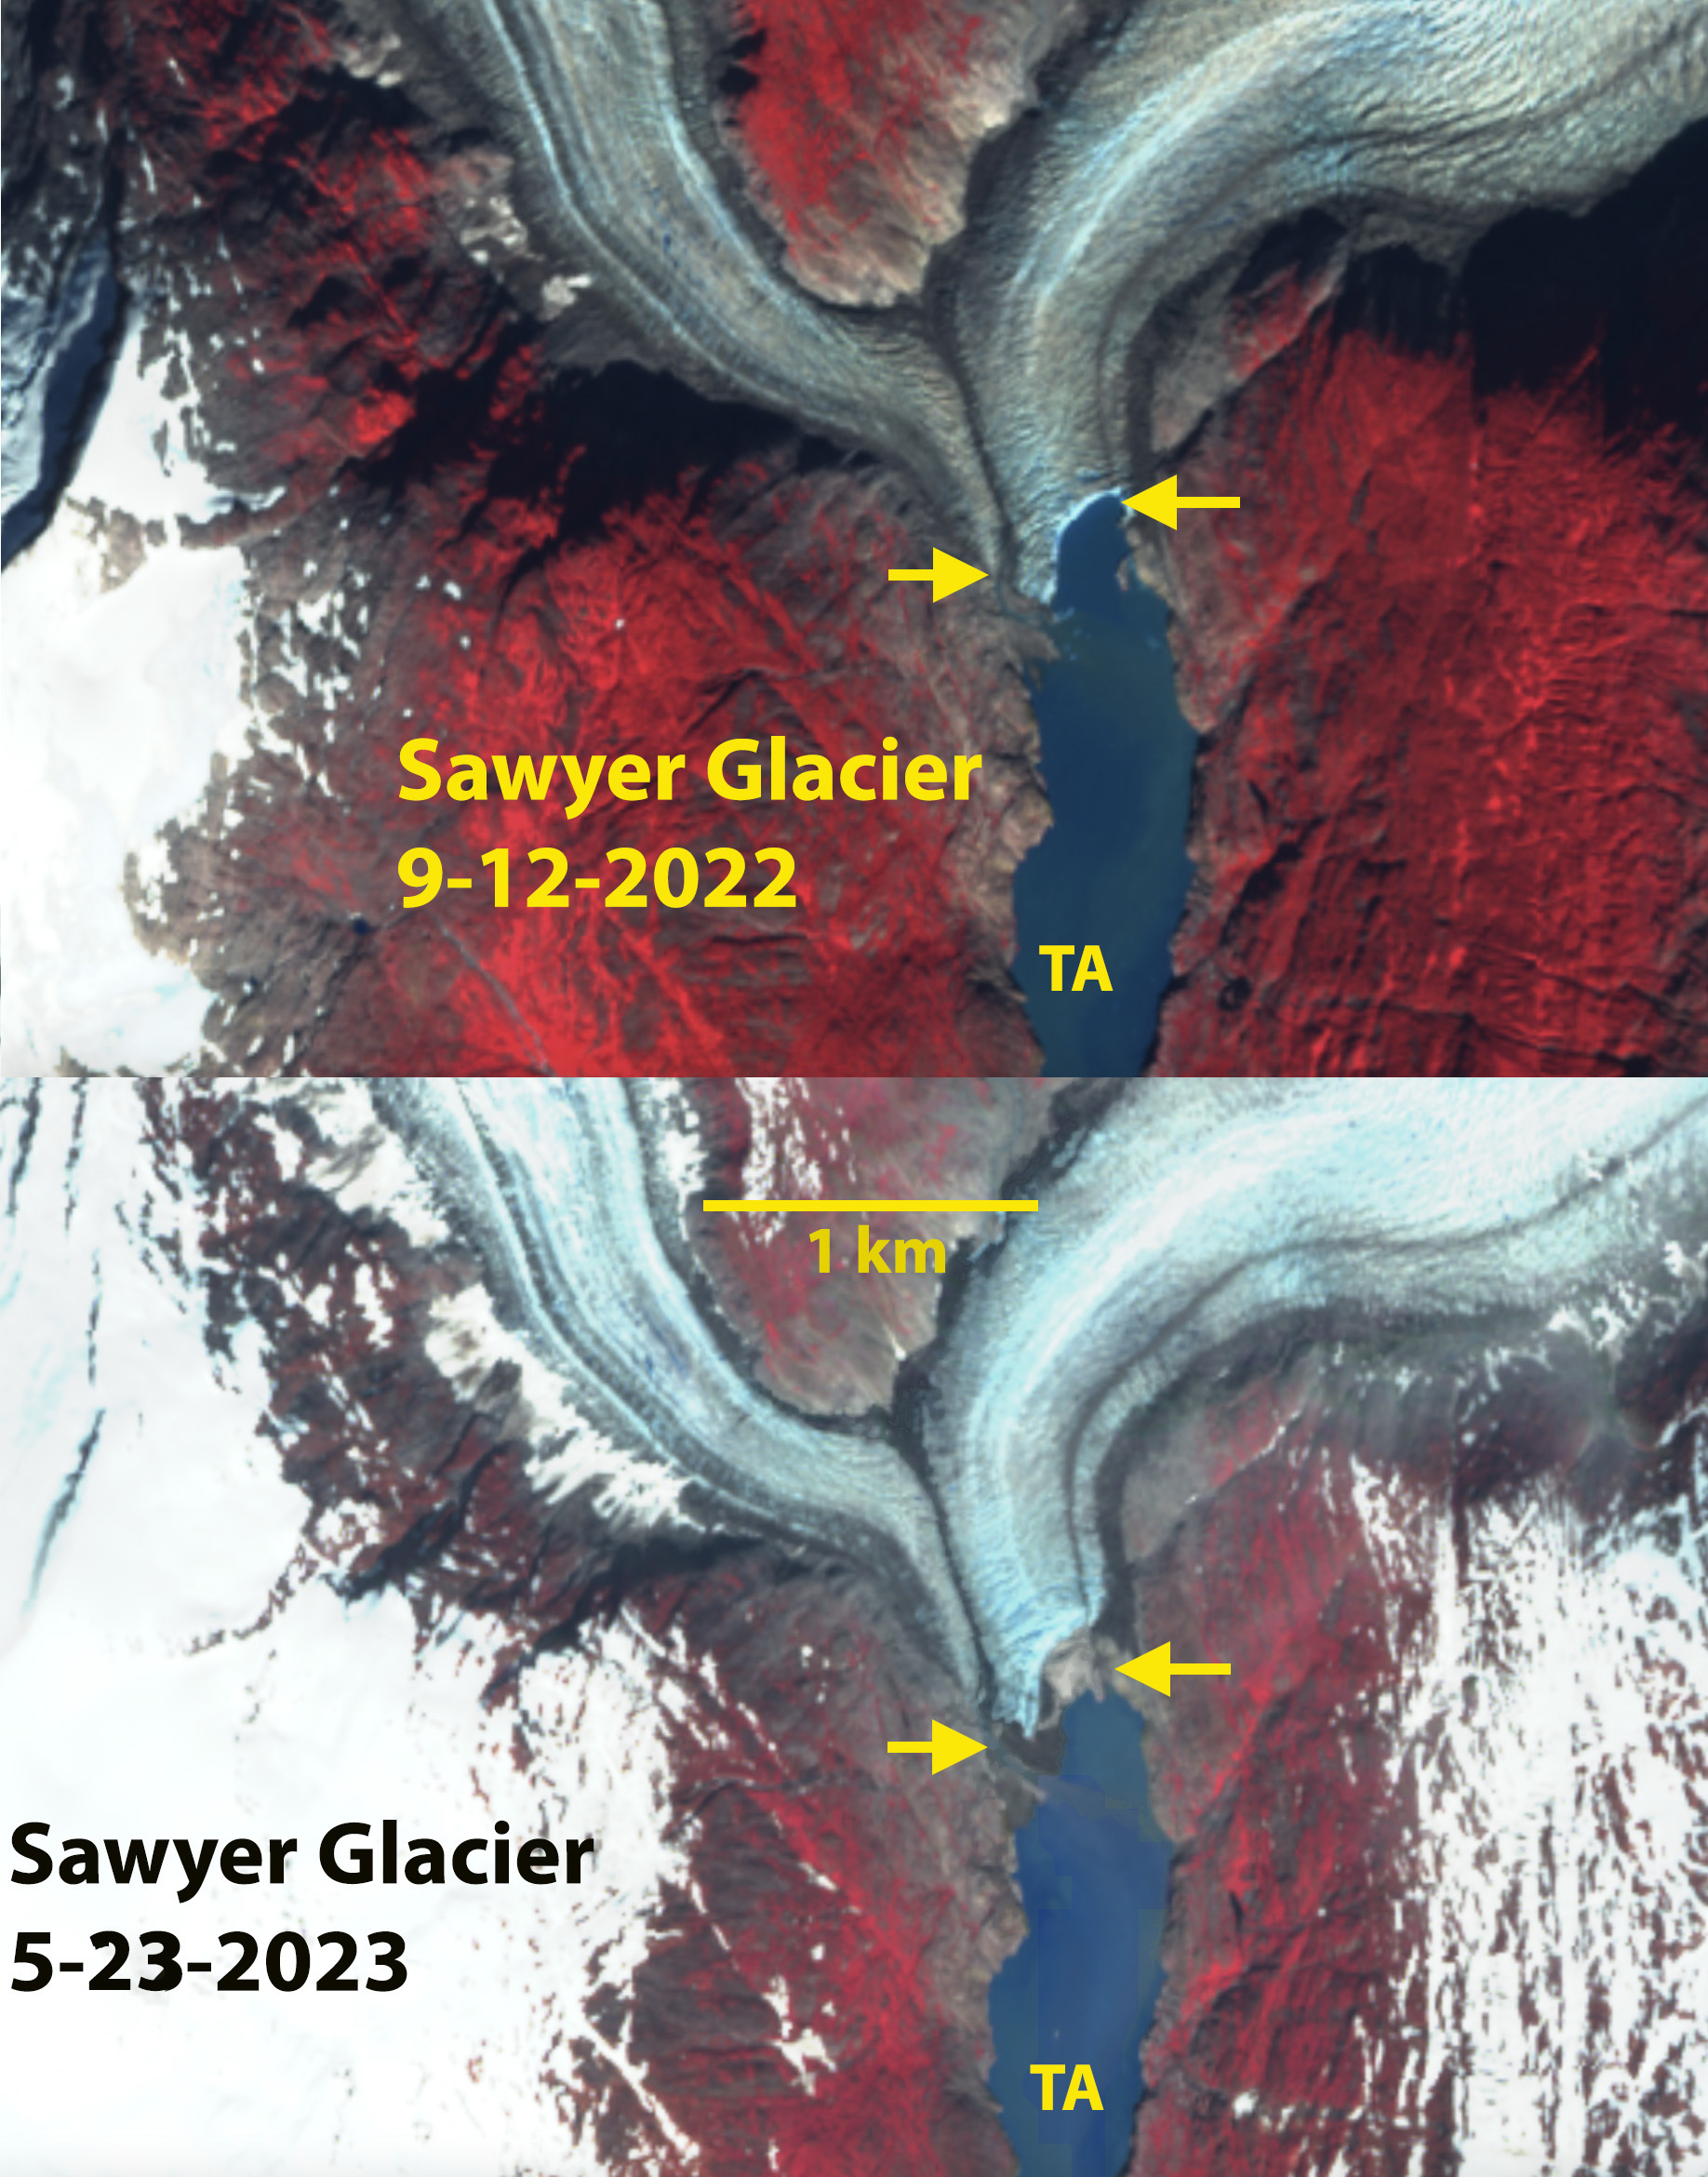
 In 2021 rifting had developed 2 km upglacier of the terminus, with the central tongue calving some smaller icebergs ~01. km² in this Landsat image below.
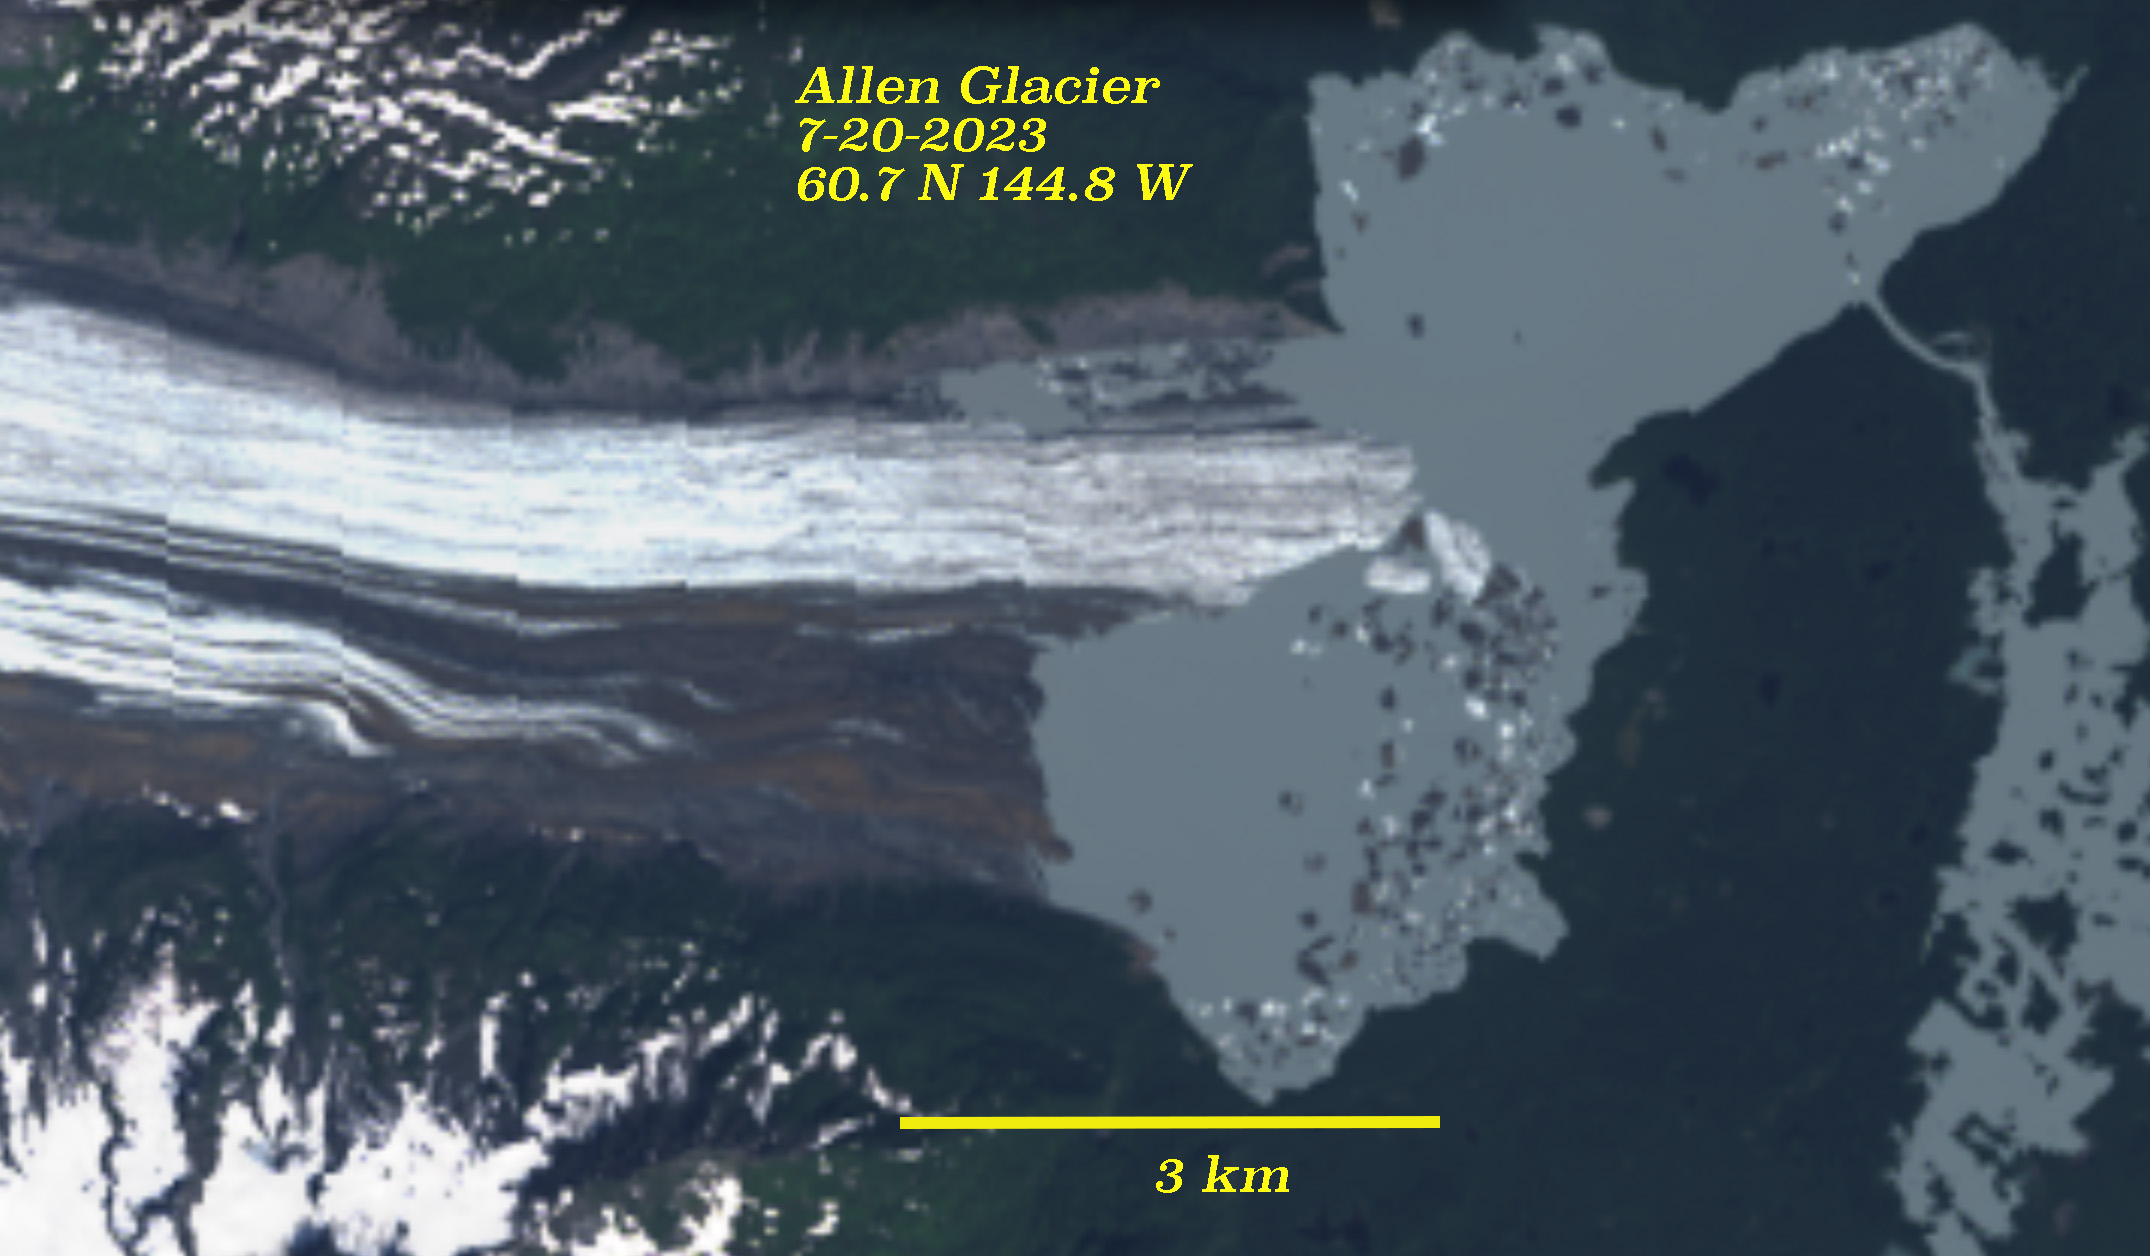


