
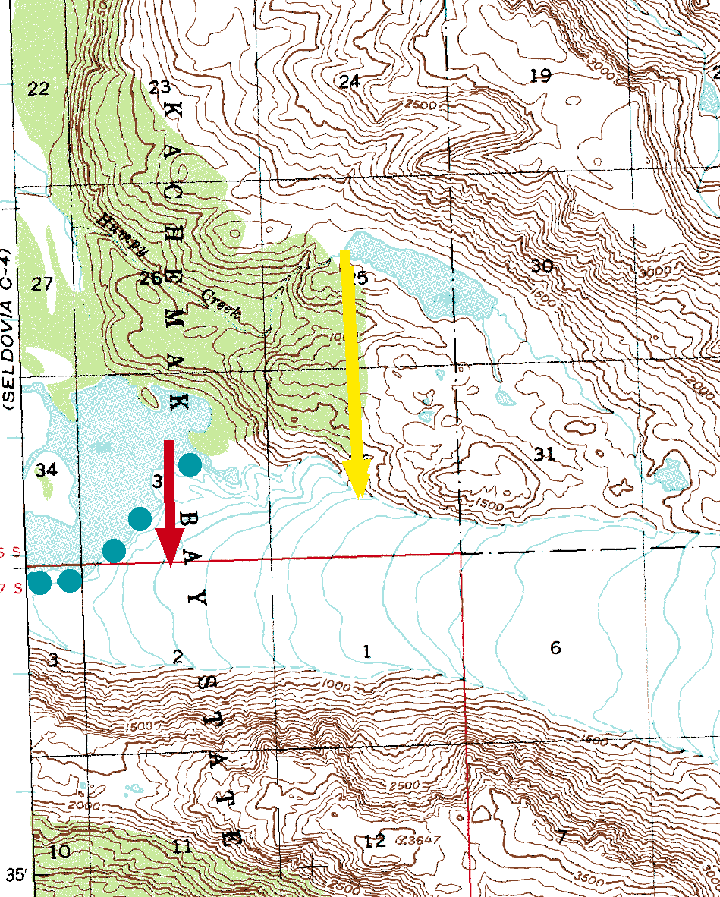
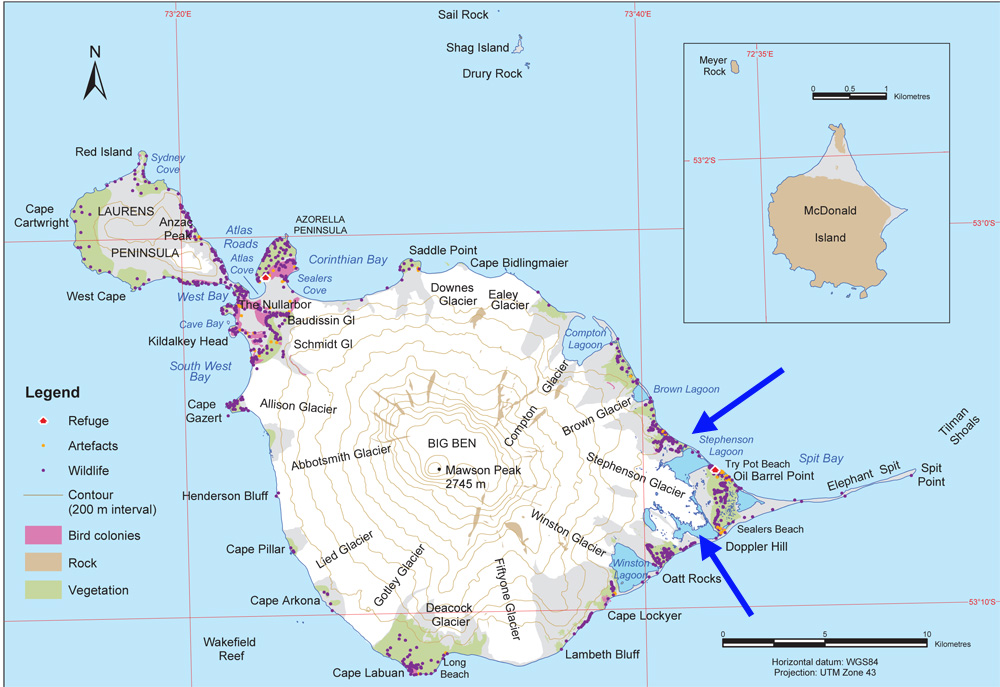
“Big Bend” Glacier is an unnamed glacier west of Big Bend Peak north of Harrison Lake in Southwest British Columbia. In 1985 the glacier was 2.6 km long filling a low valley with a surface elevation of 1600-1800 m elevation, the topographic map indicates this basic size. Here we utilize Landsat imagery to identify the changes in the glacier from 1985-2014 due to climate change. In essence the glaciated basin is transitioning to an alpine lake basin, quickly.
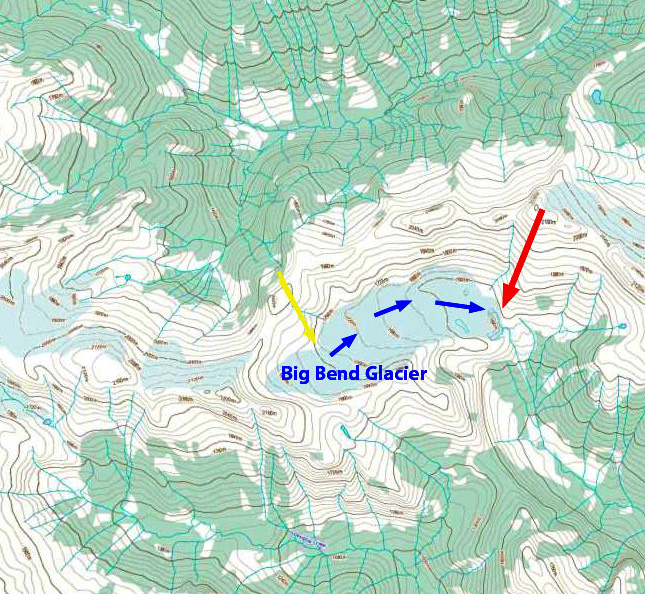
Topographic map of the Big Bend Glacier area.
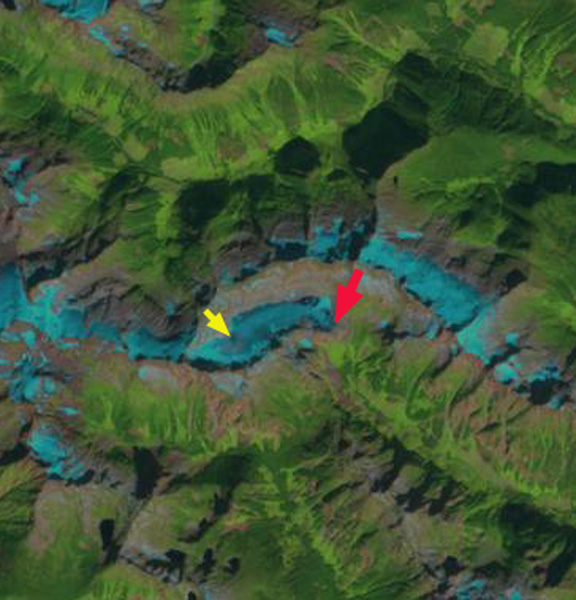
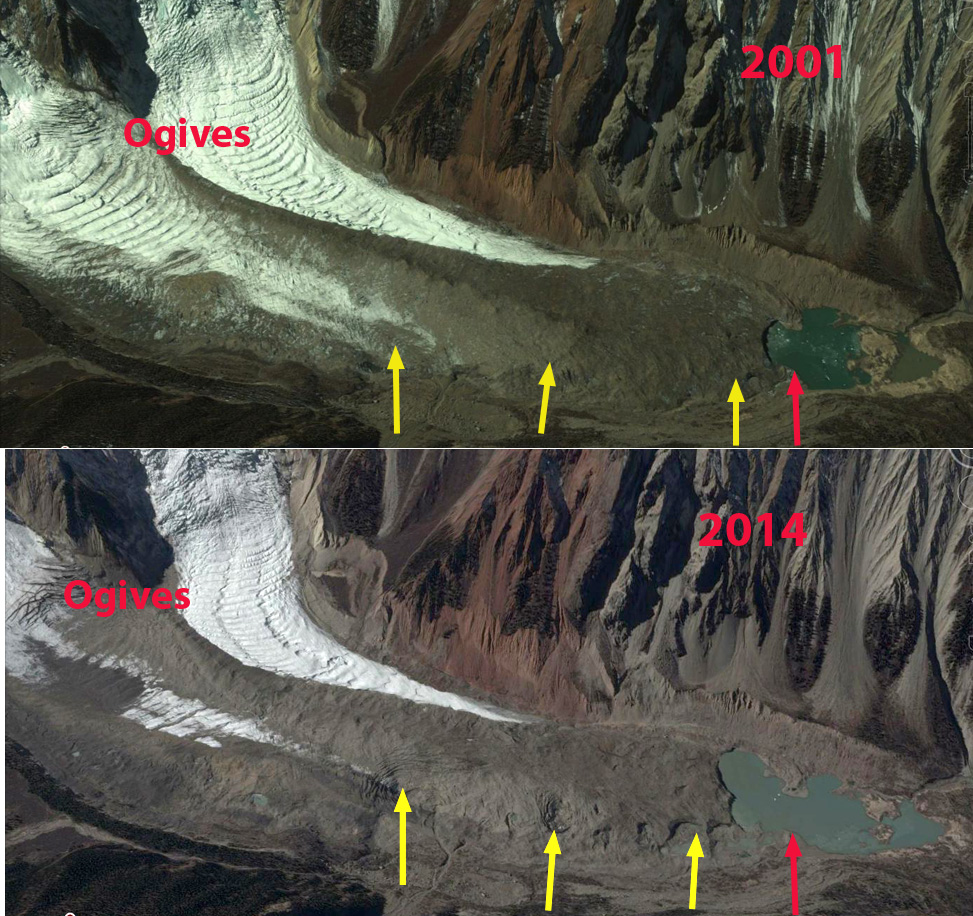
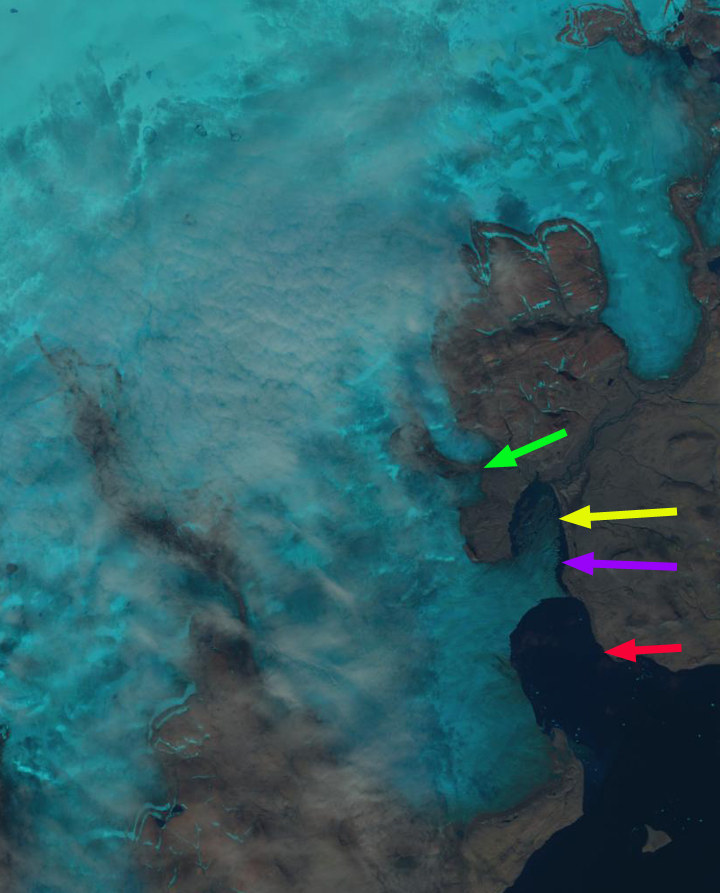
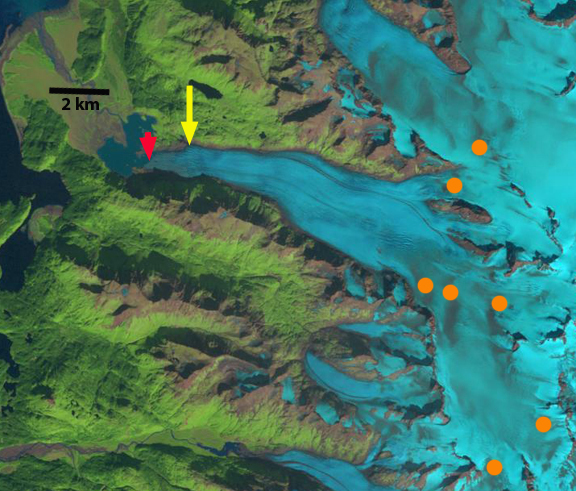
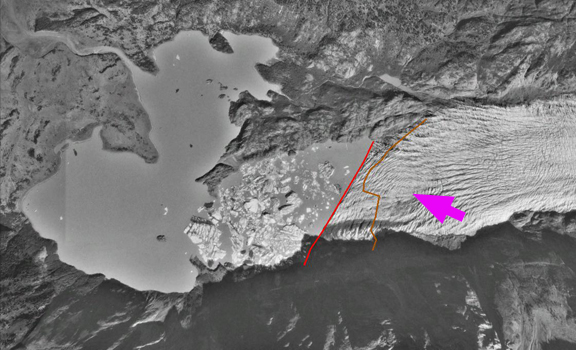
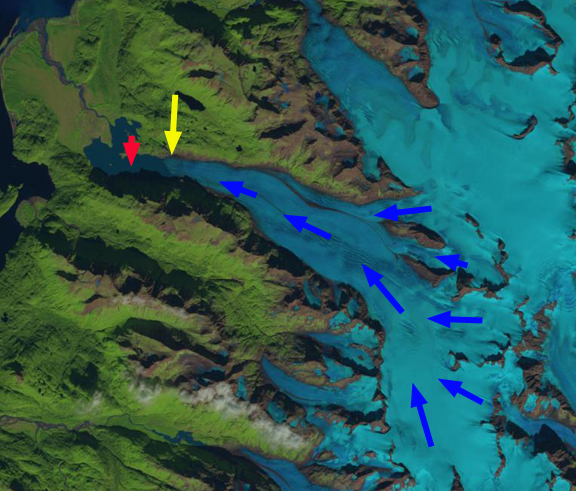
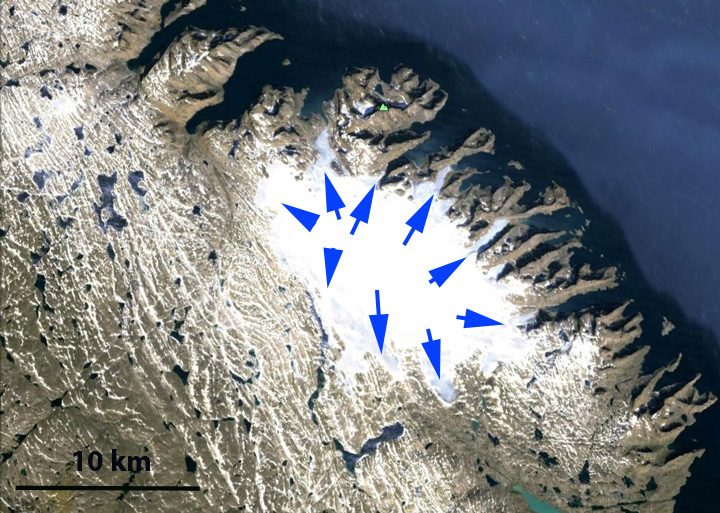
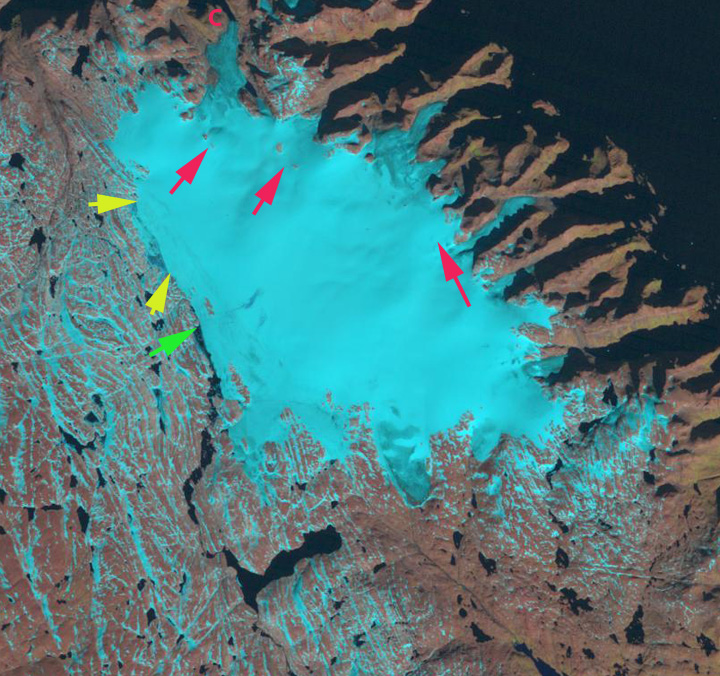
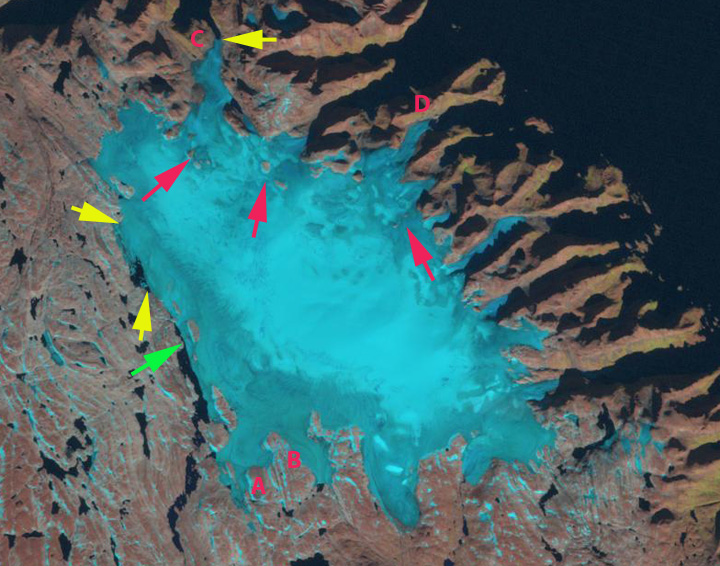
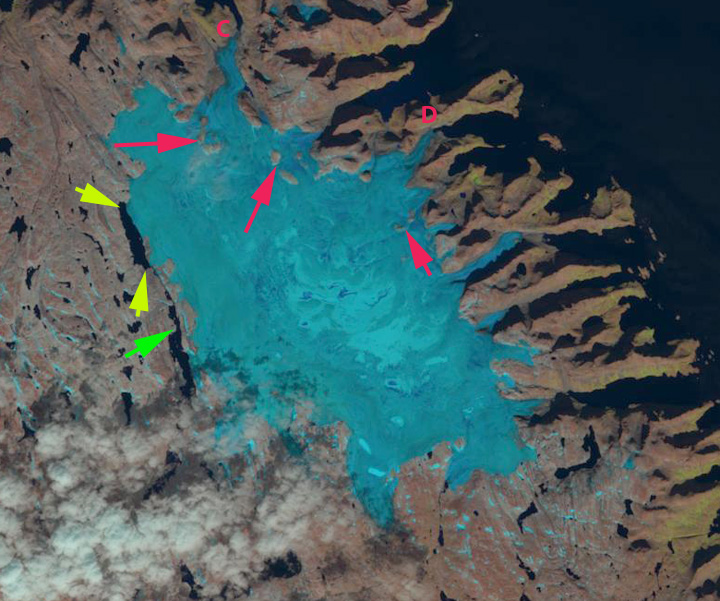
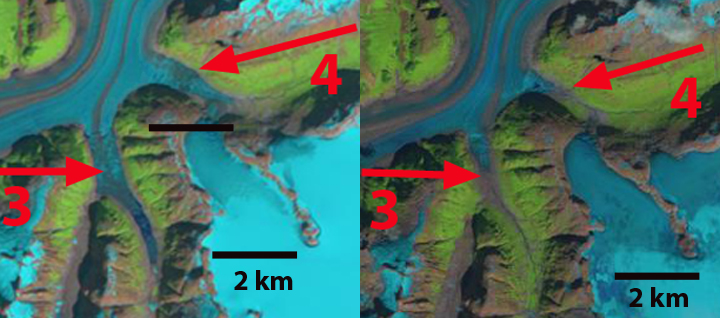
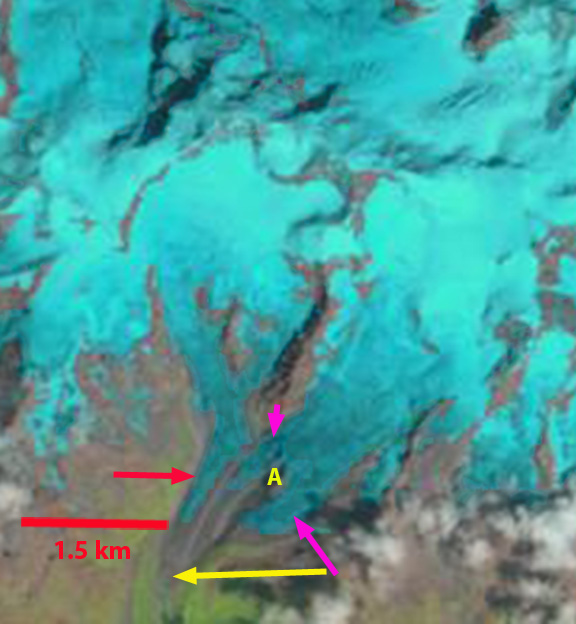
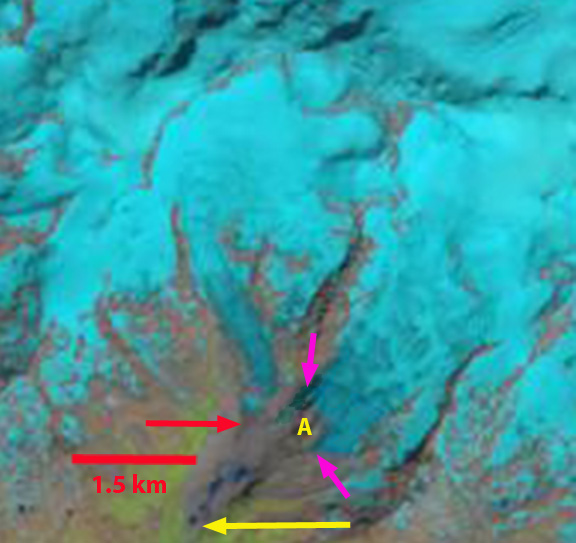
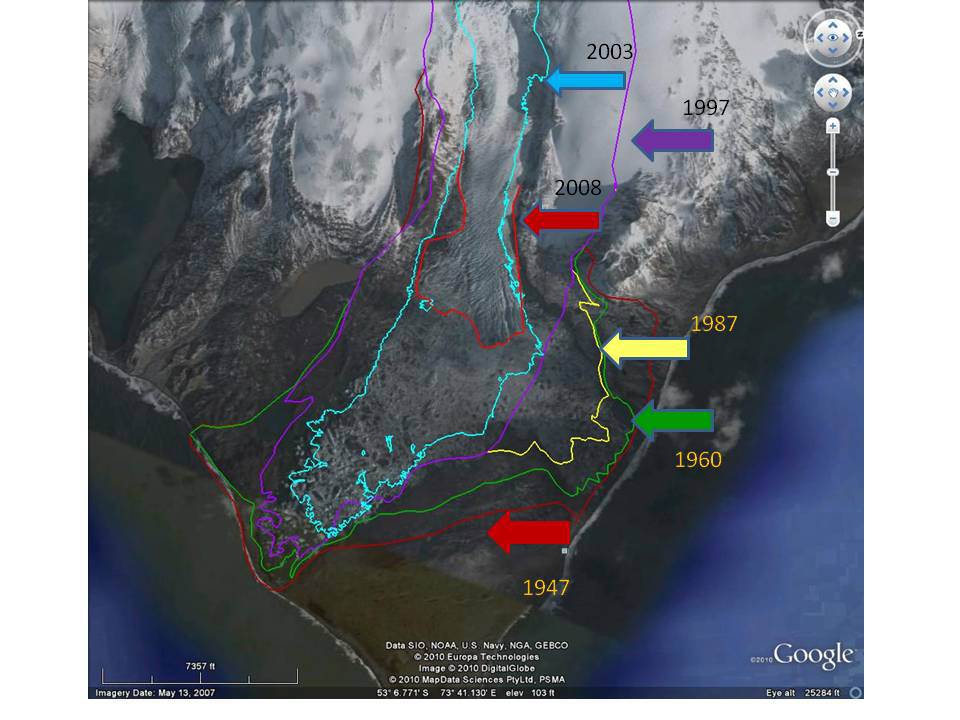
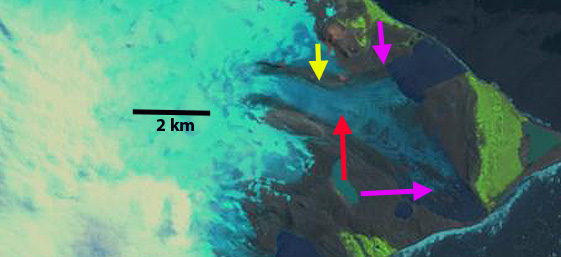
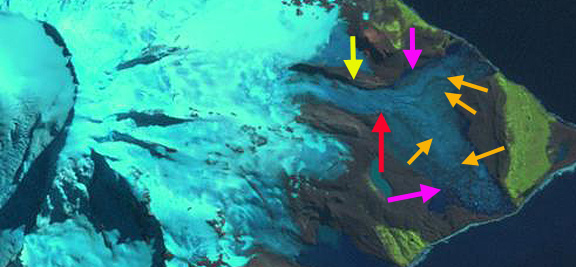
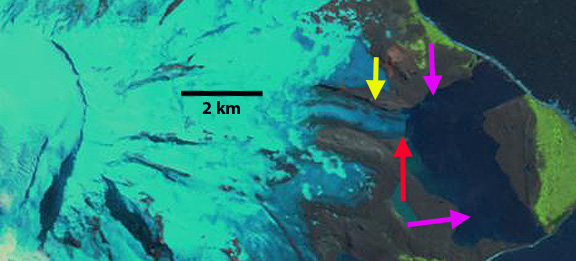
In 1985 the glacier extends to the big bend in the valley marking its eastern end, red arrow. the yellow arrow indicates an area near 1800 m where the glacier extends across the valley. In 1992 there has been little retreat but evident thinning is leading to lake formation at the terminus and narrowing of the glacier at the red arrow. In 2002 thinning is leading to expansion of a proglacial lake both west and south of the red arrow. The terminus retreat has still been limited, thinning is evident at the yellow arrow.
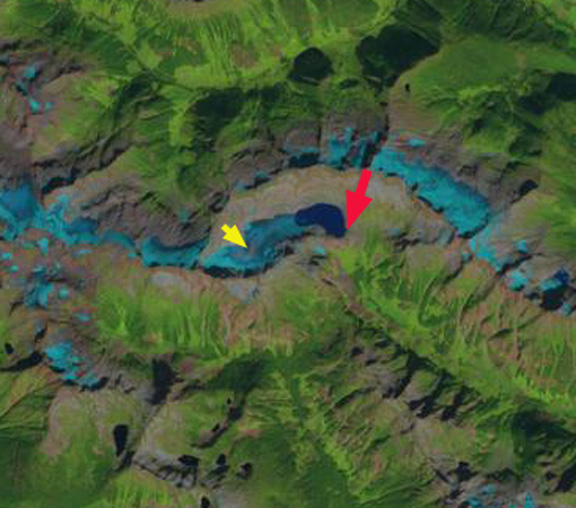
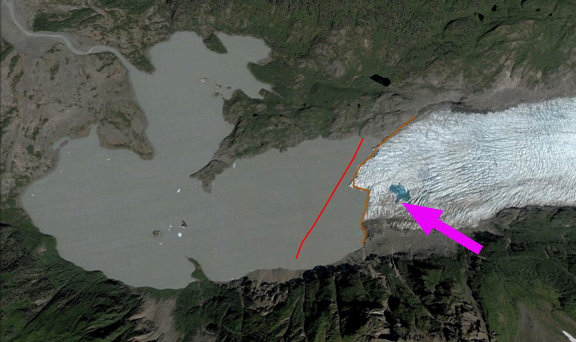
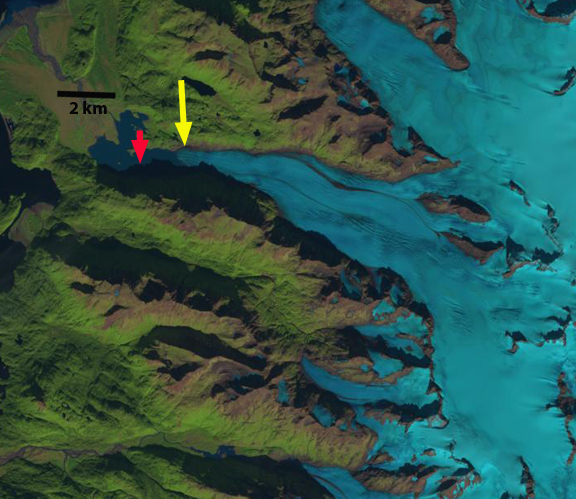
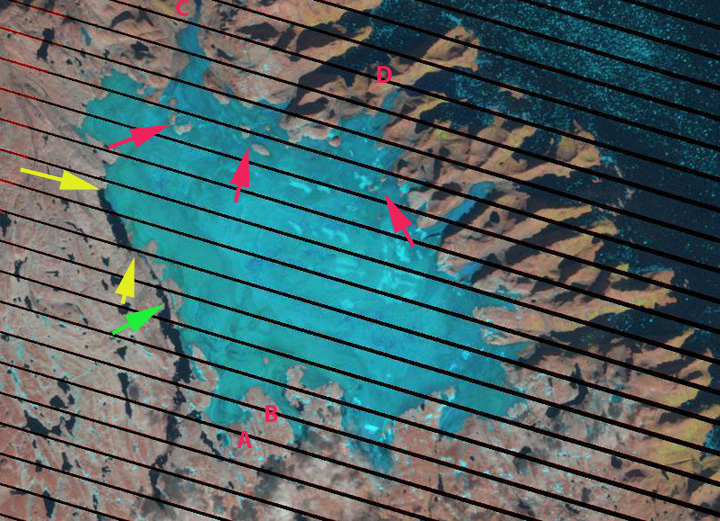
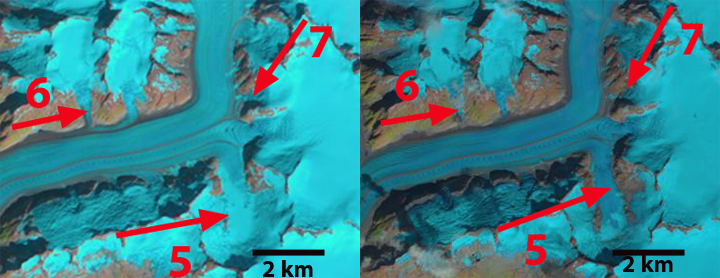
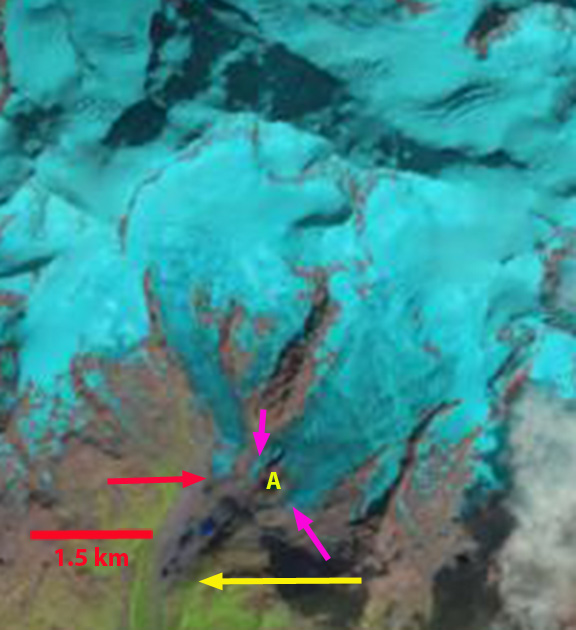
In 2013 a new alpine lake that is approximately 1 km long has formed, as the terminus area of the glacier has collapsed. In 2014 an area of bedrock and a small lake has developed at the yellow arrow. There is no retained snowpack below the yellow arrow in 2013, and no retained snowpack in at all in 2014. This will likely be the case in 2015 as well. This glacier has a lower top elevation than most in the region and will be more impacted by the warm winter conditions and high snowline of 2015. The retreat from 1985 to 2014 has been 1.1 km. This is 40% of the entire glacier length gone in 30 years. The lake itself has a deep blue color suggesting limited glacier sediment input, further indicating a lack of motion of the glacier currently or in the near past.
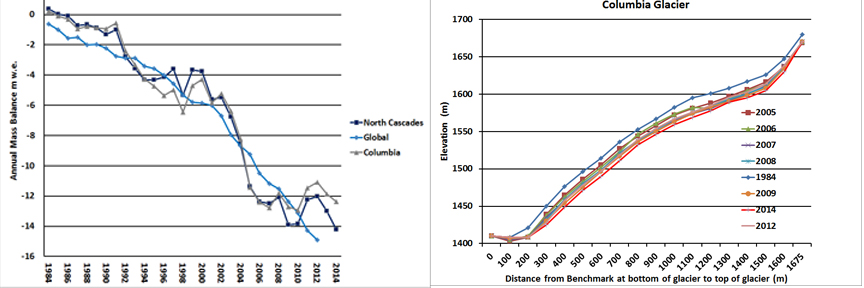
The glacier retreat has been more extensive than Stave Glacier or Snowcap Glacier to its east. Koch et al,(2009) observed a widespread retreat and glacier area loss in Garibaldi Provincial Park just to the west, with 20% area loss from 1988-2005. Place Glacier is a short distance north of Big Bend Glacier has its mass balance has lost an average of 25 m of water equivalent (28 m ice) thickness since 1984, see bottom chart. This has been higher but similar in trend to other glaciers in the region. Big Bend will disappear soon just as we obsserved already happened at Milk Lake Glacier, North Cascades, Washington.

1985 Landsat Image

1992 Landsat Image
2002 Landsat Image
2013 Landsat Image

2014 Landsat Image

North American cumulative glacier mass balance graph


 Clearly the area will still be beautiful and we will gain two new alpine lakes with the loss of the glacier. After making over 200 measurements in 2010 we completed a mass balance map of the glacier as we do each year. This summer we will be back again for the 32nd annual checkup. There will be likely be record low snowpack, comparable to 2005 the worst year from 1984-2014.


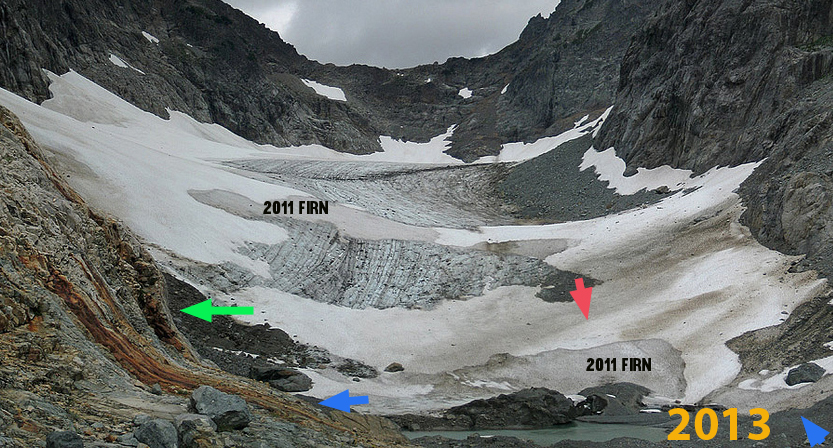
 Marginal recession averages 95 meters in this period ranging from 20-200 meters. The glacier was 1200 meters long in 1990 so this is close to a 10% loss in length. The current rate of retreat is slightly higher than the 3-5 m/a average fro the 1979-1993 period. The image in 1991 is from Aug. 25th, the glacier still has 70% of its area covered with snow from the previous winter. This is called the accumulation area ratio and in general must be above 60 at the end of the summer for the glacier to not lose mass. In 2003 the accumulation area ratio is about 30 and this is on Sept. 25th at the end of the melt season. In 2005 the accumulation area ratio is 30 at the most. Both years this limited a snowcover would lead to a significant negative mass balance, volume loss. The thinning in the upper portion of the glacier appears limited. There is not an evident change in the upper margin of the glacier. The crevassing which is indicative of movement has also not decreased much suggesting limited changes in the dynamics of the upper glacier. The comparatively slow changes in the accumulation zone, suggests a glacier that still has a consistent accumulation zone and is not likely to melt away rapidly, within the next 30 years, given the current climate. The glacier is showing no signs that it is approaching equilibrium, and that it can survive the current climate. This is in contrast to nearby

