Twin Glacier, Alaska Retreats from Twin Lake

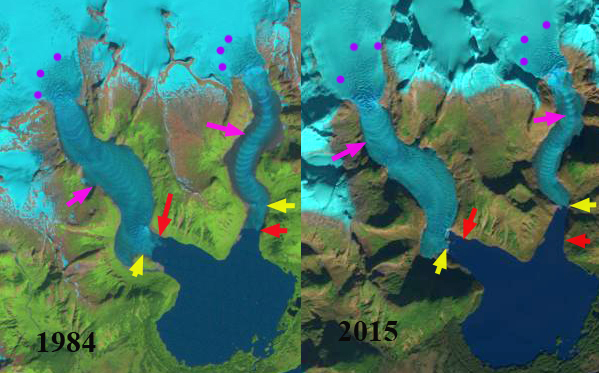
twin glacier compare

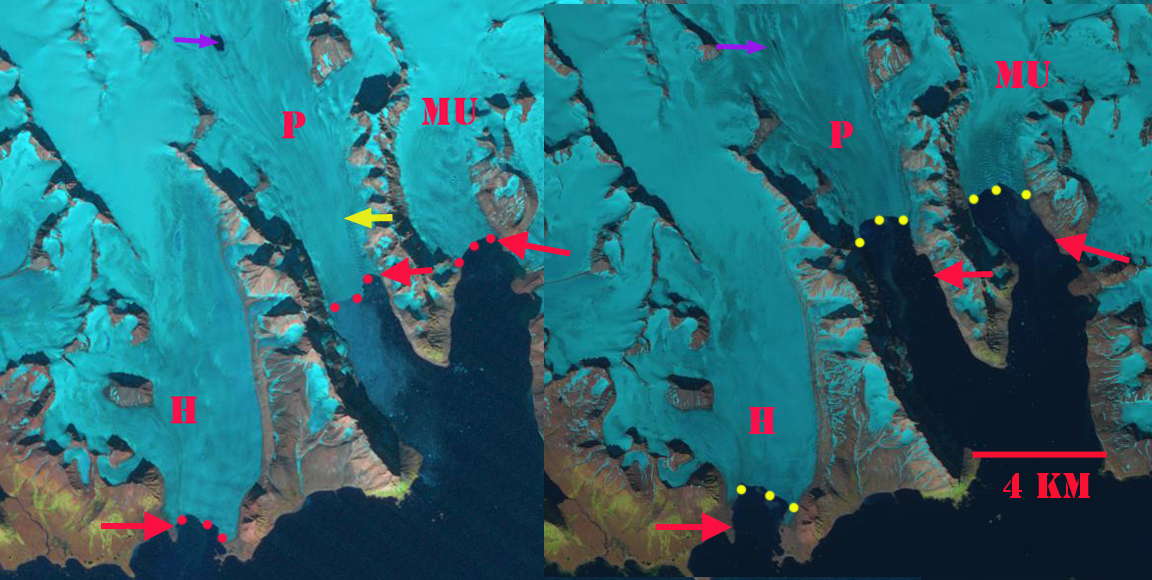
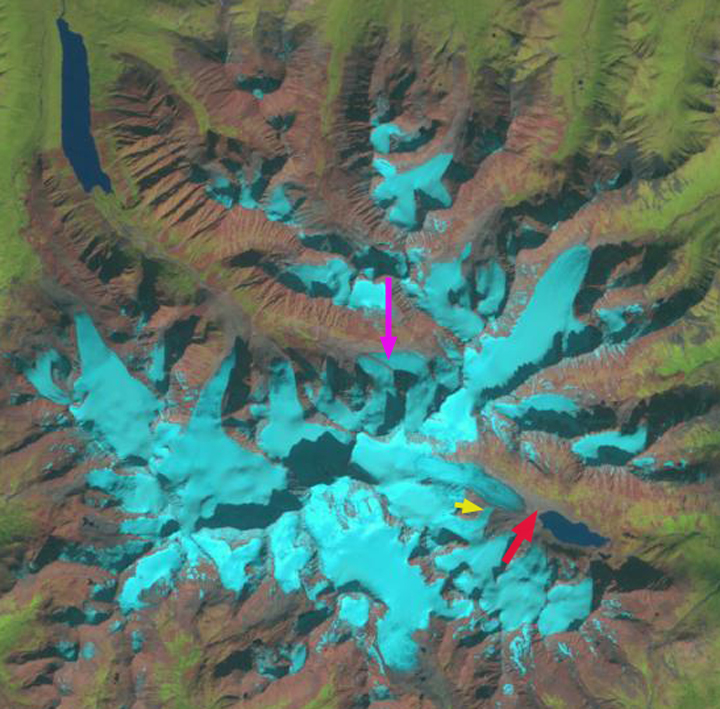
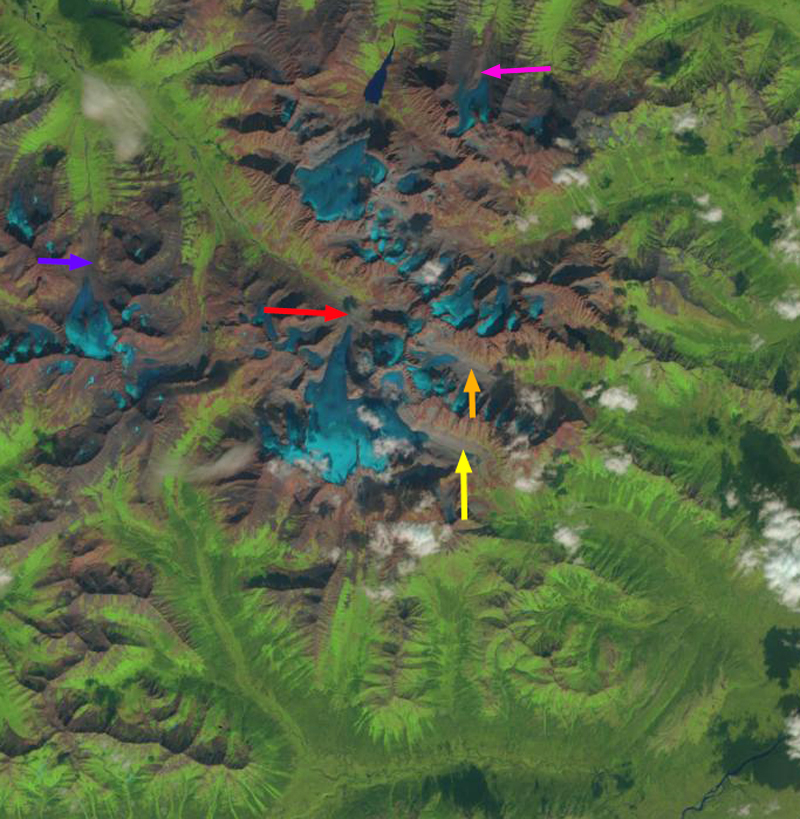
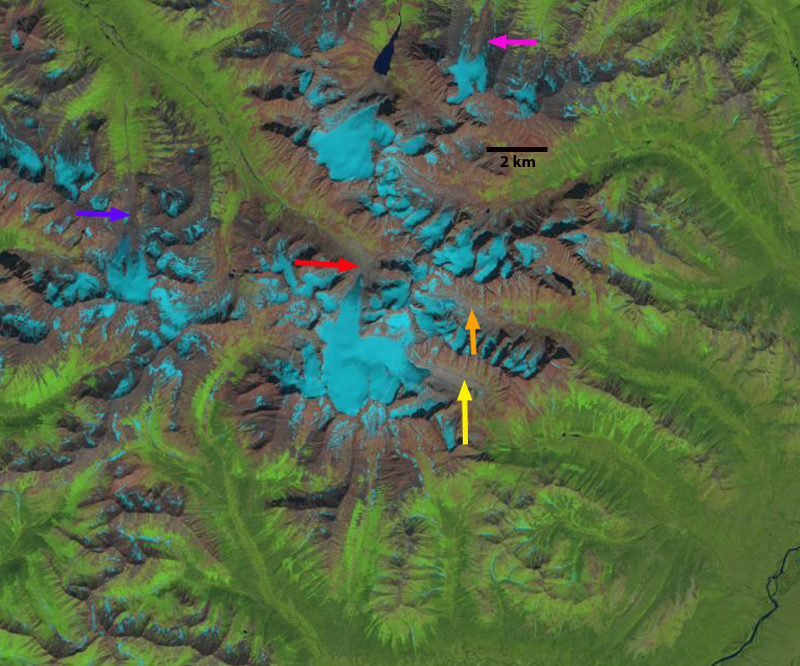
Landsat image comparospm pf 1984 and 2015.  The yellow arrow indicates 2015 terminus, red arrow the 1984 terminus, pink arrows the ogives and purple dots the snowline on the day of the image.

Twin Glacier is an outlet glacier of the Juneau Icefield flowing south into the Taku River valley, terminating in Twin Lake.  There are two terminus arms the East and West Twin Glacier are receding up separate fjords, though they are fed from a joint accumulation zone.  The Juneau Icefield has been a focus of study by the Juneau Icefield Research Program since 1946.  This program led to my first visit to the glacier as a member of the program in 1982 and again in 1984. Both glacier arms have pronounced ogives formed in the icefall that descends from the accumulation zone into the valley reach ablation zone. Ogives form annually from the seasonal variation of velocity through the icefall. An examination of the change in Juneau Icefield glaciers using Landsat images from 1984 and 2013 identify a significant retreat that has continued into 2015.

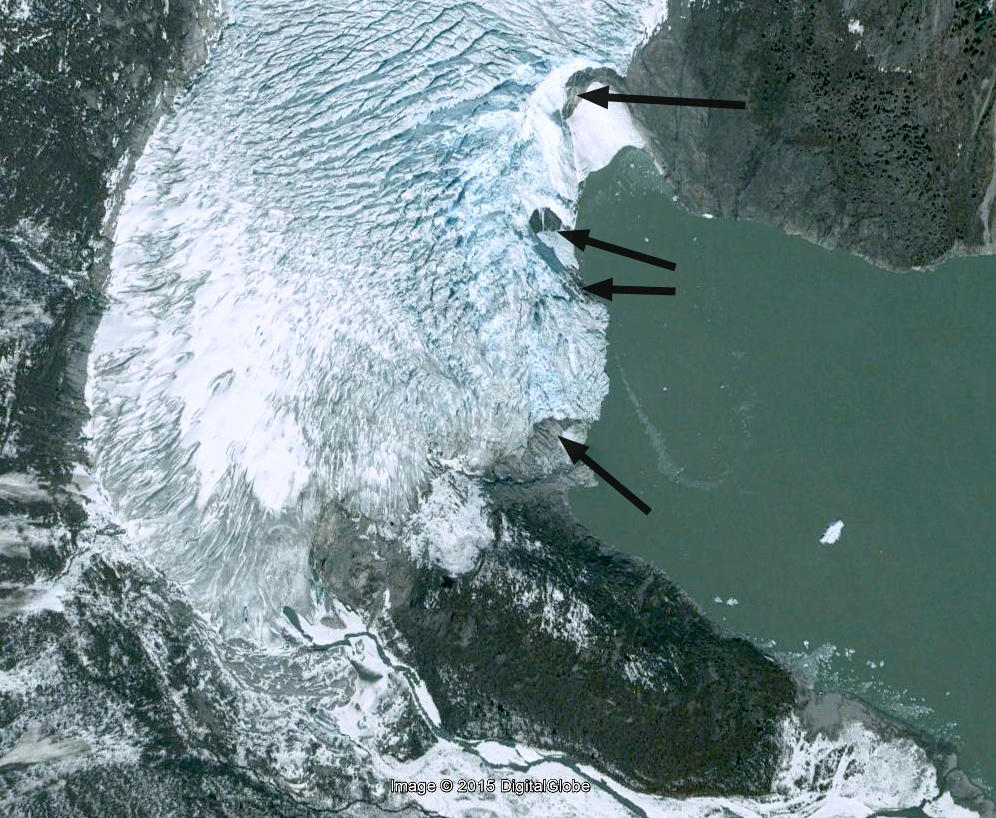
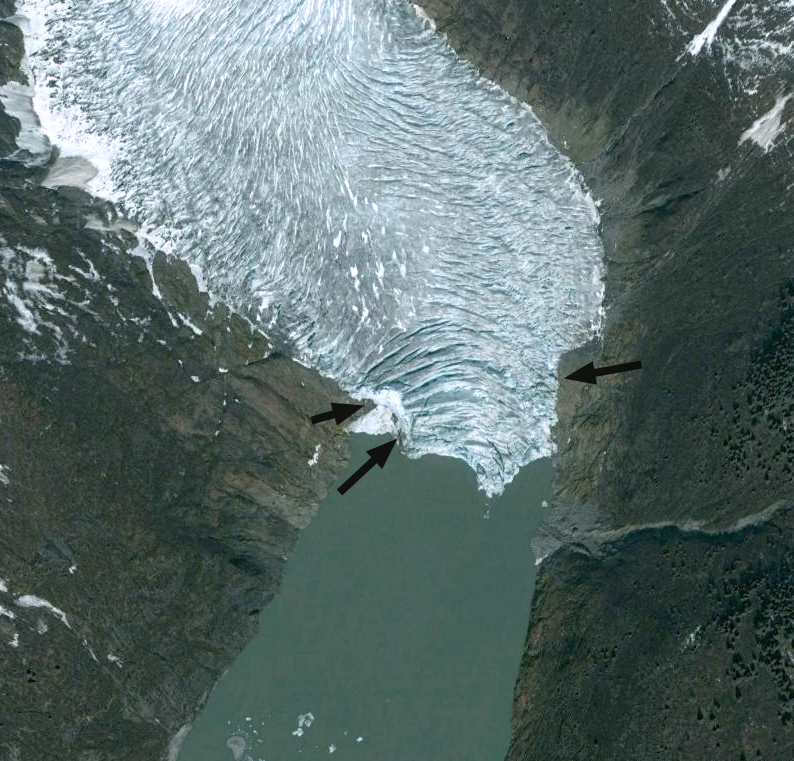
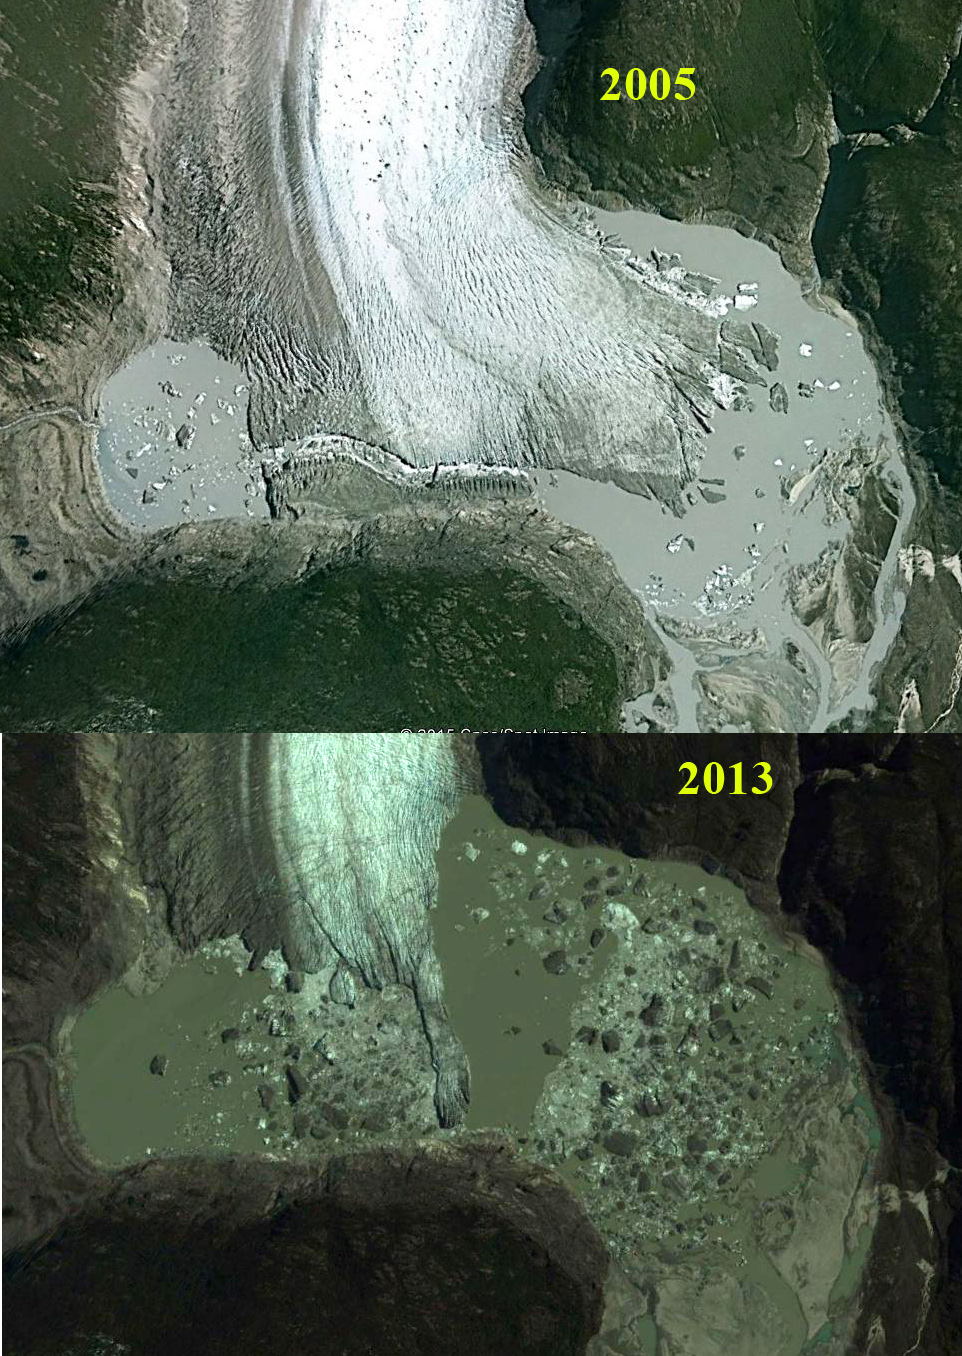
The West Twin has retreated 600 m from 1983 to 2013, at an elbow in the fjord. Elbows like this are often good pinning points that are a more stable setting.  This elbow also represents the point at which the glacier terminus is pulling out of the lake that it is calved into for over a century.  The bedrock at the terminus is evident in both 2006 imagery and a 2015 image from the Wings Airways five glacier seaplane discovery tour, black arrows.  The glacier will no longer be calving, which should also slow the retreat rate.

west twin 2006 ge
Google Earth Image 2006
west twin float plane
2015 Wings Airways image

The East Twin is the  narrower glacier and drops more quickly in elevation. The glacier has retreated 900 m from 1984 to 2015. The terminus has calved into Twin Lake for over a century, but in 2015 the width of the terminus calving into the lake has declined to 150 m from 600 m in 1984.  The bedrock exposed on either side of the terminus indicates the terminus is on the verge of retreating from the lake.  The black arrows indicate both bedrock at the glacier front, but also the trimlines left from recent thinning.  The Google Earth image from 2006 and the 2015 image from the Wings Airways five glacier seaplane discovery tour.

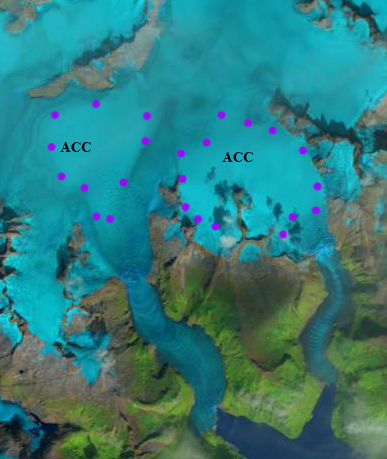
In 2015 the snowline was particularly high, the accumulation zone usually covers the entire reach of the broad high elevation accumulation zone, not the pockets indicated by the purple dots. The declining mass balance identified by the Juneau Icefield ongoing mass balance program, which the high snowlines is indicative of is what is driving the retreat (Pelto et al, 2013).

east twin 2006
Google Earth Image
east twin float plane
Wings Airways Image

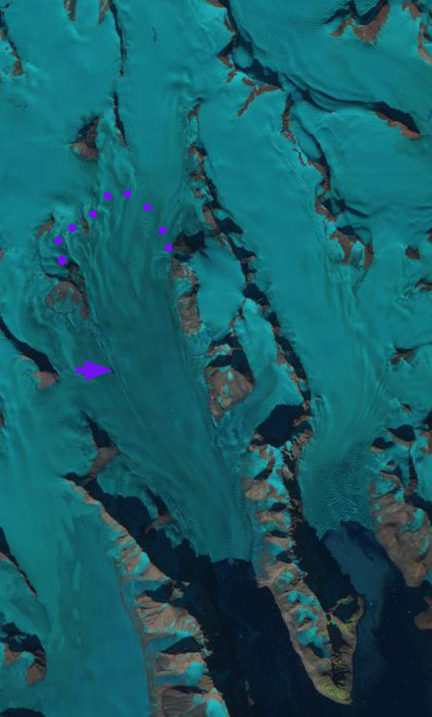
twin glacier 2015 acc

August 2015 Landsat image of Twin Glacier.  The purple dots outline the accumulation zone where snowpack was retrained from 2015.

A Voice for Glaciers at COP21

During the last six years From a Glaciers Perspective has published 520 Posts examining the response of glaciers to climate change.  No hyperbole has been needed to use words such as disappear, fragmented, disintegrated, and collapse.  Glacier by glacier from the fragmentation of glaciers to the formation of new lakes and new islands has emphasized the changing map of our world as glaciers retreat.   The story details change, but the story remains the same; glaciers are poorly suited for our warming climate, and their only response is to hastily retreat to a point of equilibrium, which many will not attain, and some have already ultimately failed. The Gallery below is a mere snippet of the changes that are occurring. These are illustrations of why our paper this year led by the World Glacier Monitoring Service team was titled Historically unprecedented global glacier decline in the early 21st century. As the UN Climate Change Conference 2015 in Paris, COP21 begins, since no glaciers are invited, there story must be told in pictures, data and our words.

Data: World Glacier Monitoring Service Mass Balance Time Series for Alpine Glaciers.


_summary-2012-2013-2014.xlsx

Pictures


Words:

After 34 consecutive summers working on glaciers, there is occasion to speak as more than just a scientist, since glaciers do not have a voice people hear.

Paierbreen Rapid Calving Retreat, Svalbard

paierbreen compare
1990 and 2014 Landsat images indicating Paierbreen (P), Muhlbacherbreen (MU) and Hansbreen (H). The red arrow and red dots indicate the 1990 terminus location and yellow arrows and yellow dots the 2014 terminus location. The purple arrow indicates the location of a supraglacial lake that was persistent in the 1990’s but is no longer evident in 2013, 2014 and 2015.

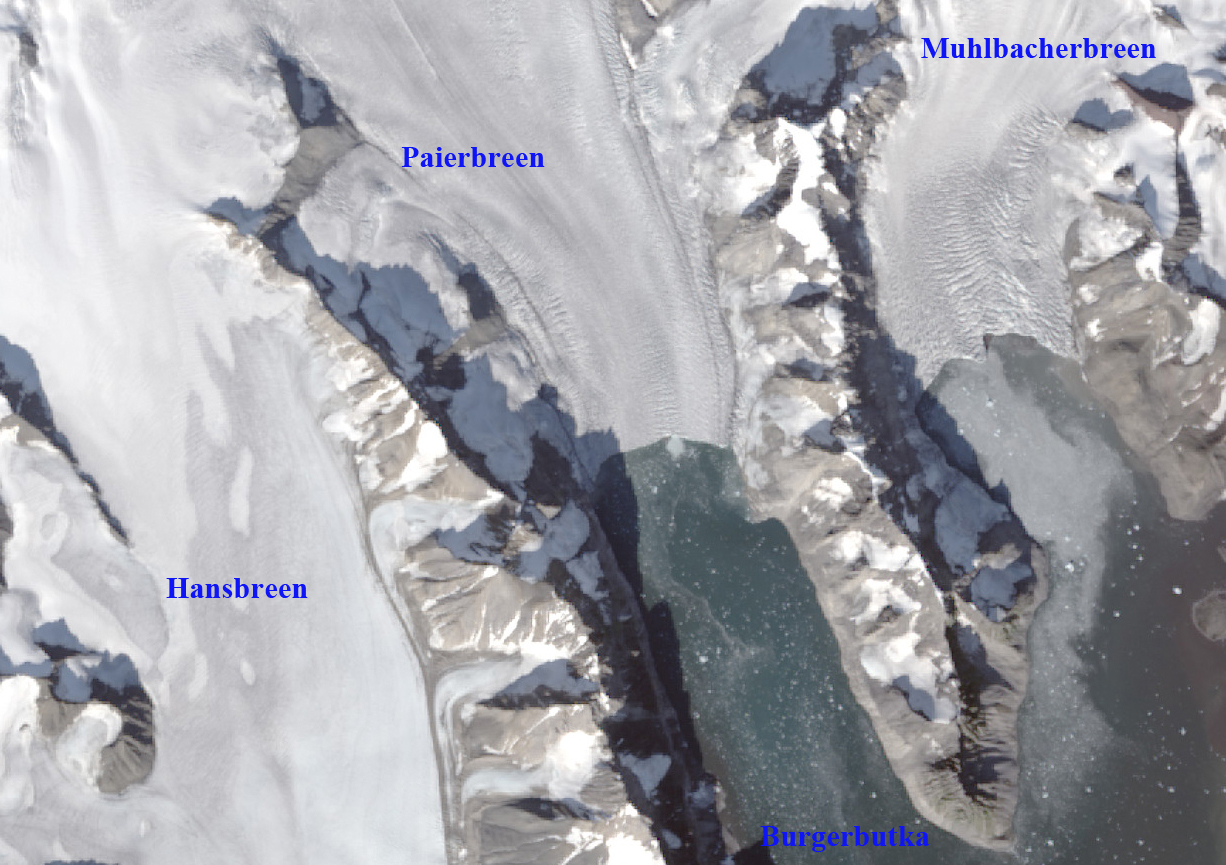
From 1990 to 2014 all four of the glaciers terminating along the north coast of Hornsund have retreated significantly: Hansbreen (H), Paierbreen (P), Muhlbacherbreen (MU), Storbreen. Svalbard is host to 163 tidewater glaciers with a collective calving front of 860 km (Błaszczyk et al, 2009). Nuth et al (2013) determined that the glacier area over the entire archipelago has decreased by an average of 80 km2 per year over the past 30 years, a 7% reduction. In the most recent period 1990-2007, terminus retreat was larger than in an earlier period from 1930-1990, while area shrinkage was smaller. Hornsund is a fjord that in 2014 almost cuts through the southern Island of Svalbard. The Institute of Geophysics Polish Academy has maintained a Polish Research Station in Hornsund since 1957.  The 1984 map, from the University of Silesia, of the glaciers and geomorphology document the extent of the glaciers in 1983. A more detailed examination by the same researchers, Blaszczyk et al. (2013) reported the total area of the glacier cover lost in Hornsund Fjord area from 1899–2010 was approximately 172 square kilometers. This groups ongoing research, Petlicki et al (2015) , identified the impact of a waterline notch that enhances calving at Hansbreen. This study identifies the importance of water temperature and reduced sea ice cover in the fjord.

Paierbreen in 1990 terminated in Burgerbutka with a 1900 meter long calving front. At the purple arrow a supraglacial lake existed that is also seen in the TopoSvalbard Map. The snowline on Paierbreen is further upglacier of the calving front than for the adjacent glaciers indicating a lower surface slope. By 2014 the glacier has retreated 2200 m with the current terminus at a narrow point in the fjord.  Beyond this point the fjord again expands, which will enhance calving and retreat.  There is no significant step in glacier slope indicating where the tidewater limit is, given the low slope, it is not likely close to the current ice front.  The calving front is 1600 m wide in 2014. The supraglacial lake is only a sliver in 2013 and 2014. The snowline in the Landsat image from 2013 is at 450 m. The story of retreat here is the same as at Samarinbreen and Hornbreen
paierbreen 2013
2013 Landsat Image

paierbreen map
Topographic Map from TopoSvalbard

paierbreen aerial
Satellite Image from TopoSvalbard

Zhizhai Glacier Retreat, Lake Expansion, China

zhishai compare

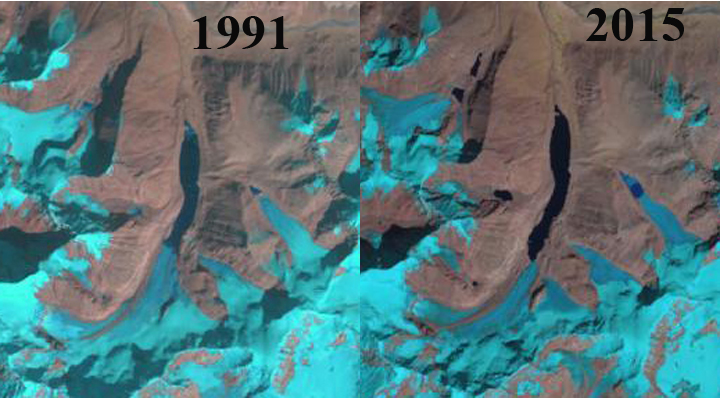
Fig. H. Zhizhai Glacier change from 1991 to 2015, red arrow indicates 1991 terminus, yellow arrow 2015 terminus and purple arrow indicates areas of thinning. Green arrow indicates another lake growing with glacier retreat.

Located between Longbashaba Glacier and Jimi Glacier, this glacier extends 4.75 km north from the Nepal-China border in the southeast region of the Pumqu River basin.  The moraine dammed glacier lake, Zhuxico Lake, poses some risk to the 23 villages downstream of the lake and the Rongkong Hydropower station. This risk has been examined for another lake in the basin Longashaba by Yao et al (2012). Che et al (2014) report on an inventory of glaciers and glacier lakes in the Pumqu Basin, and note that lake expansion is higher from 2001-2013 than for the 1970-2000 period, posing greater threats for a glacier lake outburst flood. They report that there are 254 glaciers lakes in the basin currently 55 of which have formed since 1970. In 1991 the glacier terminated in a proglacial lake that was 2.25 km long. A tributary flowed around a ridge and rejoined the main glacier, purple arrow.   By 2000 the glacier had retreated 200 m, the tributary at the purple arrow remains connected to the main glacier.  By 2015 the glacier had retreated 600 m and the lake is 2.9 km long and remains 300 m wide.  The tributary at the purple arrow no longer rejoins the main glacier. Just east of Zhizhai Glacier an unnamed glacier also features an expanding lake due to glacier retreat (green arrow).  The retreat follows the pattern of other glaciers in the region that are retreating and having glacier moraine dammed lakes expanding such as Longbashaba Glacier and Lhonak Glacier.

zhizhai glacier 2000

Landsat image 2000

zhizhai 2014

Google Earth Image indicating the flow of the glacier, blue arrows and areas of upglacier thinning, purple arrows. 

1991 to 2015 Comparison
zhizhai change

Kronebreen and Kongsvegen, Svalbard Initiation of Glacier Separation 2015

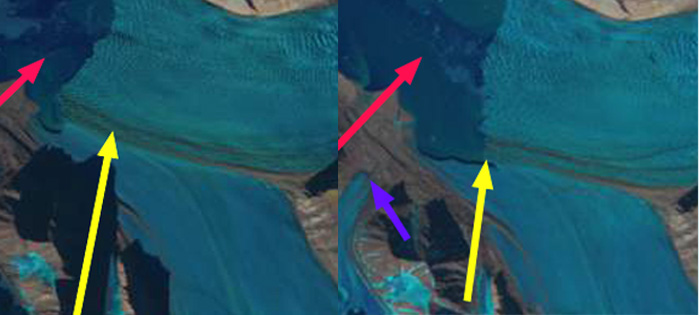
kronebreen terminus2
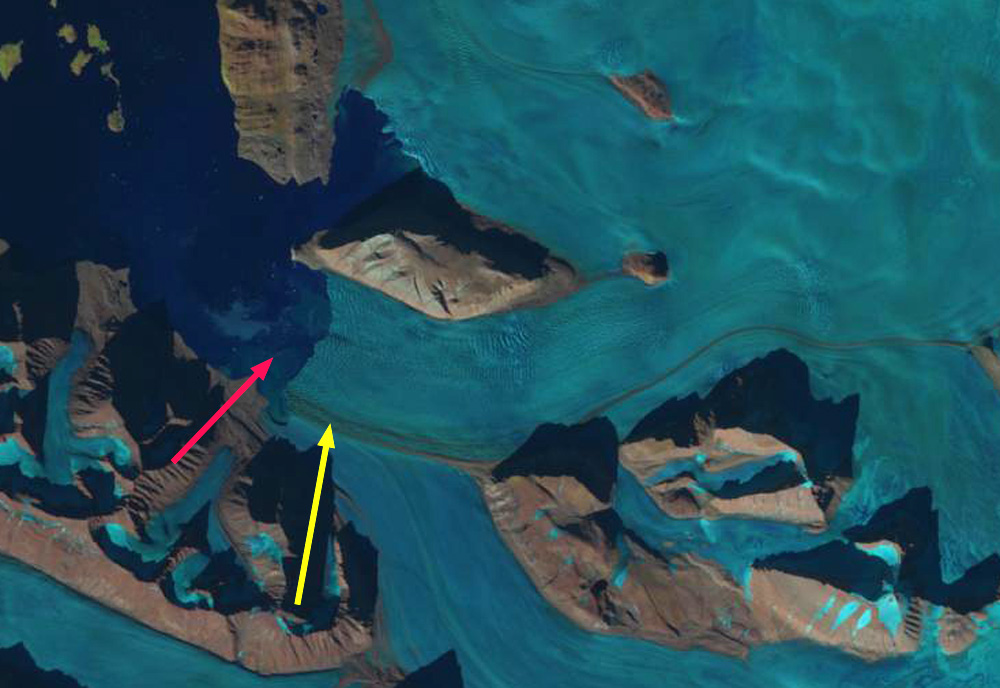
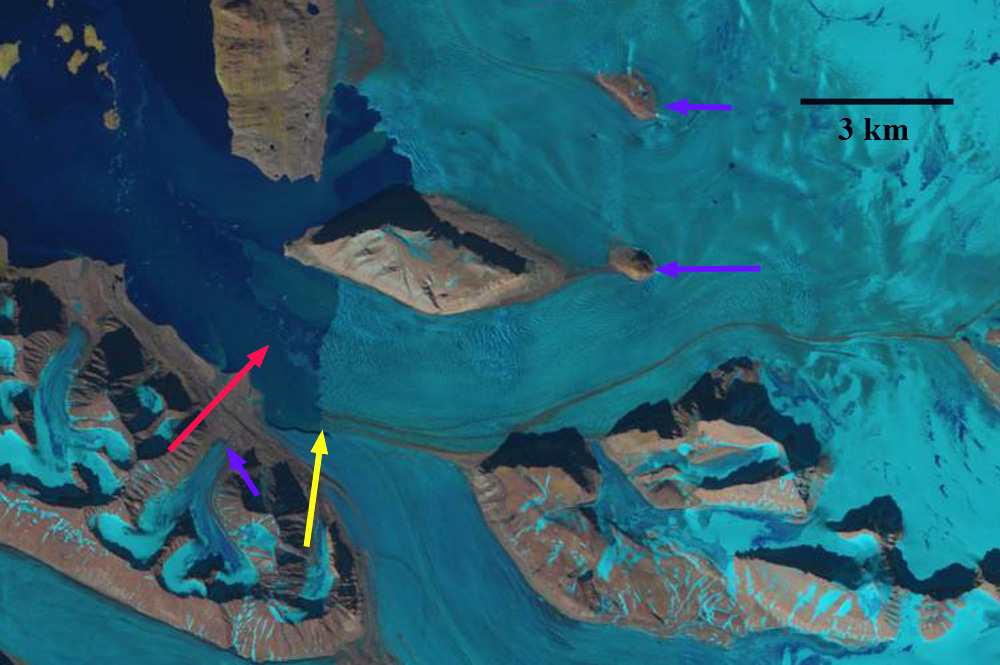
Kronebreen terminus in 2013 (left) and 2015 (right), note the configuration change and separation initiation of Kronebreen and Kongsvegen at yellow arrow.
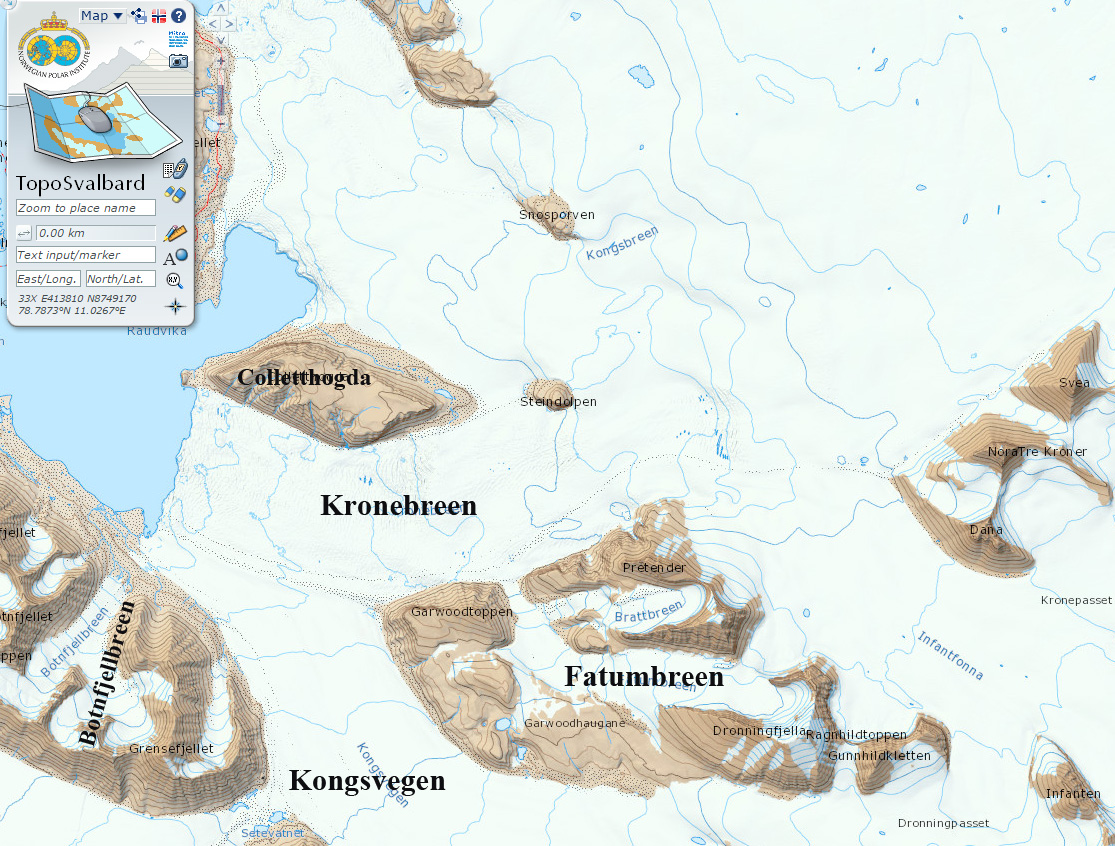
Kronebreen is a large, (450 km2) tidewater glacier on the northwest coast of Svalbard terminating in a shared terminus with Kongsvegen at the head of Kongsfjorden.  Changes in 2015 indicate the shared terminus will not continue.  Luckman et al (2015) observed Kronebreen has a winter speed of 1.5–2 m/day, with summer peaks of 3–4 m/day associated with positive air temperatures and periods of high rainfall.  The terminus of the glacier was relatively stable from 1990 to 2001 with even a slight advance at the end of that period (Trusel et al, 2010).  The fjord lacks a significant sill at its mouth resulting in significant connectivity with water masses of the West Spitsbergen Shelf, including Atlantic Water  Trusel et al, 2010). This aspect during summer can aid in frontal ablation and terminus retreat as noted in Figure 2a from Luckman et al (2015). Shellenberger et al (2014) observed that the period of Kronebreen stability ended in 2007 and that the glacier retreated 850 m and lost 2.1 square kilometers from 2007-2013. Long term they observed that the ablation loss of the terminus reach increased from 0.14 Gt per year from 1960-1990, to 0.20 Gt per year from 1990-2007 and was 0.21 Gt per year in 2013. The University Centre in Svalbard has established a set of cameras for time lapse work at the terminus, which is fortuitous given the changes that have occurred recently. In 2015 returning in the spring University Centre in Svalbard researchers noted the thinning and stretching of the terminus reach: Doug Benn, Penelope How, Heidi Sevestre and Nick Hulton. Penelope How examines the deployment of the cameras in 2015. Here we examine Landsat images to provide a snapshot of the changes that the above researchers have examined in detail.konebreen map
Map of Glacier front from TopoSvalbard.
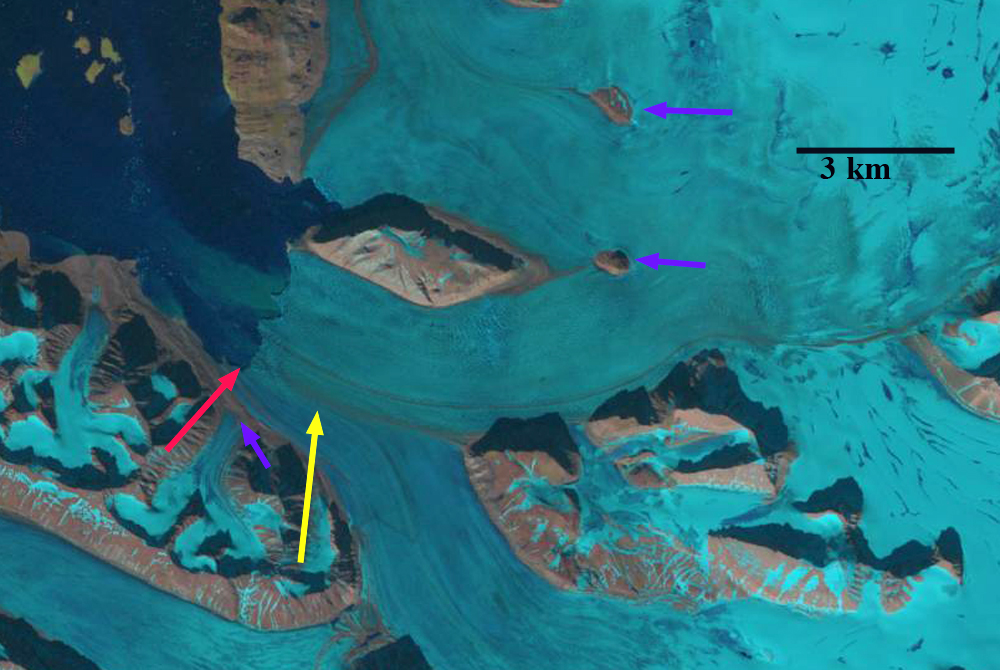
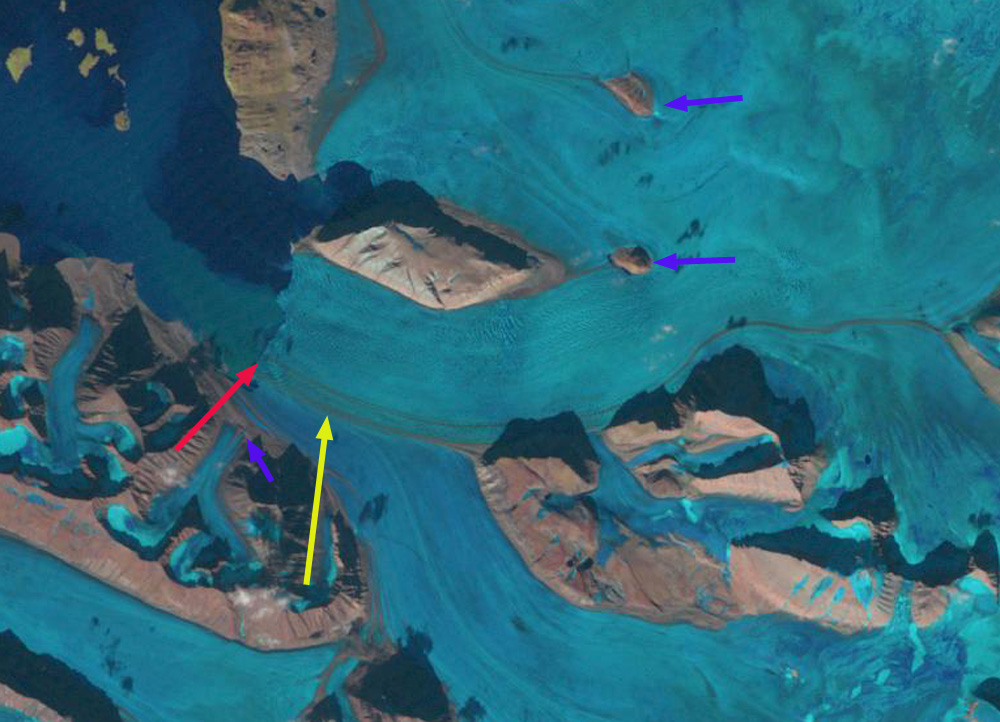
In 1987 the joined front terminated near the western tip of Colletthogda, red arrow. The purple arrows indicate locations for comparison to 2015 of glacier thinning. By 1998 there has been a small retreat, that will be erased by a small advance the following years. I 2011 the front remains a single linear front, the greater level of crevassing of Kronebreen is evident as well as the shallower water on the southern margin of the fjord the Kongsvegen terminus. In 2013 a larger retreat has begun, the calving front is concave with more retreat on the southern, Kongsvegen side of the terminus. In 2015 substantial changes have occurred. The front of Kronebreen has retreated 1200 m on the northern margin since 1998 and 1500 m on the southern lateral moraine, this is 300-500 m since 2013. The most striking element is the right angle turn in the calving front at the lateral moraine with Kongsvegen. This is not a stable configuration. This represents the initiation of the separation of Kronebreen and Kongsvegen. The weakness along which the process is taking place is the lateral moraine. Kronebreen terminates in deeper water and can retreat more rapidly via calving. This retreat has been driven by enhanced ablation both at the surface and by the ocean. The higher velocity of Kronebreen is clear in the video of the glacier from the University Center of Svalbard. The process of separatiion is a trend in Svalbard note Samarinbreen.and Vasilievbreen.kronebreen 1987
1987 Landsat image

kronbreen 1998
1998 Landsat image
kronebreen terminus ge 2014
2011 Image from TopoSvalbard, note the differenence in level of calving between Kronebreen and Kongsvegen.

kronebreen 2013
2013 Landsat image

kronebreen 2015
2015 Landsat image

Colonia Glacier, Chile Retreat and Periodic Lake Outbursts


colonia-compare-1024x495

Comparison of 1987 and 2015 Landsat images indicating retreat from red arrows to yellow arrows of 2.5 km and development of a new lake at the terminus. orange arrow indicates glacier dammed lake that fills and empties periodically. 

Colonia Glacier drains east from the Northern Patagonia Icefield feeding the Baker River, Chile. It is the largest glacier draining east from the NPI.  A comparison of the 1987  and 2015 images indicate a 2.5 km retreat of the glacier front, development of a large lake and areas of thinning well upglacier at the purple arrows. The recent substantial retreat of Colonia Glacier like Glacier Nef just to its north is posing new hazards. The glacier is unusual in the number of lakes that are adjacent to or feed into the adjacent glacier dammed or proglacial lakes. In the image below Lake A=Arco Lake, Lake B=East Terminal Lake, Lake C=Cachet 1 , Lake D= West terminal Lake, Lake E=Colonia Lake and Lake F=Cachet 2. In the case of Baker River the outburst floods are a threat to the planned hydropower developments as documented by Dusaillant and others (2009).  Hidroaysen Project proposed 5 dams on the Baker and Pascua River generating 2750 MW of power that after initial permit approval in 2011Chile’s Committee of Ministers overturned the environmental permits in 2015.

Slide1

Google Earth image from 2005.

The glaciers recent retreat and glacier lake outburst floods have been closely monitored by the Laboratorio de Glaciología in Valdivia, Chile.  Aniya and others (1999) observed that Colonia Glacier began a rapid retreat after 1985 from 1997-2005 that has further accelerated, with a general frontal retreat of 2 km. Rivera and others (2007) observed that the Colonia Glacier had lost 9.1 square kilometers of area from 1979-2001, which is 3% of the total glacier area and thinned 1.1 m per year in the ablation zone.

Image from Laboratorio de Glaciologia, frontal change 1944-2005.

The Laboratorio de Glaciologia’s observed in the spring of 2008 Baker River suddenly tripled in size, in less than 48 hours, roads, bridges, and farms were severely damaged. Lake Cachet 2 had vanished the 5 square kilometer glacial lake had emptied 200 million cubic meters of water in just a matter of hours. This lake drained beneath the glacier after sufficient water had filled the lake to buoy part of the glacier and subglacial conduits had begun to develop. Since Cachet 2 emptied in April 2008, the lake has emptied at least six more times October, December 2008, March and September 2009, March 2010, and early 2013 with peak flows released of 3000 cubic meters per second. Below are images of Cachet 2 full iand empty in 2008 from Laboratorio de Glaciologia’s. Also a  comparison of before and after drainage in Landsat images from Sept. 2012 and Feb. 2013.

cachet 2 empty

Cachhet Lake full looking toward Colonia Dam 2008

Cachet Lake after emptying looking upvalley away from Colonia Glacier 2008. 

colonia outburst 2013

Cachet lake full in Sept. 2012 and emptied in Feb. 2013 Landsat images.

The two lakes at the terminus of the glacier did not exist in 1979, the western most terminus lake drained into the easternmost terminus lake (D) via a sub-glacial tunnel after formation in the late 1980’s until 2005 when a channel was cut right through the glacier terminus. Retreat of the glacier terminus first led to significant lake development in 2001.  This is evident in the image below, there is still glacier ice on both sides of this drainage channel.  By 2015 the lakes have merged into a single large proglacial lake at the terminus that is 3.2 km wide.The development and demise of glacier dammed lakes and the resultant problem of glacier lake outburst floods is not rare today, Imja Glacier, and Tulsequah Glacier are other examples.

Lake expansion at the end of the Colonia Glacier from 2005 to 2013, Google Earth images. 

colonia terminus lake

Yoho Glacier, British Columbia Accumulation Zone Woes

yoho glacier melt

Yoho Glacier in 2005 no accumulation zone in sight.

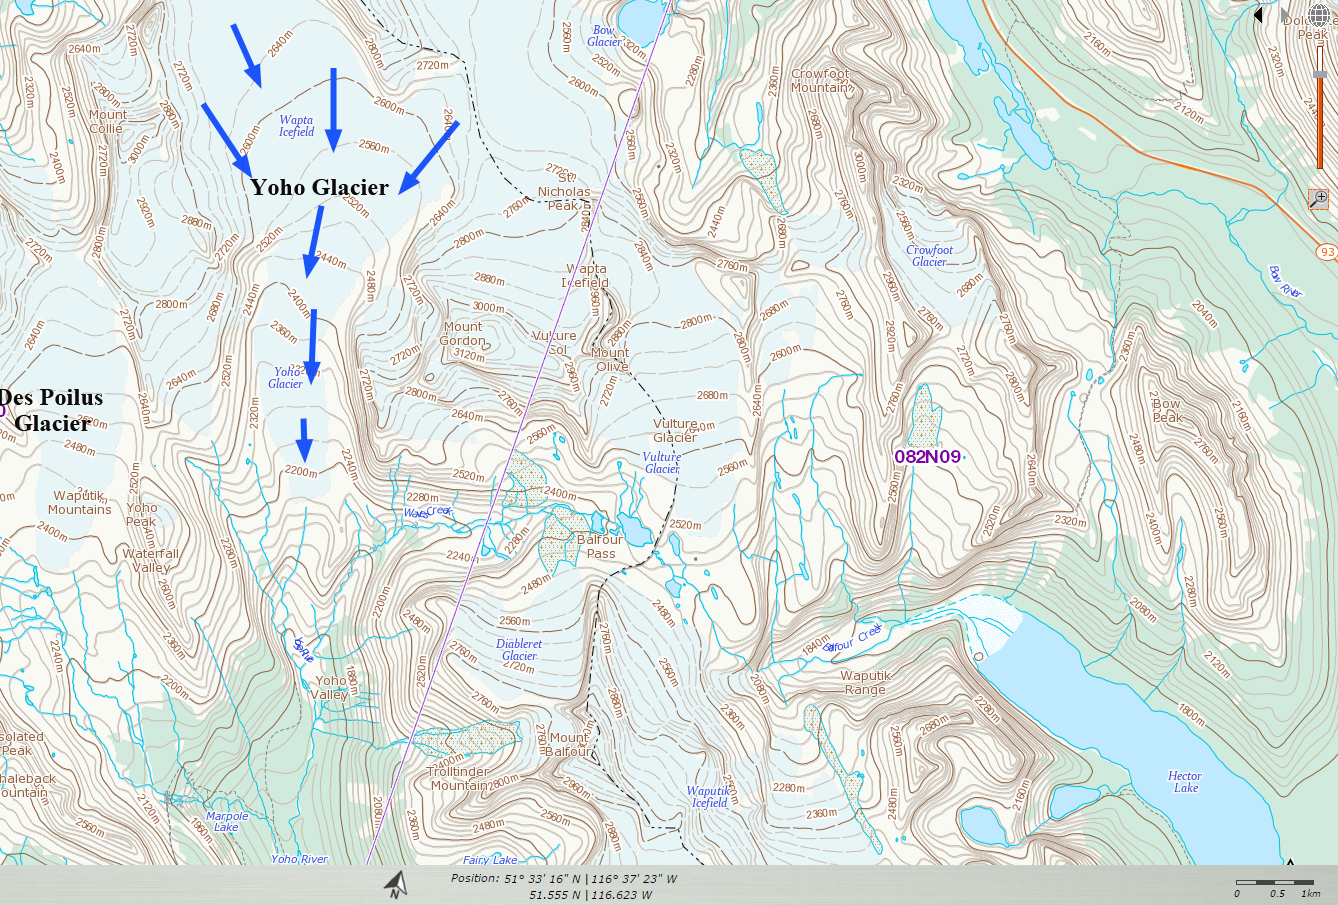
Yoho Glacier is the largest southern outflow draining the south from the Wapta Icefield in the Kootenay region of British Columbia. It flows 6.5 km from the 3125 m to a terminus at 2200 m. The glacier terminus reach is thin, gently sloping  and uncrevassed poised for continued retreat. An exploration of Mount Balfour in 1898 a party led by Professor Jean Habel with the packer Ralph Edwards as a guide were the first to visit and describe Yoho Glacier. There descriptions of the magnificent Takakkaw Falls down river of the glacier quickly led to it becoming a frequent destination of visitors. The glacier was also accessible. Retreat up a steep slope at 2000 m made actually visiting the glacier difficult in the middle of the 20th century.  The glacier has retreated 2.1 km in the last century leaving a vast area of bare terrain, dotted by several small new alpine lakes. Here we examine changes in the glacier from 1986 to 2015 with Landsat imagery.

yoho map final
CanadianTopographic map

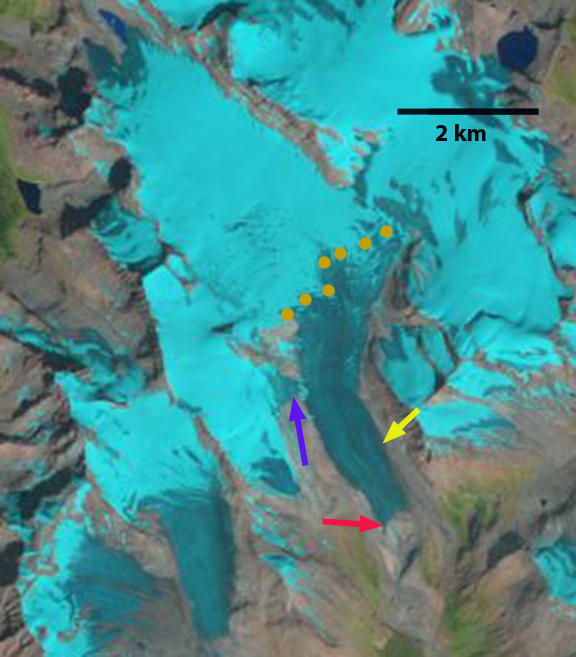
In 1986 the glacier terminated in a broad 500 m wide glacier terminus at 2150 m, red arrow, the glacier tongue remained wide up to the yellow arrow, 800 m. A tributary connected to the glacier at the purple arrow, and the glacier snowline, orange dots was at 2550 m. In 1998 the terminus had not retreated significantly, but had narrowed noticably. The tributary at the purple arrow was no longer connected and the snowline was at 2750 m, leaving little of the glacier snowcovered, which equates to a significant mass loss. In 2013 the snowline again was high at 2700 m. In 2015 the glacier terminus has retreated 300 m since 1986 and is only 250 m wide. The width at the yellow arrow is 450 m. The width reduction is an indicator of how much the glacier has thinned. The snowline is at 2800 m in this mid-August image, clinging only to the high slopes of Mount Collie, and would still rise for several more weeks in the summer. The nearby Peyto Glacier has an annual mass balance record indicating a thinning of 25 m during this period (Kerhl et al, 2014).  A glacier typically needs more than 50% of its area to be in the accumulation zone at the end of the summer to be in equilibrium.  In recent years when the snowline exceeds 2700 m less than 10% of the Yoho Glacier is in the accumulation zone. If the snowline is as high as it has been recently on Yoho Glacier, that indicates the lack of a significant accumulation zone and it cannot survive even current climate.  However, in both cases the Peyto and Yoho Glacier are rapidly losing volume, but remain substantial in size and are not on the verge of disappearing in the next few decades. The retreat is similar to that of Des Poilus Glacier shown in the lower left of the Landsat images here.

yoho glacier 1986
1986 Landsat Image

yoho glacier 1998
1998 Landsat Image

yoho glacier 2013
2013 Landsat image
yoho glacier 2015
2015 Landsat image

Fingers Glacier, Alaska loses a finger to melting

finger compare
Landsat comparison of terminus area of Fingers Glacier 1986 and 2015

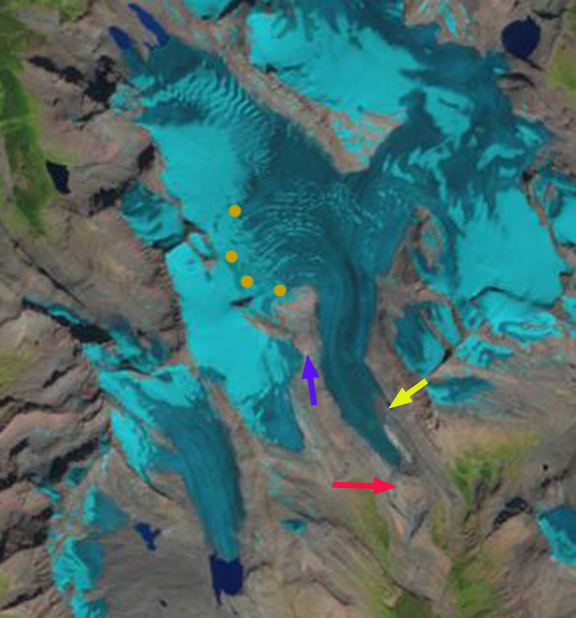
Fingers Glacier flows from the southern end of the Fairweather Range to the coastal plain, where is expands into a segmented piedmont lobe. The southernmost finger is heavily debris covered. In the Mount Fairweather B-4 quadrangle USGS map based on 1951 aerial photographs the glacier has four prominent fingers each eroding its own basin.  Here we examine Landsat imagery to illustrate the changes in this glacier from 1951 to 2015.  From 1950-1980  glacier’s just to the north In Lituya Bay were advancing. The La Perouse Glacier its immediate neighbor to the north was stable. Palma Glacier directly to the southeast has retreated throughout the 1950-2015 period.  Larsen et al (2015) identify that from 1994-2013 this region of Alaska is a significant source of glacier volume loss and hence contributor to sea level rise.  The loss of 75 gigatons per year from glaciers in southern Alaska was determined in this study to be largely from surface melt not from calving losses.  The mass balance of both Taku and Lemon Creek Glacier of the Juneau Icefield have had a notable decline in mean mass balance from 1986-2015 versus the 1951-28985 period (Pelto et al, 2013).  The nearby Brady Glacier also experience a higher snowline (Pelto et al, 2013b) which led to volume losses quantified by Larsen et al (2015).
fingers map

USGS map based on 1951 images

By 1986 the glacier still had four fingers with retreat from the 1951 position yellow arrow to the 1986 position red arrows.  Retreat was 900 m for the first finger, 400 m for the second finger, 300 meters for the third and 400 meters for the fourth southernmost finger.   A new lake had developed at the second finger, well lake expansion occurred at the first and third finger.  By 1999 a lake is beginning to form at the fourth finger.  In 2015 the first finger has retreated 600 meters in 30 years.  The second finger has disappeared after a 700 m retreat from 1986-2015..  The third finger has lost half of its length to the expanding lake, a retreat of 600 m in 30 years.  The fourth finger which is the most debris covered, leading to slower thinning, has retreated 600 meters since 1986, with a lake at the terminus that is continuing to expand.
fingers 1986

1986 Landsat Image

fingers 1999

1999 Landsat Image

fingers 2015

2015 Landsat Image
fingers glacier

Google Earth Image indicating flowlines.

Acodado Glacier, Chile Rapid Retreat 1987-2015

acodado compare
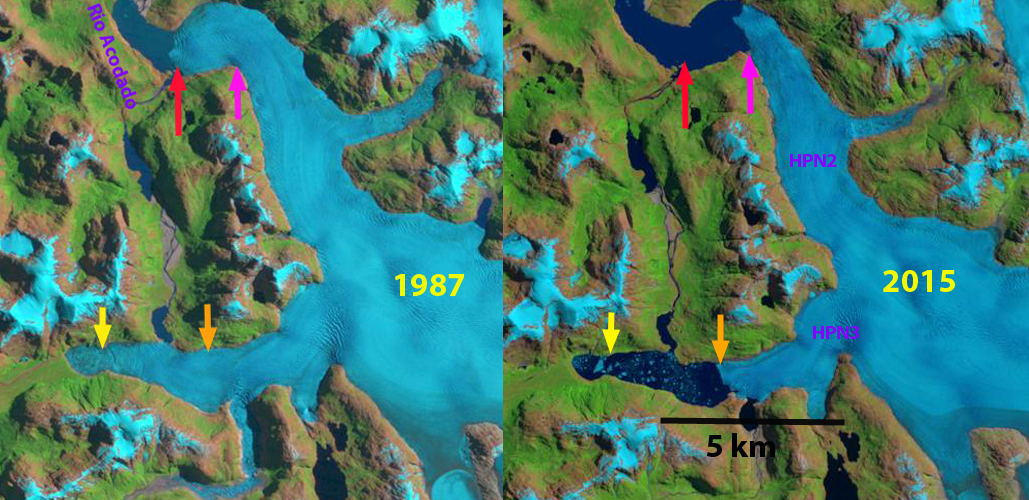
Landsat image comparison 1987 and 2015
Loriaux and Casassa (2013) examined the expansion of lakes of the Northern Patagonia Ice Cap. From 1945 to 2011 lake area expanded 65%, 66 square kilometers. Rio Acodado has two large glacier termini at its headwater, HPN2 and HPN3. that are fed by the same accumulation zone and comprise the Acodado Glacier. The glacier separates from Steffen Glacier at 900 m. The lakes at the terminus of each were first observed in 1976 and had an area of 2.4 and 5.0 square kilometers in 2011. (Loriaux and Casassa, 2013). Willis et al (2012) noted a 3.5 m loss per year from 2001-2011 in the ablation zone of the Acodado Glacier, they also note annual velocity is less than 300 m/year in the ablation zone. Davies and Glasser (2012) noted that the Acodado Glacier termini, HPN2 and HPN3, had retreated at a steadily increasing rate from 1870 to 2011. Here we examine the substantial changes in Acodado Glacier from 1987 to 2015 using Landsat imagery. acodado ge
Digital Globe image of Acodado Glacier and the termini HPN2 and HPN3.

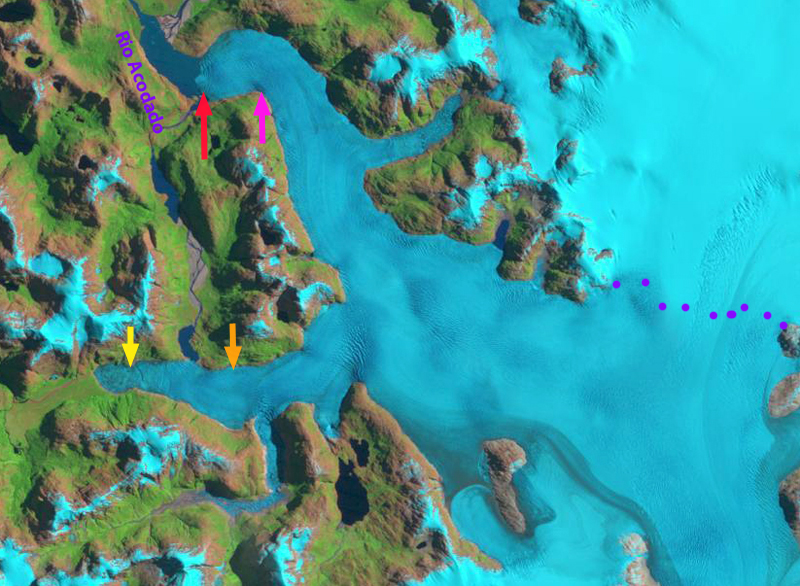
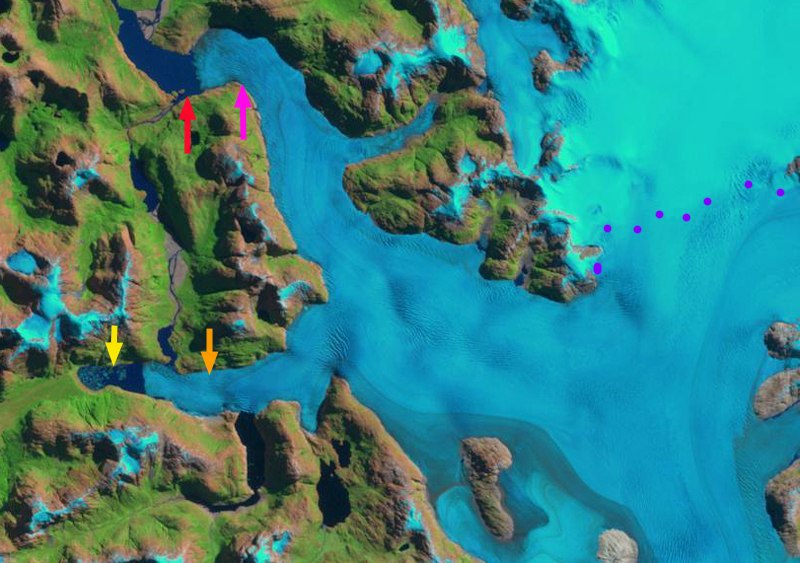
In HPN2 terminates at the red arrow in 1987 and HPN3 at the yellow arrow, the snowline is at the purple dots at 1000 m. By 2000 the glacier has retreated from the red and yellow arrow by 400 m and 900 m respectively, and the snowline is at 1100 m.   In 2014 there are many large icebergs in the lake at the terminus of HPN3, these are from recent calving retreat.  This is not an area where the lakes develop even seasonal lake ice cover.  The  snowline is again at 1100 m.  In 2015 it is apparent that HPN2 has retreated 2100 m from the red arrow to the pink arrow.  HPN3 has retreated 3200 m from the yellow to the orange arrow.  The snowline is again at 1100 m.  The retreat accelerated after 2000 for both glaciers. This high of a snowline indicates warm temperatures generating high ablation rates, which will lead to more retreat. HPN3 has a sharp rise in elevation 2.5 km above the terminus, before it joins the main Acodado Glacier, it should retreat rapidly toward this point and then calving will end and retreat will slow.  The retreat here is synonymous with the pattern observed at other Northern Patagonia Ice Cap outlet glaciers each with rapid calving retreats in expanding proglacial lakes; Fraenkel Glacier, Gualas and Reichert Glacierand Steffen Glacier.
acodado 1987
Landsat image from 1987

acodado 2000
Landsat image from 2000

acodado 2014
Landsat image from 2014

acodado 2015
Landsat image from 2015

Hess Mountain Glacier Retreat, Yukon

In the Selwyn Mountain Range, Yukon at the headwaters of the Hess River is the Hess Mountains and Keele Peake the highest peak in the region. A series of glacier radiate from this region. The Yukon Territory is host to numerous small alpine glaciers that have been rapidly losing area and volume.  From 1958-2007 glaciers lost 22% of their volume in the Yukon (Barrand and Sharp, 2010).  Due to the high snowlines David Atkinson, at University of Victoria notes the rate of retreat has increased since then, and is using weather stations to identify the specific conditions driving the ice loss. Semmes and Ramage (2013 ) observed in the Yukon River Basin from 1988 to 2010 a significant lengthening of melt duration t with earlier melt onset in high elevations  and significant later end of melt refreeze in theintermediate elevations ( 600 to 1600 m). Here we examine in particular a glacier draining southeast from the Hess Mountains that feeds the Hess River using Landsat imagery from 1986 to 2015.
hess map

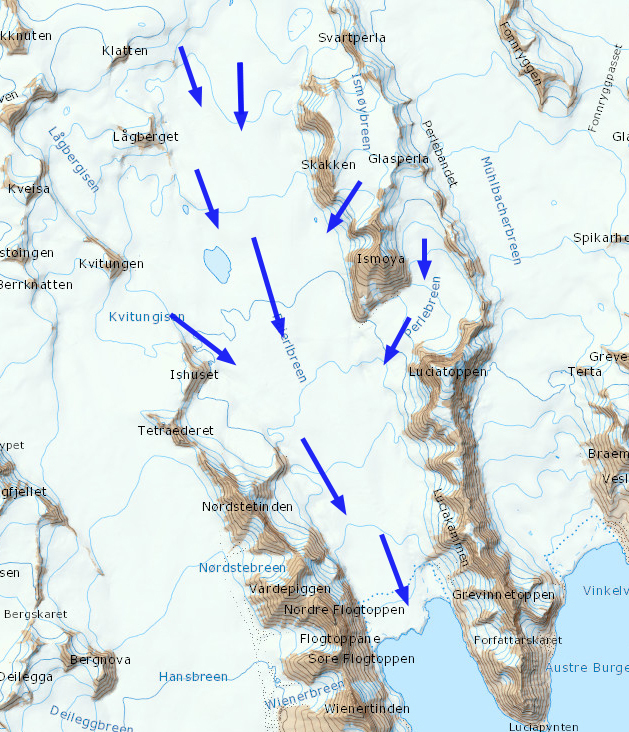
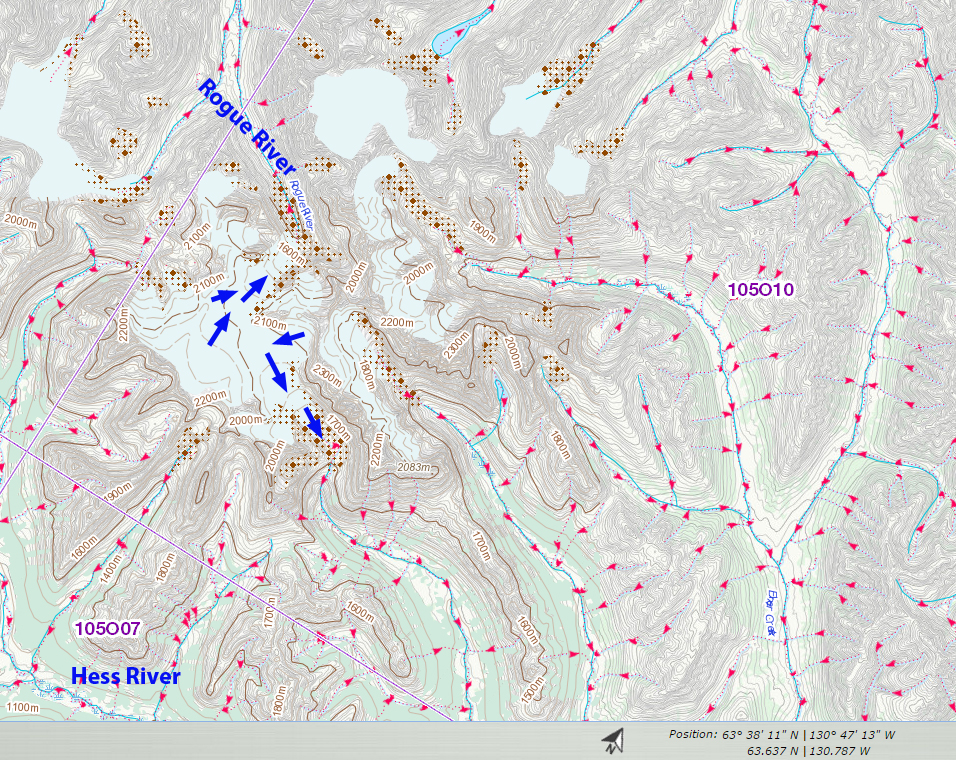
In this Canadian Toporama image the glacier of primary interest has flow indicated by the blue arrows.

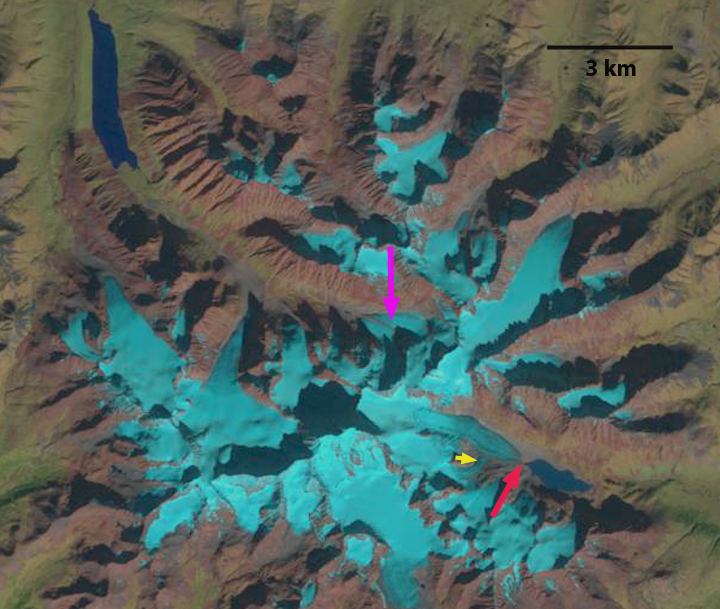
In 1986 the glacier extended to within a 100 meters of an alpine lake, with the terminus indicated by the red arrow.  The glacier was joined near the terminus by a tributary at the yellow arrow.  At the pink arrow a separate glacier terminus is formed by the merging of two glaciers.  In 1992 the main glacier tongue has retreated further from the lake.  By 2015 the tributary no longer is connected to the main glacier and terminates 600 meters above the valley.  The main glacier terminus has retreated 800 meters since 1986, and is now just over 3 km long. The terminus area at the glacier flowing north at the pink arrow, is no longer formed by the merging of two glacier termini, as two distinct termini exist.hess 1986

1986 Landsat Image

hess 1992

1992 Landsat Image

hess 2015

2015 Landsat Image


Rogue River Icefield Rapid Retreat, Selwyn Mountains, Yukon

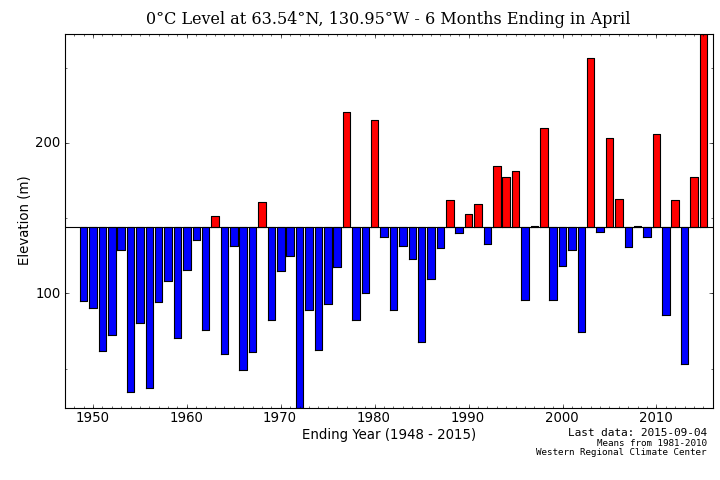
The Selwyn Mountains, Yukon Territory are host to numerous small alpine glaciers that have been rapidly losing area and volume. David Atkinson, atmospheric scientist at University of Victoria has been examining the weather conditions leading to the extensive melting and higher snowlines. From 1958-2007 glaciers lost 22% of their volume in the Yukon (Barrand and Sharp, 2010).  Due to the high snowlines Atkinson notes the rate of retreat has increased since then.  The freezing level as determined by the North American Freezing Level Tracker illustrates this point with 2015 being the highest winter freezing level. Here we examine response of the Rogue River Icefield using Landsat imagery from 1986-2015.  The icefield is at the headwaters of the Rogue River and also drains into the Hess River.

rogue river

Canada Toporama map of the region.

selwyn

Selwyn Mountain November-April freezing levels.

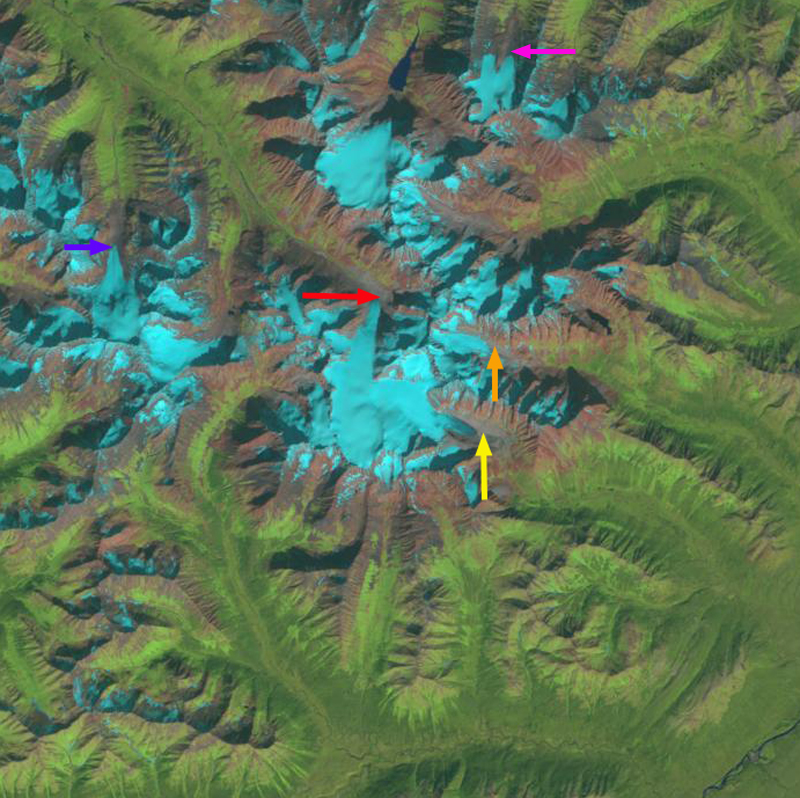
In 1986 the primary icefield glacier is shown with blue arrows above indicating flow direction towards both the north and southeast terminus.  The north terminus reached the valley bottom at the red arrow and the southeast terminus extended to the yellow arrow in 1986. All arrows are in fixed locations in every image. The purple and orange arrows indicate the terminus of smaller valley glaciers in 1986.  The pink arrow indicates a valley glacier that is split into two terminus lobes by a ridge. By 1992 the only significant change is the southeast terminus of the primary glacier at the yellow arrow. In 2013 the snowline is exceptionally high at 2200 meters, with glacier elevations only reaching 2300 m.  Retreat is extensive at each terminus.  In 2015 the satellite image is from early July and the snowline has not yet risen significantly.  Terminus retreat at the yellow arrow is 900 meters, at the red arrow 400 m, at the purple arrow 600 m, at the pink arrow 400 m and at the orange arrow 500 m.  Given the length of these glaciers at 1-3 km this is a substantial loss of every glacier.  Further south in the Yukon high snowlines are also a problem for Snowshoe Peak Glacier.

rogue river 1986

1986 Landsat image

rogue river 1992

1992 Landsat image

rogue river 2013

2013 Landsat Image

rogue river 2015

2015 Landsat image


Mount Caubvick Glacier Retreat, Labrador

Mount Caubvick is in the Torngat Mountains of Labrador 35 km inland of the Atlantic Ocean and south of Nachvak Fjord. Way et al (2014) identified 105 active glaciers that had flow indicators in these mountains.  The mean elevation of these glaciers is quite low at 776 meters above sea level. The radiational shading and higher accumulation from protected cirque locations and proximity to the ocean are key to the low elevations. The elevation of the glaciers around Mount Caubvick is higher. Here we use Landsat images from 1992, 1997 and 2015 to identify response to climate change. The annual layers preserved in the glacier ice are evident in glacier B,C and E.

caubvick

2013 Google Earth image of Mount Caubvick, Torngat Mountains, Labrador.

In 1992 Glacier A terminates at the red arrow in an expanding lake. Glacier C terminates at the yellow arrow in a just forming glacial lake.  Glacier E terminates at the purple arrow in a glacial lake that is similar in length to the glacier. In 2015 each lake has notably expanded.  The arrows are in the same locations in the 2015 image.  At the red arrow, Glacier A has retreated 200 m, which is 20% of its entire length. Glacier C, yellow arrow has retreated 250 m, 40% of the total glacier length.  At the purple arrow, Glacier D has retreated 225 m, which is 35% of its total length.  The retreat of Glacier B and E is less clear as the terminus locations are hard to determine in 1992.  What is most evident is the reduction in ice area at the higher elevations of the glaciers noted by the green arrows. In 1997 there is little expansion of the three lakes since 1992, indicating most of the retreat has been in the last 18 years.  Glacier B provides a good snapshot of annual layers.  The black arrow indicates the lack of an accumulation zone, without which a glacier cannot survive (Pelto, 2010). The red arrow indicates a band of annual layers that marks what had been the typical snowline Indeed none of the glaciers in 2015 in either the 2013 Google Earth image or 2015 Landsat have significant retained accumulation, indicating none can survive current climate. Way et al (2014) figure 4 indicates an example of the same snowline setup on a different glacier near Ryans Bay. .  it is evident that in the last decade firn and snow are not retained consistently. Sharp et al (2014) indicate in Figure 52 the mass loss of Canadian Arctic glaciers in general, that parallels that of Labrador.

caubvick compare

1992-2015 Landsat comparison of Mount Caubvick glaciers

torngat 2014 annual layers

Glacier B with numerous annual layers with the snowline indicates by red arrow and lack of accumulation black arrow.

torngat cirque layers


Glacier C annual layers.