Gepatsch Glacier (Gletscher), Austria the runoff from this glacier drains into the Gespatsch Reservoir, which has a storage volume of 140 million cubic metres of water and an annual electricity production of 620 million kwh. The glacier is Austria’s second largest with an area of over 16 square kilometers. The adjacent Weißsee-Kaunertal Gletscher is host to Kaunertal Gletscher ski area and in the summer a key destination of the Gletscherpark. The ski area map below indicates several lifts on the Weißsee-Kaunertal Gletscher. This glaciers retreat will reduce summer water supply to the reservoir, as it provides 50 million cubic meters of runoff each summer. With climate change that runoff will no longer peak in the warmest-driest part of the summer. The retreat is similar to that of Obersulzbachkees, Austria the third largest in Austria.
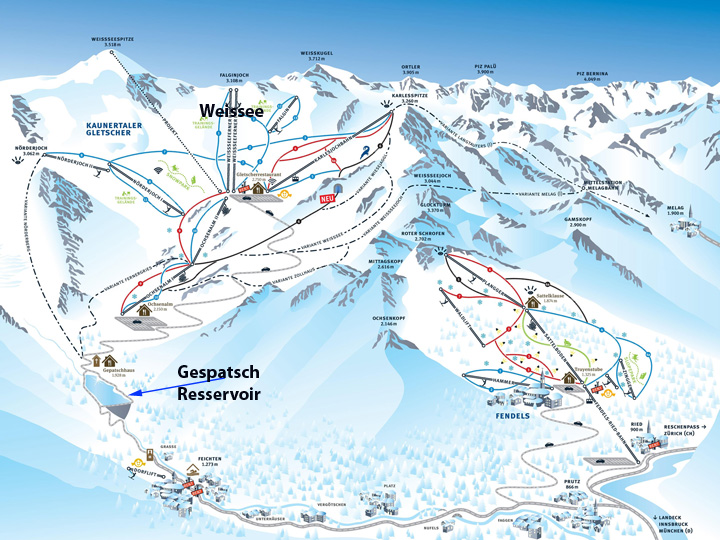
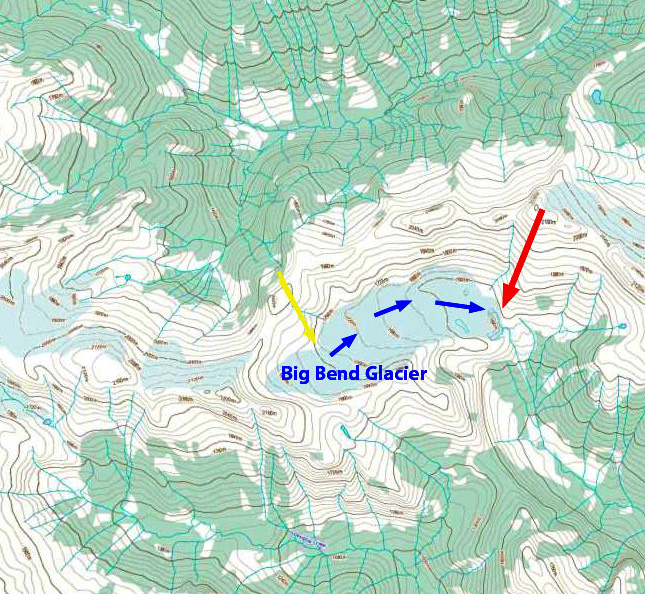
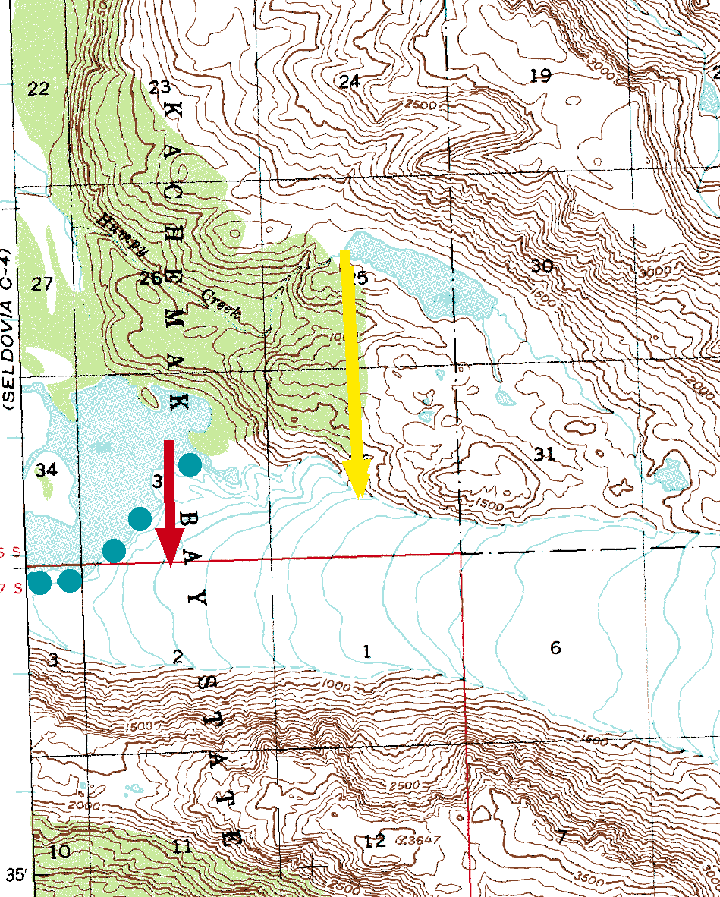
Ski Area Map
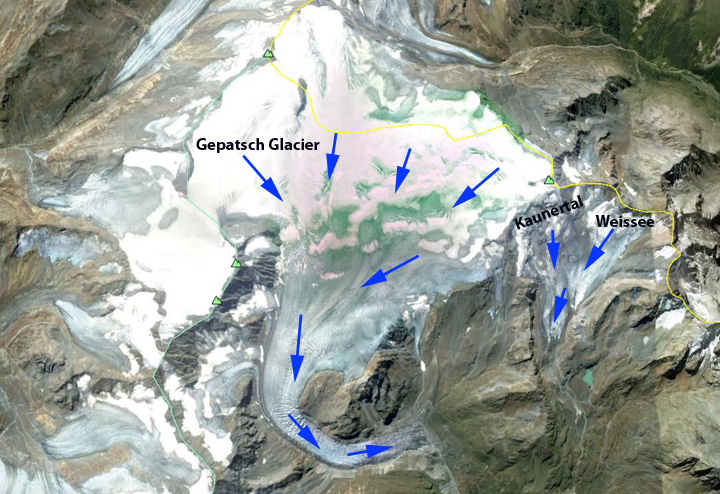
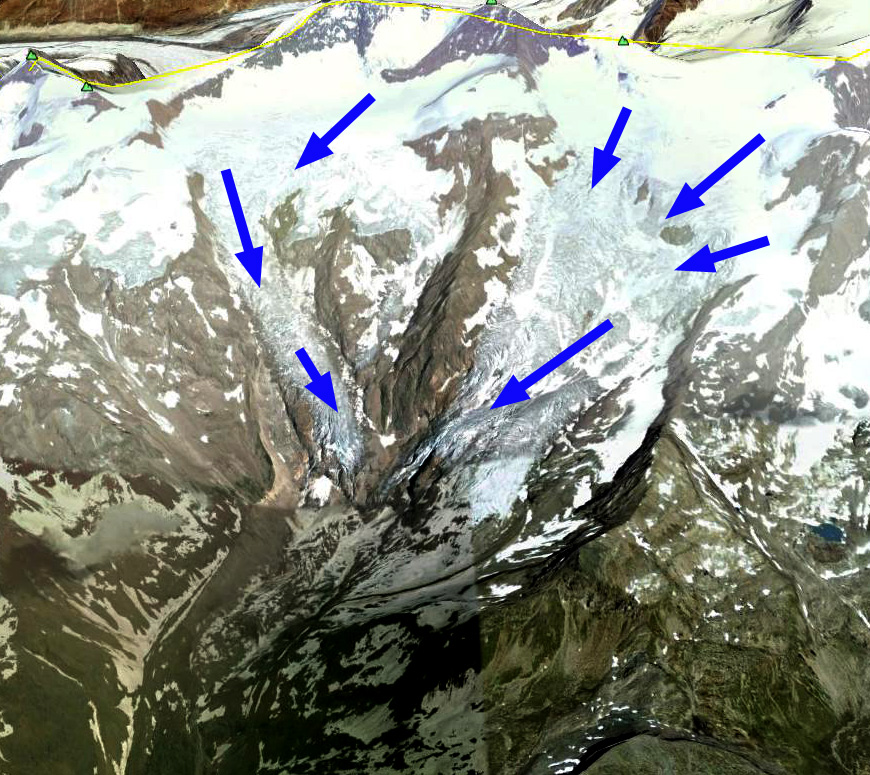
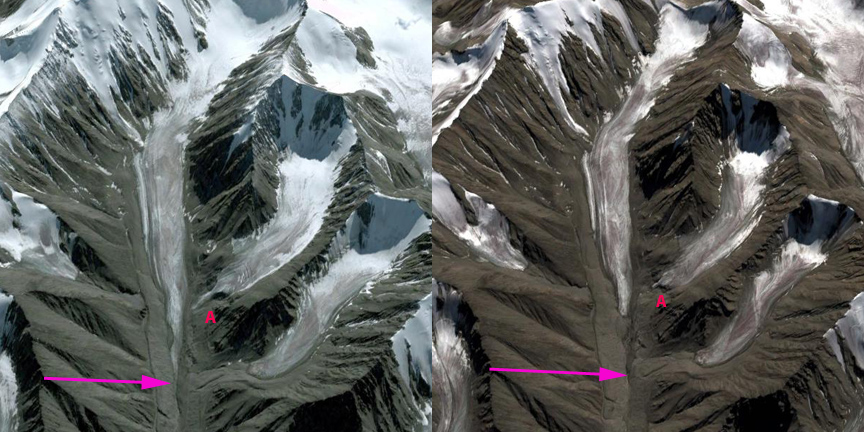
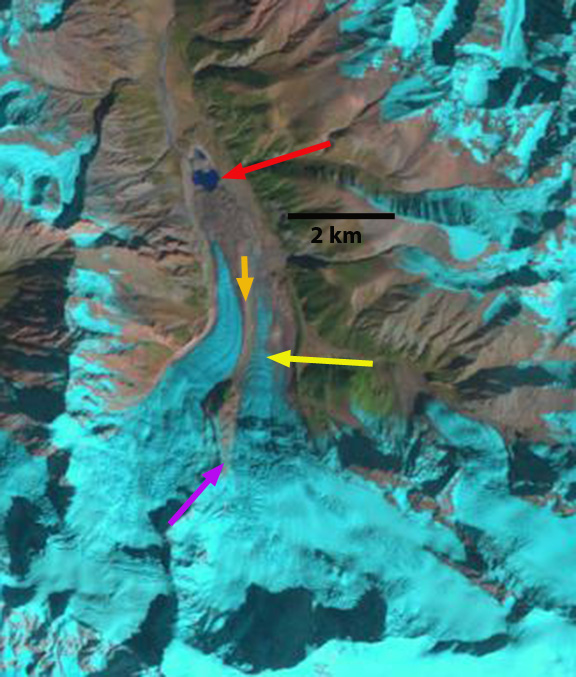
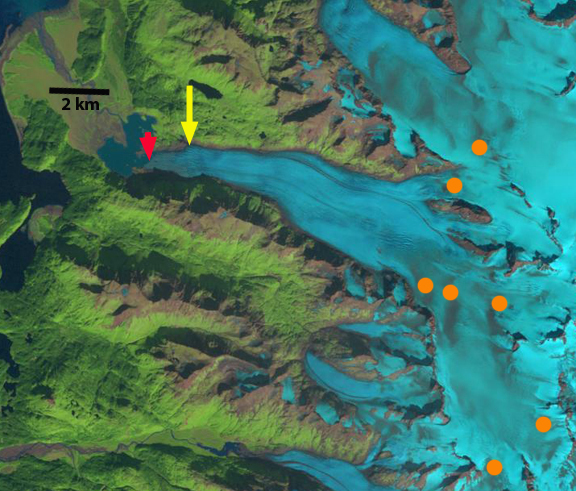
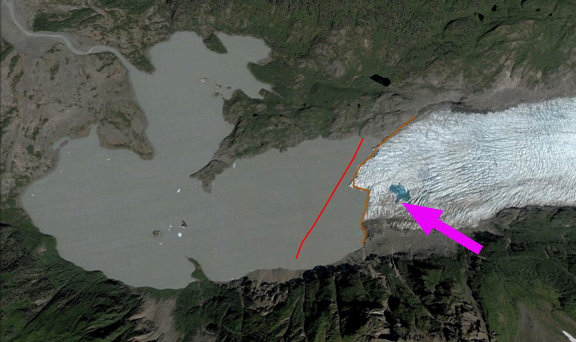
2007 Google Earth image
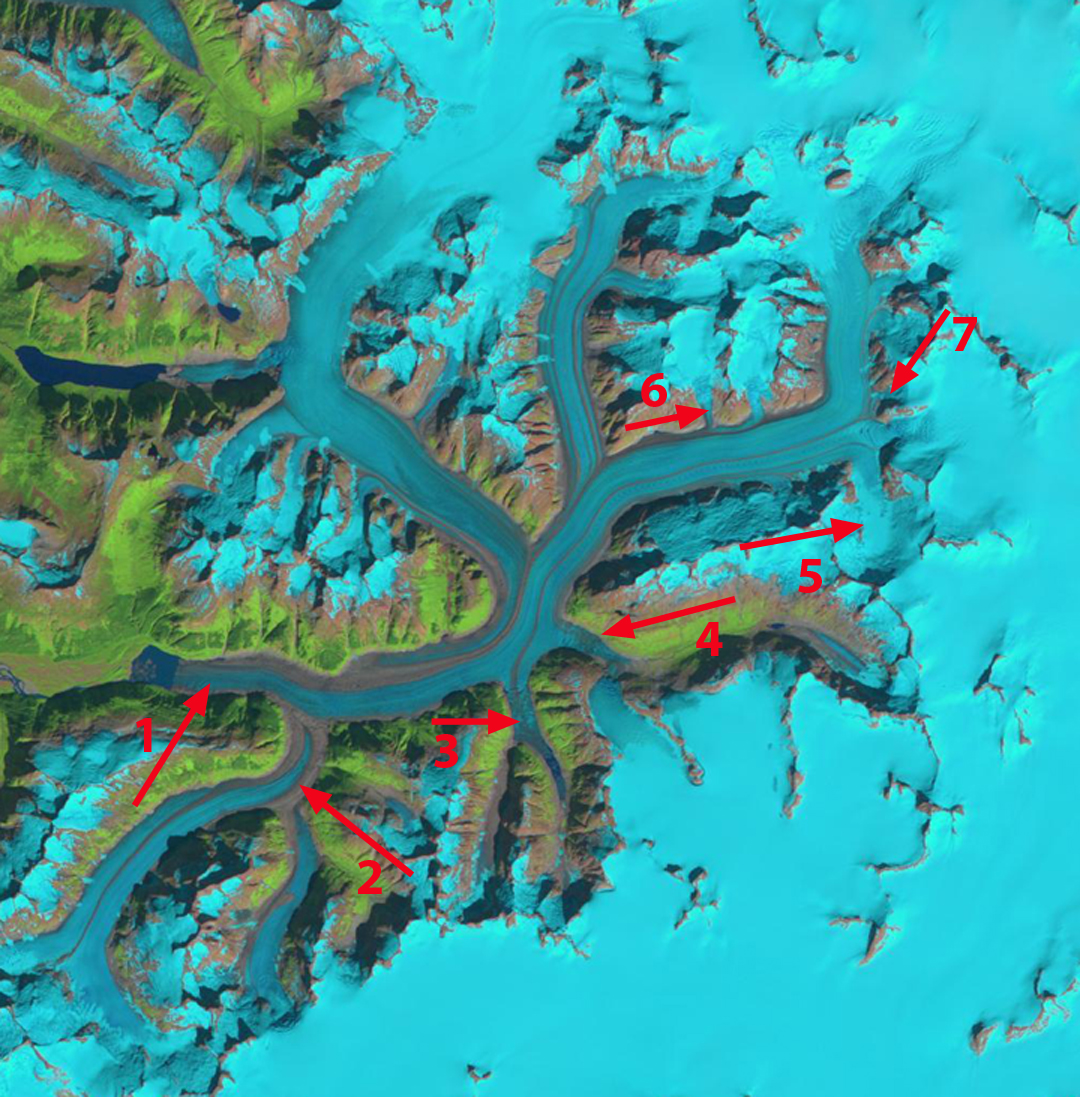
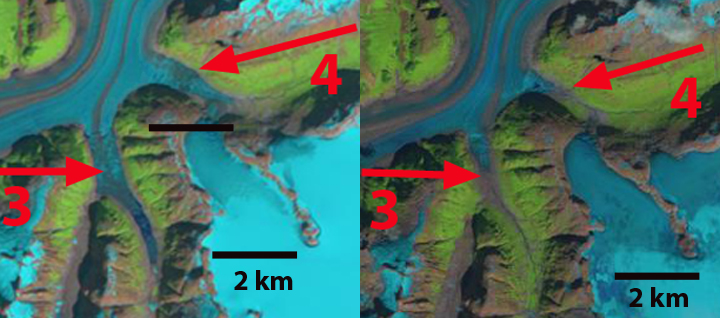
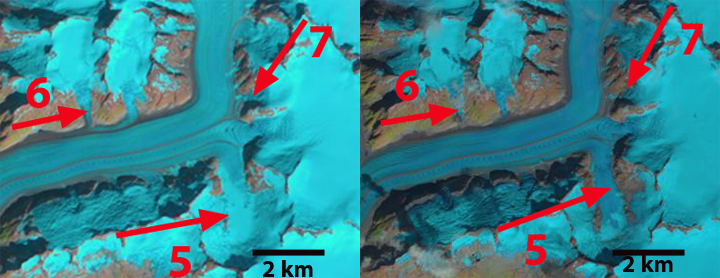
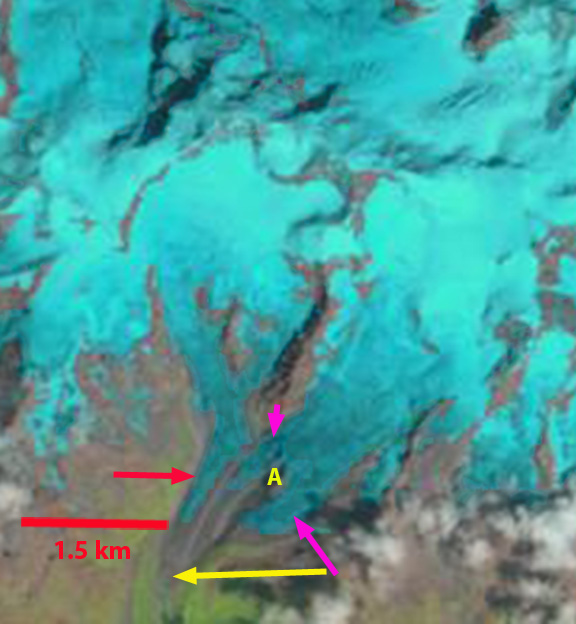
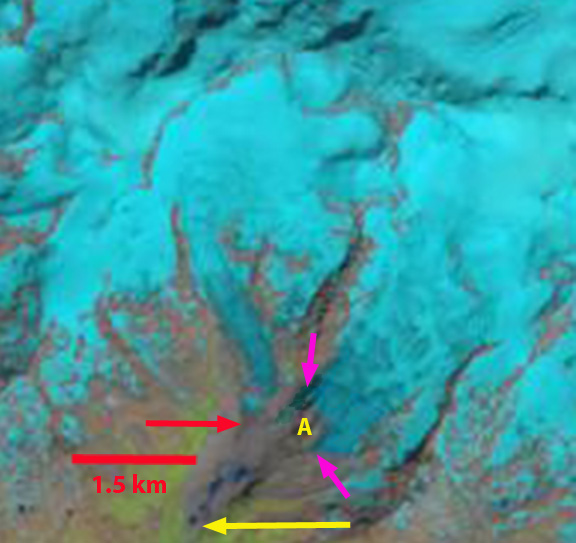
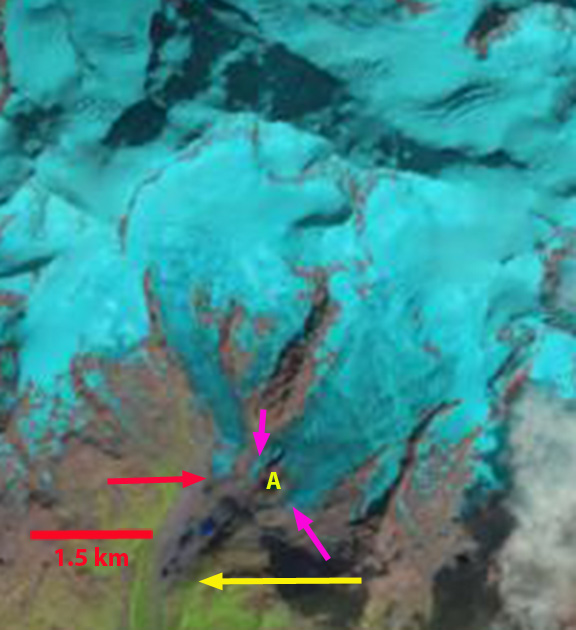
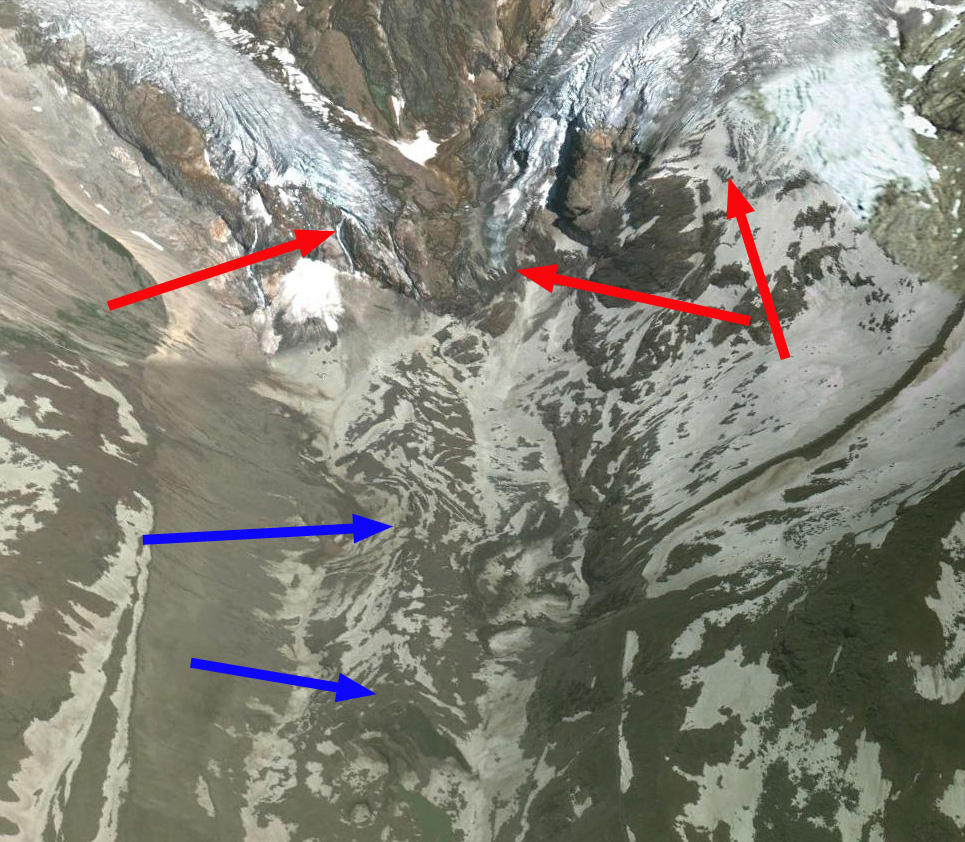
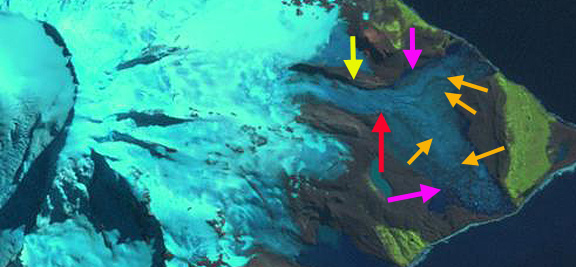
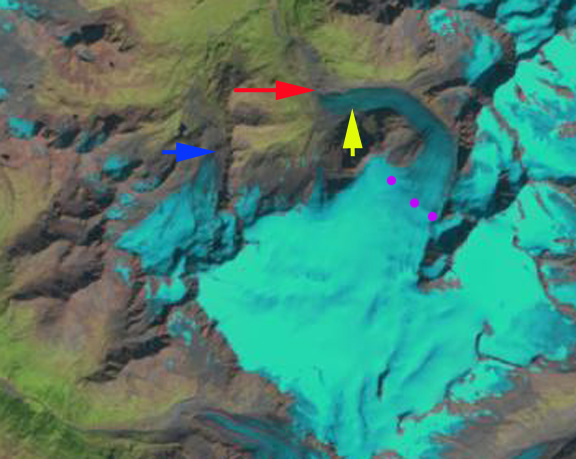
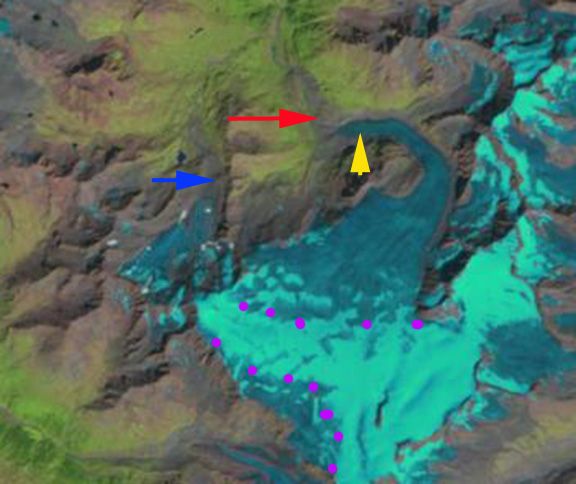
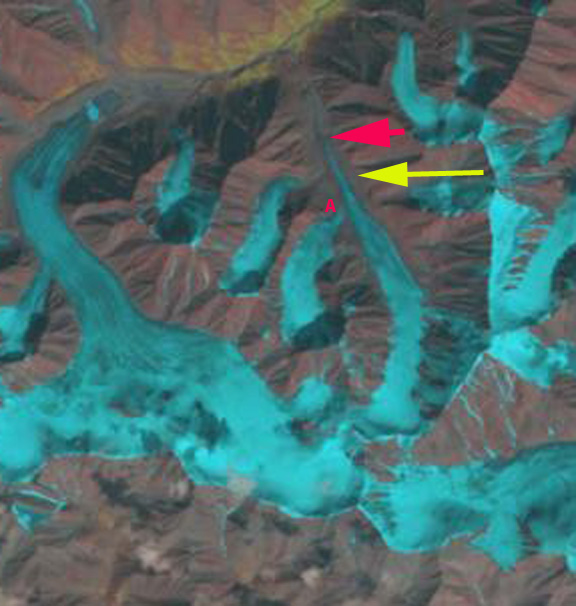
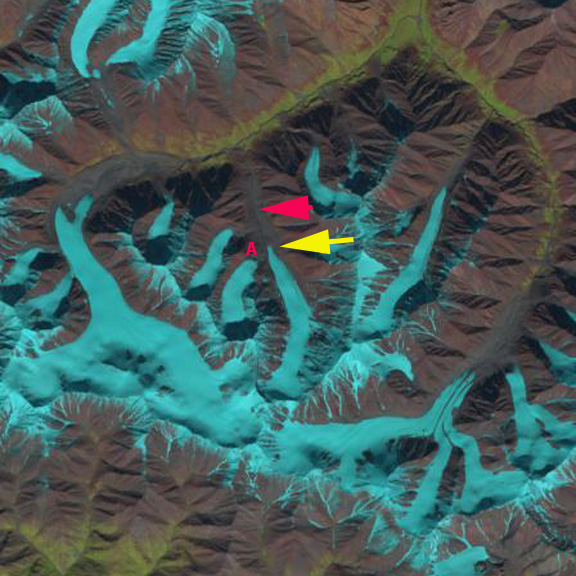
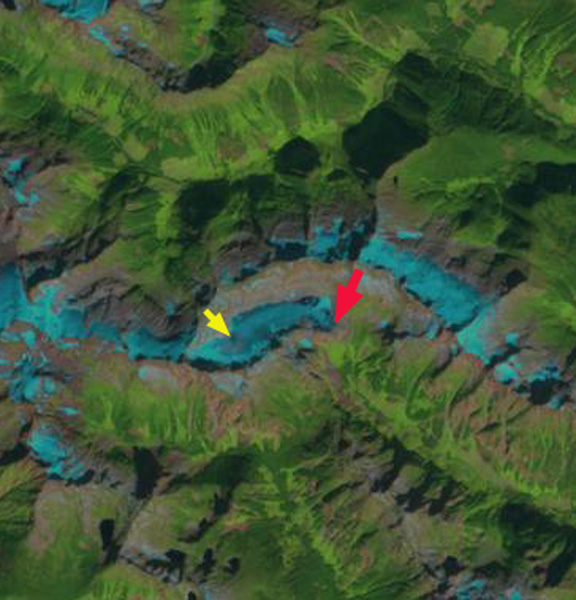
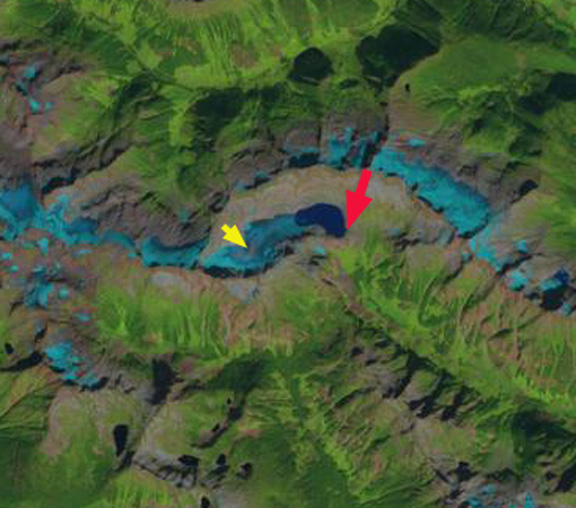
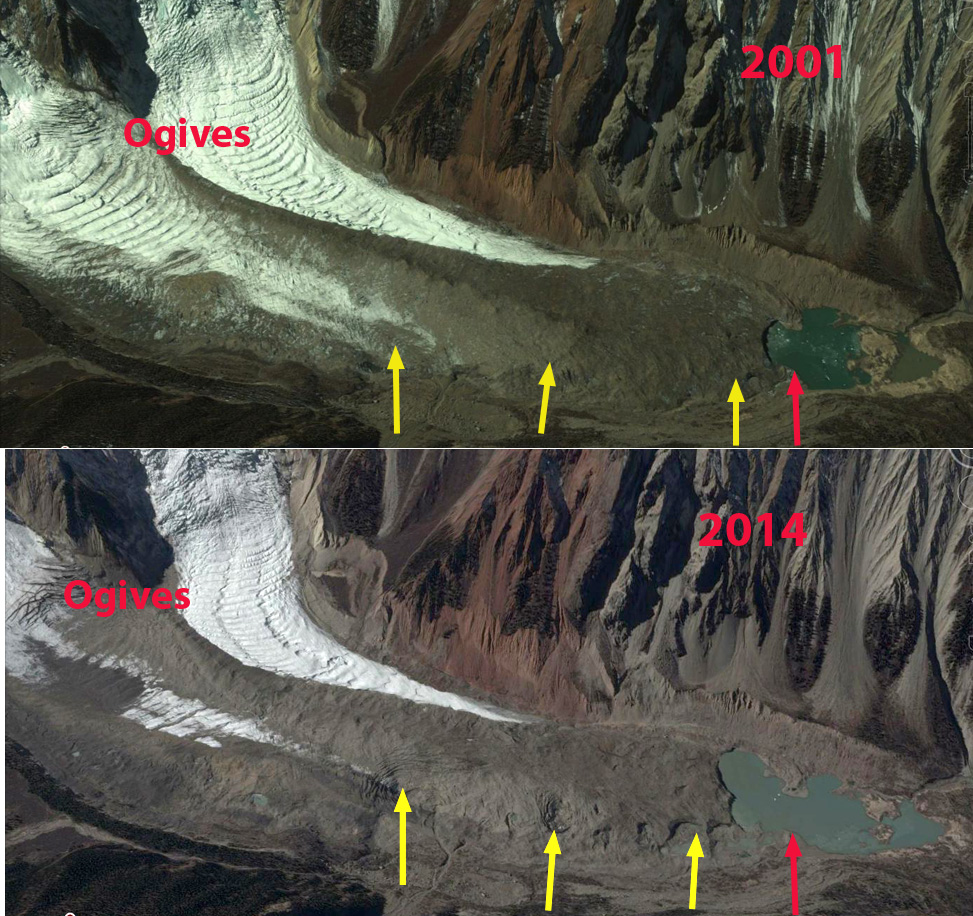
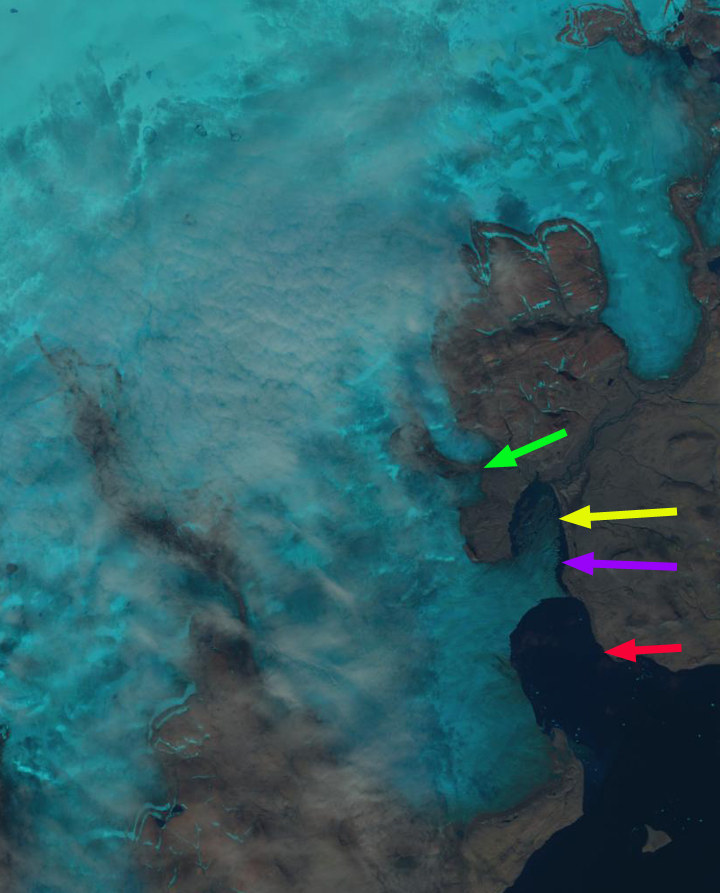
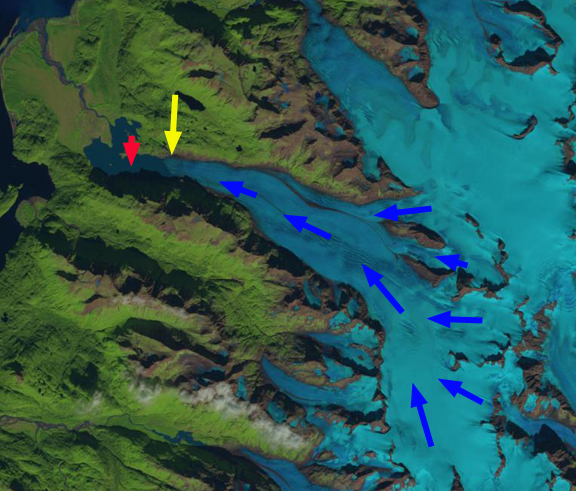
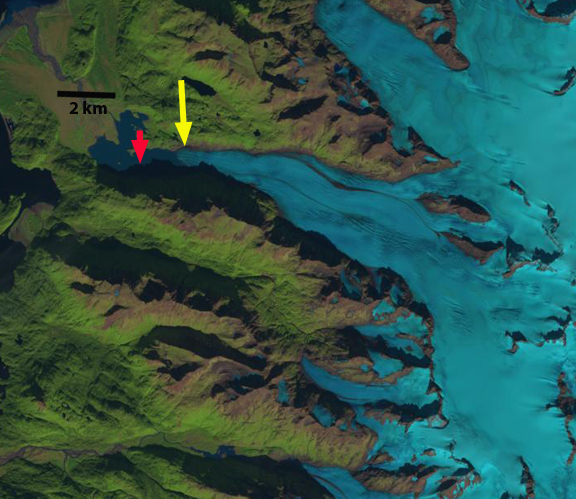
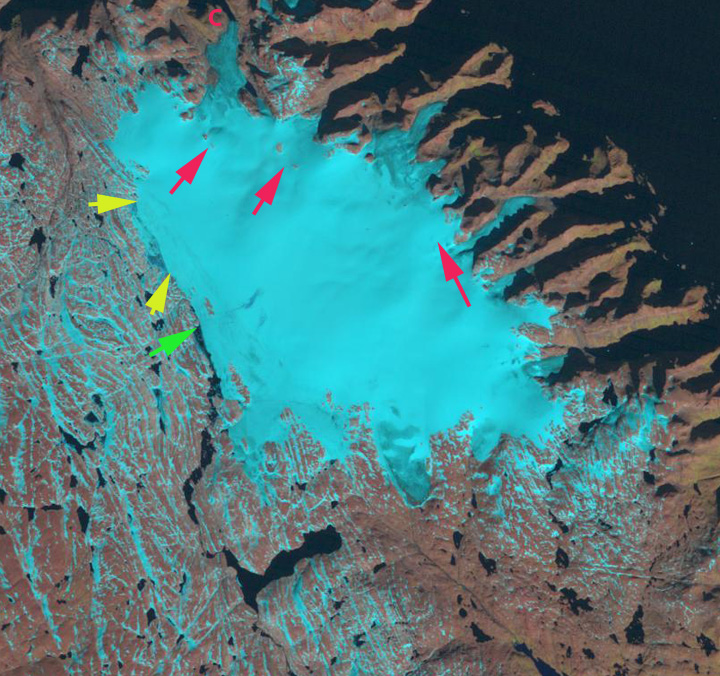
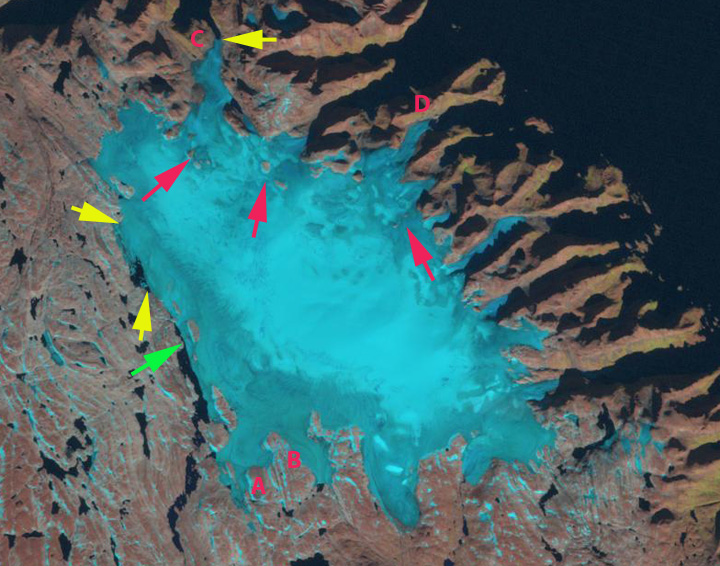
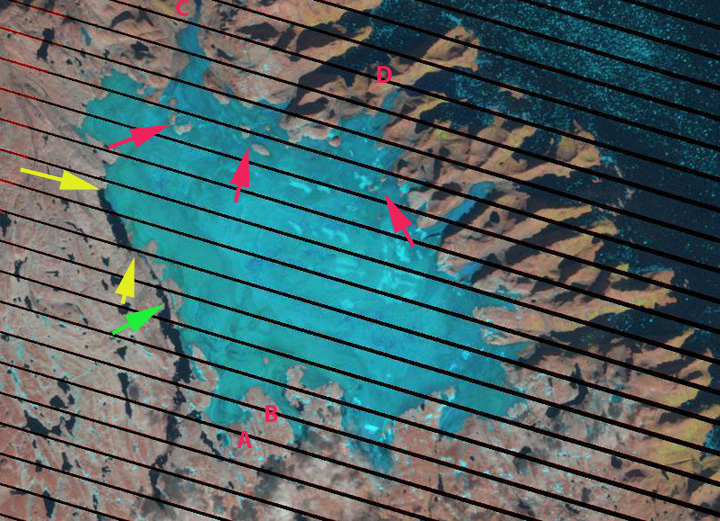
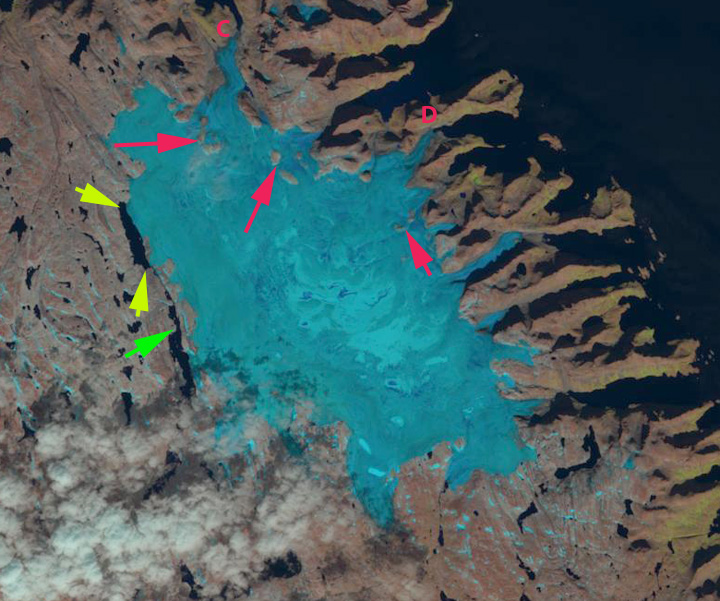
In 1985 the glacier terminated at the red arrow, expanding across the bottom of the valley where it turns south. The Weißsee-Kaunertal Gletscher terminus is at the blue arrow and the snowline is just above the icefall at the purple dots. In 1990 there is little evident change, the snowline is higher above the icefall, the glacier in fact ended a decade of advance in 1988. By 2000 Gespatch Gletscher has retreated 200-300 meters from the red arrow. Weißsee-Kaunteral Gletscher has retreated 100-150 m from the blue arrow. In 2010 most of the glacier has lost its snowcover, which was frequently the case from 2000-2010. The terminus has retreated up the westward oriented side valley several hundred meters. There is essentially no snow on the Weißsee-Kaunertal Gletscher. By 2013 Gepatsch Gletscher has retreated 800-900m from its 1985 position, with most of the retreat since 1990. Much of this retreat occurred from 2010-2013 of 240 m of retreat and another 120 m in 2014, 52 meters per year, as noted in the annual reports of the Austrian Alpine Club glacier report completed by Andrea Fischer each year (Fischer, 2015).
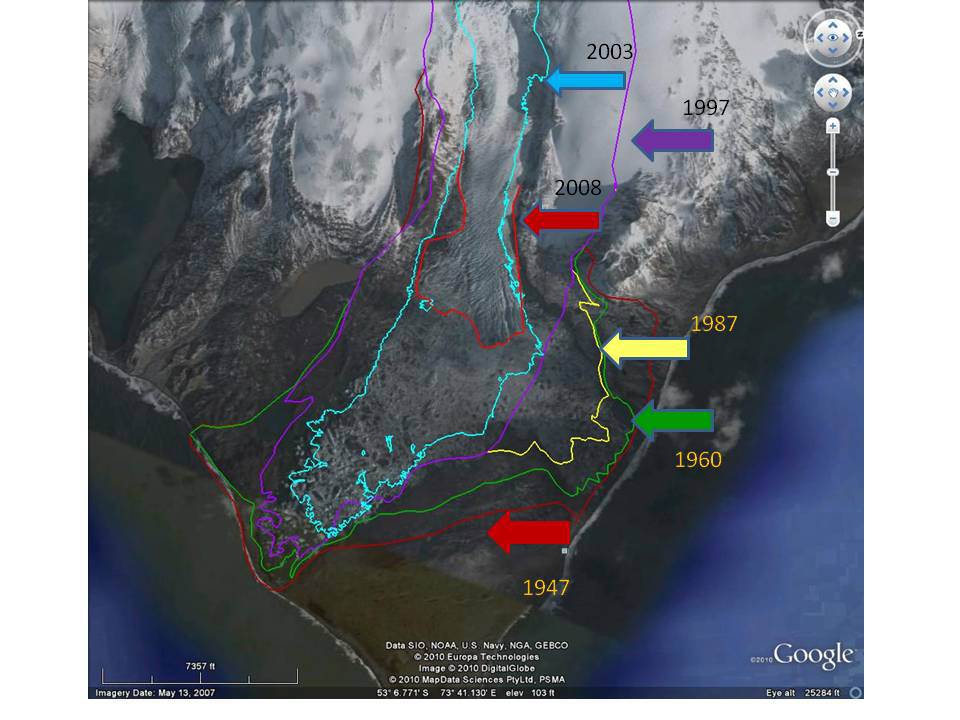
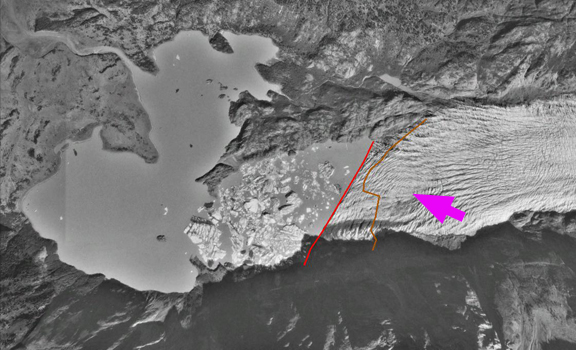
It is evident in the 2003 Google Earth image that rapid retreat was imminent as the terminus of the galcier was stagnant. The Weißsee-Kaunertal Gletscher has retreated 300 m and has thinned even more from 1990-2013. The Alpine club also observes this glacier and notes typical retreat rates in the last five years ranging from 15-25 meters/year. Given the ski lifts emplaced on this glacier, continued thinning and retreat will increasingly impact ski area operation. The ski area has not resorted to artificial means to sustain Weißsee-Kaunertal Gletscher as has been done at nearby Pitzal Glacier ski area.

1985 Landsat Image

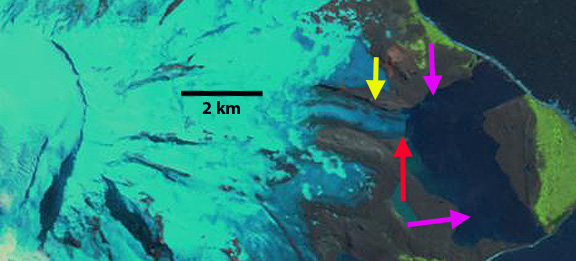
1990 Landsat Image
2000 Landsat Image
2010 Landsat Image

2013 Landsat Image

2003 Google Earth Image
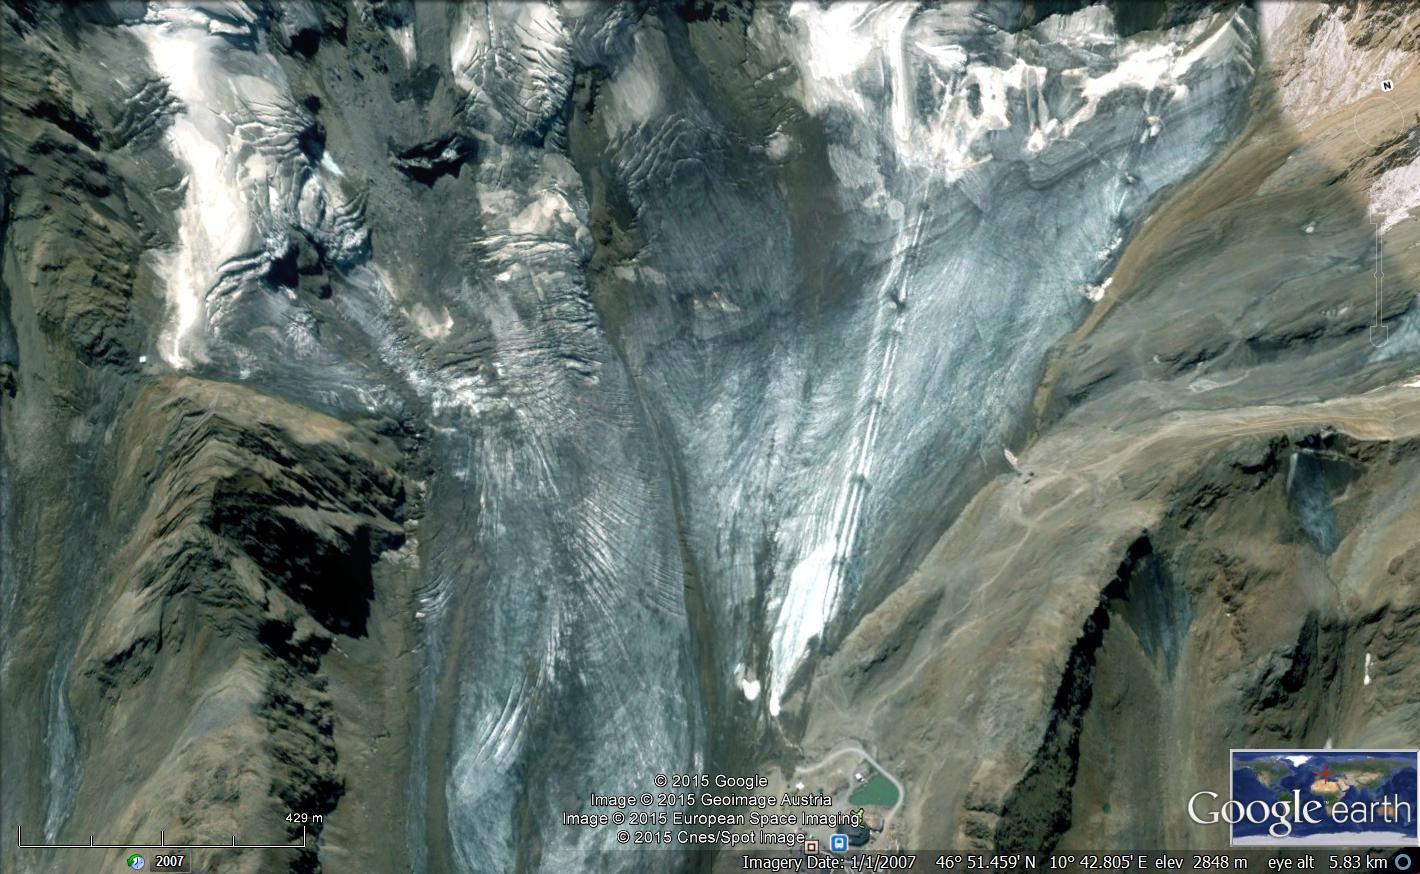
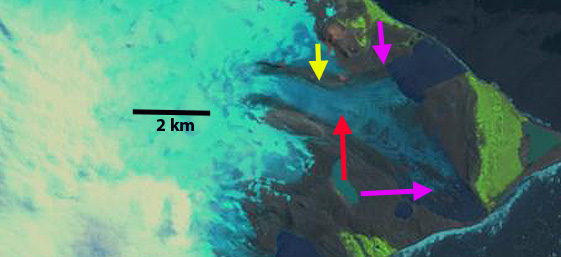
Google Earth Images ski lifts evident as the linear feature on the nearly snowless galcier.


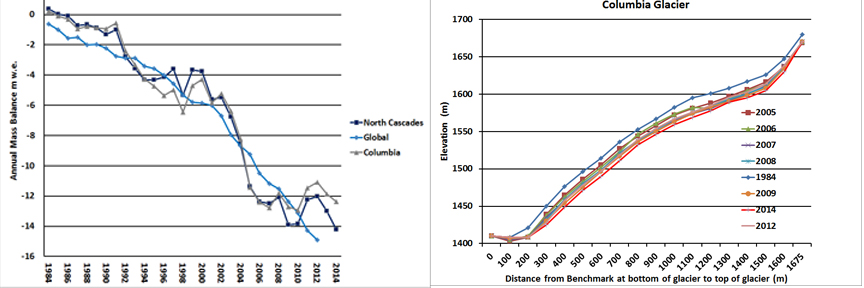


 Clearly the area will still be beautiful and we will gain two new alpine lakes with the loss of the glacier. After making over 200 measurements in 2010 we completed a mass balance map of the glacier as we do each year. This summer we will be back again for the 32nd annual checkup. There will be likely be record low snowpack, comparable to 2005 the worst year from 1984-2014.