Conway Glacier Separation and Retreat, Alberta

Conway Glacier drains east from the border with British Columbia into the Howse River. The Howse River joins the Saskatchewan River upstream of the Bighorn Hydropower project, which impounds Lake Abraham and produces 120 MW of power. The map of this area was updated based on 1990 images which indicate Conway Glacier is comprised of two lobes that join near the terminus.   An inventory of glaciers in the Canadian Rockies indicate area loss of 15% from 1985 to 2005 (Bolch et al, 2010).  The more famous Columbia Icefield, 50 km north, has lost 23 % of its area from 1919-2009 with ice loss at a minimum during the 1970′s (Tennant and Menounos, 2013). Here we examine Landsat imagery from 1986 to 2014 to see the impact of recent climate change.

conway glacier map

Map of Conway Glacier area from 1990 image.

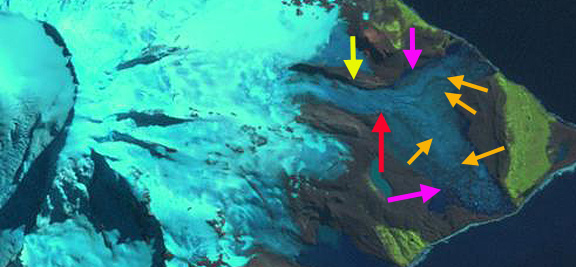
In 1986 the two glaciers are still joined, with a surface lateral moraine at their junction, orange dots indicate this narrow surface rock band eroded from the ridge between the two lobes. The yellow arrow in each image indicates the 1986 terminus location of the northern lobe, the red arrow indicates a bedrock step near the southern lobe terminus, green arrow indicates an ice filled basin, and the purple arrow a small tributary joining the main glacier.  In 1986 the southern lobe extends 300 meters beyond the bedrock step.  By 1994 a small lake is developing at the basin indicated by the green arrow and the northern lobe is reduced in width.  Overall less than 40% of the glacier is snowcovered.  By 1998 the southern lobe has retreated to the bedrock step and the northern lobe has retreated from the end of the lateral moraine.  The glacier again is less than 40% snowcovered.  The 2013 image has better resolution thanks to the better Landsat 8 imagery, and has been sharpened using a higher resolution panchromatic image layer by Ben Pelto (Technique will be explained in a future post).  The glaciers are no longer joined.  The northern lobe has retreated 500-550 m since 1986 and a small lake has formed at the 1986 terminus location, another yellow arrow indicates 2013 terminus.  The northern lobe has retreated above the bedrock step, a total retreat of 500-600 m since 1986.  Two additional red arrows have been added to indicate 1986 and 2013 terminus location.  The small lake at the green arrow has expanded.  The tributary connection at the purple arrow is nearly severed.   Retained snowpack on the glacier is also limited in area with most of the glacier in 2013 being bare glacier ice. This indicates that snow was not retained in recent previous years either.  For a glacier to be in equilibrium it needs more than 50% of its area to be covered by snow at the end of the melt season, not  35% with a few weeks left in the melt season. as in 2013. This glaciers retreat and volume loss mirrors that of the region including Saskatchewan Glacier and Fraser Glacier.   Peyto Glacier is the nearest glacier, just 20 km southeast, with a long term mass balance record, which indicates a cumulative loss or over 28 m w.e or 30 m of glacier thickness.

conway glacier 1986a

1986 Landsat image

conway glacier 1994

1994 Landsat image

conway glacier 1998

1998 Landsat Image

Red Channel|Green Channel|Blue Channel 2013 Landsat image-Pan sharpened by Ben Pelto (Univ. Northern British Columbia)
Lys Glacier Rapid Retreat, Italy

Lys Glacier drains south from Lyskamm in the Monta Rosa Group of Italy.  This glacier has a long history of observations that have indicated two short term advances in the 20th century 1912-21 and 1973-85 amidst a broader retreat.  The net change for the 1915-2004 interval was a 600 meter retreat (Smiraglia et al, 2006). They also noted a 10% area extent loss from 1975-2003, and since the glacier was advancing up to 1985 this change occurred more rapidly.  The Italian Glacier Commission report on terminus change of this glacier annually in the two latest reports Lys Glacier retreated 10 m in 2012 and 20 m in 2011. The total reported retreat from 2005-2012 was 186 m, more than 20 m per year. Here we examine Landsat images from 1990 to 2014.

lys ge

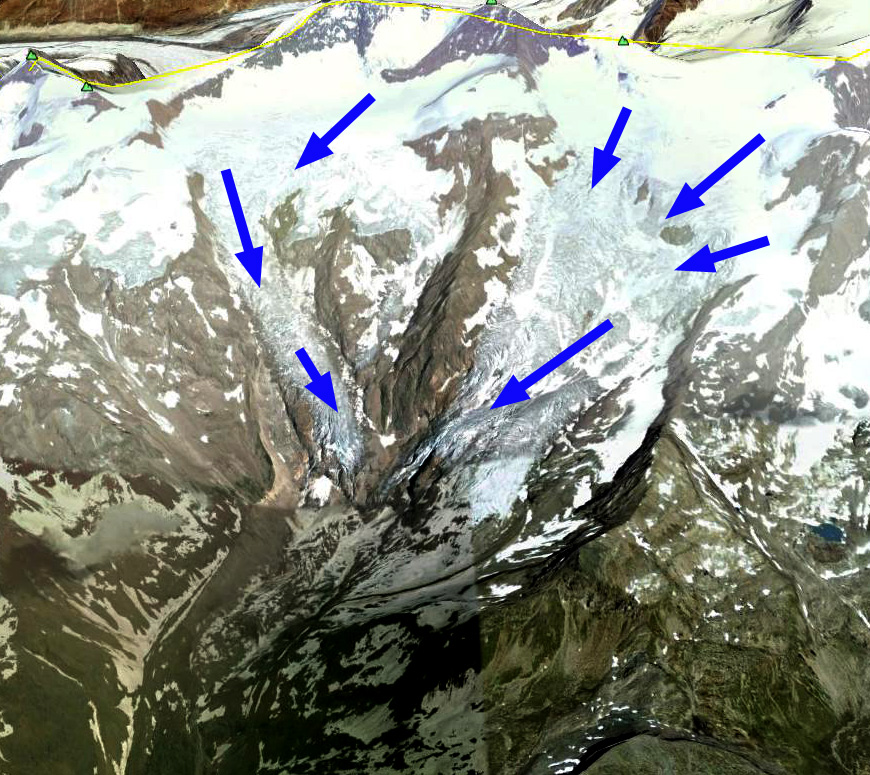
Google Earth Image

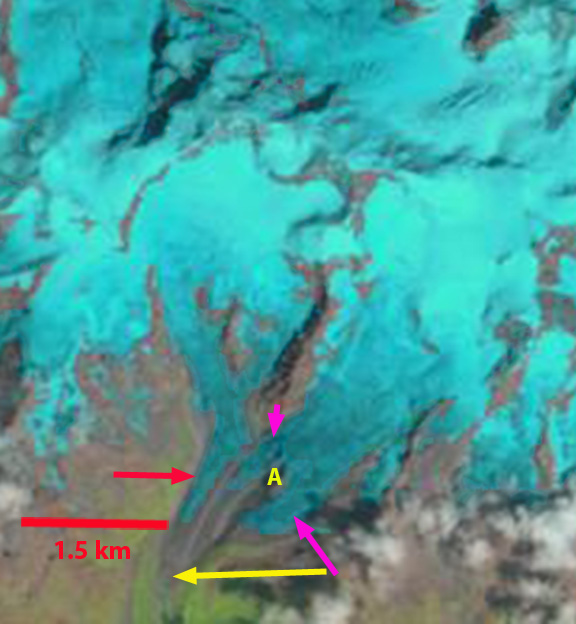
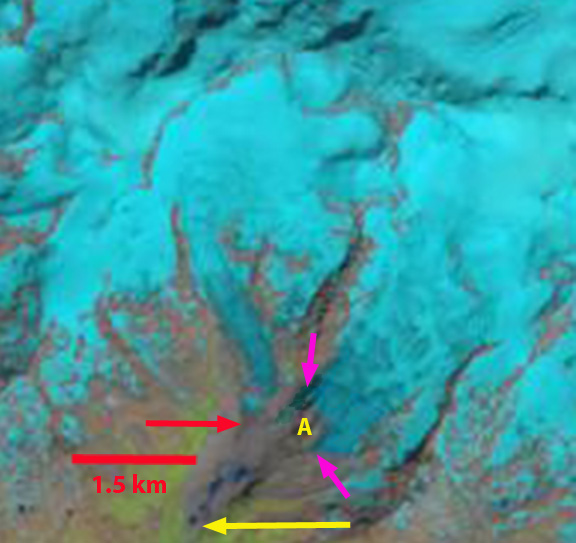
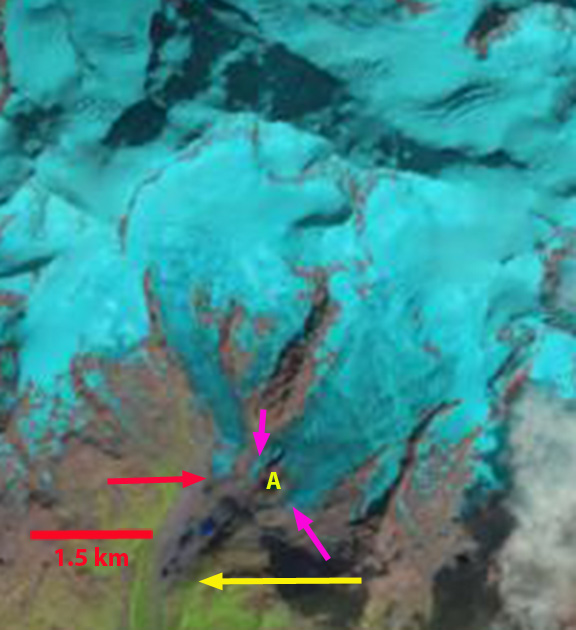
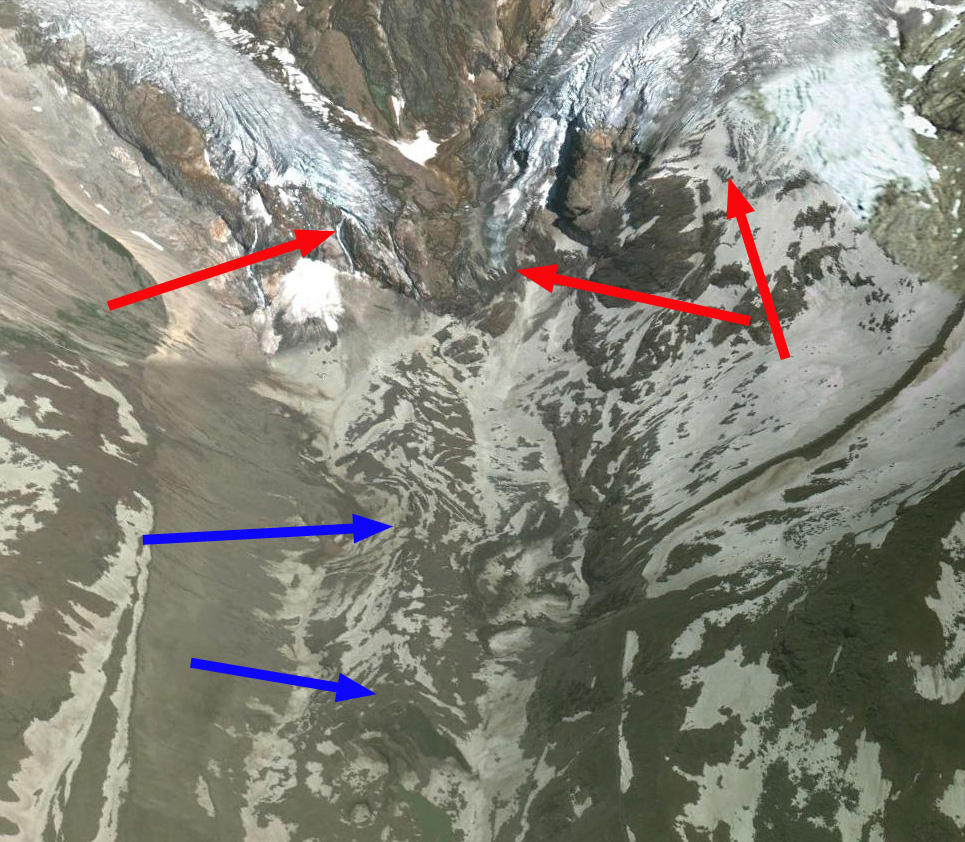
In 1990 two branches of the glacier merged in the valley bottom and extended to the red arrow marking the terminus of the glacier at that time.  The yellow arrow indicates the 2014 terminus position, and the yellow A indicates a prominent bedrock knob that a branch of the glacier encircles, pink arrows.  By 2013 the glacier in the main valley have separated, there are a few small lakes forming amidst the decaying stagnant ice tongue between the yellow and red arrow.  The bedrock knob at Point A has greatly expanded. In 2014 none of the termini reach the floor of the main valley.  As the stagnant ice melts, the lake area is expanding indicating that a new alpine lake will likely form.  The retreat from 1990-2014 is 1300 meters.  A closeup in 2009 from Google Earth indicates the two tongues with bedrock below separating them from the main valley floor, red arrows. There is still some relict ice below on the valley floor detached from the active glacier, blue arrows, that has small lake developing amid the stagnant ice. There is substantial crevassing above both actual termini, but not immediately. The retreat should slow now that the glacier has retreated onto steeper slopes, having lost the low elevation low slope valley tongue.
The retreat of this glacier is similar to that of nearby Verra Grande Glacier. lys glacier 1990
1990 landsat image
lys glacier 2013
2013 Landsat image
lys glacier 2014
2014 Landsat Image
lys glacier terminus
Google Earth Image

Stephenson Glacier Retreat and Lagoon Development, Heard Island

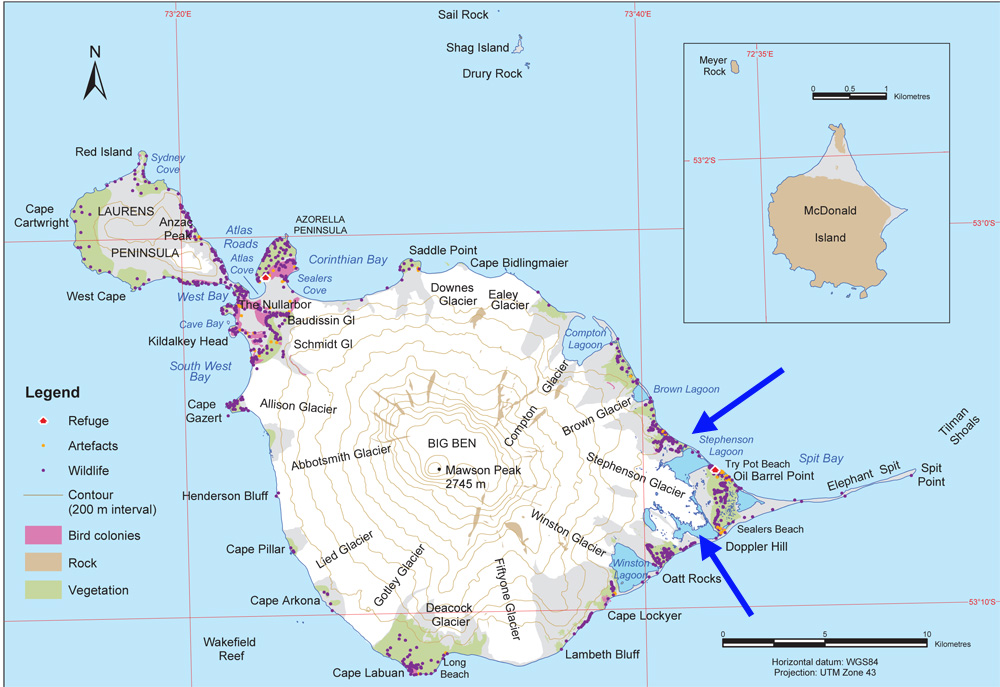
The Australian Antarctic Division manages Heard Island Island and has undertaken a project documenting changes in the environment on the island. One aspect noted has been the change in glaciers. The Allison, Brown and Stephenson Glacier have all retreated substantially since 1947 when the first good maps of their terminus are available. Fourteen Men by Arthur Scholes (1952) documents a year spent by fourteen men of the Australian National Antarctic Research Expedition that documented the particularly stormy, inclement weather of the region. Their visit to the glacier noted that they could not skirt past the glacier along the coast. After crossing Stephenson Glacier they visited an old seal camp and counted 16,000 seals in the area. It is a rich area for wildlife, that should benefit from the lagoon formation overall.  Thost and Truffer (2008) noted a 29% reduction in area of the Brown Glacier from 1947-2003. They also observed that the volcano Big Ben that the glaciers all drain from has shown no sign of changing geothermal output to cause the melting and that a 1 C warming has occurred over the same time period.
HIMI_general.pdf
Hear Island Map from the Australian Antarctic Division

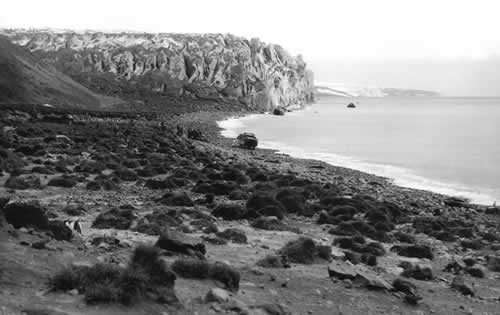
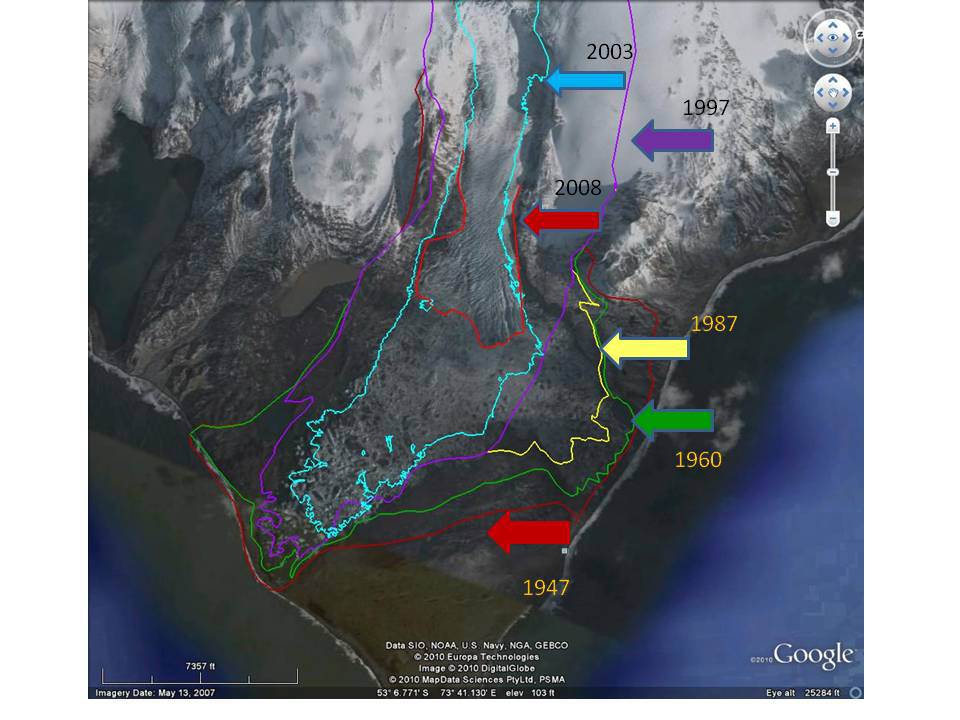
Stephenson Glacier extends 8-9 km down the eastern side of Big Ben. In 1947 it spread out into a piedmont lobe that was 3 km wide and extended to the ocean in two separate lobes around Elephant Spit. A picture from the Australian Antarctic Division taken in 1947 shows the glacier reaching the ocean and then in 2004 from the same location. Kiernan and McConnell (2002) identified an order of magnitude increase in the rate of ice loss from Stephenson Glacier after 1987. Retreat from the late 19th century to 1955 had been limited. As Kiernan and McConnell observed retreat began that by 1971 the glacier had retreated 1 km from the south coast and several hundred meters from the northern side of the spit. This retreat by 1980 caused the formation of Stephenson Lagoon and by 1987 Doppler Lagoon had formed as well. After 2000 the two lagoons have joined. The first image below shows the terminus locations over the last 60 years from the Australian Antarctic Division 1947-2008.

Here we examine a series of Landsat images from 2001 to 2013 to update the response of this glacier.
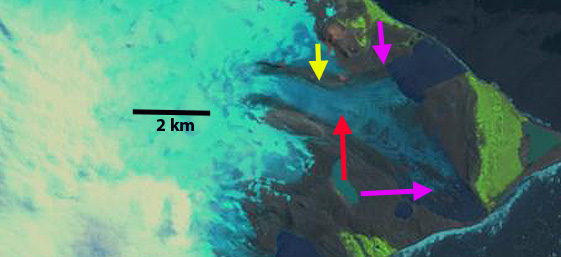
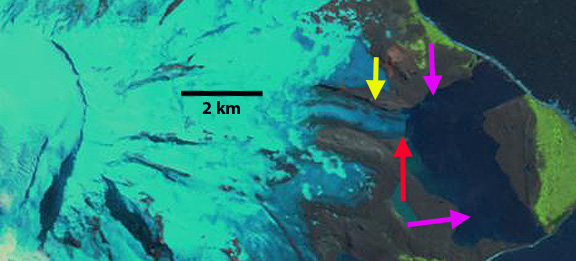
In 2001 the glacier has two separate termini, pink arrows,in two different lagoons, Doppler to the south and Stephenson to the east. There are numerous icebergs in Doppler lagoon but none in Stephenson Lagoon, indicating the retreat is underway. In 2008 the two lagoons are well joined, icebergs are even more numerous obscuring in this view the true location of the terminus, orange arrows. By 2010 the glacier has retreated from the main basin of the lagoon, and is at red arrow, and the lagoon is free of ice for the first time in several hundred if not several millenium. In 2013 the glacier has retreated into a narrower valley that feeds into Stephenson Lagoon. The northern arm of the glacier experienced a 1.7 km retreat from 2001 to 2013 and the southern arm as 3.4 km retreat. The period of rapid retreat due to calving of icebergs into the lagoon is over and the retreat rate will now be slower. There is still rapid glacier flow toward the terminus as indicated by extensive crevassing.  The overall glacier slope is steep and accumulation rates high, which would also generate rapid glacier flow.

The AAD has a number of images in their gallery of Heard Island glaciers including Stephenson Glacier. The climate station at Atlas Cove indicates a 1 C temperature rise in the last 60 years.  The AAD will also certainly be looking at how this new lagoon impacts the local seal and penguin communities. The map above indicates the importance of Stephenson Lagoon for wildlife, king penguins and cormorants are noted by AAD.  The retreat of this glacier follows the pattern of glacier retreat at other glaciers on islands in the circum-Antarctic region Cook Ice Cap, Kerguelen Island , Purvis Glacier, South Georgia and Neumayer Galcier, South Georgia.

stephenson map
Map of retreat from superimposed on Google Earth image.

stephenson 2001
2001 Landsat image

stephenson 2008
2008 Landsat image

stephenson 2010
2010 Landsat image

stephenson 2013
2013 Landsat image

Sperry Glacier Recession

In 1900 Sperry Glacier had an area of 3.39 km2. By 1938 it had diminished to 1.58 km2 and by 1946 it was only 1.34 km2 in area. The estimated loss in volume between 1938 and 1946 was a 23 meter reduction in the level of the surface of the lower half of the glacier during that period. Recession proceeded at an annual rate of 15.3 m. be¬tween 1938 and 1945; 11.9 m. from 1945 to 1947; 10.5 m. from 1947 to 1948; and 12.9 m. from 1948 to 1949 (Dyson, 1950).
Recession of Sperry Glacier continued from about 1950-1970 and has been accompanied by loss of volume of the lower part of the glacier. Sperry Glacier has been examined in reconnaissance (Johnson, 1958, 1960, 1964). Comparison of longitudinal and transverse profiles shows that since 1947 the upper part of the glacier has increased in vol¬ume during some years and remained constant during others, whereas the lower part has decreased in volume. Throughout this time span slow terminal recession has been continuous. Surface ice velocities on Sperry Glacier average about 3 m./year.
Sperry Glacier retreated at a slower rate of 5 m/a, from 1950-1979 (Cararra and McGrimsey, 1981). The retreat has ranged from 3-5 m/a from the 1979-1993 period (Key, Fagre and Menicke, 2002).
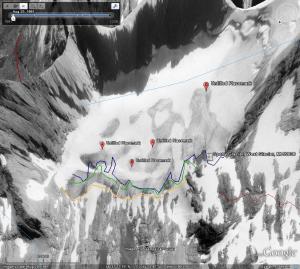
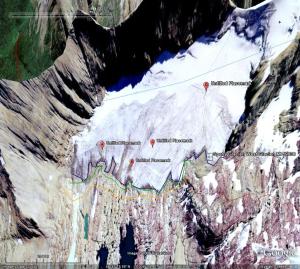
In 1993 0.87 square kilometers remained. This glacier still has crevasses and is not merely stagnant and melting away. A comparison of imagery from 1991 top (orange line for terminus), 2003 middle (green line) and 2005 bottom (blue line) indicate the marginal changes during this 14 year interval. These images are all from Google Earth using the historic imagery function. Sperry 1991sperry 2003Marginal recession averages 95 meters in this period ranging from 20-200 meters. The glacier was 1200 meters long in 1990 so this is close to a 10% loss in length. The current rate of retreat is slightly higher than the 3-5 m/a average fro the 1979-1993 period. The image in 1991 is from Aug. 25th, the glacier still has 70% of its area covered with snow from the previous winter. This is called the accumulation area ratio and in general must be above 60 at the end of the summer for the glacier to not lose mass. In 2003 the accumulation area ratio is about 30 and this is on Sept. 25th at the end of the melt season. In 2005 the accumulation area ratio is 30 at the most. Both years this limited a snowcover would lead to a significant negative mass balance, volume loss. The thinning in the upper portion of the glacier appears limited. There is not an evident change in the upper margin of the glacier. The crevassing which is indicative of movement has also not decreased much suggesting limited changes in the dynamics of the upper glacier. The comparatively slow changes in the accumulation zone, suggests a glacier that still has a consistent accumulation zone and is not likely to melt away rapidly, within the next 30 years, given the current climate. The glacier is showing no signs that it is approaching equilibrium, and that it can survive the current climate. This is in contrast to nearby Harrison Glacier which is receding quite slowly. There are new outcrops appearing at points A and B in the 2005 image indicating thinning and retreat is continuing. Annual layers are evident at point c in the 2005 image. Crevassing in the same area at point D is evident in each image. Sperry Glacier 2005
The USGS and the NPS have made Sperry Glacier a focus of field study beginning in 2005. The long term record of glacier area and glacier retreat makes it a good candidate. To date no mass balance data has been completed or reported. This data is essential to understand future terminus and volume responses. This project has been particular good at acquiring historic images to compare to current images 1913 and 2008. Bob Sihler captured the lack of snow remaining on Sperry Glacier in 2009., with a month still left in the melt season.