Alpine Glacier Mass Balance in 2015: Competes for Record Loss


Climate-Change-Data BA

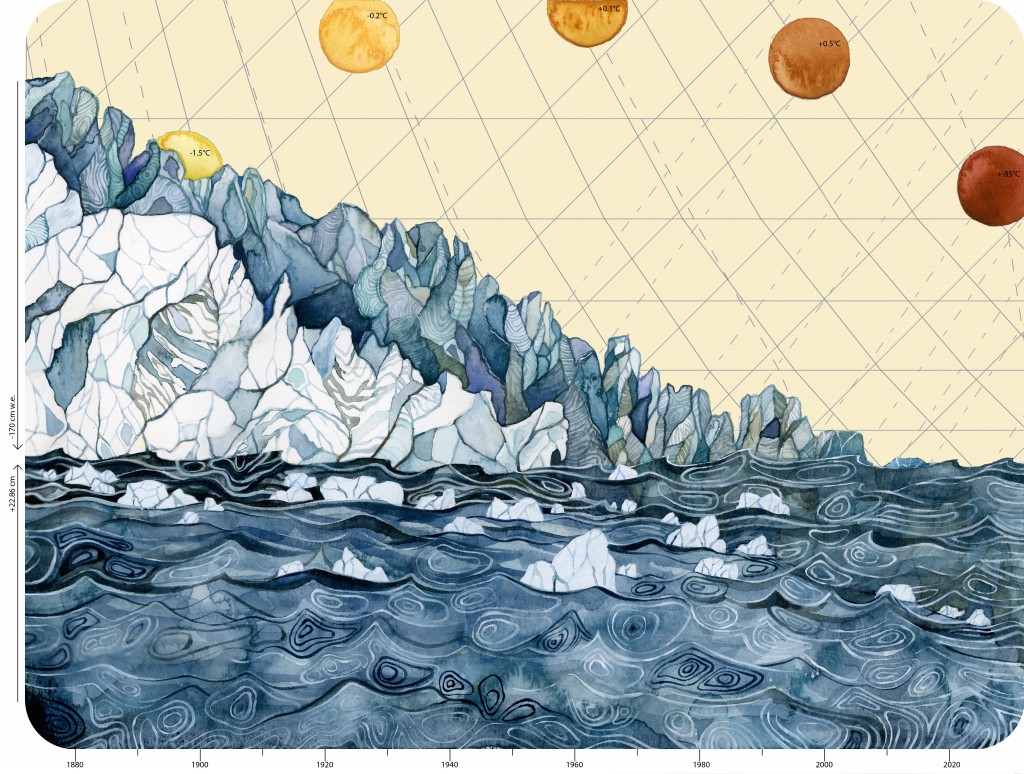
Painting from Jill Pelto illustrating the Climate Change Data using multiple quantities: the annual decrease in global glacier mass balance, global sea level rise, and global temperature increase. The numbers on the left y-axis depict quantities of glacial melt and sea level rise, and the suns across the horizon contain numbers that represent the global increase in temperature, coinciding with the timeline on the lower x-axis.

The World Glacier Monitoring Service (WGMS) record of mass balance and terminus behavior provides a global index for alpine glacier behavior. The WGMS data set for terminus change contains 42 000 observations from 2000 glaciers extending from the mid-19th century. Annual mass balance is the annual change in volume due to snow and ice accumulation and snow and ice losses. Here, mass balance is reported in mm of water equivalent. The following analysis is something I work on annually as the United States Representative to the WGMS, putting the alpine glacier mass balance of the globe in perspective. Preliminary data for 2015 from 16 nations with more than one reporting glacier from Argentina, Austria, Canada, Chile, Italy, Kyrgyzstan, Norway, Switzerland, and United States indicate that 2015 will be the 36th consecutive year of negative annual balances with a mean loss of −-1162 mm for 27 reporting reference glaciers and −1481 mm for 62 of all reporting glaciers (WGMS 2016). The number of reporting reference glaciers is 90% of the total whereas only 50% of all glaciers that will report have reported to date. When all data are available the 2015 mass balance will likely be comparable to 2003 the most negative year at −1268 mm for reference glaciers and −1198 mm for all glaciers.

The cumulative mass balance loss from 1980–2015 is 18.8 m, the equivalent of cutting a 20.5 m thick slice off the top of the average glacier. The trend is remarkably consistent from region to region (WGMS 2015). The decadal mean annual mass balance was −261 mm in the 1980s, −386 mm in the 1990s, -−727 mm for 2000s and −818 mm from 2010–15. The declining mass balance trend during a period of retreat indicates alpine glaciers are not approaching equilibrium and retreat will continue to be the dominant terminus response (Zemp et al. 2015). The recent rapid retreat and prolonged negative balances has led to many glaciers disappearing and others fragmenting (Pelto 2010; Carturan et al. 2013).

wgms annual balance

Annual glacier mass balance record of reference glaciers reporting to the WGMS.

In South America seven glaciers in Columbia, Argentina, and Chile reported mass balance. All seven glaciers had losses greater than −1200 mm, with a mean of −2200 mm. These Andean glaciers span 58°of latitude.

In the European Alps, mass balance has been reported for 14 glaciers from Austria, France, Italy, Spain and Switzerland. All 15 had negative balances exceeding −1000 mm, with a mean of −1860 mm. This is an exceptionally negative mass balance rivaling 2003 when average losses exceeded −2000 mm.

In Norway mass balance was reported for seven glaciers in 2015, all seven were positive with a mean of 860 mm. This is the only region that had a positive balance for the year. In Svalbard six glaciers reported mass balances, with all six having a negative mass balance averaging −675 mm.

In North America Alberta, British Columbia, Washington, and Alaska mass balance data from 17 glaciers was reported with a mean loss of −2590 mm, with all 17 being negative. This is the largest negative mass balance for the region during the period of record. From Alaska south through British Columbia to Washington the accumulation season temperature was exceptional with the mean for November–April being the highest observed.

In the high mountains of central Asia seven glaciers from China, Russia, Kazakhstan, and Kyrgyzstan reported data, all were negative with a mean of –705 mm.

columbia compare 2015


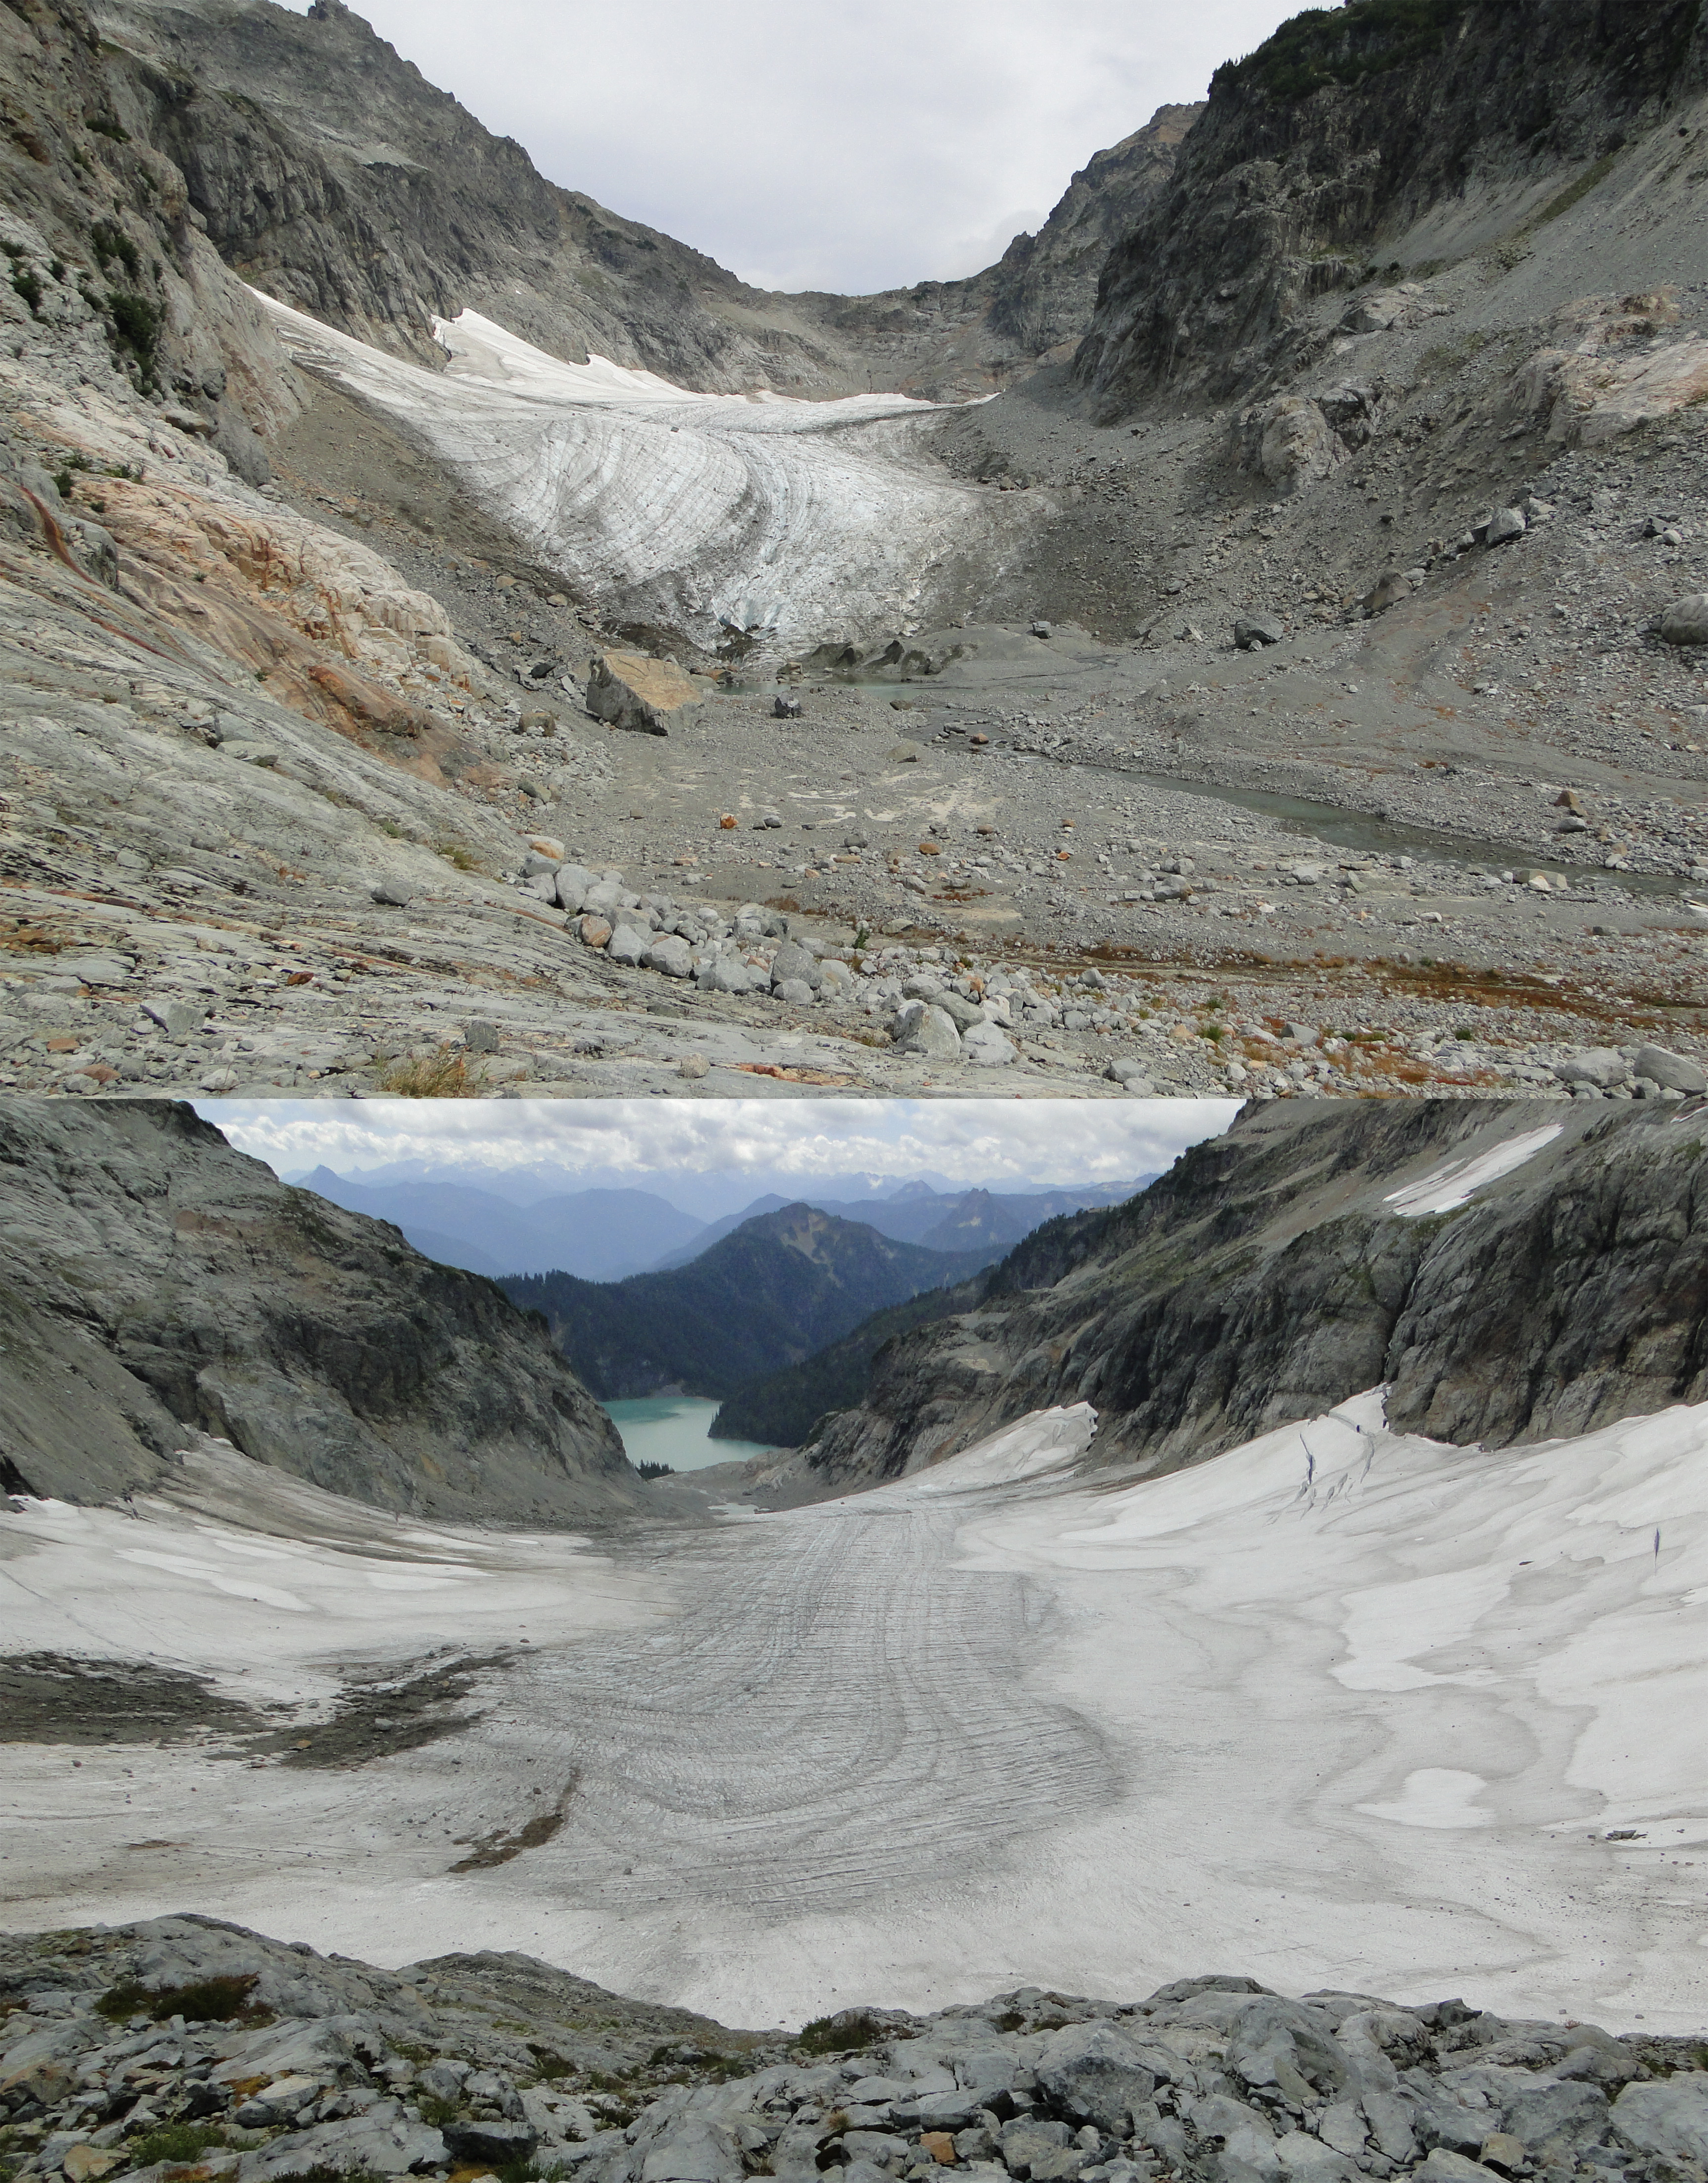
Columbia Glacier, Washington in 2015 during our mass balance observations from the terminus and head of the glacier indicating the lack of snow cover retained and extensive melting,


Lago Onelli, Argentina trio of Glaciers Retreat and Separate

glacier onelli compare

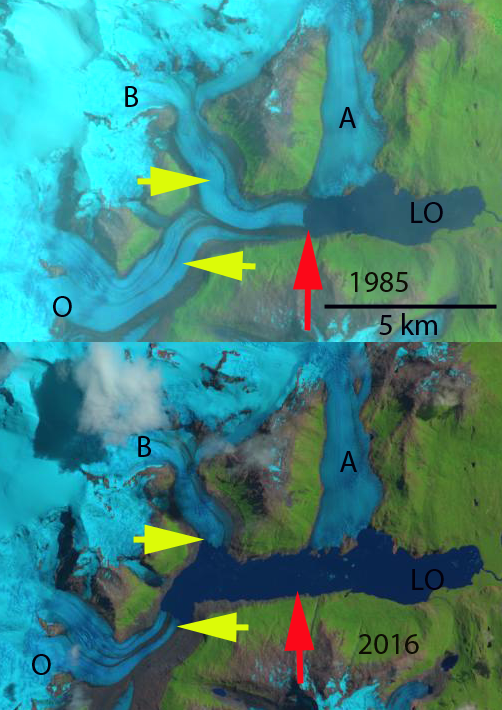
Onelli Glacier (O), Belados Glacier (B) and Agassiz Glacier (A) compared in Landsat images from 1985 to 2016.  The red arrow indicates the 1985 terminus location and yellow arrow is the 2016 terminus location. 

The Onelli Glacier drains eastward from the South Patagonia Icefield (SPI) into Lago Onelli (LO), which then connects to Lago Argentino. Lago Onelli has three main glaciers terminating in the lake Agassiz (A), Onelli(O) and Bolados Glacier (B). Onelli glacier is noted as 13 km long with an area of 84 square kilometers by the Labratorio de Glaciologia in Chile . Davies et al (2012) noted that the most rapid period of retreat since 1890 for Bolado and Onelli Glacier was from 1986-2001.  Warren and Sugden (1993) note an 1800 meter retreat from 1945-1992 for Onelli Glacier and 850 meters for Agassiz Glacier. Eric Shipton was the first to visit this glacier and did so in the company of Ohio State glaciologist John Mercer in 1958. They found Lago Onelli so filled with icebergs that little water could be seen (Shipton, Land of Tempest, 1963). Agassiz and Onelli Glacier were observed to have a shared terminus in 1958 much like Onelli Glacier and Belados Glacier in 1985.

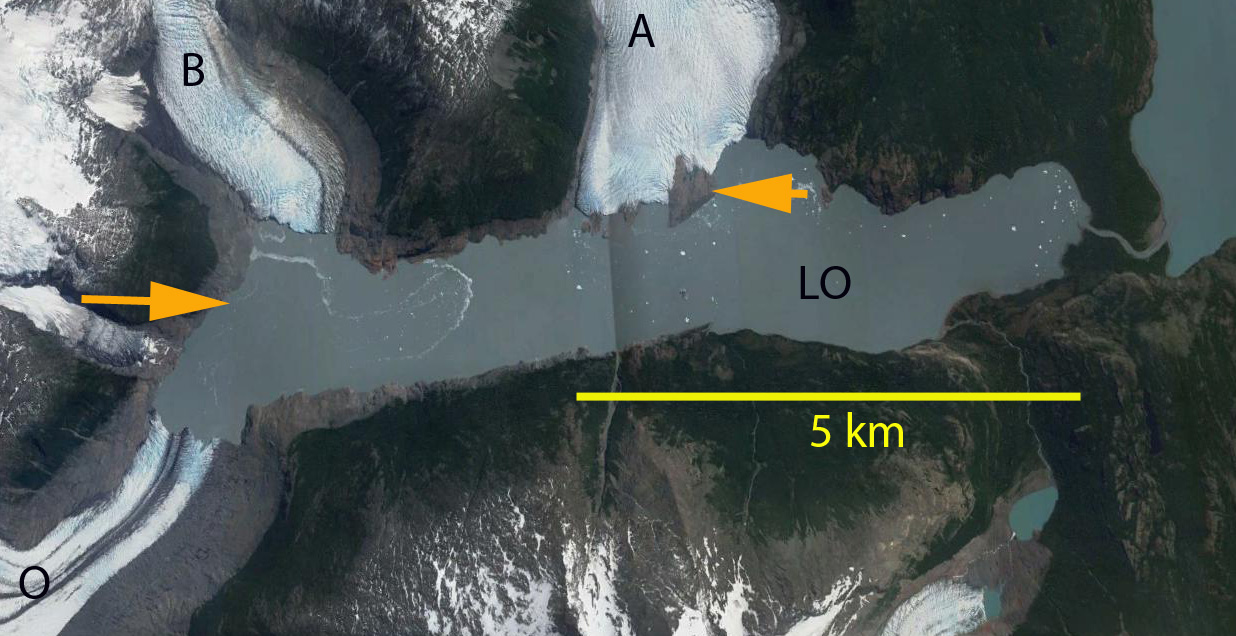
A comparison of Landsat satellite images indicate the separation and retreat of Bolados (B) and Onelli Glacier (O) from 1985-2016. In 1985 the joint terminus cuts directly across Lago Onelli as one reasonably straight 1.6 km wide calving front just short of connecting with Agassiz Glacier. By 2004 the glacier had retreated 3000 m and Belados and Onelli were  barely touching.The combined termini width was 1.8 km. By 2010 the glaciers were separated by 1300 meters. By 2016 Belados Glacier has retreated 3500 m from 1985-2016 and Onelli Glacier has retreated 3800 m. The glaciers in 2016 are separated from each other by 1800 m. The ELA in the satellite images from recent years has been 1300 meters. Agassiz Glacier has retreated 400 m during the 1985-2016 period.  The glacier is grounded on three islands that acts as pinning points, reducing calving losses and the retreat rate.

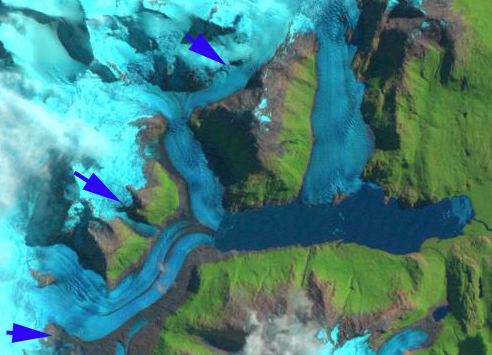
Willis et al (2012) examined the mass change of the 12,100 km2  SPI  from 2000-2012: in the accumulation zone the average thickness change of −1.1 ± 0.1 m/year, for the ablation zone the average thickness change is −3.5 ± 0.02 m/year.  This widespread loss even in the accumulation zone indicates that retreat will continue.  A comparison of Landsat images from 1998 to 2013 indicates upglacier thinning at the purple arrows. Schaefer et al (2015) noted that the mass loss of SPI has been largely from increased calving losses.  Mouginot and Rignot (2015) observed that Onelli Glacier does not have a high velocity reach extending beyond the immediate terminus zone, unlike major outlet glaciers of the SPI.

glacier onellis 2004 ge

Google Earth image of Onelli Glacier and Belados Glacier in 2004 above and 2015 below.  Orange arrow indicates the 2004 terminus location. 

glacier onelli 2015 ge

glacier onelli1998

Landsat images from 1998 and 2013 indicating specific areas of upglacier thinning at the purple arrows. 

glacier onelli 2013

Coronation Island Glacier Retreat, South Orkney Islands

sunshine compare

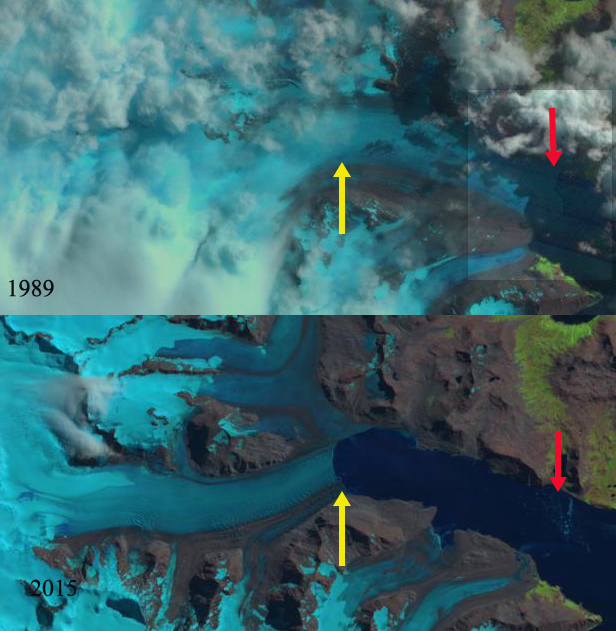
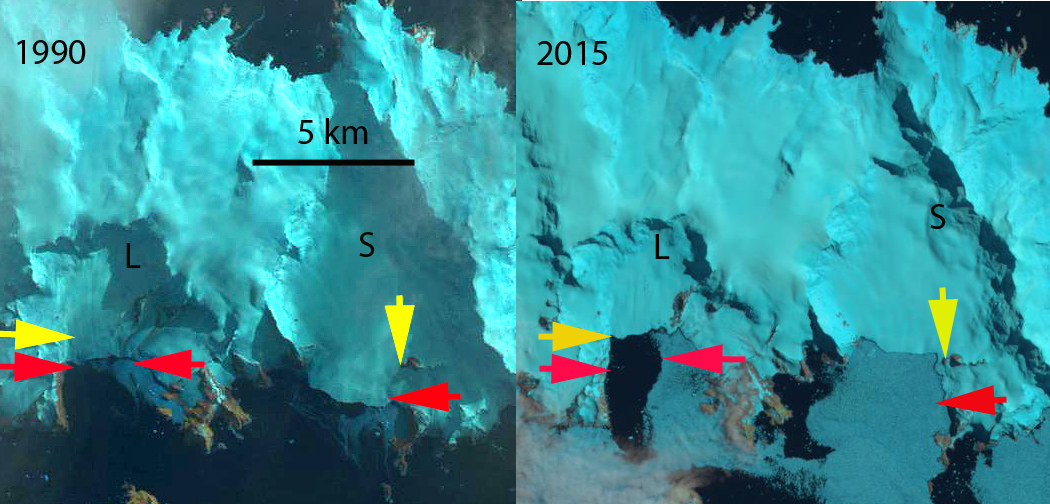
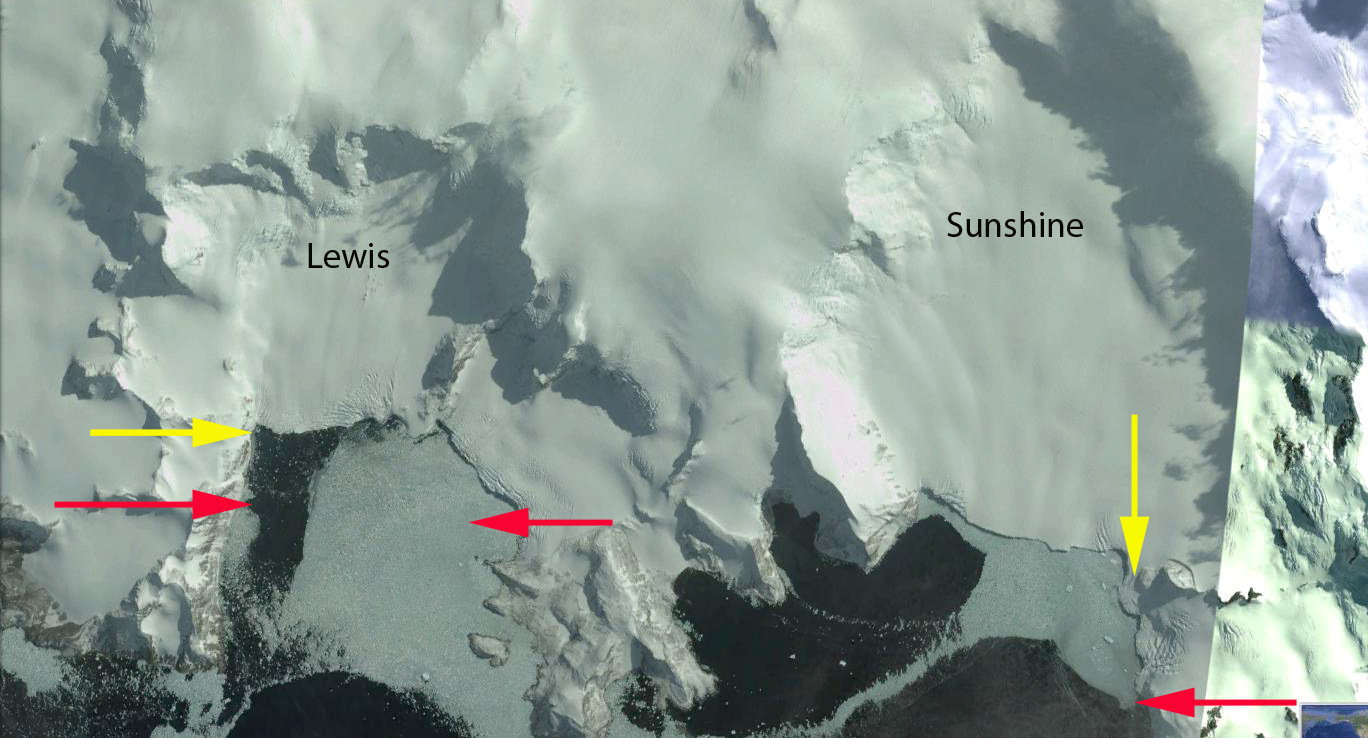
Lewis Glacier (S) and Sunshine Glacier (S) on Coronation Island in 1990 and 2015.  Red arrow is 1990 terminus location and yellow arrow the 2015 terminus location.  

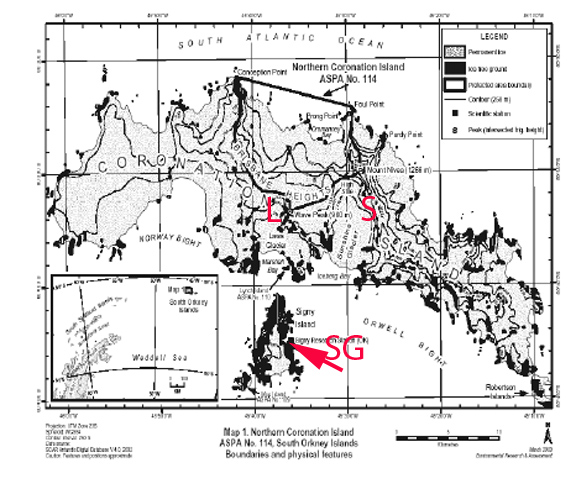
Sunshine and Lewis Glacier are tidewater glaciers on the south side of Coronation Island in the South Orkney Islands.  This is an area of excessive cloud cover leading to few available satellite images illustrating glacier change.  A map of the glaciers from the British Antarctic Survey indicates they had nearly filled the embayments.  The BAS maintains a research base on Signy Island (SG) that faces directly across the Orwell Bight to Sunshine Glacier.  Coronation Island is extremely windy with the prevailing westerly wind averaging about 14 knots, at Signy Station with gales recorded on about 60 days each year. The Signy Station research focuses mainly on marine mammals and birds, with elephant seals, chinstrap, Adelie and gentoo penguins being most common.Cornonation map

Map of Coronation Island indicating Lewis Glacier (L), Sunshine Glacier (S) and the BAS Signy research station (SG)

SIGNY_sunshine

View across Orwell Bight from Signy Island to Sunshine Glacier with the BAS Research vessel James Clark Ross in view during November 2015. (From BAS)

In 1990 Lewis Glacier had an east-west calving front extending from the last prominent east-west oriented ridge on the west side of the glacier.  Sunshine Glacier extended well beyond the end of  prominent ridge on the west edge of the glacier.  By 2005 in the Google Earth image below Lewis Glacier had retreated in the center of the glacier more than on the west end.  By 2013 Lewis Glacier had retreated to a second prominent east west trending ridge.  Sunshine Glacier had retreated beyond the prominent ridge on the west by 2005.  From 2005 to 2013 additional retreat occurred along the east side of Sunshine Glacier.  The terminus on the east side of Sunshine Glacier is now adjacent to a series of  nunataks comprising a ridge extending east from the glacier. Retreat of Lewis Glacier from 1980 to 2015 averaged 900 m across the 3 km wide calving front.  Sunshine Glacier retreated 1100 m from 1990 to 2015 across the 3.5 km wide calving front.  Both glaciers have relatively flat regions within one kilometer of the calving front which are prone to continued calving retreat. The glaciers are encased in sea ice much of the year protecting the calving front, but the summer climate is maritime with temperatures typically above freezing and the area relatively ice free.  Today the region is also accessed by Oceanwide Expeditions.  The retreat is similar to that of nearby on Endurance Glacier on Elephant Island and many retreating glaciers on South Georgia Island. .

sunshine 2005 ge

Google Earth images from 2005 and 2013 indicating the 1990 (red arrows) and 2015 terminus locations (yellow arrows). 

sunshine 2013 ge

Click to access aca2_spa114.pdf

Jiongla Glacier, China Rapid Retreat 1988-2015

jionla compare

Jiongla Glacier retreat right and Jiangyegong Glacier left retreat from 1988 to 2015 in Landsat images.  The red arrow is the 1988 terminus and the yellow arrow the 2015 terminus. Jiongla Glacier retreated 3200 m and Jiangyegong Glacier 800 m. 

Jiongla Glacier is at the northern boundary of the Brahmaputra River Basin at the east end of the Nyainqentanglha Shan. The glacier drains the western slopes of Koma Kangri Peak and ends in a lake before feeding into the Parlung Zangbo and then Yarlung Tsanpo. his glacier feeds the Parlung Zangbo which is the site of numerous planned hydropower projects, last image, before joining the Yarlung Tsanpo which becomes the Brahmaputra River. The Zangmu Dam went online in 2015, this hydropower facility will produce 2.5 billion kilowatt-hours of electricity a year. In a study by Tobias Bolch et al (2010) in the western Nyainqêntanglha Mountains glacier area decreased by 6% between 1976 and 2001 and continued to shrink from 2001–2009. Li et al (2010) examined glacier change over the last several decades in China and found ubiquitous glacier retreat and commonly lake formation as glaciers retreated. Ninglian and Shichang (2014) in the China National Report on Cryospheric Sciences noted a loss in glacier area of 15 to 17 % in the region. Here we examine satellite imagery from 1988, 2000, 2009, 2010, 2011 and 2015. The red arrow denotes the 1988 terminus and the yellow arrow the 2011 terminus.

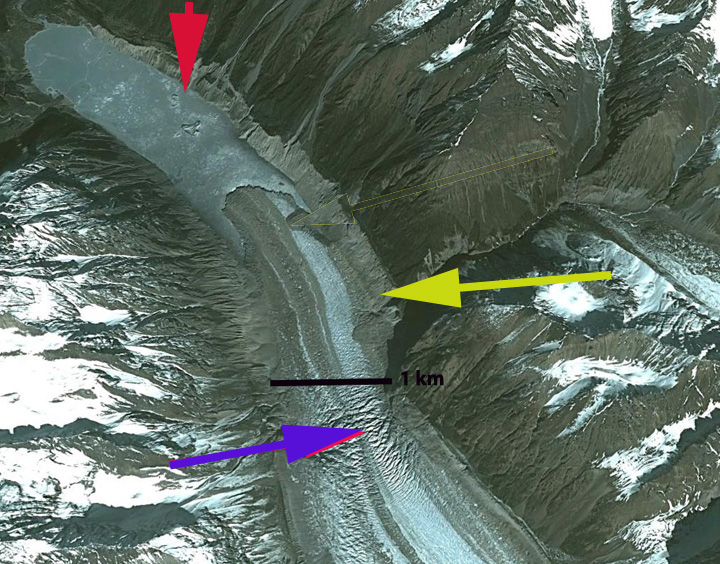
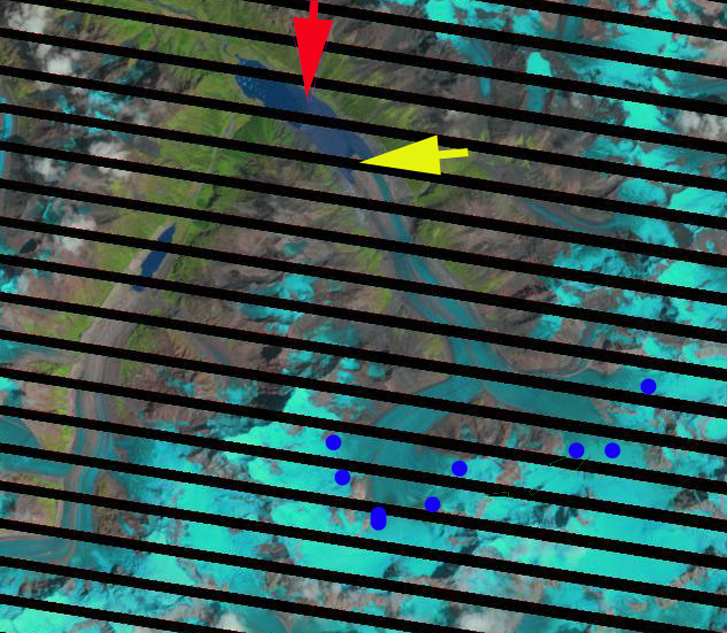
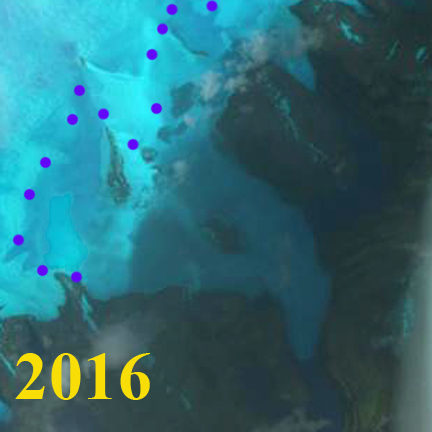
In 1988 the lake where Jiongla Glacier ends is at 2 km long. By 2000 the glacier has retreated 1300 meters. In the 2003 terminus closeup that indicates vigorous flow through an icefall, purple arrow, 2 km behind the terminus. This indicates the lake will end before this point and the glacier does not have a substantial stagnant terminus tongue. By 2011 the lake is 4 km long, a 2 km retreat in 20 years. There are icebergs visible in the lake particularly in the 2003, 2009 and 2011 images indicating that this one a key reason for rapid recent retreat. In reviewing the satellite images for the region cloud cover made it difficult to find imagery near the end of the melt season. By 2015 the lake is 5200 m long indicating a 3200 m retreat from 1988-2015.  The terminus is now within 500 of the increase in surface slope that suggests the end of the lake, and likely the end of the current rapid retreat. The 2011 image is from near the end of the melt season and indicates a snowline at 5150 m, blue dots, this is too high for equilibrium, with limited glacier area above 5500 m and the terminus at 4000 meters. This suggests that retreat will continue.   The retreat here is similar to that of Thong Wuk Glacier and Requiang Glacier.

The neighboring Jiangyegong Glacier has experienced an 800 m retreat from 1988 to 2015.  This terminus remains low slopes and heavily debris covered. The debris will slow the retreat, while the low slope indicates the lake can continue to expand enhancing retreat.  This also suggests the rate of retreat will soon slow.T
jiongla2000

Landsat image 2000 with the yellow arrow indicating the 2011 terminus position and the red arrow the 1988 terminus position.

jiongla terminus2003 Google Earth Image

jiongla 2011

Landsat image 2011 with the yellow arrow indicating the 2011 terminus position and the red arrow the 1988 terminus position.


Yarlung Tsangpo HPP

Hydropower dams completed, under construction and proposed. 


Thong Wuk Glacier Terminus Tongue Collapse, China

sepu compare

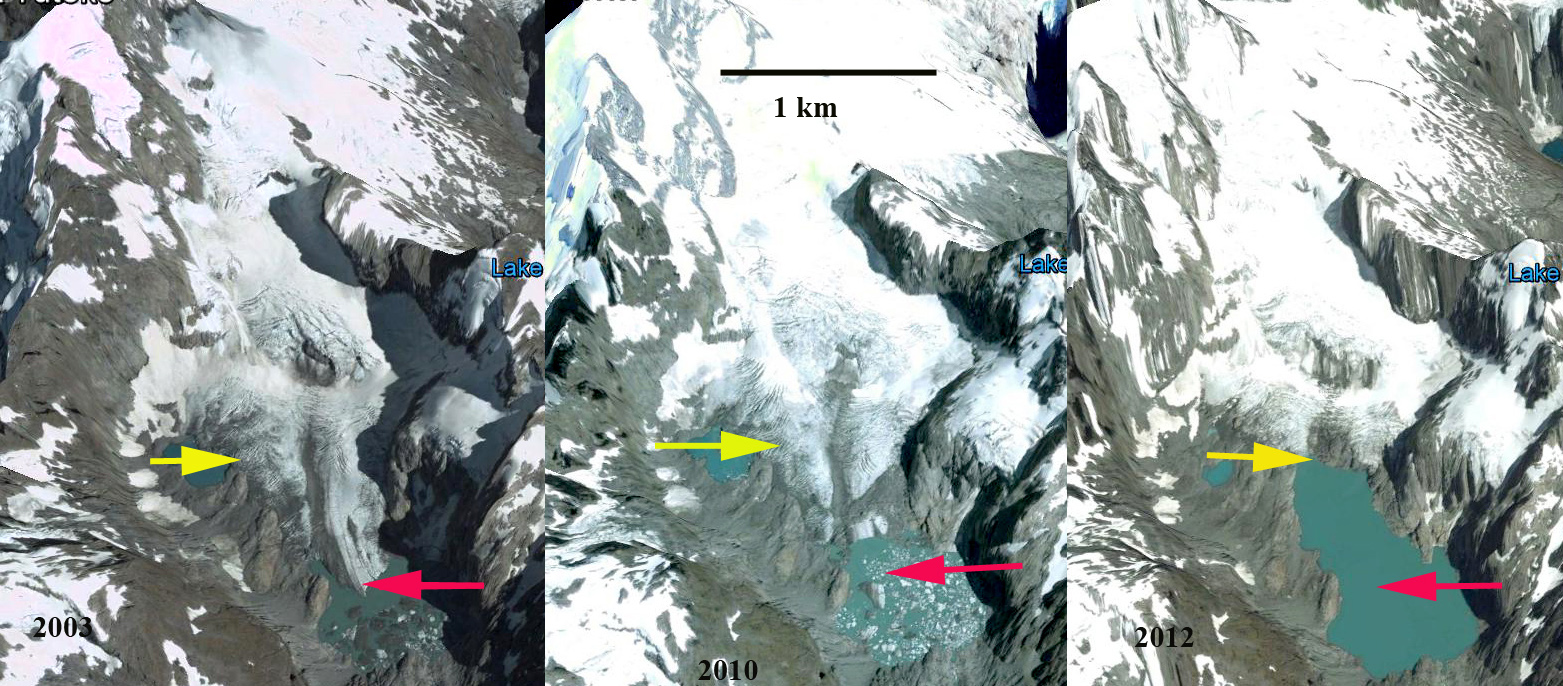
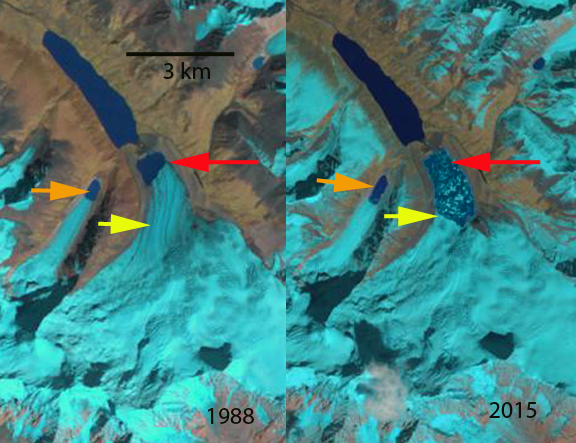
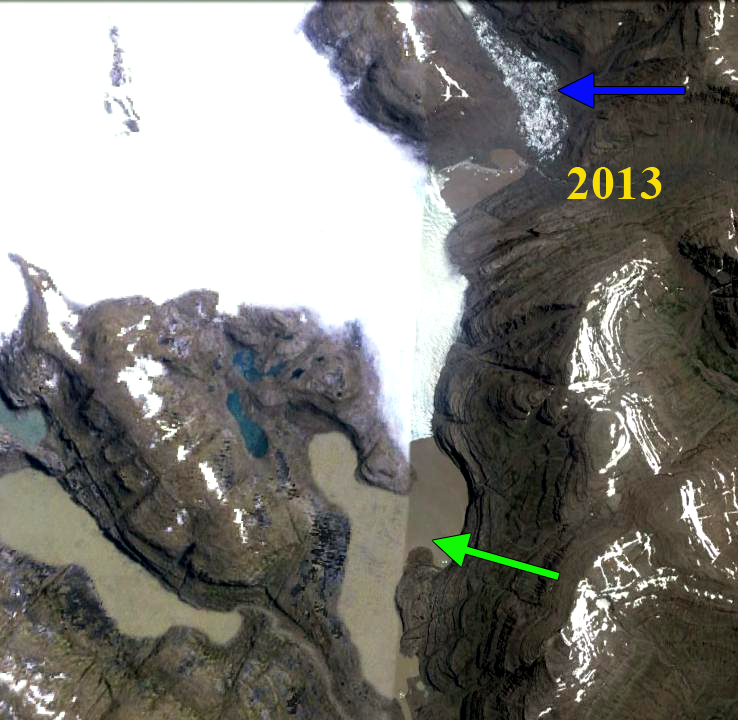
Thong Wuk Glacier  comparison in 1988 and 2015 Landsat image.  Red arrow is the 1988 terminus location, yellow arrow the 2015 terminus location and orange arrow indicates expanding lake of Yanglang Glacier. 

There are two glaciers that drain the north side of Sepu Kangri Peak in the Eastern Nyainqêntanglha Mountains of Tibet in China. Thong Wuk to the east and Yanglang Galcier to the west. Most of the peaks in East Nyainqêntanglha Mountains are unclimbed, Sepu Kangri the highest peak was not climbed until 2002. The Sepu Kangri glaciers drain into the Salween River. In a study by Tobias Bolch et al (2010) in the western Nyainqêntanglha Mountains glacier area decreased by 6% between 1976 and 2001 and continued to shrink during the period 2001–2009. Li et al (2010) examined glacier change over the last several decades in China and found ubiquitous glacier retreat and commonly lake formation as glaciers retreated.

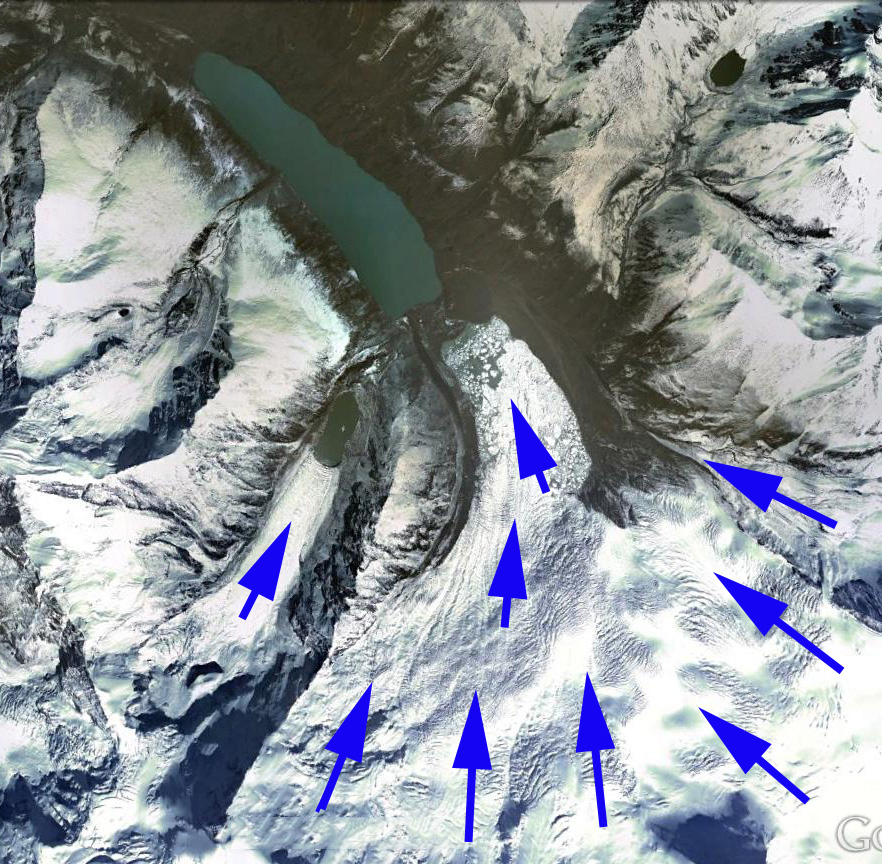
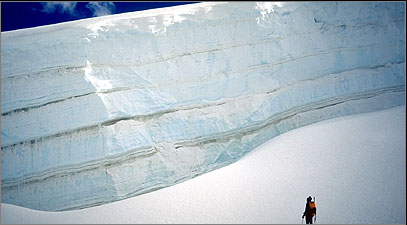
In this case we compare Landsat images from 1988, 2003, 2010 and 2015 and Google Earth images from 2011. In 1988 the lake at the end of the two glaciers are both 500-700 m long.  By 2003 there is limited terminus change for the eastern side of the Thong Wuk terminus and the western side of the terminus has retreated 200 meters. By 2010 the terminus tongue is breaking up with many icebergs filling the lake. In 2011 the lake has expanded from a length of 600 meters in 1988 to 1300 meters.  A closeup view in Google Earth of the eastern tongue indicates that this narrow tongue is not stable and the lake will lake quickly develop to an area of 1.7 km long and 0.8 km wide.  In 2015 the glacier has retreated 1050 m since 1988, and the lake has an area of 2.4 square kilometers. Based on an increase in surface slope 500 m from the current terminus the lake will not expand more than this. This glacier remains heavily crevassed and has a vigorous accumulation zone indicating that it is not in danger of disappearing with current climate. In fact images from the first ascent of Sepu Kangri in 2002 indicate the annual layering in a crevasse, illustrating the considerable accumulation. The formation of lakes at the end of the glaciers as they retreat is quite common, including in the Tibetan glaciers.

sepu 2003-2010

Thong Wuk Glacier  comparison in 2003 and 2010 Landsat image.  Red arrow is the 2003 terminus location and orange arrow indicates expanding lake of Yanglang Glacier. 

sepu kangri 2011

2011 Google Earth image.  Note the heavy crevassing indicating considerable accumulation and flow.

sepu kangri tongue

2011 Google Earth image indicatint narrow tongue that has broken up by 2015.

sepu stratigraphy

Crevasse with annual layers on upper Thong Wuk Glacier from the Sepu Kangri Expedition in 2002.


Shamrock Glacier, Alaska Loses Terminus Tongue

shamrock glacier compare
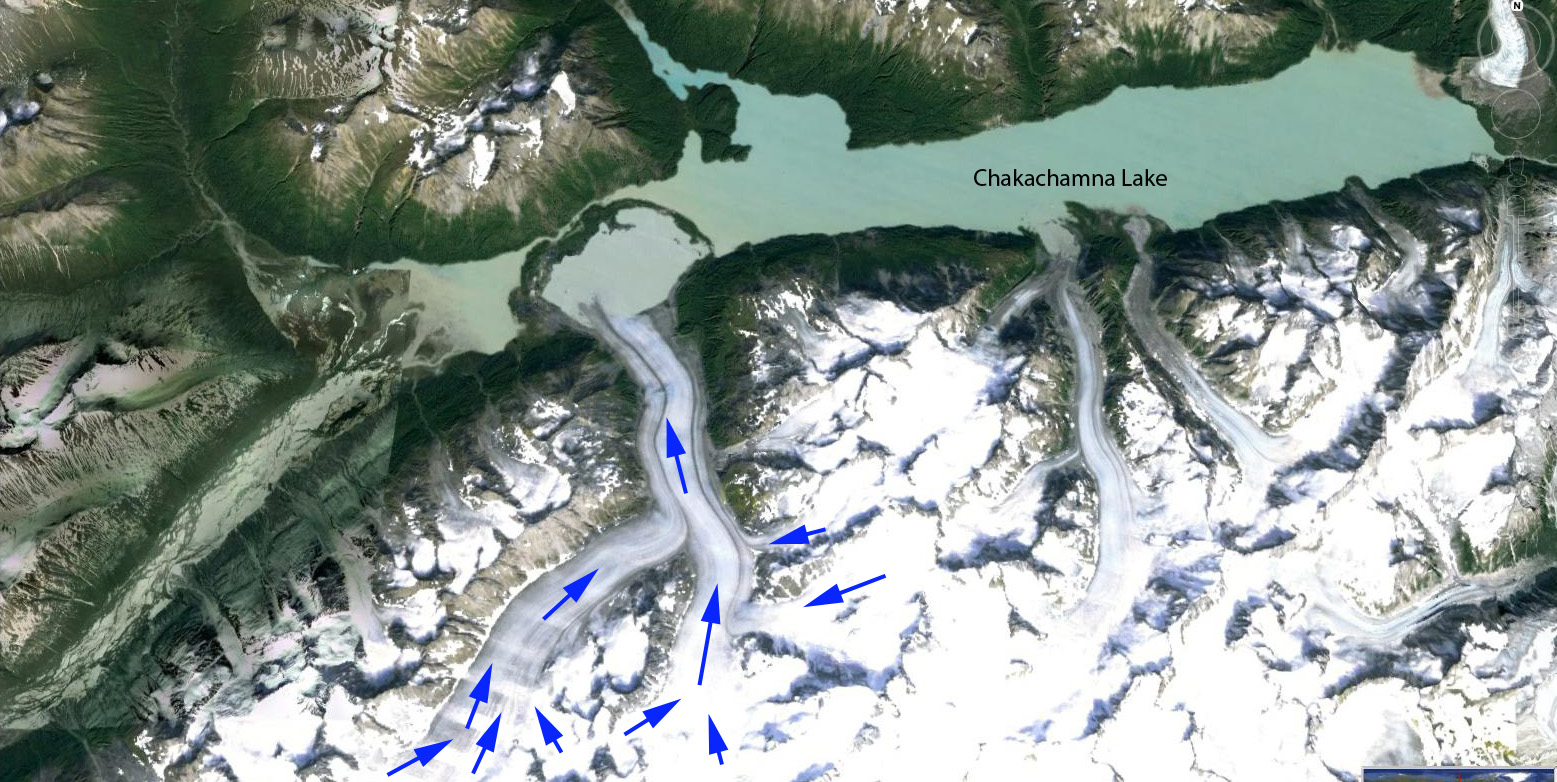
Shamrock Glacier comparison in 1987 and 2014 Landsat images. Red arrow 1987 terminus, yellow arrow 2014 terminus, purple arrows upglacier thinning and purple dots the snowline. The terminus tongues extending into the lake has been lost.

Shamrock Glacier flows north from the Neacola Mountains into Chakachamna Lake in the Lake Clark National Park of Alaska. This lake is transited by several species of salmon, mainly sockeye, heading into spawning  areas upriver. The lake had been the site of a proposed hydropower plant, that would not have required building of a dam, but this project is currently not being developed. The National Park Service completed a Southwest Alaska Network mapping project that identified the changes of glaciers in the region. Lake Clark NP has 1740 glaciers which have lost 12% of their total area from 1950 to 2009 (Loso et al, 2014). Here we examine Landsat imagery from 1987 to 2014 to identify recent change of Shamrock Glacier.

shamrock glacier profile
July 2015 image looking across Shamrock Lake to Shamrock Glacier, taken by Jerry Pillarelli, note he has many more gorgeous images of area. The trimline on the far side of the glacier between sediment and vegetation indicates the 1950 margin. There is an elevation step several hundred meters inland of the terminus indicating Shamrock Lake will expand little.

In 1987 Shamrock Glacier had receded from a terminal moraine in Chakachamna Lake that it had terminated on in the 1950’s map. The new proglacial lake was less than 500 m across. The snowline was at 1200 m. In 2000 seen below the snowline was at 1350 m, and the terminus had narrowed more than it had retreated. By 2014 the terminus had retreated 900 m leaving the new Shamrock Lake within Chackachamna Lake. The new Shamrock Lake has an area of 4 square kilometers. This is the majority of the loss in glacier area since 1950 as well. In 2014 the snowline is quite high at 1450 m. A snowline that is consistently above 1300 m will drive continued retreat. Thinning upglacier is evident with expanded bedrock areas adjacent to the glacier margin above 1200 m at the purple arrows, indicating the snowline has been consistently higher than this. The retreat is similar to other glaciers in the region South Sheep Glacier, Sovereign Glacier and Fourpeaked Glacier.  With the glacier retreating out of the lake basin soon, the rate of retreat should decline.

shamrock glacier 2000
2000 Landsat image

shamrock glacier ge 2013
2013 Image of Shamrock Glacier, Shamrock Lake and Chakachamna Glacier.


Mammoth Glacier, Wyoming Ongoing Retreat


mammoth compare

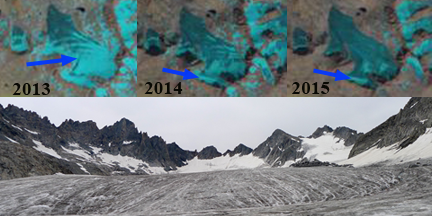
At top Landsat images from September 2013, 2014 and 2015 of Mammoth Glacier.  The blue arrow indicates retained snowcover. A 2013 images of Mammoth Glacier from Sarah Meiser, note low slope and lack of crevassing above

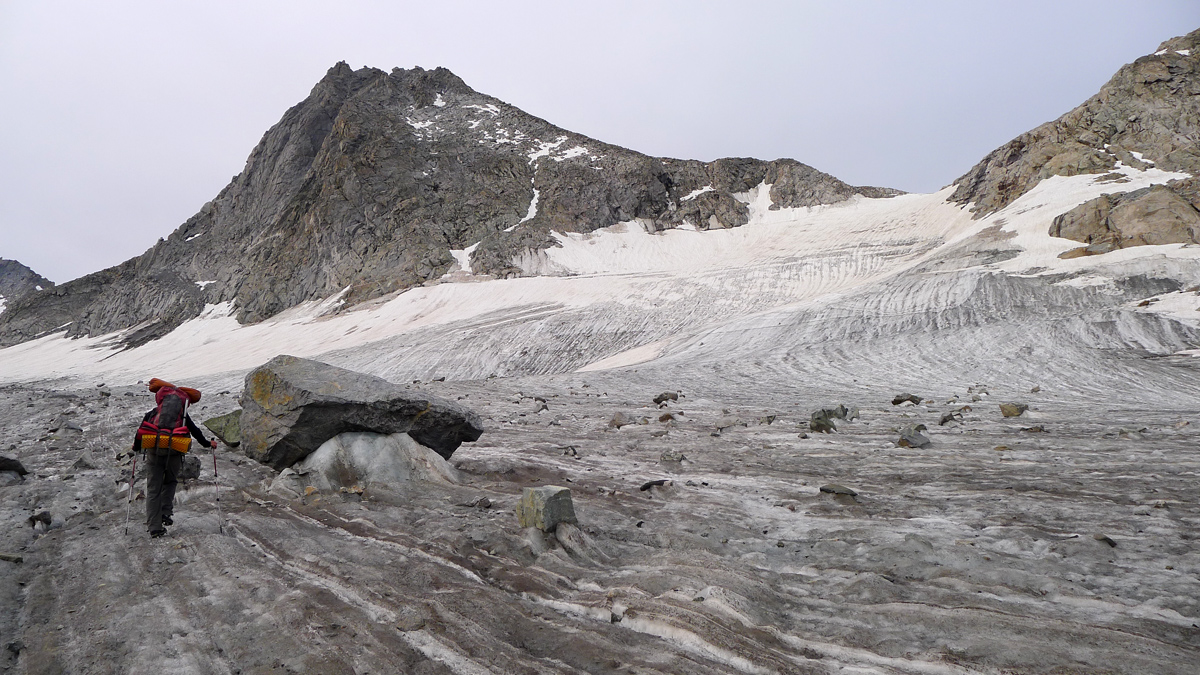
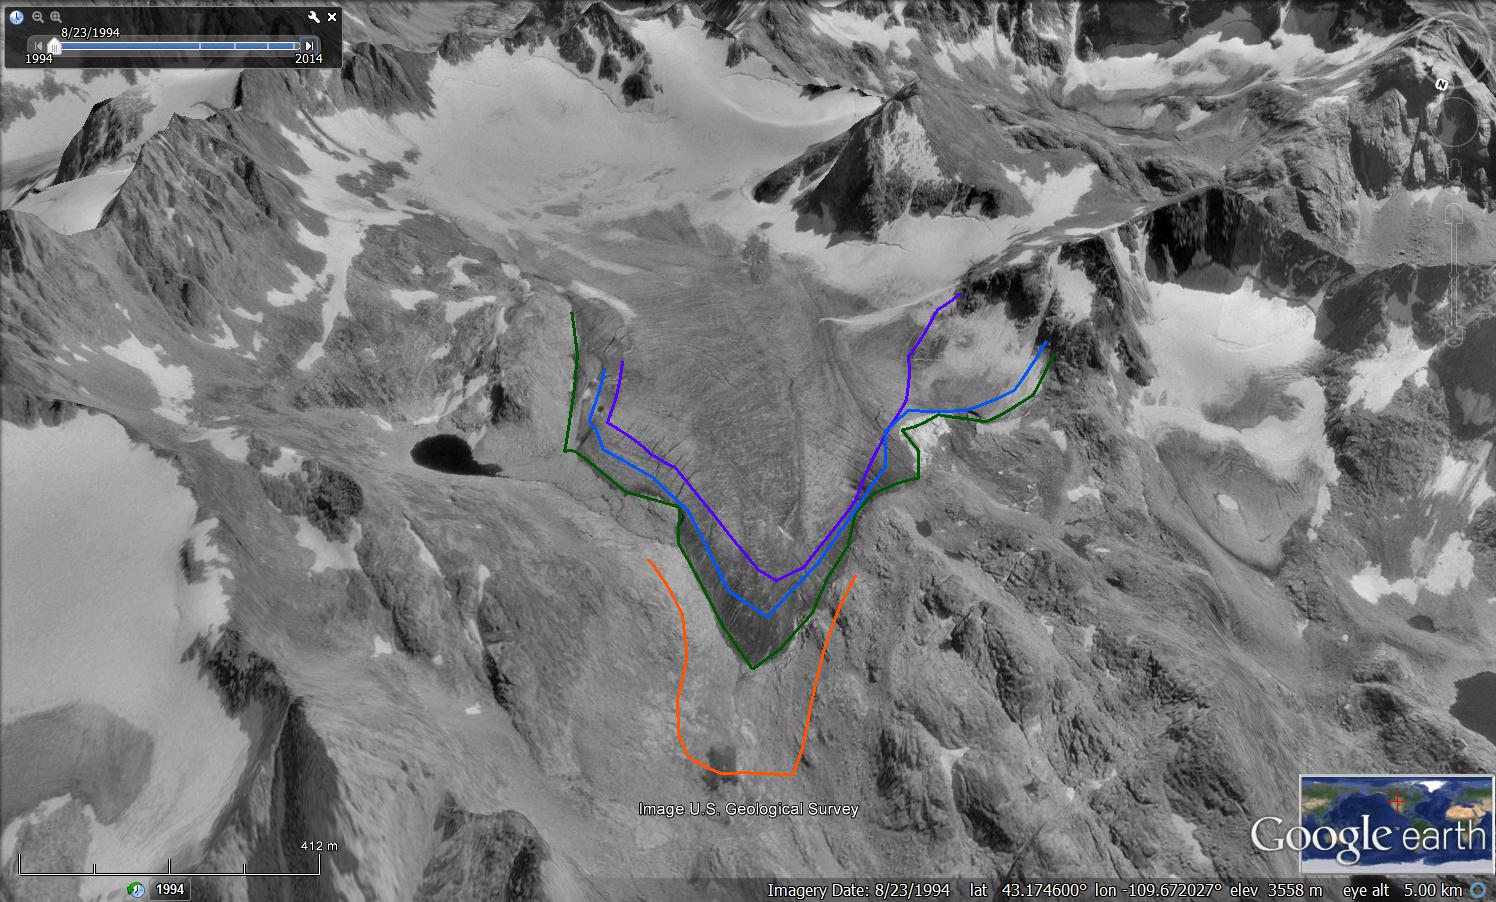
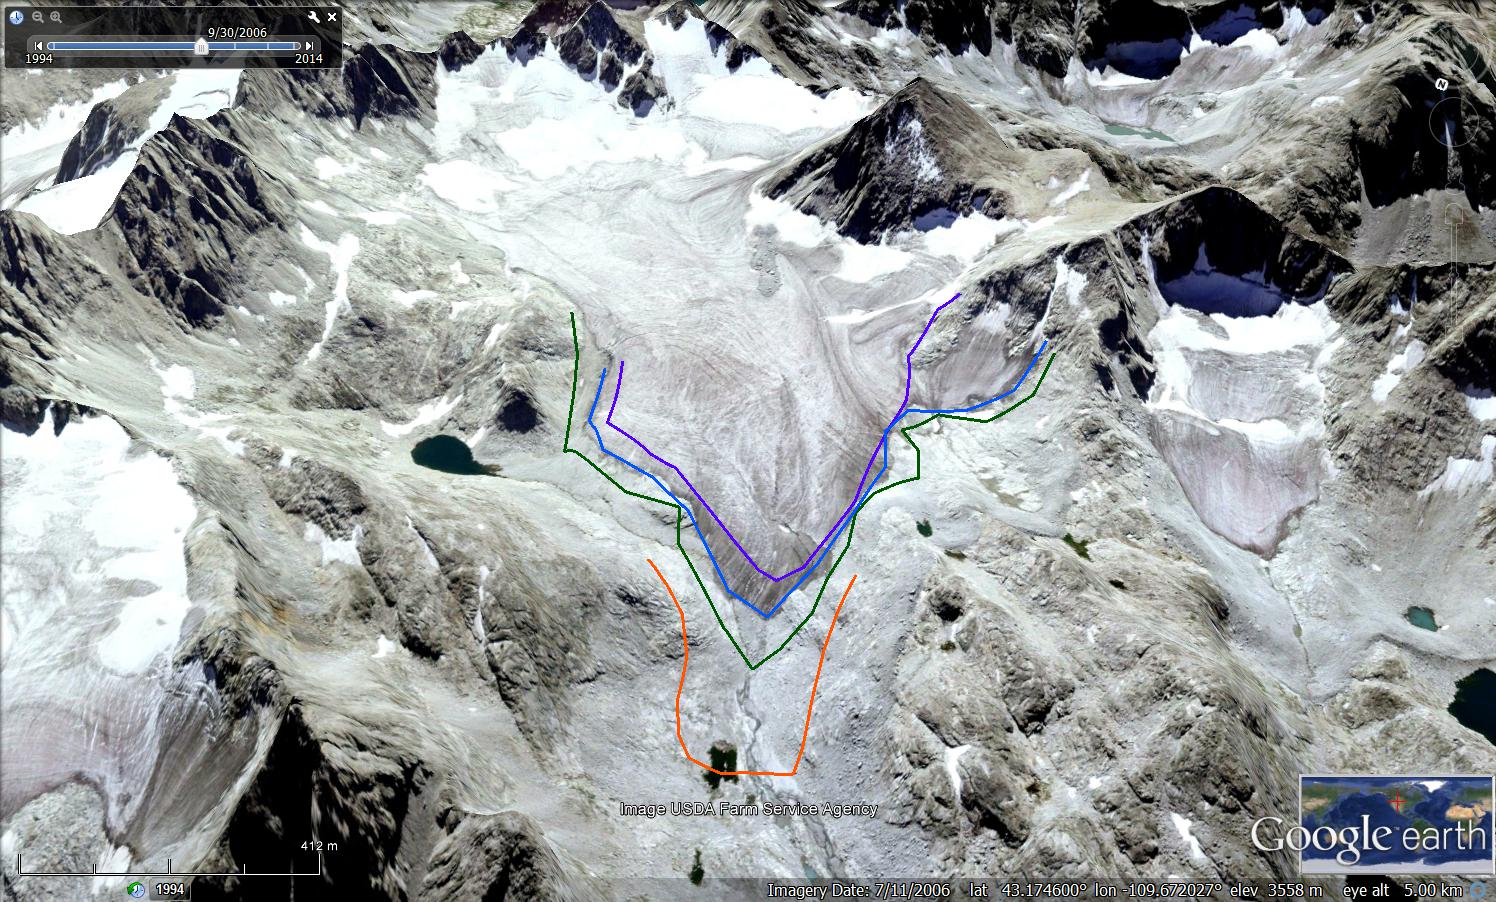
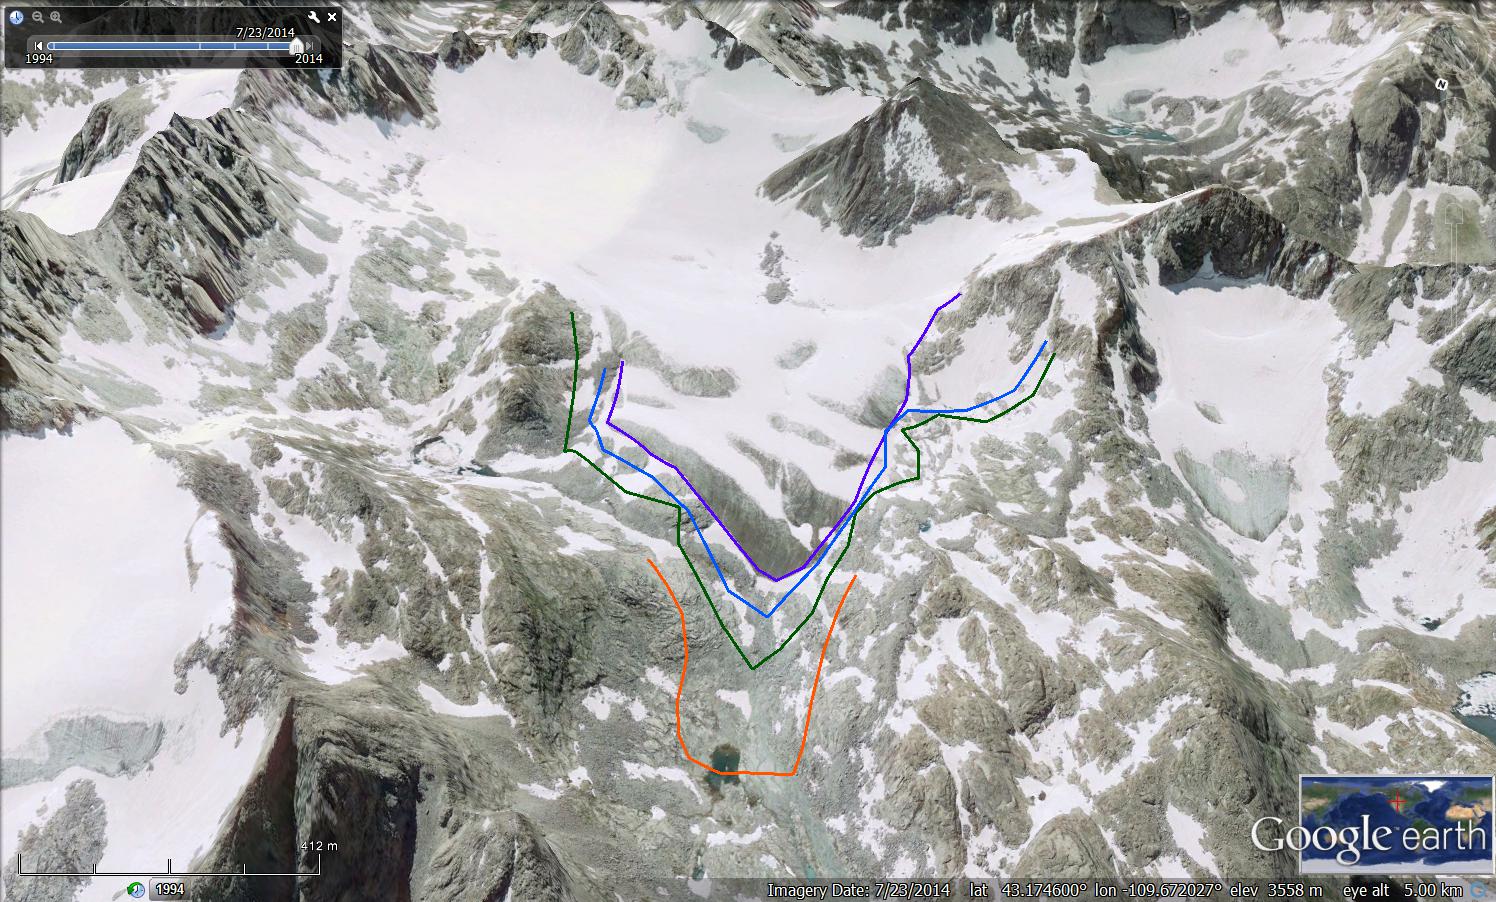
Mammoth Glacier is in the Wind River Range of Wyoming.  The ongoing retreat is leading to a glacier that does not warrant the name mammoth for size, but soon it will for obsolescence.The long and low sloped glacier is the largest west of the Continental Divide in the range. The glacier is at the headwaters of the Green River  and Green River Lakes. The glacier had an area of 4 square kilometers in 1952, 2.1 square kilometers in 2007 and 1.8 square kilometers in 2015.  The Landsat sequence above from 2013, 2014 and 2015 illustrates the problem, insufficient retained snowcover to approach equilibrium, that is also evident in 2006 shown below. The setting is better illustrated with images from Sarah Meiser who I think has the best collection of recent images of Wind River Glaciers. A glacier like Mammoth with limited avalanching needs more than 50% retained snowcover at the end of the summer (accumulation area ratio) to be in equilibrium.  In 2013 with three weeks left in the melt season, the accumulation area ratio (AAR) is slightly below 50%, note Sarah Meisel image below.  In 2014 the AAR is 25 % and in 2015 the AAR is 5-8%.  These periods of sustained bare ice exposure lead to area loss and thinning.  A comparison of Google Earth images illustrate the area loss. In each image the orange line is the 1966 map position, green line 1994 margin, blue line 2006 margin and purple line 2014 margin.  The loss in area at the margin is evident as is the loss on the western side between 2006 and 2014.  Retreat has been 200 m from 1966 to 1994, 95 m from 1994-2006 and 95 m from 2006 to 2014. Area loss after the poor snowcover in 2015 will continue and the glacier will not long be considered mammoth in size.  Pelto (2010) examined glaciers in the Wind River Range and found two-thirds could not survive current climate as they did not have a persistent accumulation zone, including Mammoth Glacier and Sacagawea Glacier. Thompson et al (2011) noted a 38% loss in area of the 44 Wind River Range glaciers from 1966-2006. Maloof et al (2014) noted an even larger drop in volume of 63% of the same glaciers from 1966-2012.


mammoth rocks

 Sarah Meiser image illustrating how close to the top of the glacier the bare ice extends.  This fact indicates that all of the firn had been lost, thus the area shown has not been a recent accumulation area. 

mammoth 1994a

1994 Google Earth Image

mammoth 2006a

2006 Google Earth Image

mammoth 2014

2014 Google Earth image


Sierra de Sangra Glacier Retreat, Argentina

mayer compare

Comparison of four outlet glaciers of Sierra de Sangra in Argentina in a 1985 and 2015 Landsat image.  Read arrow is the 1986 terminus location when all terminated in a lake.  By 2015 only one terminates in a lake, yellow arrows. 

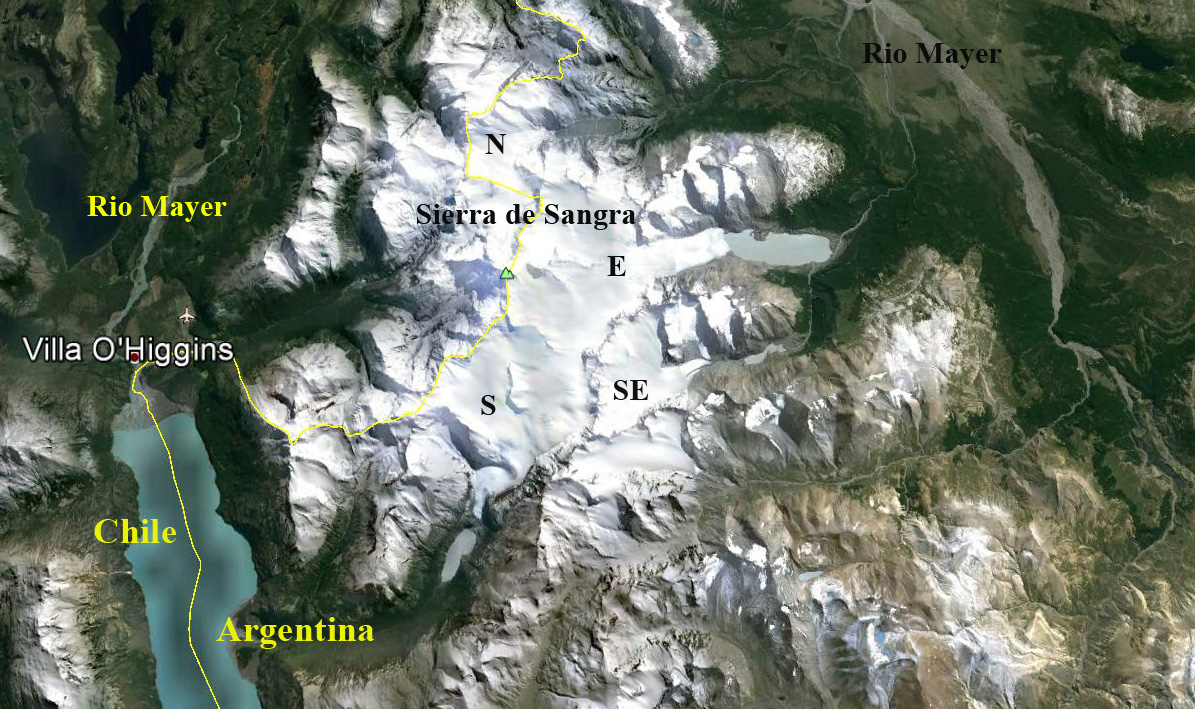
The Sierra de Sangra Range is located along the Chile-Argentina boundary with the east draining glaciers flowing into the Rio Mayer and then into Lake O’Higgins at Villa O’Higgins. Here we examine four glaciers that in 1986 all ended in lakes and by 2015 only one still terminates in the lake. Davies and Glasser (2012) noted the fastest retreat rate of this icefield during the 1870-2011 period has been from 2001-2011. NASA’s Earth Observatory posted an article on this blog post with better resolution images.

mayer ge

Sierra de Sangra is just east of Villa O’Higgins with the crest of the range on the Chile Argentina border. The four glaciers examined here are indicated by S, SE, E and N. 

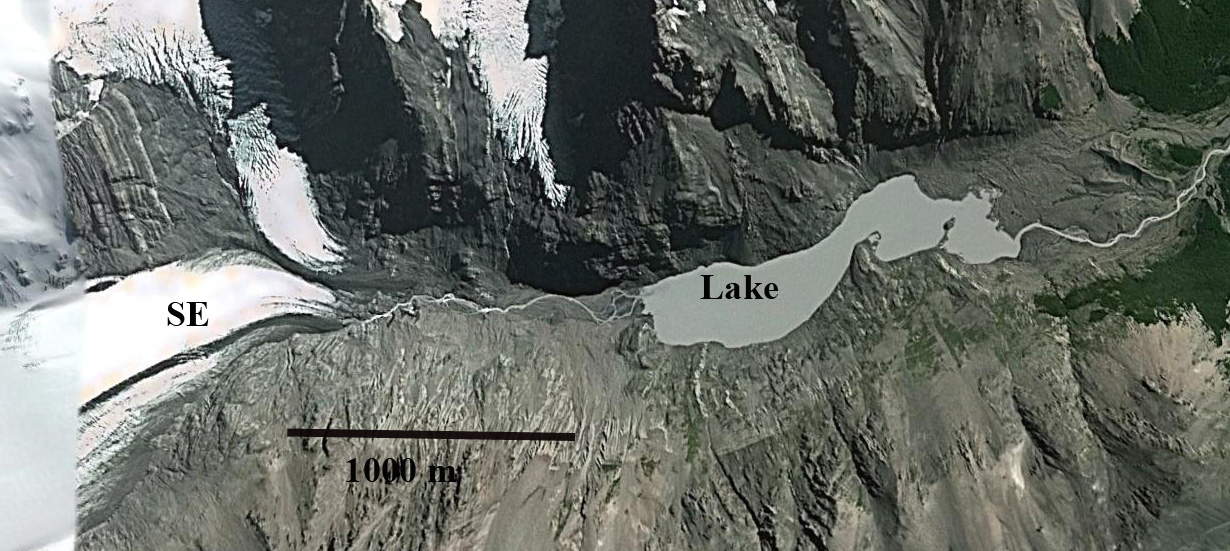
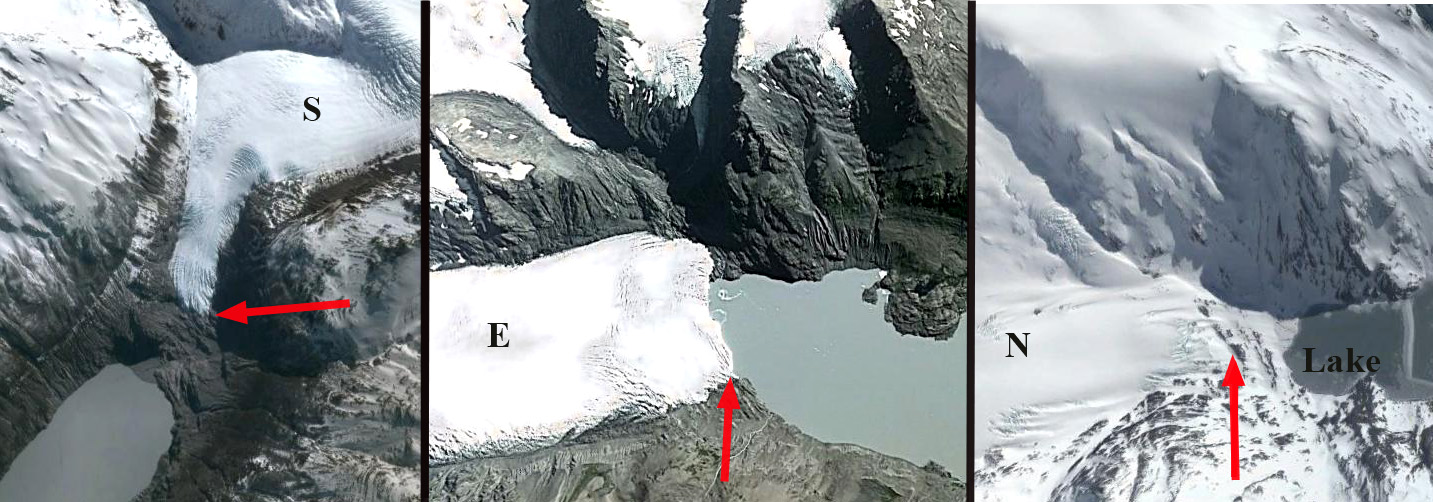
The South Outlet Galcier (S) has retreated 700 m from 1986 to 2015 and terminated in a lake in 1986.  By 2015 it terminates on a steep slope well above the lake.  The Southeast Outlet Glacier (SE) terminates in a lake in 1986.  By 2015 it has retreated 1200 m to a junction with a tributary from the north.  The East Outlet Glacier is the largest glacier and has retreated just 300 m from 1986 to 2015. There is a sharp elevation rise 200 m behind the terminus, which likely marks the end of the lake basin.  This is marked by a crevasse zone.  The North Outlet Glacier (N) ended in a lake in 1986.  By 2015 it has retreated 700 m and ends on a bedrock slope well above the former lake level. All of the glaciers have an accumulation zone in each satellite image examined.  This indicates they can survive present climate. The glacier retreat is not as large as Cortaderal Glacier and Glaciar Del Humo.

mayer terminus

Google Earth images from 2013 of the terminus of three outlet glaciers above and one below.  The red arrow indicates terminus location. Three of the four no longer terminate in a lake. 

mayer southeast

Ampere-Lapparent Glacier Retreat, Kerguelen Island

ampere compare

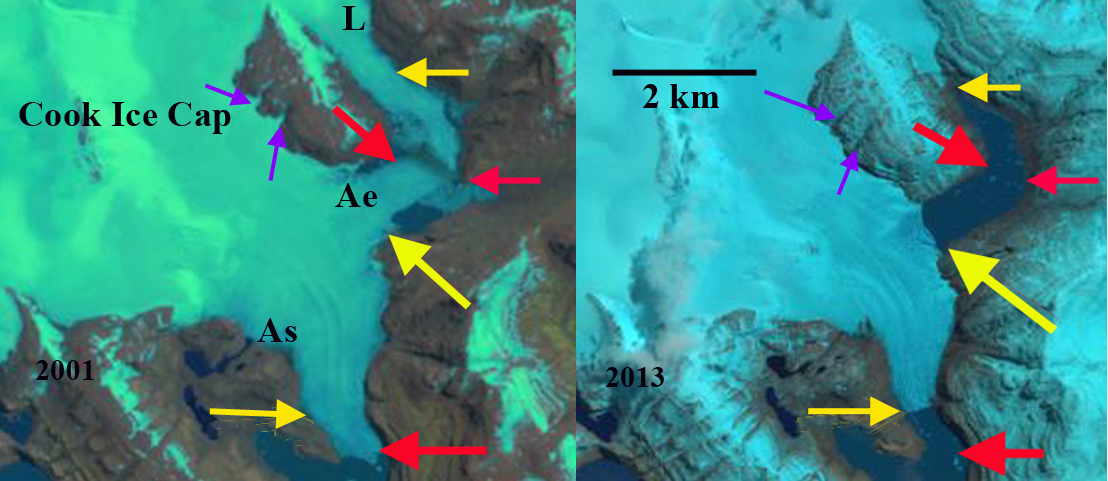
Comparison of Ampere Glacier (A) and Lapparent  Glacier (L) southern outlet glaciers of the Cook Ice Cap in 2001 and 2013 Landsat images; red arrow indicates 2001  terminus locations, yellow arrows 2013 terminus locations and purple arrow upstream thinning.

Kerguelen Island sits alone at the edge of the furious fifties in the southern Indian Ocean. The island features numerous glaciers, the largest being the Cook Ice Cap at 400 square kilometers. A comparison of aerial images from 1963 and 2001 by Berthier et al (2009) indicated the ice cap had lost 21 % of its area in the 38 year period.  Ampere Glacier is the most prominent outlet glacier of the Cook Ice Cap.  Berthier et al (2009) noted a retreat from 1963 and 2006 of 2800 meters of the main glacier termini in Ampere Lake (As). The lake did not exist in 1963. A second focus of their work was on the Lapparent Nunatak due north of the main terminus and close to the Ampere Glaciers east terminus (Ae). The nunatak expanded from 1963-2001, in the middle image below from Berthier et al (2009), but it was still surrounded by ice.  This is dominated by cloudy weather, with not a single good Landsat image of the glacier since 2013, the January 2016 indicates the snowline, purple dots is similar to 2001.

Kerguelen-Island-topo-Map

Map of Kerguelen Island

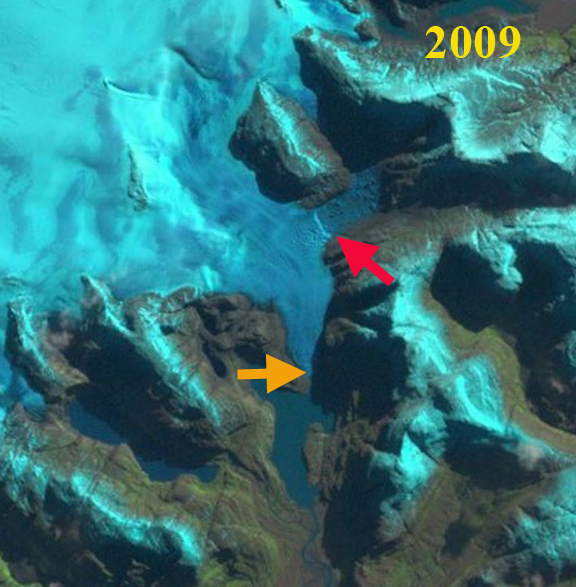
The main terminus has retreated 800 meters from 2001-2013. Here the terminus has pulled back from the tip of the peninsula on the west side of the terminus and is currently at a narrow point.  The eastern terminus has retreated to its junction with the main Ampere Glacier a distance of 1400 m.  Berthier et al (2009) had noted thinning around the Lapperent Nunatak of 150 to 250 m, purple arrows indicate this location of thinning.  Above the current main terminus the valley widens again to the junction with the location of the eastern terminus.  It seems likely the main glacier will retreat north until there is a single terminus north of the southern end of Lapparent Nunatak. Lapparent Glacier was formerly joined with the Ampere Glacier’s eastern outlet.  The comparison of  Landsat imagery from 2001 and 2013 indicate widespread thinning and deglaciation of this glacier.  In 2001 Lapparent Glacier merges with the east terminus of Ampere Glacier at the red arrows with a medial moraine evident.  By 2013 the eastern arm has narrowed from 1100 m to 500 meters and retreated 2100 m in 12 years. The result is less ice flow over a bedrock step just above the terminus. This continued thinning since 2001 will lead to further retreat of the glacier. There is no calving and the rate of retreat will decline. A 2009 Landsat image 2009 and 2013 Google Earth image indicate icebergs stranded in the lake by Lapparent Glacier and the eastern outlet indicating glacier lake drainage lowering the level.

ampere-hd

2009 Landsat image icebergs evident in lake in the upper right.

ampere ge

2013 Google Earth, icebergs at blue arrow.  Highly turbid water in proglacial lakes indicates a recent high flow event.

amperre 2016

2016 Landsat image

Pré de Bar Glacier Retreat, Italy

pre de bar compare

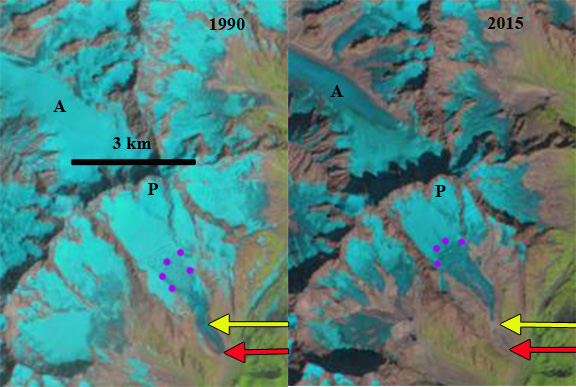
Landsat image comparison from 1990 and 2015 of the Pré de Bar Glacier (P).  The adjacent Argentiere Glacier (A) is shown, the red arrow is the 1990 terminus, the yellow arrow the 2015 terminus and the purple dots the snowline. Retreat from 1990 to 2015 was 

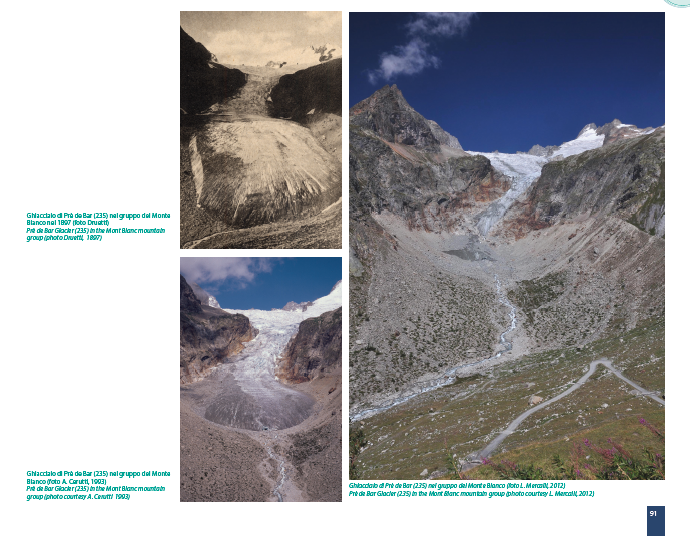
Pré de Bar Glacier is a glacier on the east side of Aiguille de Triolet and south side of Mont Dolent. This is a steep valley glacier that experienced a large retreat during the first half of the 20th century, then advanced from the 1960’s-1980’s, before beginning a retreat again in 1990, that has continued to 2015. In the Landsat images above the 1990 terminus extended approximately 600 m beyond the base of an icefall, forming a substantial low slope terminus lobe.  By 2015 this lobe below the icefall had disappeared and the terminus is now at the base of the icefall, with a net retreat of 550 m since 1990.  With the retreat increasing during each five year increment according to WGMS from 1990-2010 and image analysis here from 2011-2015. The retreat is measured each year by the Italian Glacier Committee  and reported to WGMS.  The New Italian Glacier Inventory that has just been released has reports on each region of glaciers in Italy. For the Glaciers of Aosta Valley it is observed that there are 192 glaciers about 21% of Italy’s total, covering 133.7 square kilometers, 24% less than a half-century ago. This amazing inventory was completed by the Earth Science Department of the University of Milan’s Glaciology staff, led by Claudio Smiraglia and Guglielmina Diolaiuti. On page 91 of the Aosta Chapter is a series of images of Pré de Bar from 1897, 1993 and 2012. The main change from 1993 to 2012 is the loss of the terminus lobe below the narrow icefall.

pre de bar historic

Figure from the New Italian Glacier Inventory of Pré de Bar Glacier in 1897, 1993 and 2012

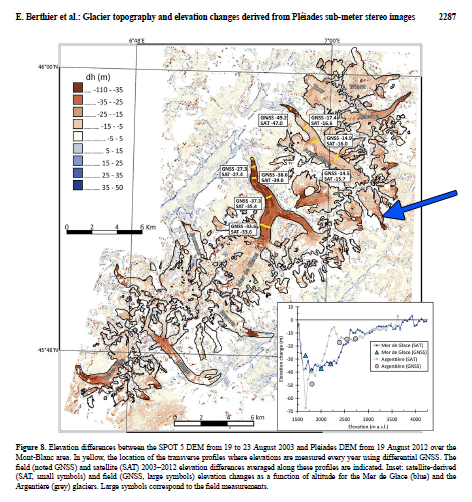
Berthier et al (2014) mapped ice thickness changes in this region from 2003 to 2012 using the Pléiades satellites. They identify a negative Mont Blanc region wide mass balance of glaciers of -1.04 m/year for the 2003-2012 period.  On Pré de Bar Glacier their figure below indicates at least 5 m thinning across nearly the entire glacier, with more than 25 m of thinning in the terminus region below the icefall.  This dramatic thinning largely driven by increasing summer melting. Bonnano et al (2012) identified a long term retreat rate of 3 m per year for the glacier.  However, retreat from 1990 to 2015 is 22 m/year, the WGMS indicates retreat of 404 m from 1990-2010, a rate of 20 m/year.  The rate of retreat incireased from 16 m/year in the 1990’s to 24 m/year in the 2000’s.  The thinning identified by Berthier et al (2014) up to 2012 high on the glacier suggests this will continue.  Note in the image below  from Bonnano et al., (2012) of Pré de Bar Glacier the amount of firn exposed above the ELA particularly on the two easternmost feeders, and the 2015 Landsat image indicates the annual ELA is closer to the end of the black arrows in that image than the red line from 2000.  The pattern of thinning is similar to that of nearby Lex Blanche Glacier, and Glacier d’Argentiere, but Mer de Glace has a much larger relatively low slope ablation zone section with high thinning.

The meltwater runoff from this glacier feeds the Dora Baltea River and eventually the Po River.  The Aosta Valle region hosts extensive hydropower along this drainage including the Avise, Champagne,Nus, Montjovet, Isollaz, Chatillon, Verras, Hone and Ivrea.

mont blanc thinning

Figure from Berthier et al (2014) indicating thinning of Mont Blanc Glacier 2003-2012, Pre de Bar Glacier noted with blue arrow.

Pre-de-Bar
Pre de Bar Glacier in 2000 showing the ablation zone, accumulation zone, ELA, glacier front this is from Bonnano et al (2012)


Where is the snow at Nup La, 5850 m, West Rongbuk Glacier?

nup la 1516

Landsat image from January 4, 2016 indicating the actual Nup La (N).  Purples dots is the snowline. Green arrows are expanding bedrock exposures and pink arrow a specific rock know amidst the glacier.

Nup La at 5850 m is on the Nepal-China border and is the divide between the West Rongbuk Glacier and the Ngozumpa Glacier.  The pass should be part of the accumulation zone of both glaciers.  In recent years including currently this has not been the case, this past Christmas was not a white one at the pass.  Our attention is often focused on the more easily viewed terminus of a glacier, and both of these glaciers are retreating. The changes higher on the glacier can have more far reaching implications. Bolch et al (2011) observed strong thinning in the accumulation zone on nearby Khumbu Glacier, though less than the ablation zone . This can only happen with reduced retained snowpack particularly in winter.  This has occurred with increasing air temperatures since the 1980’s. Mean annual air temperatures have increased by 0.62 °C per decade over the last 49 years; the greatest warming trend is observed in winter, the smallest in summer (Yang et al., 2011). The glaciers in the area are summer accumulation type glaciers with 70% of the annual precipitation occurring during the summer monsoon. There is little precipitation early in the winter season (November-January). The limited snowpack with warmer winter temperatures have led to high snowlines during the first few months of the winter season in recent years. Here we examine Landsat images from 1992 to 2016 to observe changes in the snowline during the early winter period.
In January of 2016 the snowline is at 6100 m, which is well above Nup La and the divide between West Rongbuk and Ngozumpa Glacier.  The green arrows indicate three areas of expanding bedrock exposure occurring over the last 15 years.  This indicates thinning in this region of 5700-6000 m, which should typically be the accumulation zone.  In December 2015 three works prior to the 2016 image the situation is the same.  In November 2014 the snowline is lower at 5750 m.  In 1992 the snowline is at 5600 m, and the bedrock areas at the green arrows are reduced from above.  In November 2000 the snowline is at 5450 m and in November 2001 it is at 5600 m.  In all images prior to 2012 the snowline does not reach the region around Nup La above 5700 m during the early winter period.  In recent years the snowline has remained high, above 5700 m, significantly into the winter season almost every year, and in 2015/16 remains high three months into the winter season. This is an indication of an extended period after the summer monsoon, in which not only is snow not accumulating, but ablation can occur mostly via sublimation at elevations of Nup La. The thinning resulting has caused the expansion of bedrock areas at the green arrows and at the pink arrow.

nup la region
Google Earth image of the region indicating Nup La (N), Wests Rongbuk Glacier (WR), Rongbuk Glacier (R), Ngozumpa Glacier (Ng) and Khumbu Glacier on Mount Everest (K)

nup la dec2015
December 2015 Landsat image indicating the actual Npu La (N).  Purples dots is the snowline. Green arrows are expanding bedrock exposures and pink arrow a specific rock know amidst the glacier.

nup la 11202014
November 2014 Landsat image indicating the actual Npu La (N).  Purples dots is the snowline. Green arrows are expanding bedrock exposures and pink arrow a specific rock know amidst the glacier.

nup la oct92
October 1992 Landsat image indicating the actual Npu La (N).  Purples dots is the snowline. Green arrows are expanding bedrock exposures and pink arrow a specific rock know amidst the glacier.

nup la oct2001
November 2000 Landsat image indicating the actual Npu La (N).  Purples dots is the snowline. Green arrows are expanding bedrock exposures and pink arrow a specific rock know amidst the glacier.

nup la 10152000
November 2001 Landsat image indicating the actual Npu La (N).  Purples dots is the snowline. Green arrows are expanding bedrock exposures and pink arrow a specific rock know amidst the glacier.

nup la 2014
Google Earth image indicating flow paths at Nup La.


Murchison Glacier, New Zealand Rapid Retreat Lake Expands 1990-2015

murchison compare

Murchison Glacier change revealed in Landsat images from 1990 and 2015.  The red arrow indicates 1990 terminus location, the yellow arrow indicates 2015 terminus location and the purple arrow indicates upglacier thinning.

Murchison Glacier is the second largest in New Zealand.  The glacier drains south in the next valley east of Tasman Glacier and terminates in a lake that is rapidly developing as the glacier retreats. The lower 6 km section  is debris covered, stagnant, relatively flat and will not survive long. There was not a lake in the 1972 map of the region.  In 1990 the newly formed lake was limited to the southeast margin of the terminus . From 1990 to 2015 the terminus has retreated 2700 m. A rapid retreat will continue as 2010, 2013 and 2015 imagery indicate other proglacial lakes have now developed 3.5 km above the actual terminus. These lakes are glacier dammed and may not endure but do help increase ablation, and in the image below show a glacier that is too narrow to provide flow to the lower 3.5 km. The demise of the lower section of this glacier will parallel that of Tasman Glacier.  The expanding lake will continue to enhance the retreat in part by sub-aqueous calving noted by Robertson et al (2012) on nearby glaciers. The increased retreat has been forecast by the NIWA and Dykes et al (2011). The glacier still has a significant accumulation area above 1650 m to survive at a smaller size.  The ongoing retreat is triggered by warming and a rise in the snowline in the New Zealand Alps observed by the NIWA. Notice the changes upglacier indicated at the purple arrows above, where tributary flow has declined, bedrock areas in accumulation zone have expanded and the snowline is higher.  Gjermundsen et al (2011) examined the change in glacier area in the central Southern Alps and found a 17% reduction in area mainly from reductions of large valley glaciers such as Murchison Glacier.

mucrhison terminus reach compare

Terminus reach of Murchison Glacier in Google Earth images from 2007 and 2013.  Note expansion at pink arrow on the terminus lake and the development of proglacial lakes 3.5 km upglacier at blue arrows.

The Feb. 2011 earthquake near Christchurch led to a major calving event of a portion of the rotten stagnant terminus reach of the Tasman Glacier. There was no evident calving event from Murchison Glacier.This has led to increased exposure of bedrock high on the glacier and reduction of tributary inflow noted at purple arrows.

Murchison Glacier drains into Lake Pukaki,a along with Hooker, Mueller and Tasman Glacier, where water level has been raised 9 m for hydropower purposes. Water from Lake Pukaki is sent through a canal into the Lake Ohau watershed and then through six hydropower plants of the Waitaki hydro scheme: Ohau A, B and C. Benmore, Aviemore and Waitaki with a combined output of 1340 MW.  Meridian owns and operates all six hydro stations located from Lake Pūkaki to Waitaki. Reductions in glacier area in the watershed will lead to reduced summer runoff into the Lake Pukaki system. Below the Benore Dam is pictured,.  Interestingly salmon have been introduced into the Waitaki River system for fishing near its mouth. Benmore Lake itself is an internationally renowned trout fishing spot, providing habitat for both brown trout and rainbow trout.

benmore dam

Google Earth Image with Benmore Dam in foreground and Benmore Lake.  This hydropower system is fed by a canal from Lake Pukaki which in turn is fed by Murchison Glacier.