Russell Glacier, Greenland Rapid Snowline Rise K-Transect 2015

kang runoff
Landsat Image based Watson River discharge sequence June 14-July 8, 2015

It was 30 years ago I first participated in Greenland Ice Sheet research, there was not much of it at the time.  However, there was the recognition of the importance for sea level rise with global warming, and this was driving an increase in research at that time. The level of research has increased exponentially in the last decade. One long standing and remarkable program that indicates the long term thinking that has helped us develop an understanding of ice sheet changes, is the K-Transect of ablation stakes emplaced in the Russell Glacier Catchment.  Here we examine the changing snowline from Mid-June to early July of 2015, as well as the longer term record.  The Institute for Marine and Atmospheric Research Utrecht has maintained the best long term field based ablation record on the GIS, the K-Transect. This resulted in  van de Wal  et al., (2012) reporting on 21 years of surface mass balance in the region.  At one site, S9 (1520 m) near the equilibrium line altitude (ELA), the long term record indicates a rise in the ELA in recent years, see figure below, and a more negative surface mass balance. This record has also been crucial in helping to build surface mass balance models for the GIS. The results updated daily from one such model, is at the Polar Portal, maintatined by the DMI – Danish Meteorological Institute, GEUS – The Geological Survey of Denmark and Greenland and DTU Space – National Space Institute. This summer the Automatic Weather Station on this transect Kan M, at 1270 m did not experience temperatures above 0 C until June 19th and they have been consistently above that since, (PROMICE, 2015).  At S9 temperatures have been reaching 4 C most days in July (IMAU, 2015).

So Thank You to PROMICE, Polar Portal, IMAU, NASA and others for the remarkable progress and sharing of data.

k transect map
K-Transect map from van As et al (2012)

kang ela
Surface mass balance at S9 on the K-Transect from van de Wal (2012).
Supraglacial lakes were mapped in detail for the period by Fitzpatrick et al (2014), who found the lakes were forming several weeks earlier in 2010-2012 and at higher elevations than before.  They also observed as seen in graph below that Watson River except for in 2010 had a distinct rise in flow in mid-July.  Notice the lag between initial melt that fills lakes, volume loss shown, and the rise in Watson River.
watson river
Watson River discharge and lake volume loss in K-Transect region from Fitzpatrick et al (2014)

This all played out in the last few weeks.  The melt season was off to a slow start in 2015 as indicated both by the Polar Portal and Landsat imagery, note on June 14th that lakes beyond the GIS had ice cover still, the snowline was at 750 m, blue dots, with spotty snow patches below this. The lack of melt in also evident in the lack of supraglacial lakes.  Note the lack of discharge in Watson River, pink arrow. By June 29th melt had begun in earnest with the snowline moving inland 25 kilometers and rising to 1150 m.  Discharge was greater, but still limited in Watson River.  The main belt of supraglacial lakes, red arrow was at m. By July 8th, the snowline had moved more than 50 km inland since June 14th to an altitude of 1450 m.  This is close to S9.  The snowline is not the ELA on the GIS as there are zones of superimposed ice below the snowline.  However, with the transient snowline this high in early July, the ELA will inevitably be higher than S9 at 1520 m.  The discharge in Watson River will continue to rise and become more variable as the glacial hydorologic system matures van As et al (2012). This post will be updated with imagery from later in the 2015 ablation season.
gismelt2015
Surface Mass Balance from model data

kang 164
June 14, 2015 Landsat Image

kang 180
June 29, 2015 Landsat Image
<a href="http:/
kang 189July 8, 2015 Landsat Image

kang ge
Google Earth image showing late summer discharge of Watson RIver.

Big Four Glacier & Ice Caves, WA: a short future?

The Big Four ice caves area popular hiking destination 90 minutes northeast of Seattle in the North Cascades.  This ice mass is currently the lowest elevation glacier in the lower 48 states. It is fed by tremendous avalanching from higher on Big Four Mountain.  During the winter the snow piles up on the avalanche fan.  In the summer the waterfall from above carves tunnels under the snow-ice mass.  At some point in June or July the tunnels are enlarged enough to allow people, but also warm air to enter.  This leads to further tunnel expansion.  In warm summers the tunnels get large enough by late summer that collapses of the roof occur.  Unfortunately this year the caves are already in late summer form and an expected collapse tragically led to the 1 person killed and five injured this week.  Here we examine the formation and now demise of this odd glacier in the last decade. There are no pictures of the ice caves in this post, as it is not a place to enter this year.

The 1999-2002 period featured heavy winter snowpack and avalanching boosting Big Four.  The summer of 2003 was the first of three cruel seasons to Big Four.  In this image you cannot note the blue case to all but the very top of the avalanche cone, indicating it is older snow.  There is further two layers that look  to be annual layers on the right side of the image.  This suggests to me, the base is a 1999, layer, than a 2000 layer, than a broader dirty band and a 2002 layer, followed by a 2003 snowpack,.  The summer of 2001 was warm and no snowpack would have survived, causing the wider dirt band. In 2003-2005 a series of dismal winters and warm summers led to the near total loss of the Big Four Avalanche fan, at this point it was not a glacier.

From 2006-2012 a series of good summers led to redevelopment, which prompted David Head to contact me to investigate in 2009 if it was a glacier.  He provided a series of images from 2005-2008 indicating the changes.  We then headed to the glacier in 2009 to investigate in detail. In 2009 we mapped the glacier, from above and below. We found it had an area of 0.07 square kilometers, the glacier had a center length of 370 m, had a width at the toe of 270 m, an average slope of 22 degrees an average depth of 32 m a maximum depth of 55 m, and a volume of ~2 million cubic meters. There was blue glacier ice evident and a few crevasses on the upper portion. It was a glacier. The glacier gained at least 30 m in thickness over the majority of its area from 2005-2008, which is an extraordinarily short period. This year for the first time no avalanches reached the avalanche fan. Last summer was at record warmth, with the snowmass ablated to its smallest extent since 2005. The ice cave entrances were wide with a rainbow shaped arch, not an engineering setup for stability. This did not change over the winter. Hence, it is like having two summers in a row without winter. Contrast the June 2008 image to April 2015 (from Kellbell), quite a difference. There is no snow on Big Four even in April this year, the blue glacier ice is exposed and ablating starting then. The ice mass is rapidly ablating in the warm early summer of 2015 and will reach its smallest size since 2005 by the end of the summer. It is likely too thick to melt it all this year, but it may well surpass the 2005 minimum size. It will no longer be a glacier by the end of the summer. That is unusual to watch a glacier form and melt away in a decade. There will be more collapses in the ice caves this summer as it recedes to a meager size.

big four time lapse

2003-2007 Time lapse of Big Four
big four June 2008
June 2008 image
big four 10202008
October 2008 image
big four 2009
August 2009 image

big four20150327
April 2015 (Kellbell)

Otemma Glacier Retreat & Snowline Rise, Switzerland

Otemma Glacier is in the Upper Rhone River watershed and feeds Lac de Mauvoisin. Climate change is altering this glacier, with terminus change not being the main story it is the rising snowline and separation from tributaries. The lake fed by the glacier is impounded by Mauvoisin Dam one of the 10 largest concrete arch dams in the world. The reservoir can store 200 million cubic meters of water. The dam provides hydropower and protection against natural hazard. In 1818, an advance of the Gietro Glacier, now retreated high above the reservoir, generated ice avalanches which blocked the flow of the river. When the ice barrier was breached, 20 million cubic meters of flood water was released devastating the valley (Collins, 1991).There are several other large glaciers in the basin Gietro, Mont Durand and Brenay that provide runoff to power what is today a large hydropower project. The Mauvoisin Dam can produce 363 MW of power.

Otemma Glacier is one of the glaciers where the terminus is monitored annually by the Swiss Glacier Monitoring Network (SCNAT). Here we examine changes in this glacier from 1985 to 2014 including changes in the terminus, snowline elevation and tributary connection during this period using Landsat Imagery. SCNAT reports that the glacier retreated at a rate of 27 m/year from 1985-1999, to 40 m/year from 2000-2014.
otemma glacier gearth
Google Earth view of the glacier indicating glacier flow direction.

In 1985 the glacier terminates at the yellow arrow, with tributaries A,B & C all joining the main glacier. The snowline is at 2800 m, green dots. In 1988 the snowline extends to the divide with Bas Glacier d’Arolla at 3050 m. In 1999 the snowline also extends to the divide with Glacier d’Arolla. Tributary A no longer connects to the glacier, pink arrow, and the terminus has retreated 300 m.

By 2013 Tributary B is also detached from the main glacier (orange arrow). The terminus has retreated to the red arrow a distance of 1010 m over the thirty year period. The snowline in 2013 and 2014 almost reaches the divide with Bas Glacier d’Arolla with a few weeks left in the ablation season. The area of persistent snowcover is thus restricted to the region above 3050 m. This region is not large as the Bas Glacier d’Arolla captures most of the upper basin. That the snowline is consistently reaching the highest divide for this large glacier is noteworthy. The retreat of the large valley tongue of Otemma Glacier will remain rapid given the consistent high snowlines indicative of limited retained accumulation. Even with current climate not much of the Otemma Glacier can survive. The rising snowline is observed on most glaciers including nearby Rutor Glacier, Italy.

otemma 1985
1985 Landsat Image
otemma 1988
1988 Landsat Image
otemma 1999
1999 Landsat Image
otemma 2013
2013 Landsat Image
otemma 2014
2014 Landsat Image

Disintegration of Pramecou Glacier, France

Pramecou Glacier is on the Dome de Pramecou above the Grande Motte Glacier, which is a key portion of the Tignes Ski area in France. The Grande Motte area is open for summer skiing this year from June 27th to Aug. 9th. The glaciated landscape in this area is changing dramatically, Gardent and Deline, (2011) noted a 33% loss in glacier area since the 1960’s. The Tignes Ski area has responded by adding snowmakers for the lower portion of Grande Motte Glacier. In the hot summer of 2015 the melt is still causing issues for skiing at Tignes. Here we examine the impact on Pramecou Glacier and Grande Motte Glacier.

STGM Ski été automne 18
Grand Motte Summer Glacier Ski Map
pramecou map
Topographic map of area.

In 2006 the Pramecou Glacier had separated into three sections that did not retain snowcover, each outlined with black dots in Google Earth image below. This had been the case in 1999 and 2003 as well losing all of the snowcover.   In the 1988 Landsat image below the Grande Motte Glacier west terminus is at the green arrow at the top of a steep slope that falls to the Rosolin Glacier below.  The yellow arrow is the east terminus ending at the base of a rock knob yellow arrow.  Points A and B are along the margin of the Grande Motte Glacier.  The pink arrow indicates the Pramecou Glacier that consists of the larger two segments still merged. In 1999 the Landsat image indicates the loss of snowcover on both glaciers and the near separation of the two main Pramecou sections. The Grande Motte terminus has not retreated noticably yet. The 2002 Landsat image indicates the west terminus of the Grande Motte Glacier has retreated from the green arrow.  There is only modest thinning and marginal change at Point A and B.

The large change occurs between 2002 and 2014.  By 2014 both the east and west terminus of Grande Motte have retreated from the yellow and green arrows.  Each has retreated 200-250 m since 1999.  The larger change is the thinning evident at Point A and B. At Point A a large area of rock has been exposed extending from the north margin well into the glacier.  At Point B thinning has exposed a much wider ice free belt along the northern margin of the glacier.  At Point C the northeast ridge of  Grand Motte bare rock area is expanding.  It is clear the Pramecou Glacier will quite soon be lost.  The Grande Motte Glacier is thinning along its upper margins and is losing its snowcover by summer’s end, both are signs of a glacier that cannot survive (Pelto, 2010).  That is unless the Tignes ski area takes greater measures to preserve the glacier. This trend is following the behavior of Glacier Blanc and Mer De Glace. Those larger glaciers are not currently threatened, as these are with melting away.

pramecou image
2006 Google Earth image of Pramecou Glacier segments

Pramecou 1988
1988 Landsat image

pramecou 2014
1999 Landsat image

pramecou 2002
2002 Landsat image

pramecou 2014real
2014 Landsat Image

pramecou ge
2006 Pramecou Glacier and Grande Motte Glacier

Rutor Glacier, Italy Retreat and Rising Snowline

The Rutor (Ruitor) Glacier is one of the 10 largest in Italy and is on the France-Italy border draining into the Aosta River valley.  The glacier has three termini with the main terminus being the eastern one. The position of the glacier snout has been surveyed though not every year by the Italian Glaciological Committee since 1900. The glacier has a long series of terminus and volume observations compiled by Villa et al (2007) at the University of Milano-Bicocca, that indicate a 27% loss in area from the LIA maximum in the mid 19th century to 1975.  The glacier than increased slightly (1%) to 1988, followed by a loss of 5% from 1988 to 2004 (Villa et al, 2007). They further observe that the equilibrium line altitude (height of snowline at end of summer) was 2775 m during the Little Ice Age and 2850 m during the 1975-1992 period. Here we examine landsat imagery from 1988 to 2014 to identify the current trend in both ELA and terminus change.
ruitor ge 2011
Google Earth image indicating the three terminus of the Rutor glacier, arrows indicate 1988 terminus position, dots the 2011 terminus position of each.

In 1988 the eastern terminus, green arrow, had expanded slightly occupying the same location as it had in 1975, this left a trimline do the lack of retreat from 1975 to 1991, the area down valley had been deglaciated an additional 20 years. All three termini descended below 2600 m in 1988. The eastern and central terminus (yellow arrow) were separated by only 400 m. There was a small nunatak shortly above the terminus between the central and western (pink arrow) terminus. By 2014 a lake, red arrow, has formed due to retreat of the eastern terminus. The retreat is 500 m. Additionally between the eastern and central terminus the glacier margin has pulled back from a series of bedrock knobs. The central terminus, yellow arrow, has receded 400 m, and no longer reaches the lower slope foreland below 2650 m. The nunatak between the central and western terminus is now a substantial bedrock knob beyond the glacier margin. the western terminus has receded the least 300 m, but this is a greater percentage of the full length of the glacier feeding this terminus. Further there is negligible retained snowpack in 2014. The 2011 Google Earth image has stagnant areas evident at the terminus, red arrows, that lack of crevassing or other features of movement.

The snowline in 2014, red dots, extends east and west from a prominent rib, and is at 3000-3050 m. In 2011  the snowline is at 3050 m-3100 m and in 2013 the snowline is at 2950-3000 m.  The average snowline of the last four years is 150 -200 m higher than during the 1975-1991 period and 250 m higher than during the LIA.  This is substantial and will drive further continued rapid retreat.  This is the same climate that is driving retreat throughout the Alps from Verra Grande Glacier to Sabbione Glacier to Presena Glacier, that needed a blanket.

rutor Glacier 1988
1988 Landsat image
rutor Glacier 2014
2014 Landsat image
ruitor terminus
Google Earth image of new lake formed and retreat of eastern terminus
rutor 2011
2011 Landsat image

rutor 2013
2013 Landsat image

Gepatsch Glacier Retreat, Austria 1984-2013

Gepatsch Glacier (Gletscher), Austria the runoff from this glacier drains into the Gespatsch Reservoir, which has a storage volume of 140 million cubic metres of water and an annual electricity production of 620 million kwh. The glacier is Austria’s second largest with an area of over 16 square kilometers. The adjacent Weißsee-Kaunertal Gletscher is host to Kaunertal Gletscher ski area and in the summer a key destination of the Gletscherpark.  The ski area map below indicates several lifts on the Weißsee-Kaunertal Gletscher. This glaciers retreat will reduce summer water supply to the reservoir, as it provides 50 million cubic meters of runoff each summer. With climate change that runoff will no longer peak in the warmest-driest part of the summer. The retreat is similar to that of Obersulzbachkees, Austria the third largest in Austria.

kaunertaler-gletscher_trail_map_l3 (1)
Ski Area Map

gepatch 2007

2007 Google Earth image

In 1985 the glacier terminated at the red arrow, expanding across the bottom of the valley where it turns south. The Weißsee-Kaunertal Gletscher terminus is at the blue arrow and the snowline is just above the icefall at the purple dots.  In 1990 there is little evident change, the snowline is higher above the icefall, the glacier in fact ended a decade of advance in 1988. By 2000 Gespatch Gletscher has retreated 200-300 meters from the red arrow. Weißsee-Kaunteral Gletscher has retreated 100-150 m from the blue arrow.  In 2010 most of the glacier has lost its snowcover, which was frequently the case from 2000-2010.  The terminus has retreated up the westward oriented side valley several hundred meters.  There is essentially no snow on the Weißsee-Kaunertal Gletscher.   By 2013 Gepatsch Gletscher has retreated 800-900m from its 1985 position, with most of the retreat since 1990. Much of this retreat occurred from 2010-2013 of 240 m of retreat and another 120 m in 2014, 52 meters per year, as noted in the annual reports of the Austrian Alpine Club glacier report completed by Andrea Fischer each year (Fischer, 2015).

It is evident in the 2003 Google Earth image that rapid retreat was imminent as the terminus of the galcier was stagnant. The Weißsee-Kaunertal Gletscher has retreated 300 m and has thinned even more from 1990-2013.  The   Alpine club also observes this glacier and notes typical retreat rates in the last five years ranging from 15-25 meters/year.   Given the ski lifts emplaced on this glacier, continued thinning and retreat will increasingly impact ski area operation.  The ski area has not resorted to artificial means to sustain Weißsee-Kaunertal Gletscher as has been done at nearby Pitzal Glacier ski area.

gespatch 1985
1985 Landsat Image

gespatch 1990
1990 Landsat Image

gespatch 2000
2000 Landsat Image

gespatch 2010
2010 Landsat Image

gespatch 2013
2013 Landsat Image

gepatch terminus 2003
2003 Google Earth Image
weissee lifts
Google Earth Images ski lifts evident as the linear feature on the nearly snowless galcier. 

Weisee 2003

Slender Glacier, Brooks Range, Alaska: Rapid Retreat 1992-2014

Slender Glacier is not an official name, but a well suited name to this glacier in the Romanzof Mountains of the Brooks Range of Northern Alaska.  It is adjacent to the Okpilak Glacier and drains into the Okpilak River, which is host to arctic grayling. Here we examine Landsat imagery from 1992-2014 to identify changes. U-Alaska-Fairbanks has an ongoing program in the nearby Jarvis Creek Watershed examining in part how will the anticipated future increase in glacier wastage and permafrost degradation affect lowland hydrology.  Matt Nolan (U-AK-Fairbanks) reports on changes of nearby McCall and Okpilak Glacier. These glacier have suffered increased mass loss since 1990 as a result of an increase in the equilibrium line altitude that has reduced accumulation area and is indicative of increased ablation (Delcourt al , 2008)

mt_michelson-1956
USGS 1951 map

In 1992 the glacier extended downvalley to the red arrow at 1530 m. The glacier also received contribution from a tributary glacier at Point A. By 2002 the glacier had receded a short distance from the red arrow and still received input from the tributary glacier at Point A. By 2013 the glacier had receded to the yellow arrow 1100 meters from the 1992 terminus position, and now terminates at an altitude of 1675 m. The tributary glacier is no longer connected to Slender Glacier at Point A. The percent of snowcover is better than on Okpilak Glacier immediately to the west, or East Okpilak Glacier to the southeast. The first tributary entering the glacier on the east side is also disconnecting from Slender Glacier.   In 2014 the Landsat image is after a light snowfall that has endured only on the glacier ice, helping outline the glaciers. The continued decline in retained snowfall and contributed snowfall from tribuatry glaciers will lead to an even more slender glacier.

slender glacier 1992
1992 Landsat Image

slender glacier 2002
2002 Landsat Image

slender glacier 2013
2013 Landsat Image

slender glacier 2014
2014 Landsat Image

Google Earth images from 2006 and 2012 indicate a rapid retreat of the thin main terminus, and the loss of contact with the tributary glacier at Point A. The retreat is similar to that of Fork Glacier and Romanzof Glacier in the same region. The retained snowcover in 2012 is minimal on Slender Glacier and its tributaries. Tributary A lost almost all snowcover in 2012 and 2013 suggesting a lack of a consistent accumulation zone, which a glacier cannot survive without (Pelto, 2010)

slender comparison
2006 Google Earth Image and 2012 Google Earth image

Kokanee Glacier Spring 2015 Assessment, British Columbia

Guest Post by Ben Pelto

Kokanee Glacier is located in the Selkirk Mountains of southeastern B.C., 30 km northeast of Nelson in Kokanee Glacier Provincial Park. Kokanee Glacier drains into the Joker Lakes, the uppermost of which are turquoise due to glacier flour input. Joker Creek carries the water downstream, eventually feeding into the Kootenay Lake and the Kootenay River, which flows to meet the Columbia River in Castlegar, B.C. In the last few years a decline in the number of fish inventoried in feeder streams to the lake caused cancellation of the Fishing Derby in 2015. The Meadow Creek spawning channel usually supports 500,000 to one million kokanee spawners, declined to less than 200,000 annually. In fall 2014, their numbers were down to 60,000. A drop of snow melt from this glacier also would pass through 16 hydroelectric facilities before reaching the ocean.

kokannee AZ

Kokanee Glacier looking west towards camp. April 20th, 2015 Photo: Ben Pelto

A research team from the University of Northern British Columbia and the University of Calgary began visiting the glacier each spring and fall beginning in 2013. Fall access to the glacier is via the Gibson Lake trailhead, which is a 7.5 km hike to Kaslo Lake and the new Kokanee Glacier Cabin (Slocan Chief cabin is only 1 km farther up the trail, but is no longer in use as a backcountry cabin). Spring access is via helicopter under a research permit. The Kokanee Glacier is north-facing and extends from 2800 meters at the summit of Kokanee Peak, to 2230 m where it terminates in an unnamed lake.  This lake is a recent addition to the Joker Lakes, due to glacier retreat in the past two decades. The Kokanee Glacier covers about 1.7 km2.
Kokanee map

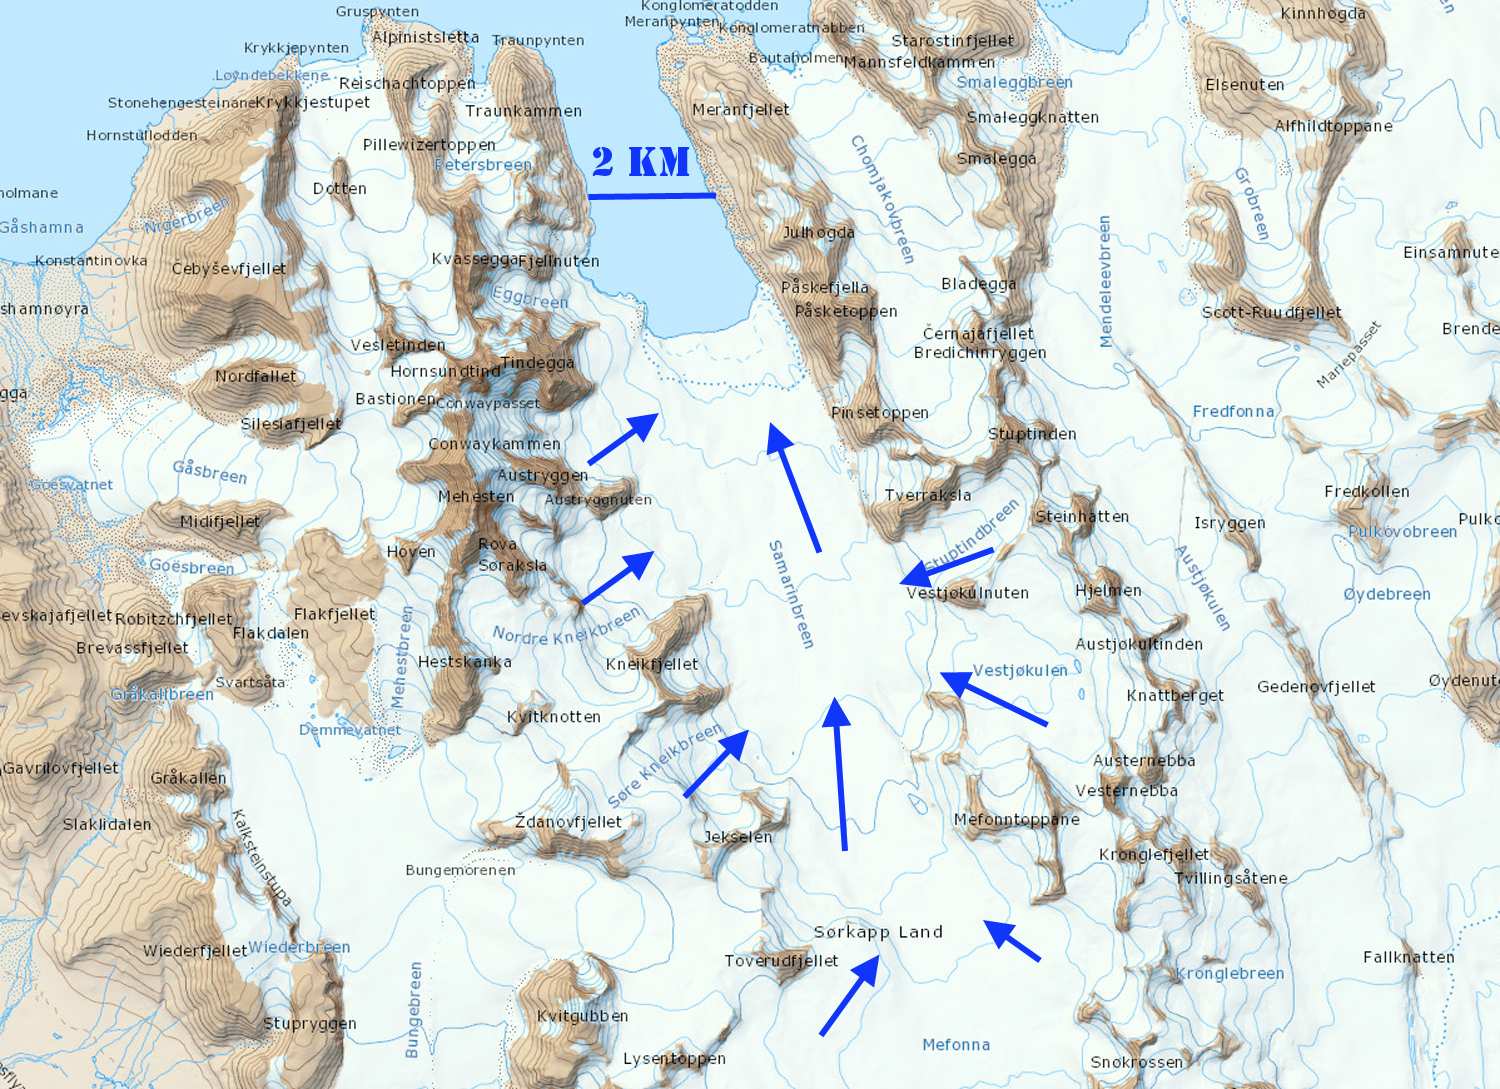
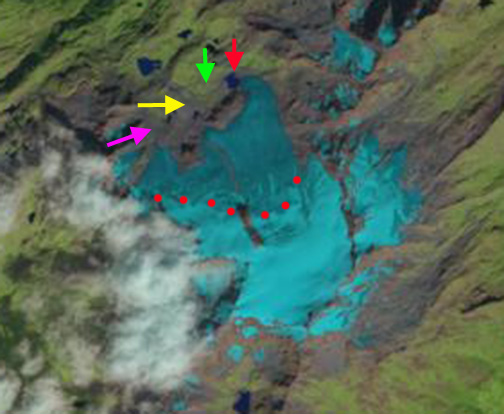
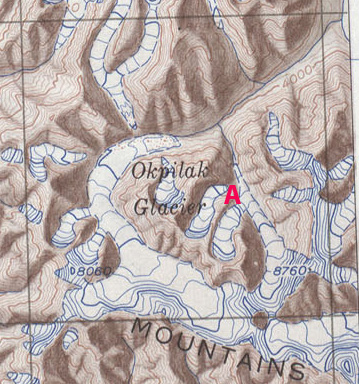
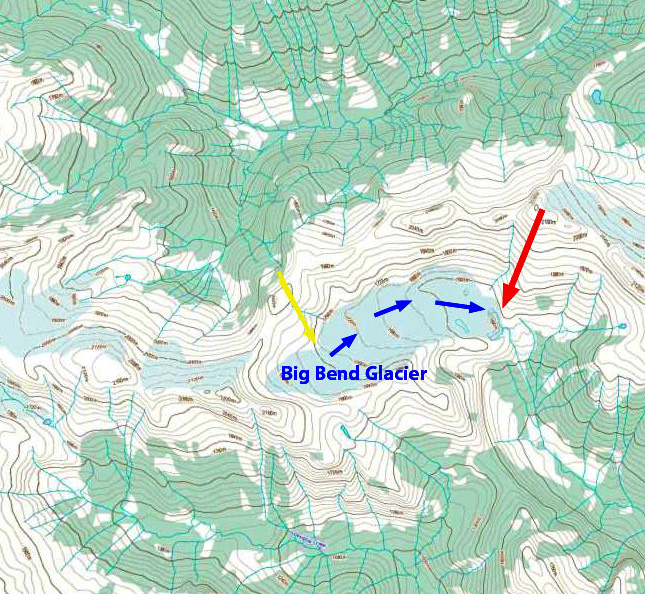
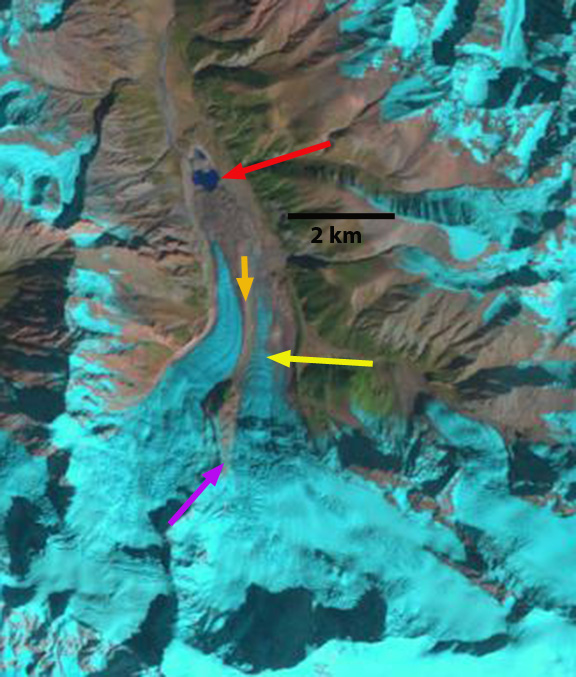
Contour map of the Kokanee Glacier, with the uppermost Joker Lake. Approximate current terminus position purple-dashed line. Oval indicates new proglacial lake.

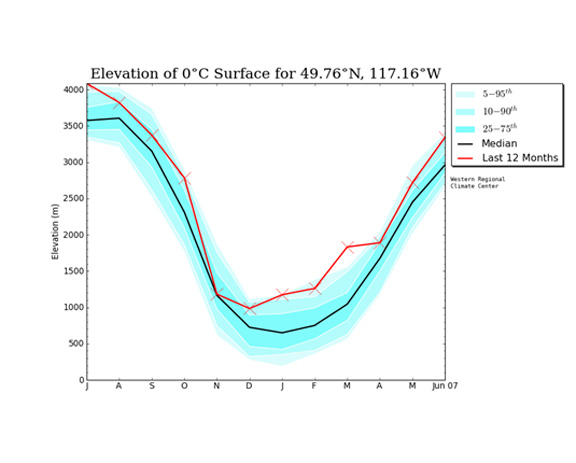
Our spring visit to the glacier documented snowpack deposited during an anomalously warm winter, as shown in the image below from the North American Freezing Level Tracker. The tracker is run by Idaho State University and estimates freezing levels based on the NCEP/NCAR Global Reanalysis, which is determined every six hours. Freezing level is the elevation where air temperature is 0°C at a given time. Freezing levels are important to mountain hydrology and determine whether precipitation falls as rain or snow, the elevation of the rain/snow line, whether the ground is frozen when snow falls in the autumn, the efficiency of snowpack accumulation through the winter (melt events, rain on snow), the internal temperature of the snowpack (which drives melt and metamorphosis of the snowpack), and the length of snow free season at a given elevation. What is immediately apparent is that freezing levels were elevated throughout the accumulation season, which generally begins in late September. Freezing levels were highest relative to the median in the key winter months of January through March. Local skiers and ski guides complained of rain during many storms, which reached to or near the mountain tops and left poor skiing conditions.kokanee fl
Estimated freezing levels for Kokanee Glacier for July 2014 to June 2015 North American Freezing Level Tracker

The Redfish Creek snow pillow is the nearest snow pillow site (see below), and is located 7 km southeast of the glacier at 2086 m. The Kokanee Glacier extends from around 2230 m to 2800 m so the snow pillow site may not accurately represent the amount and type of precipitation on the glacier. Regardless, this winter featured a fairly average snowpack, generally hovering above the mean SWE (snow water equivalent), which is calculated from 2001, when the gauge was installed, to present. A precipitous drop in SWE marked an early and strong start to the melt season, with maximum snowpack coinciding with our visit (April 19-21, 2015), roughly two weeks ahead of the usual SWE maximum date (in the first week of May) as seen by the purple line.

kokannee snowdepth

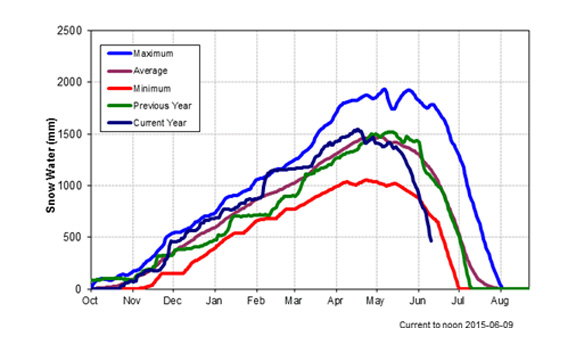
Redfish Creek snow pillow site of the B.C. River Forecast Center for 2014-2015.

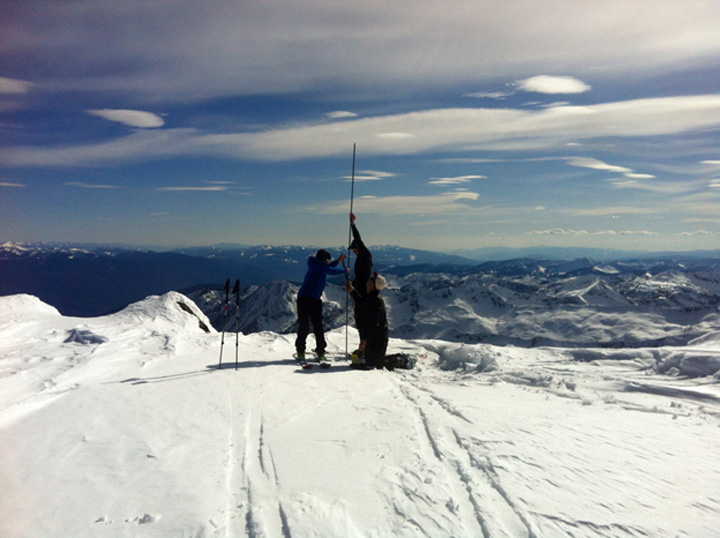
The primary goal of our trip was to assess winter accumulation. Our measurements consisted of probing snow depth and digging snow pits. We took 80 probe measurements at 20 locations, and dug two snow pits, one at 2475 m and one at 2675 m. While snow depth was lowest near the terminus at 3 to 3.5 m, there was no correlation between elevation and accumulation from 2300 m and above, which accounts for a majority of the glacier area. Above 2300 m, snow depth ranged from 4.3 to 6.3 m with an average of 4.8 m.

kokanee probing
Probing snow depth on the Kokanee Glacier, April 20th, 2015. Photo: Alison Criscitiello.

Our measurements revealed that this year’s snow pack was a dense one, likely due to mid-winter melt events, rain-on-snow events, and increased temperature during snow events. Given that snowpack was low across B.C. in the winter of 2014-2015, it would have been reasonable to assume that the glacier fared poorly. However, the winter balance was precisely halfway between the healthy winter balance of 2013 and the weak winter balance of 2014. Our data indicate that freezing levels played a large role in this year’s snowpack for the Kokanee Glacier given that the surrounding region is below 50% of normal snowpack, yet the glacier is much closer to normal as it was still above even the high 2015 winter freezing levels. Given our limited sample size, with this being the third measured winter accumulation, it is beyond the scope our data to assess how close to or far from normal this winter’s snowpack was for the Kokanee Glacier.

Standing on the glacier looking down valley, we observed that bare ground began around 1800 m where there should have still been a couple meters of snow. This highlighted the stark contrast between high and low elevations. Clearly, rain dominated below 1800 m this winter. This winter may be a potential model for the immediate future climate, where increased winter temperatures lead to a higher snowline, lower snowpack at lower elevations, and near average snowpack at higher elevations. Given the early start to fire season in B.C. and the Yukon, similar winters will come at a high cost for fire fighting, forest productivity, and water resources.

kokanee twilight

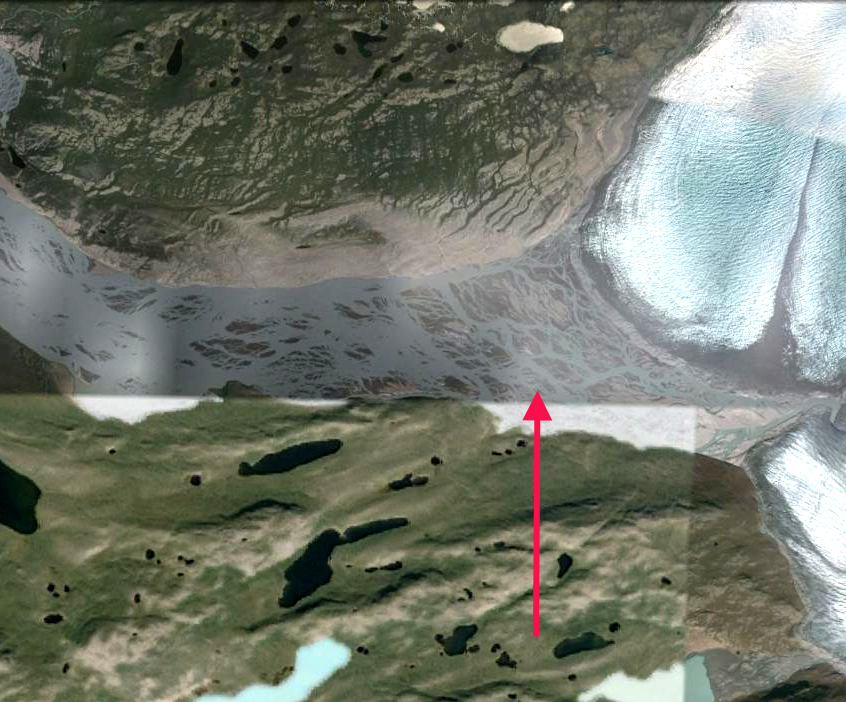
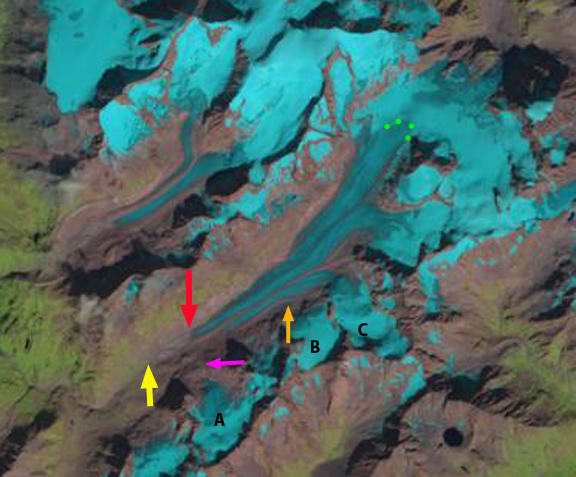
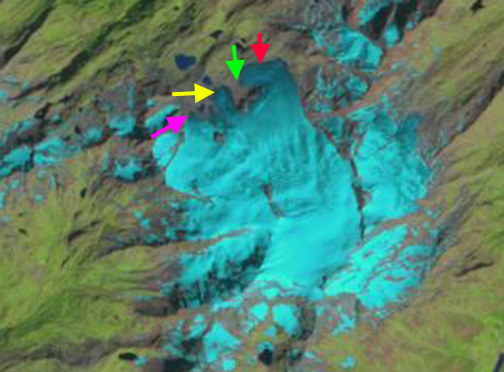
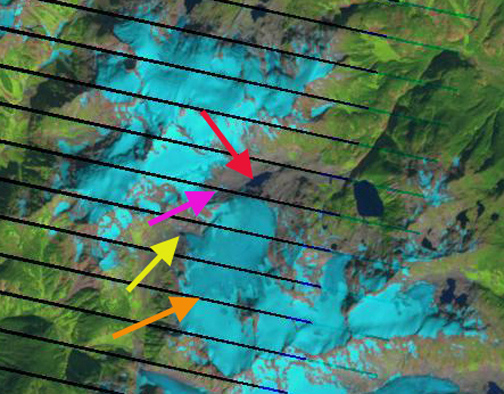
View looking west from Kokanee Glacier April 19, 2015. Approximate snow line yellow dashed line ~1800 m. Red J indicates location of uppermost Joker Lake. Red T is just beyond the terminus, which cannot be seen due to the slope. Photo: Ben Pelto

kokanee snowpit

4.5 m deep snow pit at 2675 m on the Kokanee Glacier, April 20th, 2015. Photo: Alison Criscitiello.

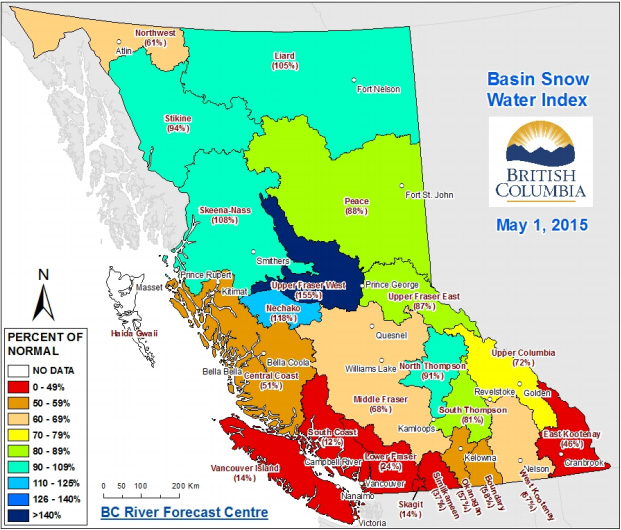
The B.C. River Forecast Center releases a monthly snow report, and stated that temperatures in the Kootenay Region, where the Kokanee Glacier is located, were 3 to 5°C above average. The image below shows that by May 1, snowpack was 67% of average. The June 1st map has all but three sub-regions of B.C. exhibiting less than 50% of normal snowpack, with the West Kootenay region at 30% of normal. The result will be less snowpack across southern BC this summer. At the end of August last year there was considerable bare ice and firn exposed on Kokanee Glacier, this year we anticipate even more upon our return at the end of the melt season. Of course the snow report is critical for hydropower in BC.  For the Kokanee Glacier, meltwater goes through a series of hydropower dams on the Kootenay River.
bcsnowpack

May 1, 2015 Snow Report Map, B.C. River Forecast Center.  Kokanee Glacier located by Nelson in SE B.C.

kokanee 2014

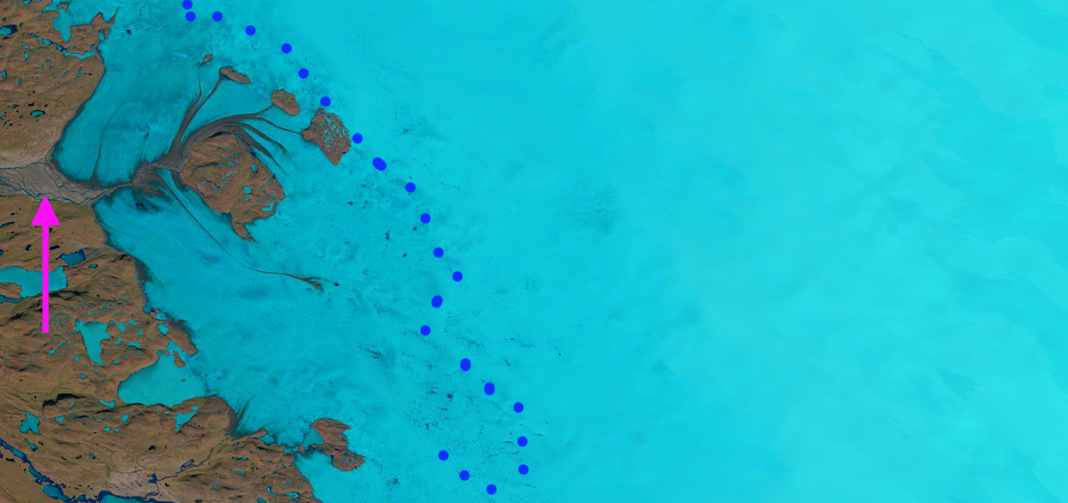
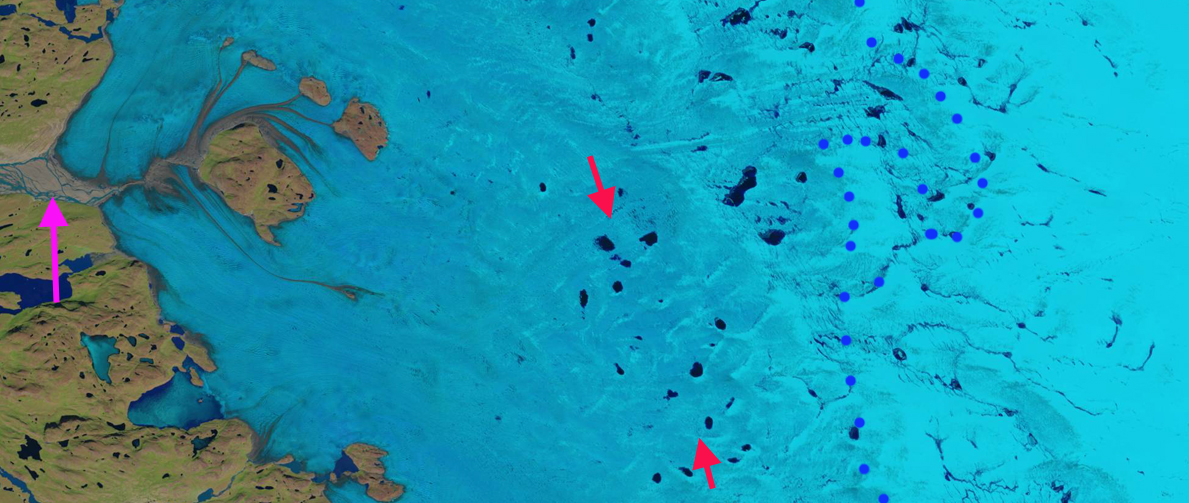
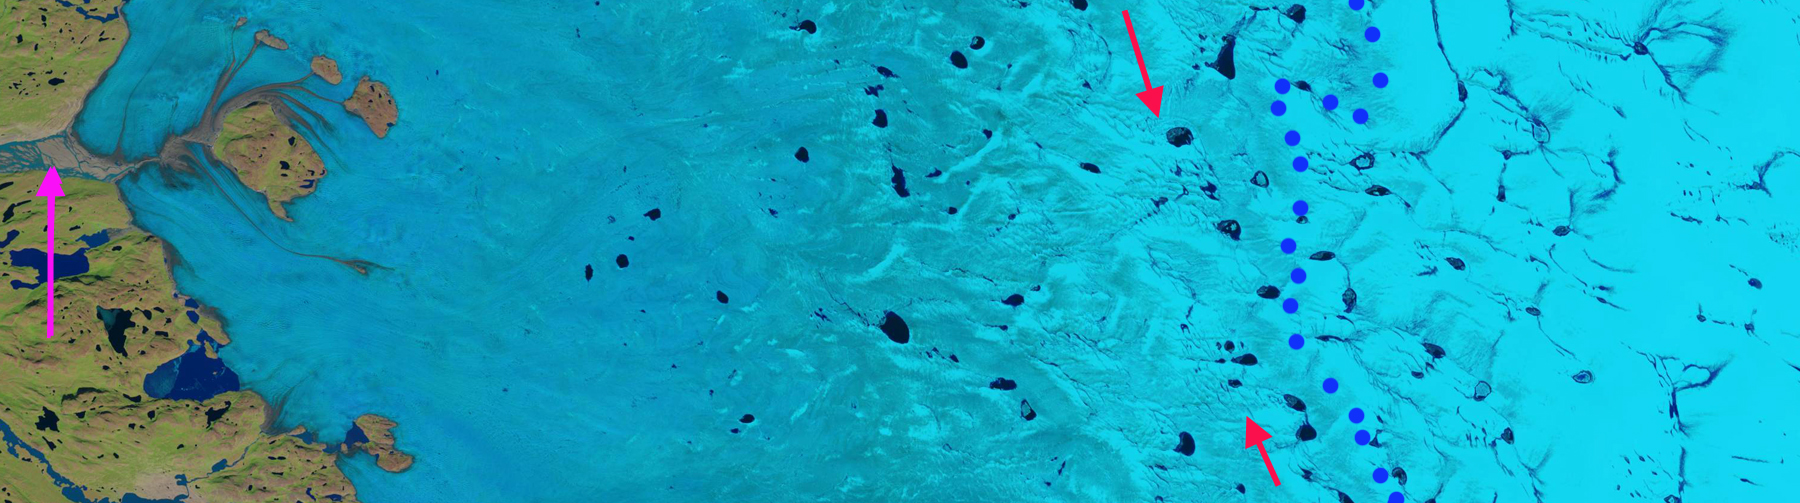
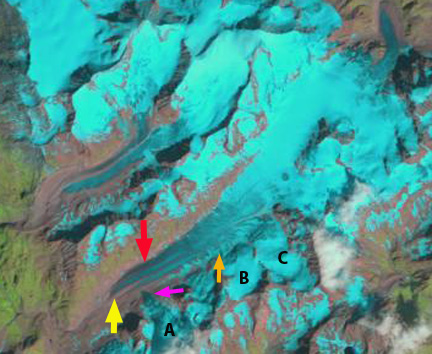
Kokanee Glacier, Aug. 27th 2014. the darker areas are either firn that has survived more than one summer or bare glacier ice. 

kootenay river hydro


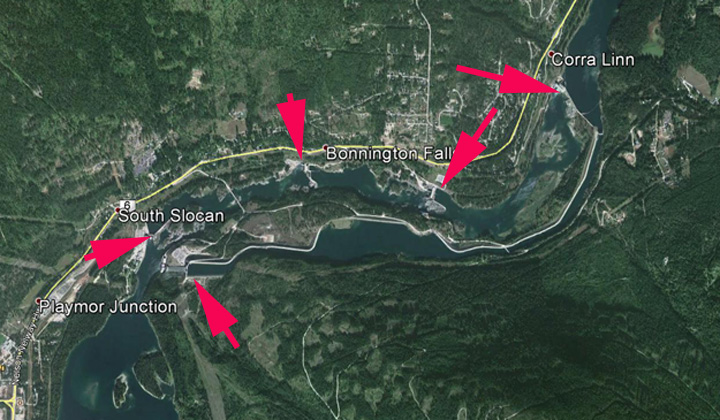
Kootenay River Hydropower. 

Salmon Challenges From Glaciers to the Salish Sea

The Salish Sea includes Puget Sound, the Strait of Georgia, and the Strait of Juan de Fuca of Washington and British Columbia. The Salish Sea supports all seven species of Pacific salmon, chinook, chum, coho, cutthroat, pink, sockeye and steelhead. Population declines have prompted initiation of the Salish Sea Marine Survival Project. This project reports that: chinook, coho, and steelhead have experienced tenfold declines in survival during the marine phase of their lifecycle, with total abundance remaining well below levels of 30 years ago. The conditions in the Salish Sea have changed and salmon survival has been declining, Zimmerman et al (2015) observed the primary pattern within the Salish Sea is declining smolt survival from 1977-2010.  Of course the salmon begin and end their life cycle in the streams, many glacier fed, and these too have experienced changes that are not favorable for salmon. The Salish Sea is fed by numerous glacier fed streams, all of which have experienced substantial retreat in the last 30 years, with many already experiencing significant summer declines in overall and glacier runoff (Stahl and Moore, 2006; Pelto, 2008). The largest input river is the Fraser River (FR), Padilla et al (2014) note an increasing variability in summer flow, and with a warming climate greater variability in annual streamflow, and hence in hydrological extremes is anticipated, which is not favorable to salmon. This post provides selected specific examples of observed changes on glaciers in the Salish Sea watershed.

.salish sea map

Modified Map from Environment Canada

Decline-of-Marine-Survival-in-the-Salish-Sea2


Salmon Changes from the Salish Sea Marine Survival Project 

whitechuck change

The loss of the north branch of the Whitechuck Glacier

The Whitechuck Glacier supplies flow to the headwaters of the Whitechuck River. Its white expanse has graced these headwaters for thousands of years. The Whitechuck Glacier retreated slowly from its advanced Little Ice Age position until 1930, while rapidly thinning. Thus, prepared it began a rapid retreat in 1930. This rapid retreat culminated in the total disappearance of the north branch of the glacier in 2001, our third visit to the glacier. No more does this glacier dominate the headwaters, and its demise has and will continue to alter the hydrology of the Whitechuck River headwaters.The amount of runoff entering the Whitechuck River has declined substantially in the summer. For thousands of years each square meter of glacier has contributed 3 cubic meters of runoff from July I-October 1. With the loss of glacier ice, this contribution should drop by 65-80% based on observations at two other sites where glaciers have disappeared (Pelto, 1993 & 2008). The change since 1950 in glacier area has reduced summer glacier runoff by 5.7 million cubic meters annually. This represents a loss of between 0.55 to 0.65 cubic meters/second for the Whitechuck River during the July-September period. The water will also be less sediment laden and warmer. The impact will be less water for the fall salmon runs, and less food in amount and processing for stream invertebrates on which salmon feed downstream in the Sauk and Skagit Rivers.  Milk Lake Glacier also fed this watershed before disappearing in the 1990’s.

milk lake change

Milk Lake Glacier on USGS map from 1979 and in 2009.

Nooksack River: For 31 years we have completed measurements of ablation, glacier area change and runoff in this basin, all are losing mass and retreating (Pelto and Brown, 2012). During stressful warm weather events in the last five years we have measured ablation on and runoff from glaciers in the basin. In addition the USGS gages record discharge and stream temperature in the South Fork, Middle Fork and North Fork Nooksack. During these events runoff measurements below Sholes Glacier and ablation measurements on Sholes Glacier indicate daily ablation ranging from 0.05-0.06 meters per day, which for the North Fork currently yields 9.5-11 cubic meters/second. This is 40-50% of the August mean discharge of 24 cubic meters/second, despite glaciers only covering 6% of the watershed. In the unglaciated South Fork all 12 warm weather events generated a rise in stream temperature of at least 2 C, only 2 event in the North Fork generated this rise. Discharge rose at leasts 15% in 10 of the 12 events in the North Fork and none of the events in the South Fork. As the glaciers continue to retreat the North Fork will trend first toward the more limited impact of the Middle Fork and then the highly sensitive South Fork where warm weather leads to declining streamflow and warming temperatures. Our ongoing measurements of daily runoff and daily streamflow below Sholes Glacier allow determination of the contribution of glaciers to the North Fork Nooksack, which peaked in 2014 at 80% of total streamflow. Glacier runoff surpassed 40% of the total streamflow on 26 days after Aug. 1 in 2014. The Nooksack Salmon Enhancement Association has completed numerous salmon restoration efforts, but climate is one challenge that cannot be restored locally.

deming terminus 2011
Deming Glacier Retreat 1984-2011-headwaters Middle Fork Nooksack River

nooksack response
Response of watersheds to warm weather events.

Skykomish RiverThe reduction of the glacial melt component augmenting summer low flows is already resulting in more low-flow days in the North Cascade region. In the Skykomish River watershed from 1958-2009 glacier area declined from 3.8 km2 to 2.1 km2, a 45% decline (Pelto, 2011). A key threshold of in-stream flow levels considered insufficient to maintain short term survival of fish stocks is below 10% of the mean annual flow (Tennant, 1976). For the Skykomish River 10% of mean annual flow is 14 cubic meter/second. In the Skykomish River from 1950-2013 there have been 230 melt season days with discharge below 14 cubic meter/second. Of these 228, or 99% of the low flow days, have occurred since 1985. The loss of 30-40% of the glacier runoff is a key reason for the onset of more critical low flow days. Of more concern for aquatic life is the occurrence of extended periods of low flow (Tennant, 1976). From 1929-2009 in the Skykomish River basin there have been eight years where streamflow dropped below 14 cubic meter/second. for 10 consecutive days during the melt season, 1986, 1987, 1992, 1998, 2003, 2005, 2006 and 2007. It is likely that 2015 will join this list

lynch change

Lynch Glacier, Skykomish Basin in 1978 (Bill Prater, Photograph) when Pea Soup Lake was filled with ice and in 2007 with the glacier no longer reaching the lake.

Fraser River-Southern BC: Koch et al,(2009) observed a widespread retreat and glacier area loss in Garibaldi Provincial Park just to the west, with 20% area loss from 1988-2005. Bolch et al (2010) noted that from 1985-2005 that glaciers in the southern Coast of British Columbia lost 10% of their area, 0.6% per year and that the rate was increasing. By 2015 this area loss is certainly greater than 15%. For a longer time span Tennant et al (2012) noted that from 1919-2006 the glaciers in the central and southern Canadian Rocky Mountains lost 40% of their area. Of the 523 glaciers they observed 17 disappeared and 124 separated. Many of these do not drain into the Salish Sea, but does give a sense that the overall change is larger than 20%.

The change in glacier area is key because observed melt rates increases have been less than 20%. Hence, as glacier area declines at a greater rate than glacier melt rate, glacier runoff declines.  The Helm Glacier below exemplifies the change from a shrinking area of ice available for summer melt, since 1928 the glacier has lost 78% of its area. Helm Glacier drains into the Cheakamus River, which supplies Daisy lake Reservoir and the BCHydro 157 MW Cheakamus Power Plant.  The Cheakamus River has the Dave Marshall Salmon Reserve with over 14 kilometres of winding, re-enhanced salmon spawning river channels off the Cheakamus.

helm-glacier-20091

Helm Glacier, Garibaldi Provincial Park, BC 1928 extent on 2009 Google Earth image

Snowcap Creek Glacier has retreated 900 m since 1992 with a new lake forming at its terminus.  This glacier drains into Harrison Lake.  Harrison Lake is considered a location where salmon populations have remained stronger and features five species of salmon – sockeye, chinook, pink, coho, and chum that pass through the lake in the summer enroute to spawning grounds.

Snowcap Creek Glacier shares a divide with Stave Glacier at the headwaters of Stave Lake which is the part of the 205 MW Stave Lake-Hayward Reservoir-Ruskin Dam Hydropower facility.  The dams do not have fish passages cutting off salmon from most of the watershed.  There are kokanee salmon a landlocked version of the sockeye salmon.This glacier has retreated at a rate of 100 meters per year from 1996 to 2012. This is the fastest rate of retreat since 1900 (Koch et al, 2009).

snowcap creek glacier 2012

Red and Yellow Arrow indicate new lakes formed in the last six years by retreat of Snowcap Creek Glacier.

stave ge

Stave Glacier Retreat Koch et al (2009) documented retreat from 1952-1996. 

Overall salmon are being faced with increasing climate stress in rivers on top of long term habitat alteration at the beginning and end of their life cycle, then mature in the changing and challenging conditions of the Salish Sea. Our Nooksack Indian Tribe partners Oliver Grah and Jezra Beaulieu discuss glacier runoff measurement, runoff changes and salmon in an interview completed during work at the runoff gage below Heliotrope Glacier on Mount Baker.

Big Bend Glacier, British Columbia Transitions to Alpine lake

“Big Bend” Glacier is an unnamed glacier west of Big Bend Peak north of Harrison Lake in Southwest British Columbia.  In 1985 the glacier was 2.6 km long filling a low valley with a surface elevation of 1600-1800 m elevation, the topographic map indicates this basic size. Here we utilize Landsat imagery to identify the changes in the glacier from 1985-2014 due to climate change. In essence the glaciated basin is transitioning to an alpine lake basin, quickly.

bigbendpeak ge


Topographic map of the Big Bend Glacier area.

In 1985 the glacier extends to the big bend in the valley marking its eastern end, red arrow.  the yellow arrow indicates an area near 1800 m where the glacier extends across the valley.  In 1992 there has been little retreat but evident thinning is leading to lake formation at the terminus and narrowing of the glacier at the red arrow. In 2002 thinning is leading to expansion of a proglacial lake both west and south of the red arrow.  The terminus retreat has still been limited, thinning is evident at the yellow arrow.  

In 2013 a new alpine lake that is approximately 1 km long has formed, as the terminus area of the glacier has collapsed. In 2014 an area of bedrock and a small lake has developed at the yellow arrow.  There is no retained snowpack below the yellow arrow in 2013, and no retained snowpack in at all in 2014.  This will likely be the case in 2015 as well.  This glacier has a lower top elevation than most in the region and will be more impacted by the warm winter conditions and high snowline of 2015. The retreat from 1985 to 2014 has been 1.1 km. This is 40% of the entire glacier length gone in 30 years. The lake itself has a deep blue color suggesting limited glacier sediment input, further indicating a lack of motion of the glacier currently or in the near past.

The glacier retreat has been more extensive than Stave Glacier or Snowcap Glacier to its east.  Koch et al,(2009) observed a widespread retreat and glacier area loss in Garibaldi Provincial Park just to the west, with 20% area loss from 1988-2005. Place Glacier is a short distance north of Big Bend Glacier has its mass balance has lost an average of 25 m of water equivalent (28 m ice) thickness since 1984, see bottom chart. This has been higher but similar in trend to other glaciers in the region.  Big Bend will disappear soon just as we obsserved already happened at Milk Lake Glacier, North Cascades, Washington.

bigbendpeak1985
1985 Landsat Image

bigbendpeak1992
1992 Landsat Image

bigbendpeak2002
2002 Landsat Image

bigbendpeak 2013
2013 Landsat Image

bigbendpeak2014
2014 Landsat Image

nam-ba-2013
North American cumulative glacier mass balance graph

Midui Glacier, Tibet, China: Retreat and Terminus Collapse 1995-2014

Midui Glacier is 7 km from the G318 National Highway in China and 2 km from Midui village, hence the lake near the terminus is often visited. The glacier is near the headwaters of Yarlung Tsangpo. Glaciers in this region have experienced significant retreat and area loss as noted by the second China Glacier inventory. This compared glacier area from the 1950’s, 2002 and 2010, Liu et al (2013) noted that glacier area has declined 13%. The Midui Glacier was advancing as recently as 1964 when it emplaced an advance moraine (Xu et al, 2012).  This is a region where Li et al (2011) noted that increasing temperature, especially at altitude, the fronts of 32 glaciers have retreated, mass losses of 10 glaciers have been considerable, glacial lakes in six regions have expanded and melt water discharge of four basins has also increased. This is further documented by an inventory of 308 glaciers in the Nam Co Basin, Tibet, where an increased loss of area for the 2001-2009 period, 6% area loss (Bolch et al., 2010) was observed. The nearby Yemayundrung Glacier retreat is similar. Here we examine changes in this glacier using Landsat imagery and Google Earth from 1995-2014.

midui glacier 1995
1995 Landsat image

midui glacier 2014 landsat
2014 Landsat image

In the Landsat images above in 1995 the glacier terminates in a proglacial lake at the red arrow. A ridge separates two tributaries each with an icefall creating ogives, purple arrow. There are ogives below a pair of icefalls at the yellow arrow. The tributaries are separated by a medial moraine orange arrow. By 2014 retreat has led to expansion of the lake at the terminus. The retreat is 300 meters during this 20 year period. The icefall on the right, east side of the glacier, is no longer producing significant ogives and the bare glacier ice has been replaced with extensive debris cover, yellow arrow. Both the ridge and medial moraine separating the tributaries have expanded in width as the glacier has thinned.

A series of comparison images from Google Earth in 2001 and 2014 further illustrate the changes noted above.

In the first pair the terminus change and lake expansion is evident at the red arrow. Debris cover expansion at the lateral moraine area with thinning of the eastern tributary is notable at the yellow arrow.

The second pair is the terminus reach. A series of depressions are noted with each yellow arrow, indicated by concentric crevassing. This indicates collapse due to a subglacial basin/lake. Further this indicates a stagnant collapsing terminus area in the lower 1.5 km of the glacier.

The last pair is the icefall region indicating reduced crevassing below the lefthand icefall, pink arrow and the expanding medial moraine yellow arrow. It is clear that this glacier is going to continue to retreat in the coming decades, and the rate is going to increase in the near future as the collapsing sections of the terminus melt away. There is still considerable glacier area that remains snowcovered each year, and it can survive current climate and some additional warming. The snowline on the glacier is at 5000-5100 m and the head of the glacier is at 6100 m.
midui glacier comp
Midui Glacier comparison from Google Earth

midui terminus comp
Midui Terminus comparison from Google Earth

midui icefall
Midui Icefall comparison from Google Earth

Retreat forms Embayment at Kropotkina Glacier in Novaya Zemlya

Kropotkina Glacier is a tidewater glacier on the southeast coast of Novaya Zemlya that drain into Vlaseva Bay.  The glaciers terminate in the Kara Sea and has been retreating like all tidewater glaciers in Novaya Zemlya LEGOS, 2006 .  The map shown below from this project indicate the lack of an embayment in 1952, red dashed line and limited retreat from 1952-1988, with 1988 being the yellow line. Carr et al (2014) identified an average retreat rate of 52 meters/year for tidewater glaciers on Novaya Zemlya from 1992 to 2010 and 5 meters/year for land terminating glaciers.   Here we examine Landsat imagery from 1988 to 2013 to identify changes in Kropotkina Glacier.

kropots map

In each image the colored arrows are in the same location. In 1988 the terminus is just beyond the red arrow indicating a peninsula on the east side of the terminus. The yellow arrow indicates a lake beyond an eastern terminus lobe with limited drainage down a river adjacent to the glacier, purple arrow. Two smaller glacier termini are joined at the green arrow. By 1998 there is a minor retreat of the main terminus on both the east and west side. Little change is seen elsewhere. By 2011 a substantial embayment has developed above the red arrow. Retreat is limited on the western side of the terminus. The eastern terminus lobe has retreated as well and the drainage channel adjacent to the glacier is less restricted leading to a less extensive lake. The lake is mostly filling the region occupied by ice 13 years before.

In 2014 there is cloud cover over much of the glacier but the terminus is clear. The easternmost terminus lobe is collapsing, and is not surrounded by a lake, yellow arrow. The purple arrow drainage river is no longer necessary as there is lake connectivity. The main terminus to the east has retreated to the entrance to the lake for the eastern terminus lobe, this a 2.8 km retreat. The western side of the glacier remains aground on a peninsula, but has receded 500 m. How long before this part of the terminus to retreats into the expanding embayment. An are of more 7 square kilometers has gone from glacier ice to embayment in the last 25 years, almost all within the last 13 years. The retreat has mainly been via calving, and with an expanding calving front and reduced pinning points along the margin, the rapid retreat and area loss is not over. The beginning of rapid retreat coincides with the onset of rapid decline in sea ice extent in the Kara Sea (Perovich et al., 2014).

This ongoing retreat is illustrated by Krivosheina, Chernysheva, Roze and Sredniy and Taisija Glacier also in northern Novaya Zemlya.

kropots 1988b

1988 Landsat image

kropots 1998
1998 Landsat image
kropots 2011
2011 Landsat image
kropots 2014
2014 Landsat image