Skykomish River, Washington Reduced Minimum River Flow and Glacier Retreat

sky headwaters

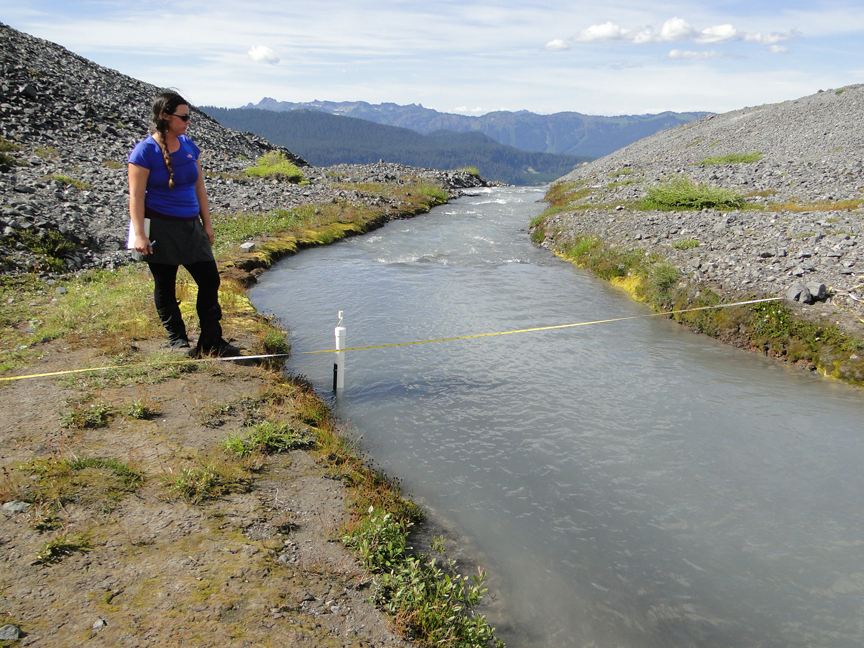
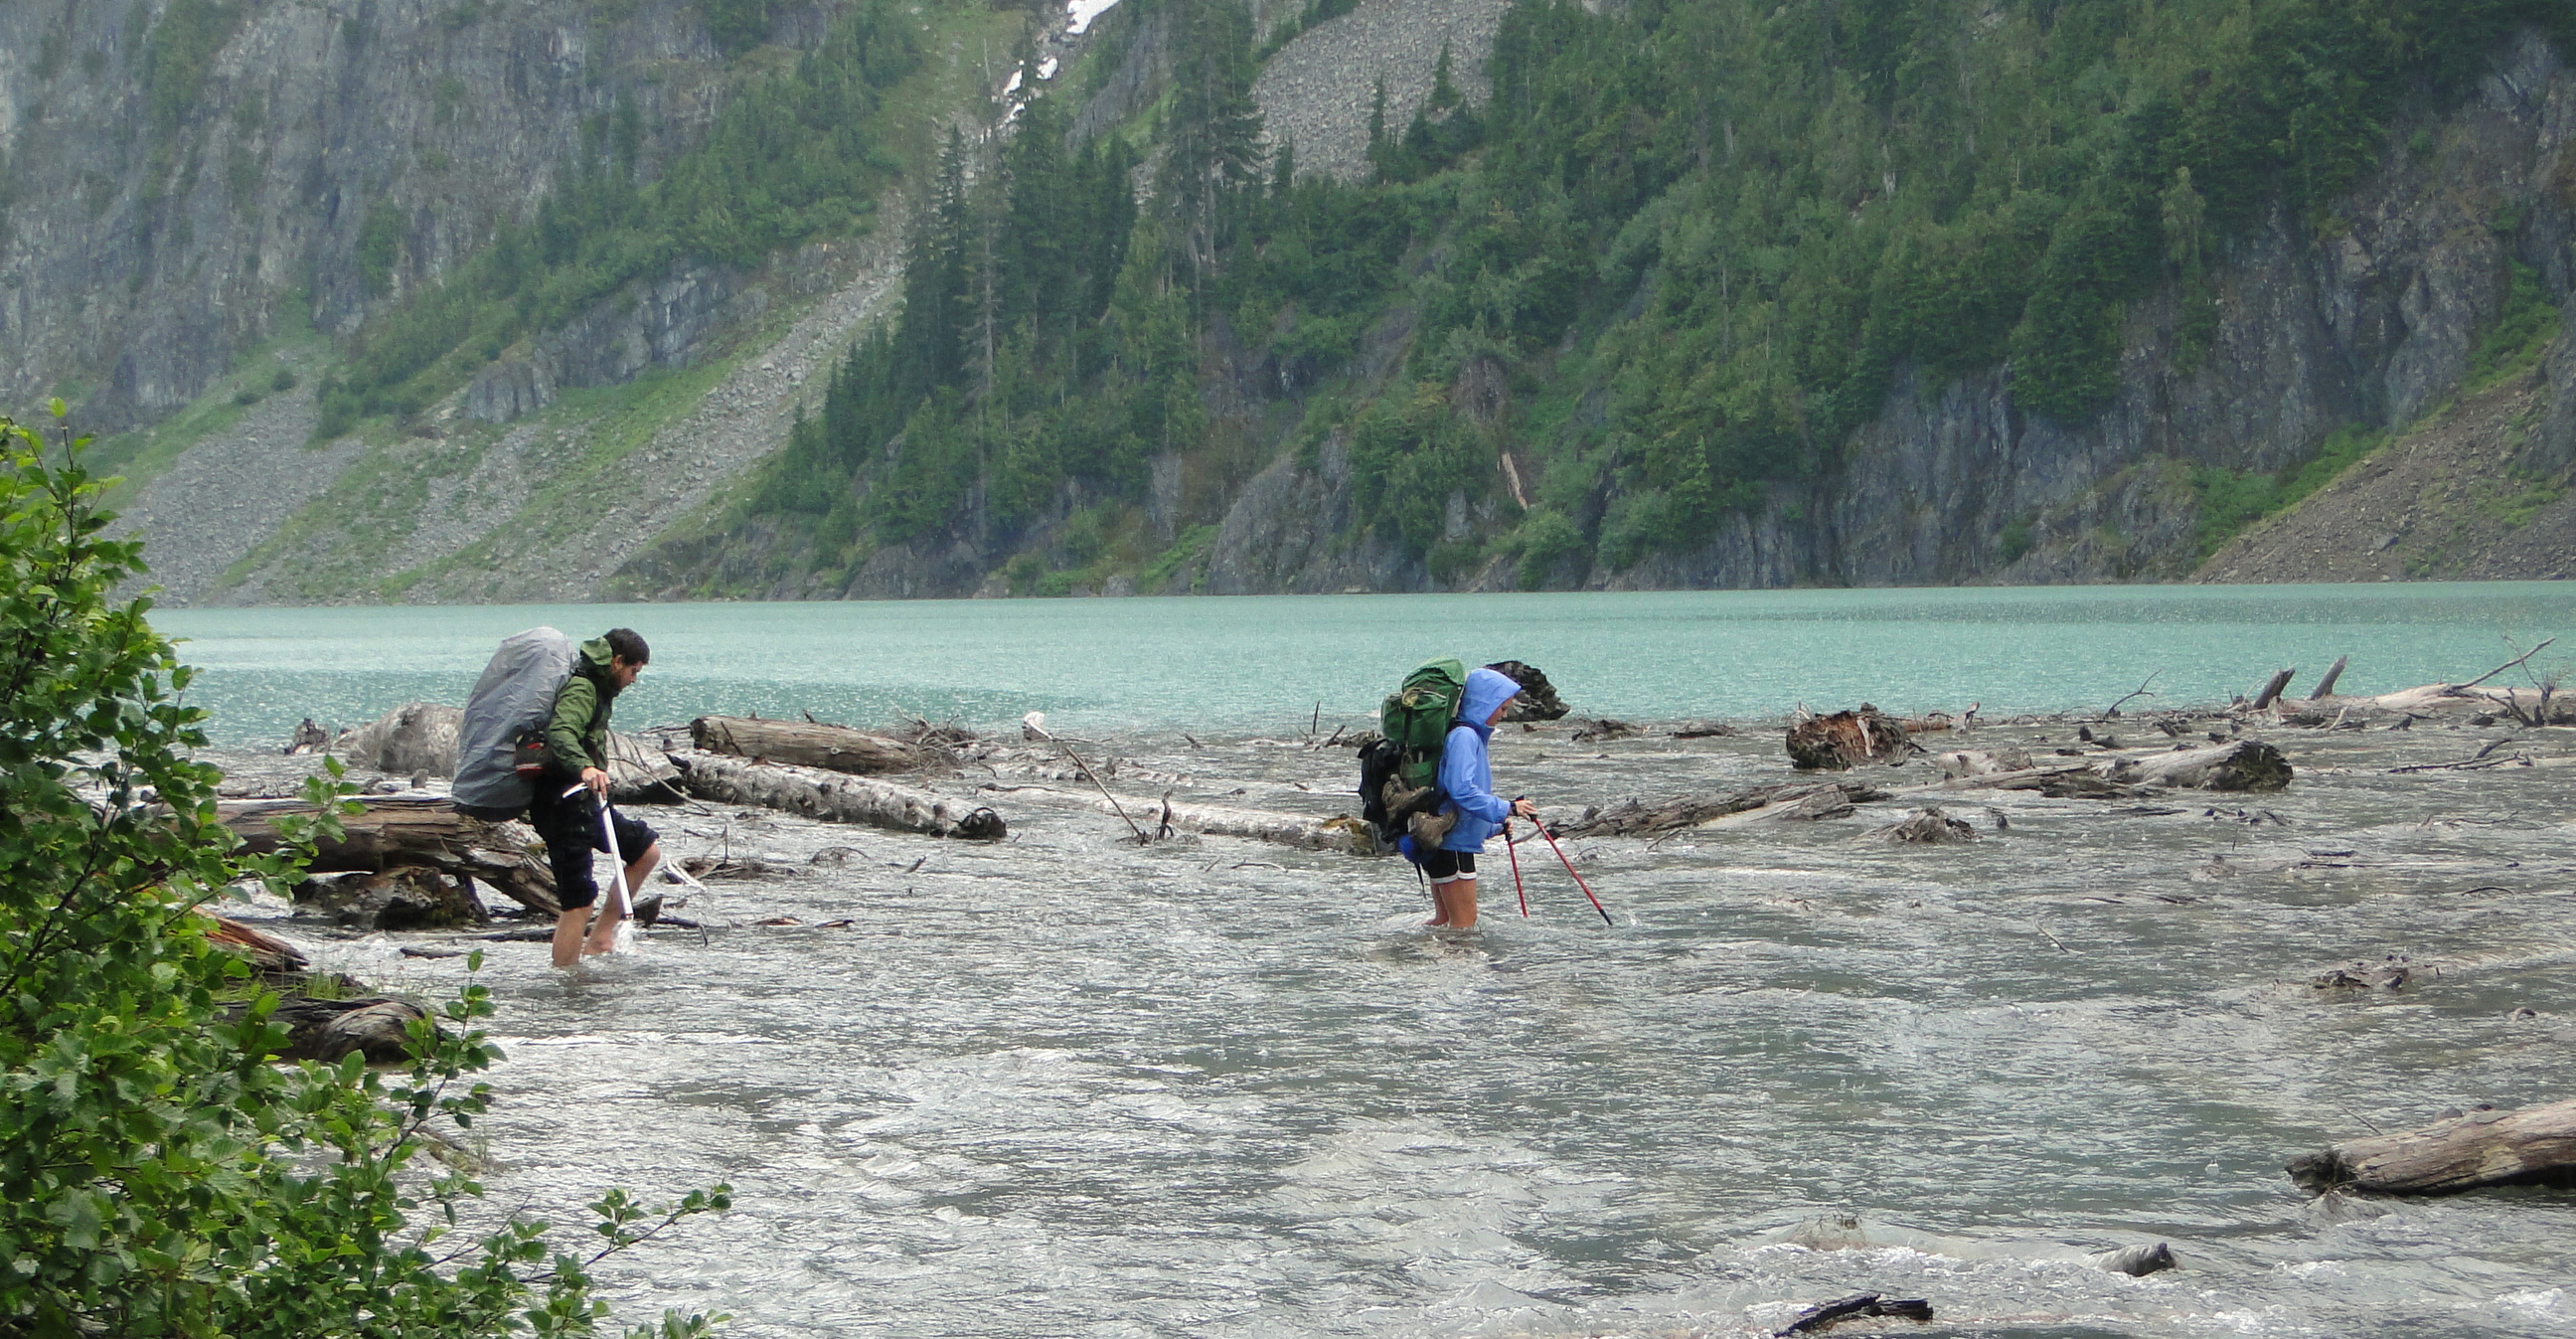
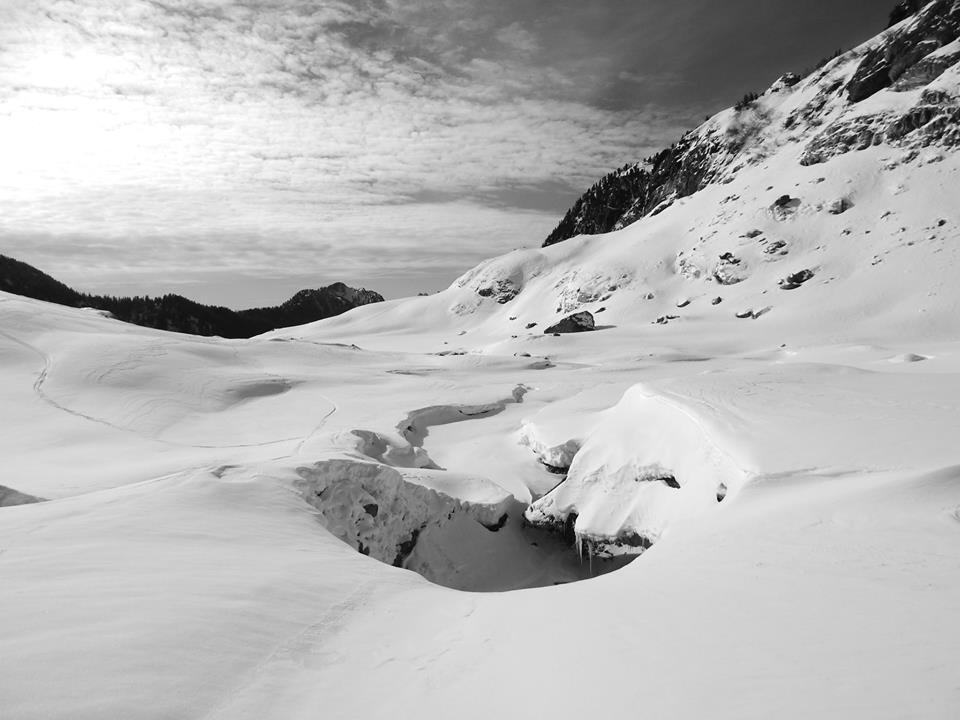
Fording the outlet of Blanca Lake, headwater North Fork Skykomish River.

The focus this spring has been on the developing drought in Washington as a result of record low snowpack, the winter was a record warmth though not dry. The focus of this article is on another component of many alpine watersheds, glacier runoff, both the ameliorating role and their reduced ability as they shrink to augment flow during low flow periods. Glaciers act as natural reservoirs storing water in a frozen state instead of behind a dam. Glaciers modify streamflow releasing the most runoff during the warmest, driest periods of summer, when all other sources of water are at a minimum. Annual glacier runoff is highest in warm, dry summers and lowest during wet, cool summers. This is the first of two posts looking at the response of specific alpine watersheds to glacier change and glacier runoff, the second will look at the Nooksack River.

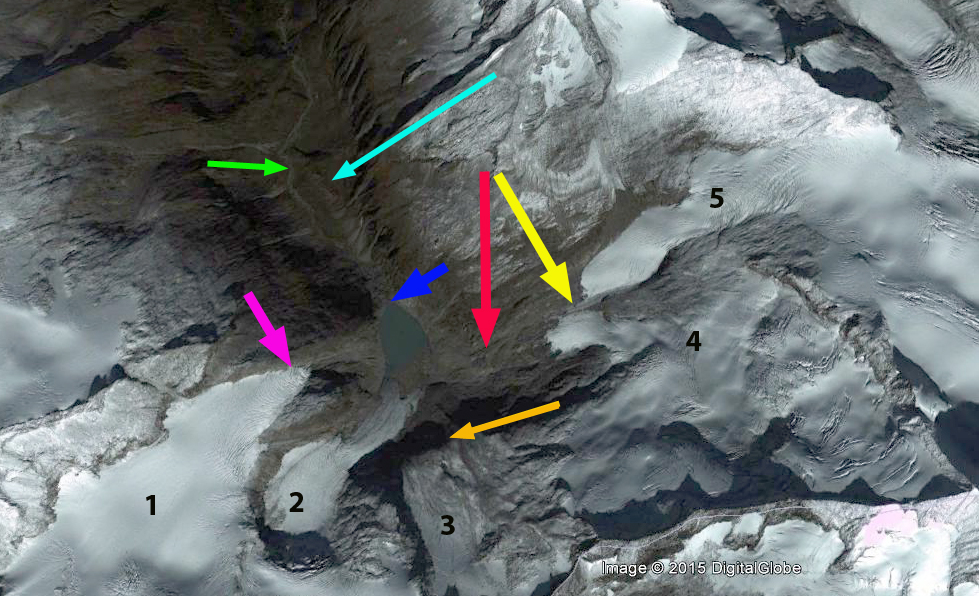
Watersheds in mountainous Pacific Northwest are comprised of pluvial, nival and glacial segments. The pluvial segments have peak flows in the winter due to the winter storm events (Dery et al., 2009). Nival streams peak in the May and June with the high snowmelt, and glacially fed streams peak in July and August during peak glacier melt (Pelto, 2008; Dery et al., 2009). The loss of glaciers from a watershed then reduces streamflow primarily during minimum flow periods The amount of glacier runoff is the product of surface area and ablation rate. The glacier retreat and loss of glacier runoff has been quite pronounced in the Skykomish River Basin, North Cascades, Washington from 1950-2014 (Pelto, 2011). This summer we will return to make observations on 4 glaciers in this watershed for the 32nd consecutive year.  We will be measuring flow with the Nooksack Indian Tribe again this year below glaciers, and we will observe the drought impact on the glaciers and downstream.

skybasemap

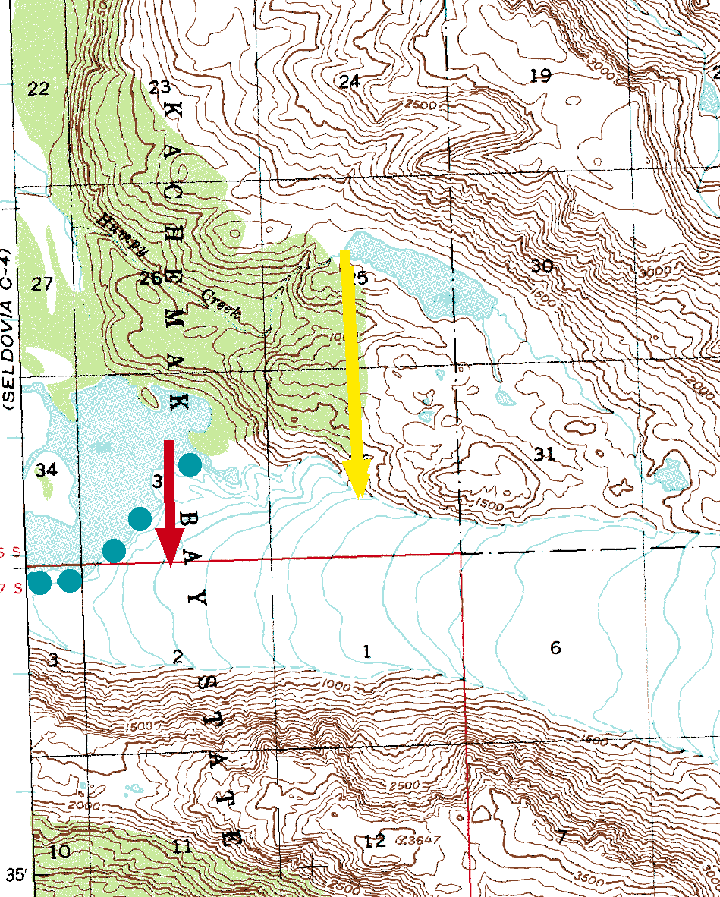
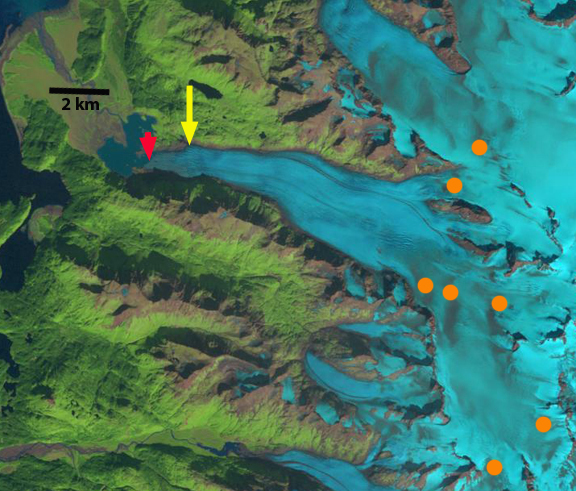
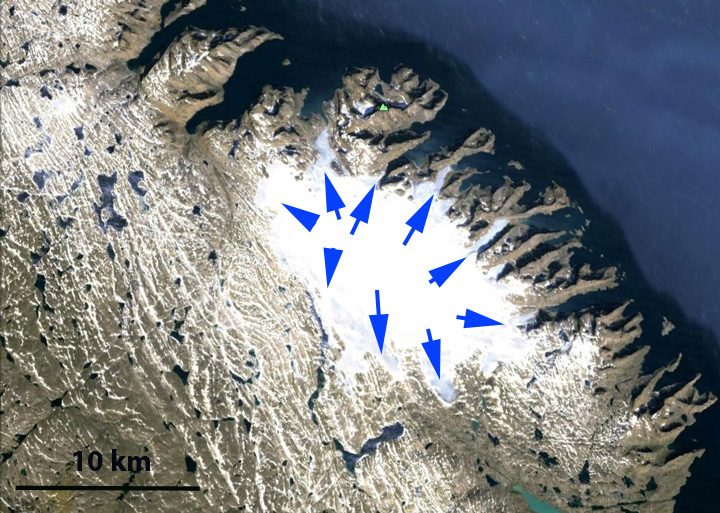
Skykomish Basin Map-Light blue arrows indicate the four main glaciers: 1=Columbia, 2=Hinman, 3=Foss, 4=Lynch

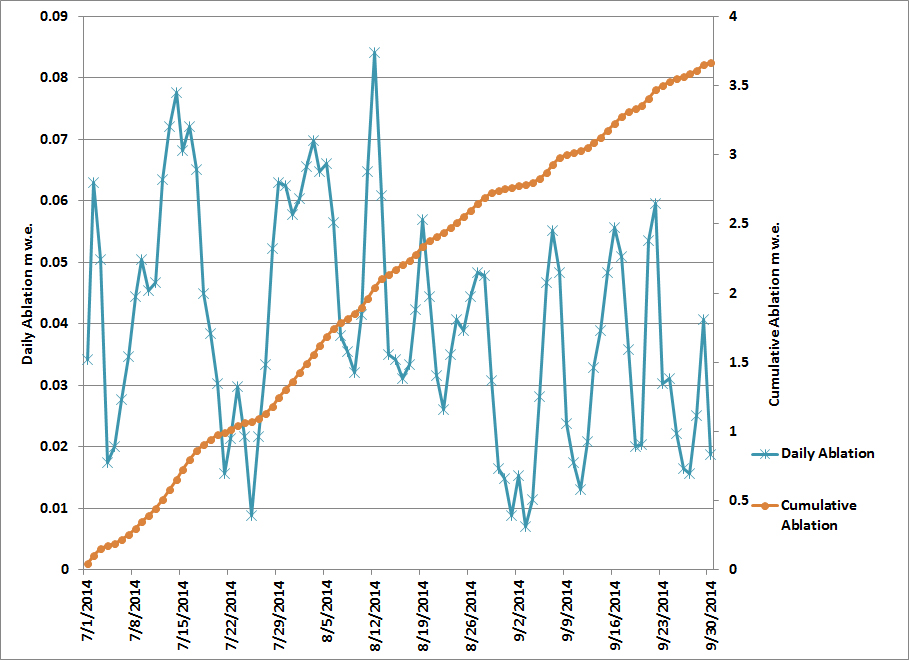
An analysis comparing USGS streamflow records for the Skykomish River at Gold Bar for the 1950-1985 to the 1985-2009 period indicates that during the recent period the Skykomish River summer streamflow (July-September) has declined 26% in the watershed, spring runoff (April-June) has declined 6%, while winter runoff (November-March) has increased 10% (Figure 1). The reduction of the glacial melt component augmenting summer low flows is already resulting in more low-flow days in the North Cascade region. In the Skykomish River watershed from 1958-2009 glacier area declined from 3.8 km2 to 2.1 km2, a 45% decline (Pelto, 2011). Columbia, Foss, Hinman and Lynch Glacier, the primary glaciers in the basin, declined in area by 10%, 60%, 90% and 35% respectively since 1958. Annual mass balance measurements completed from 1984-2009 on Columbia, Foss and Lynch Glacier indicate a mass loss of 13.1 m w.e. Despite 15% higher ablation rates during the 1985-2009 period, the 45% reduction in glacier area led to a 38% reduction glacier runoff between 1958 and 2009. This means less glacier runoff in late summer.

fig 3 esc

Change in seasonal discharge in the Skykomish River. Increase in winter, decrease in summer.

Slide9
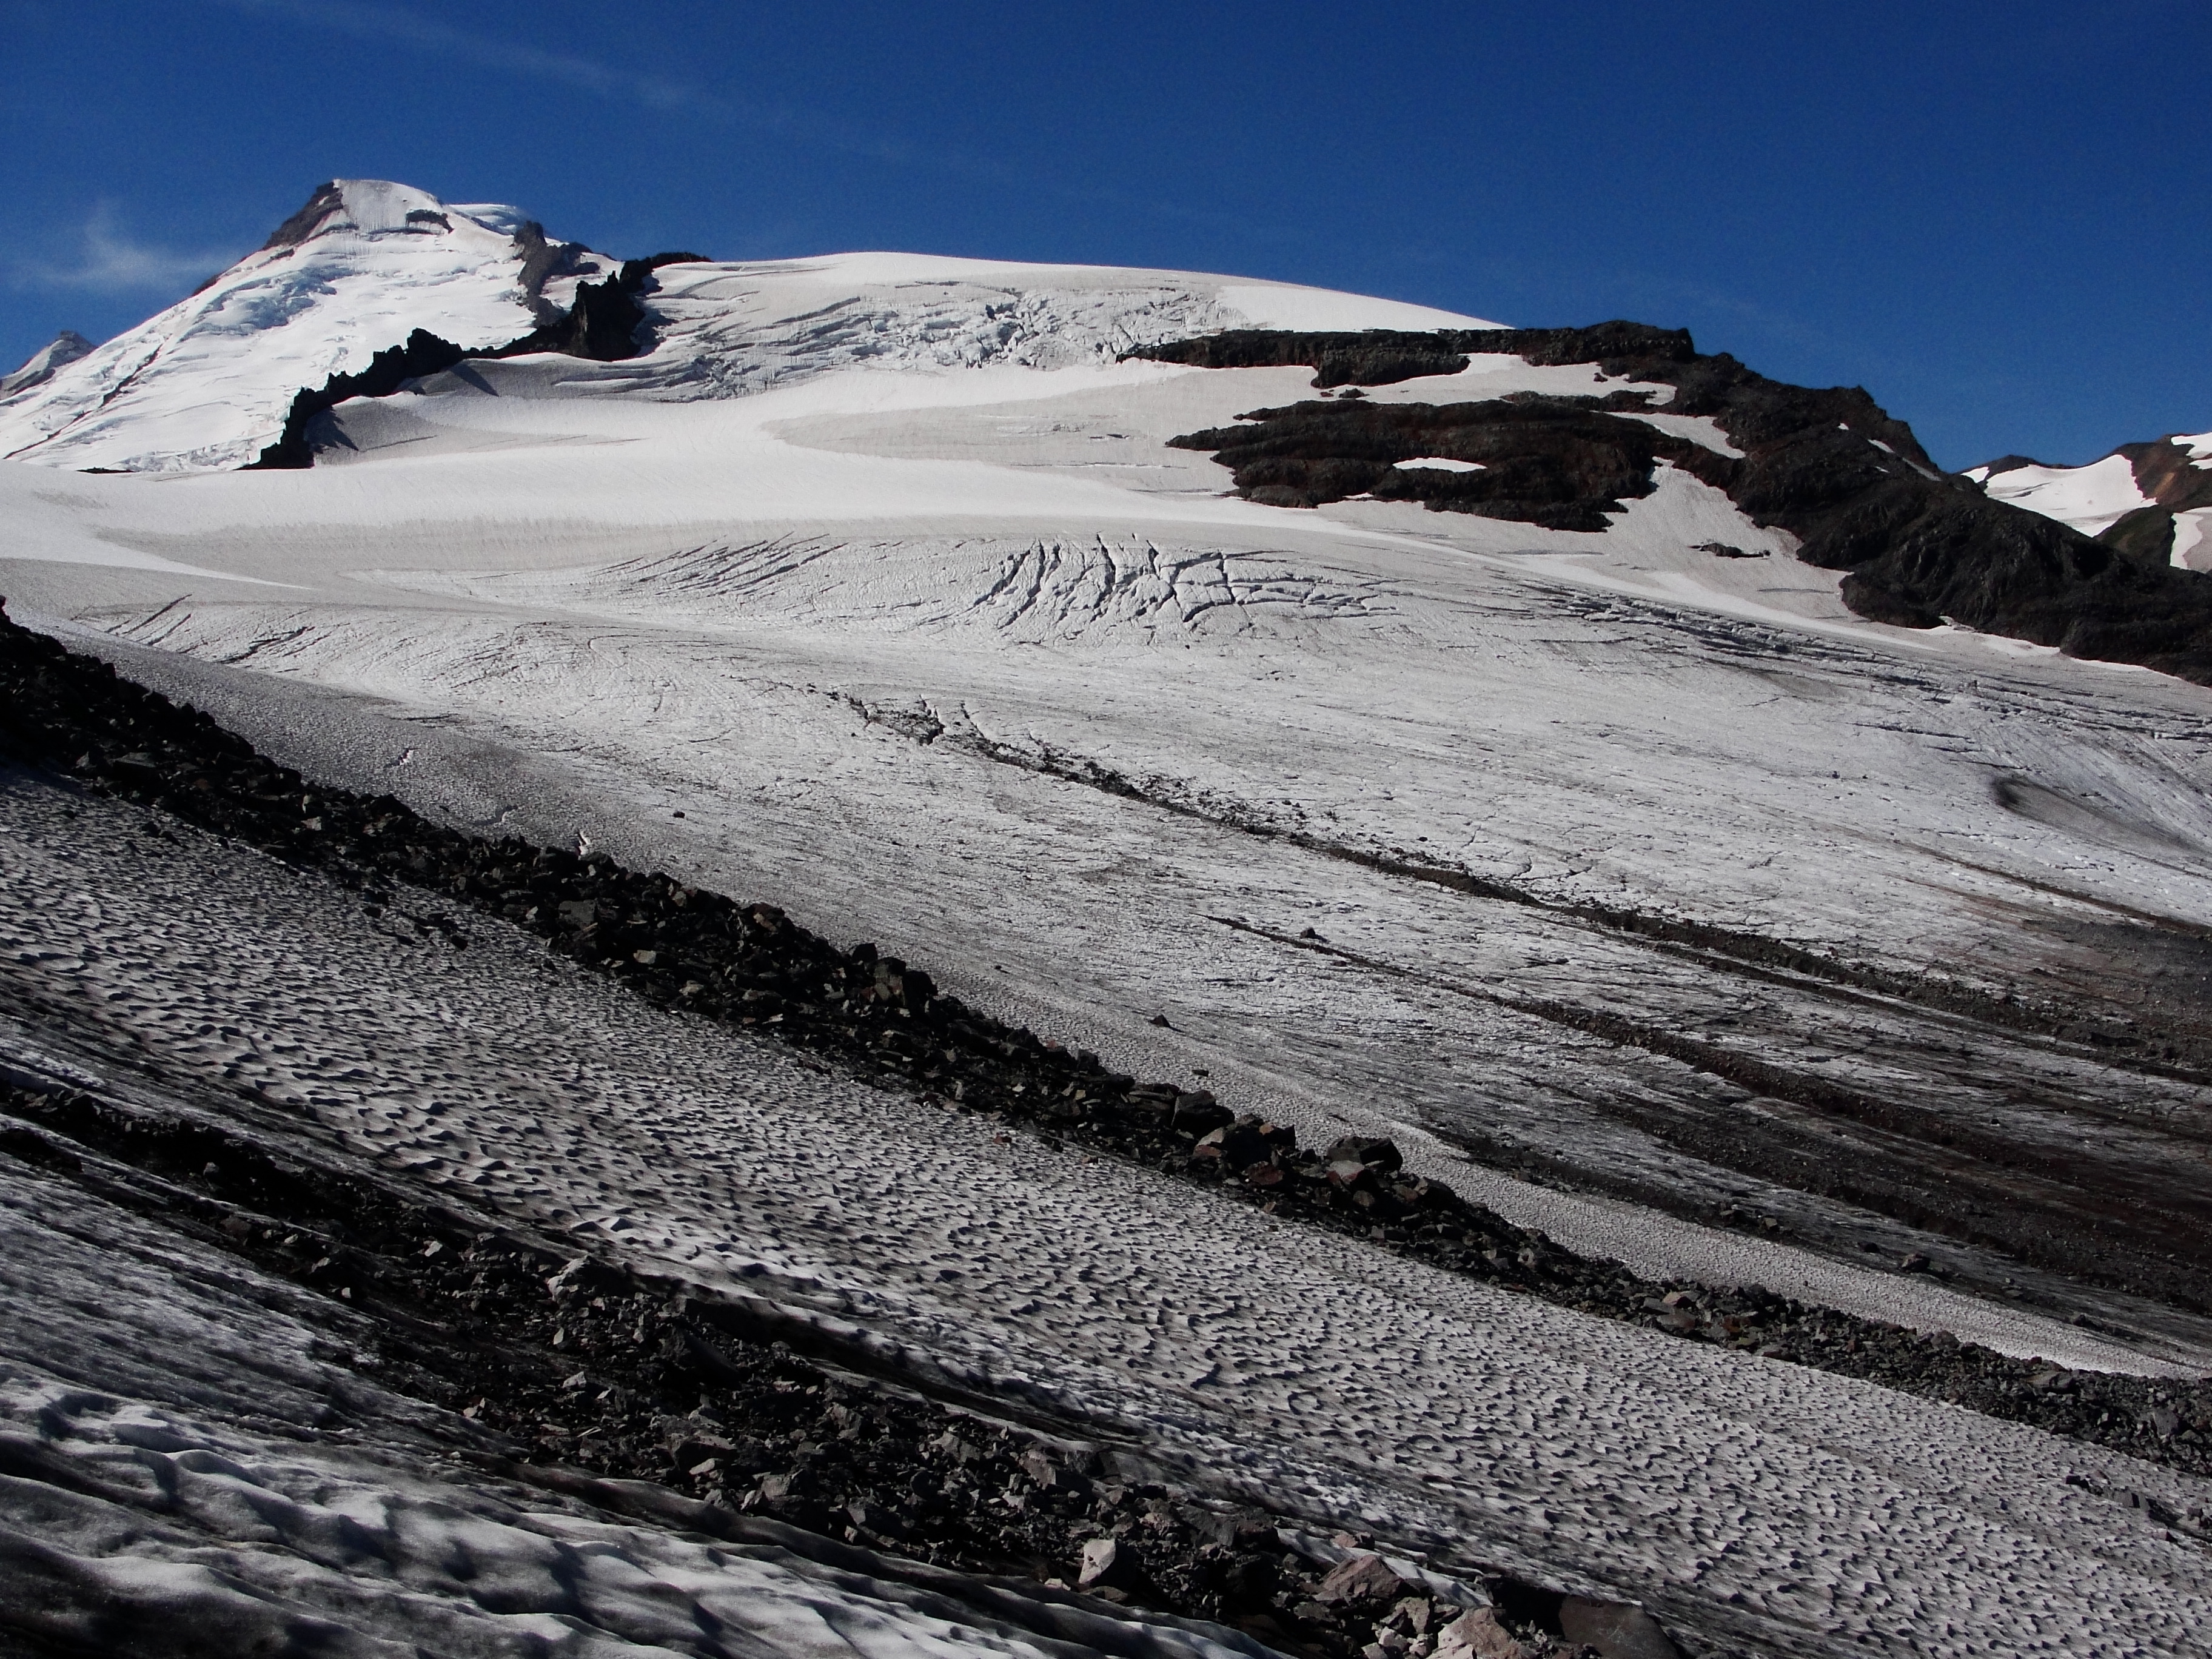
Foss Glacier retreat.

Slide3

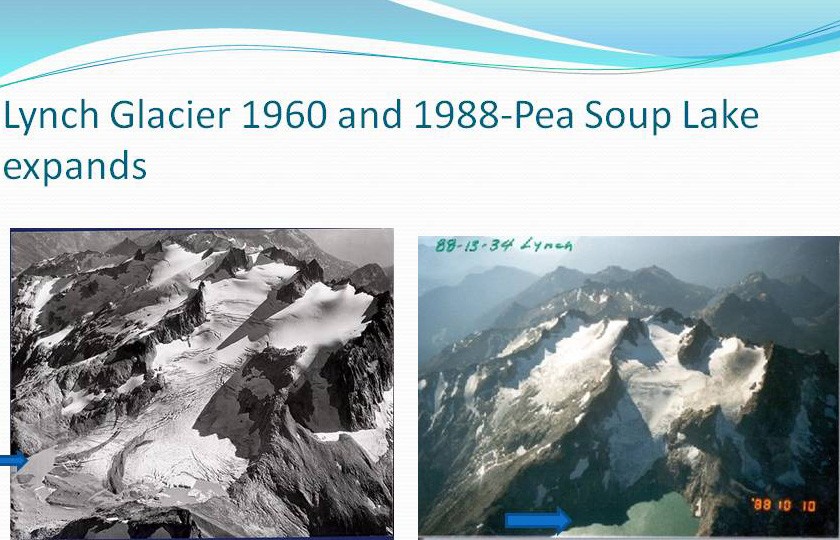
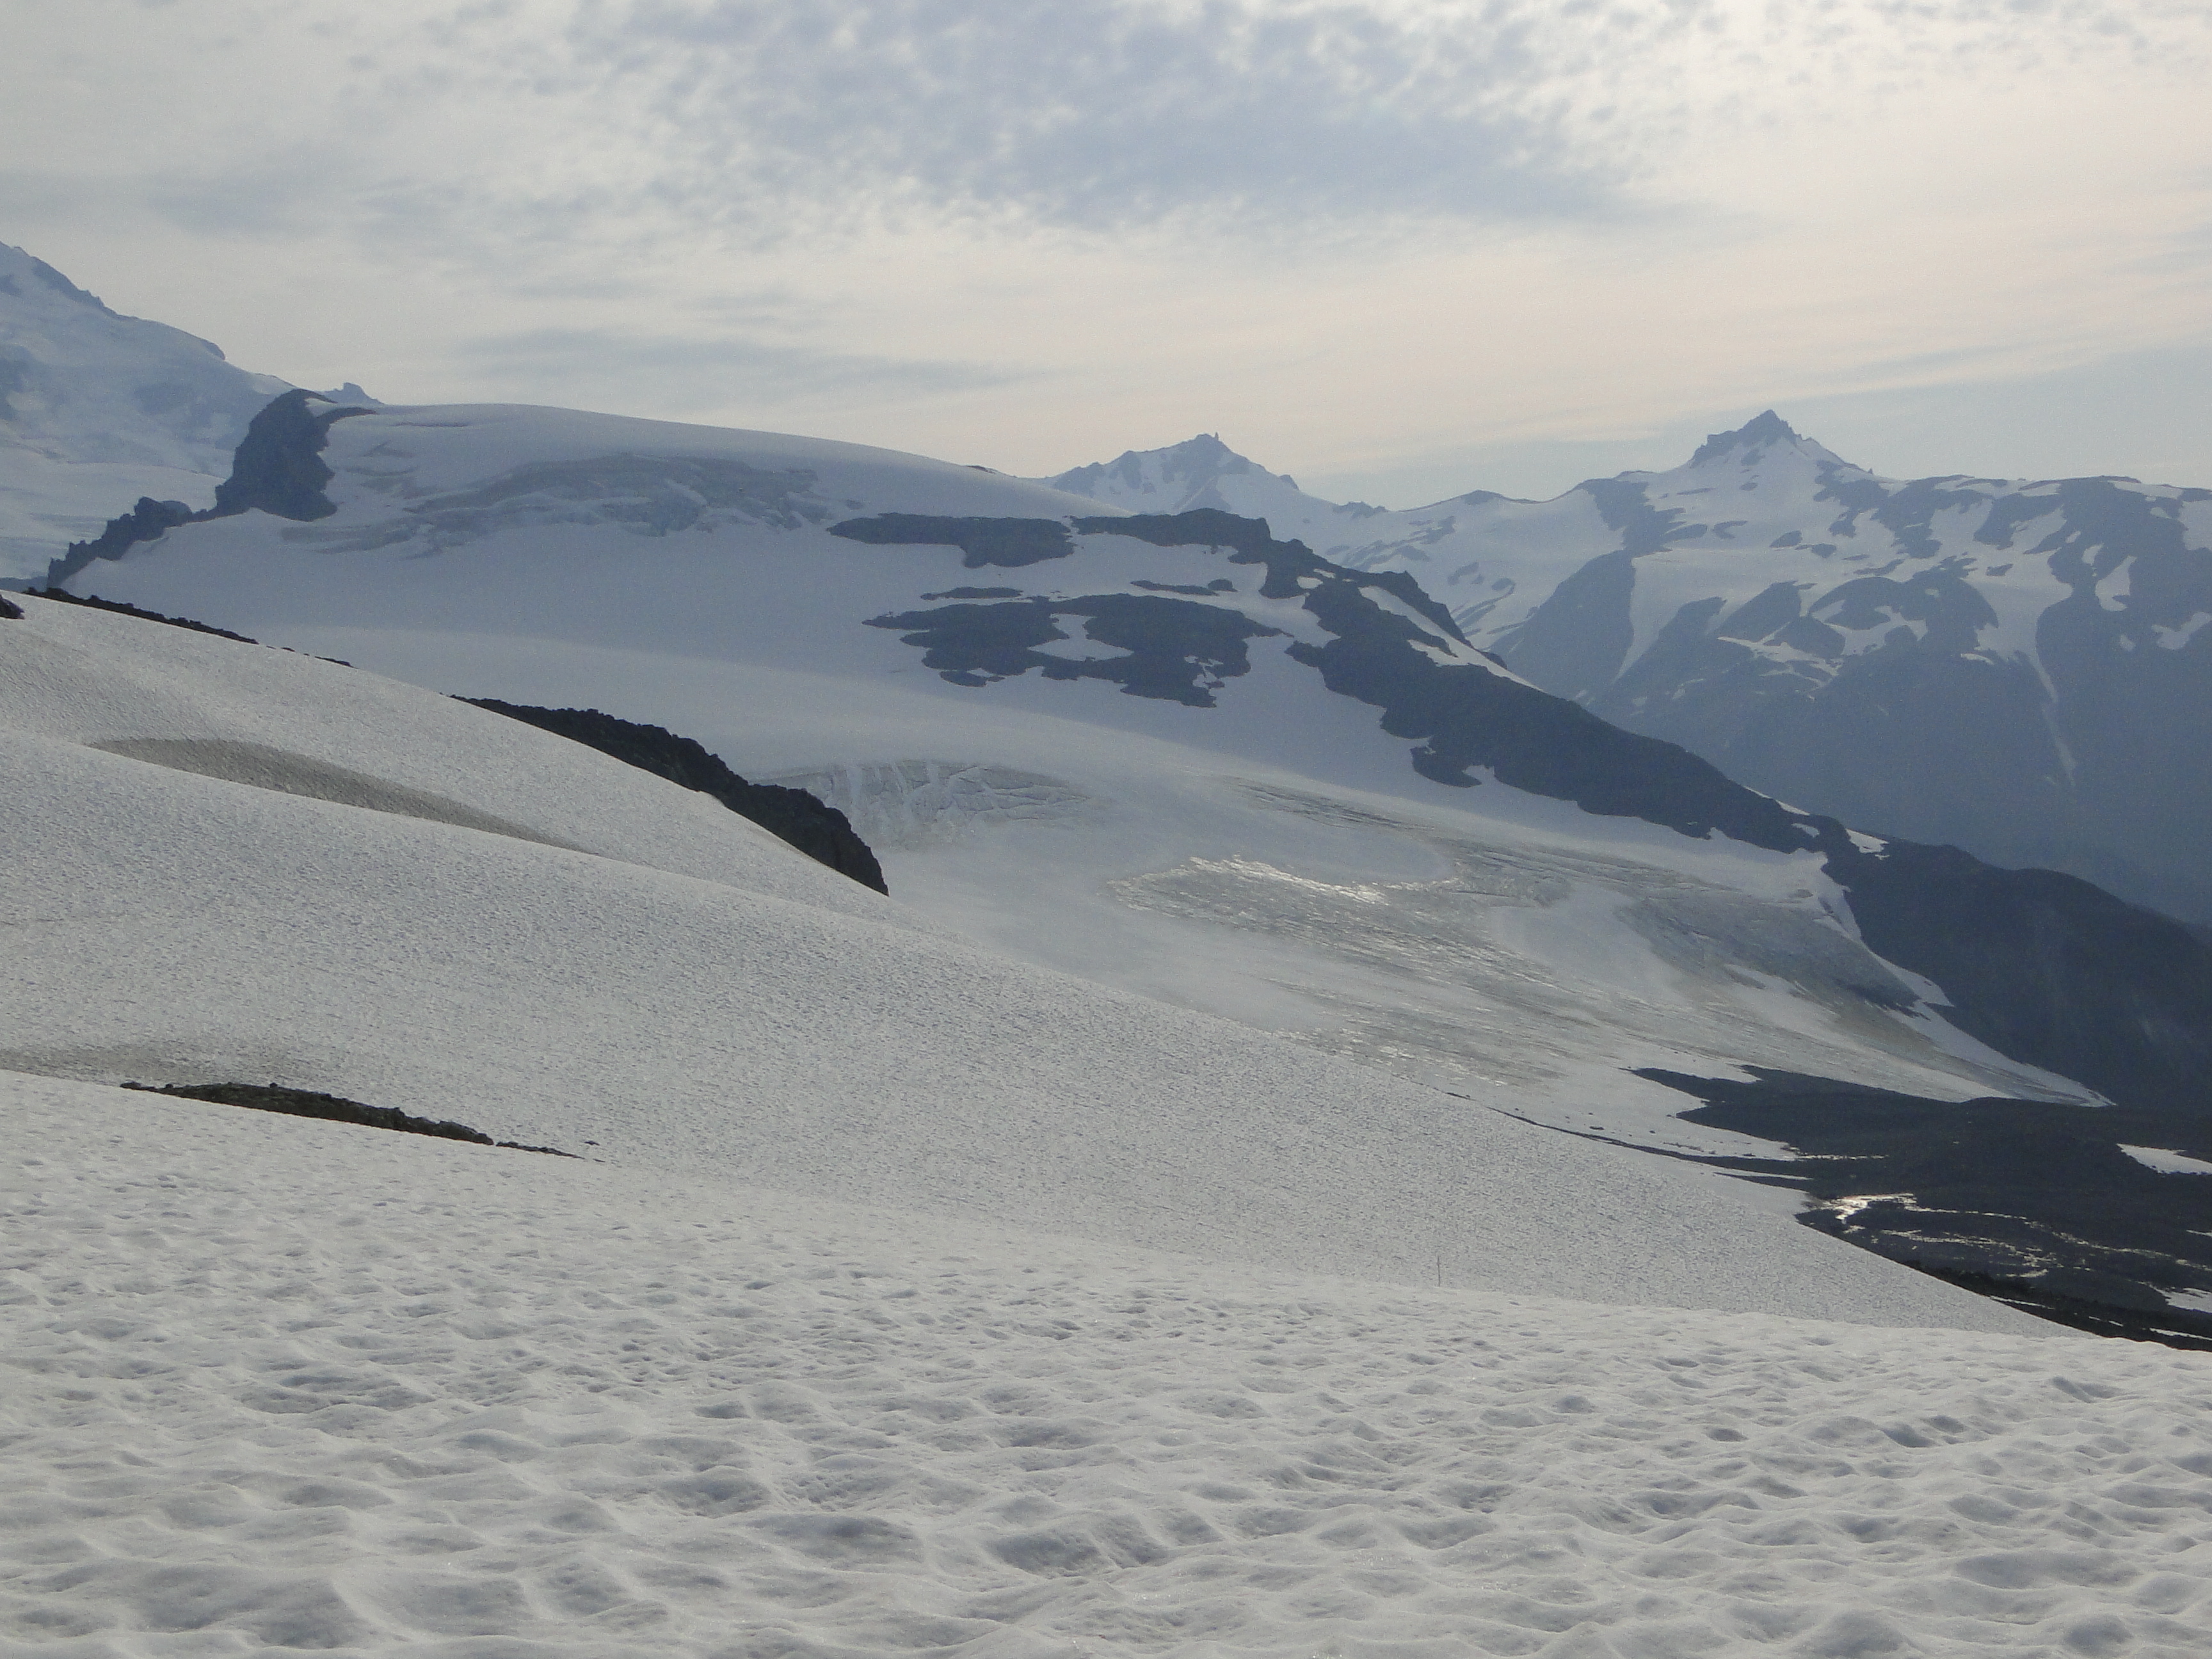
Lynch glacier Retreat

Slide8

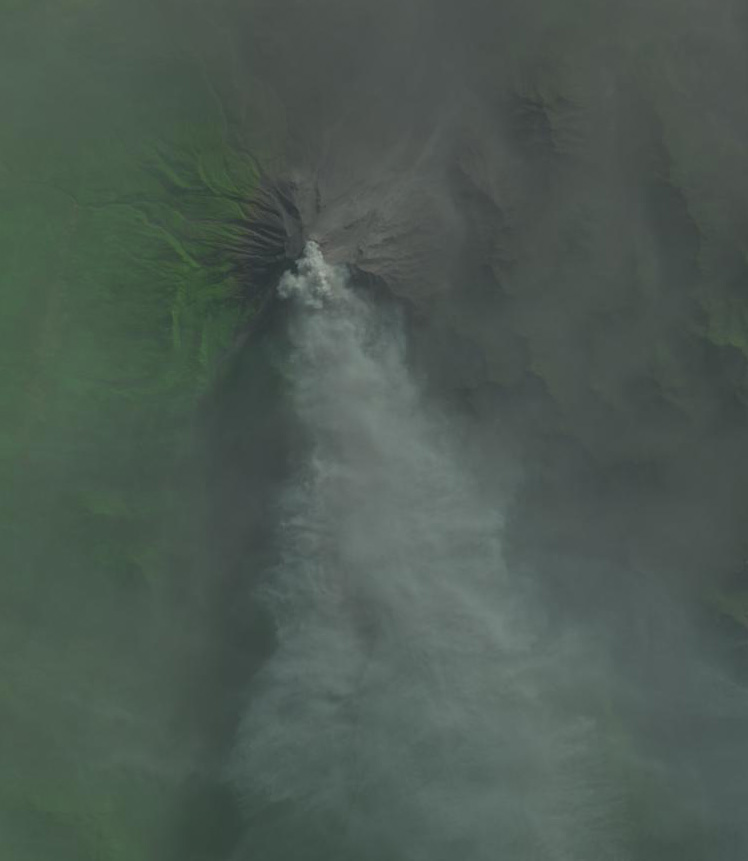
Hinman Glacier, view from former terminus

Slide15
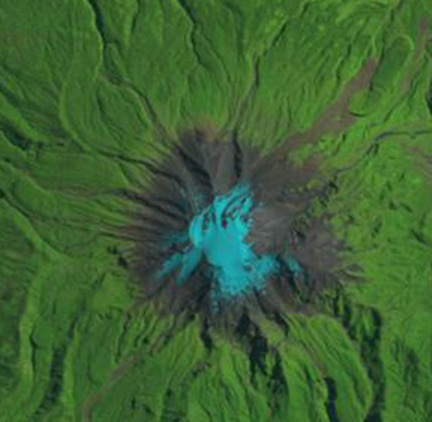
Columbia Glacier losing its snowcover in the accumulation zone.
Slide12
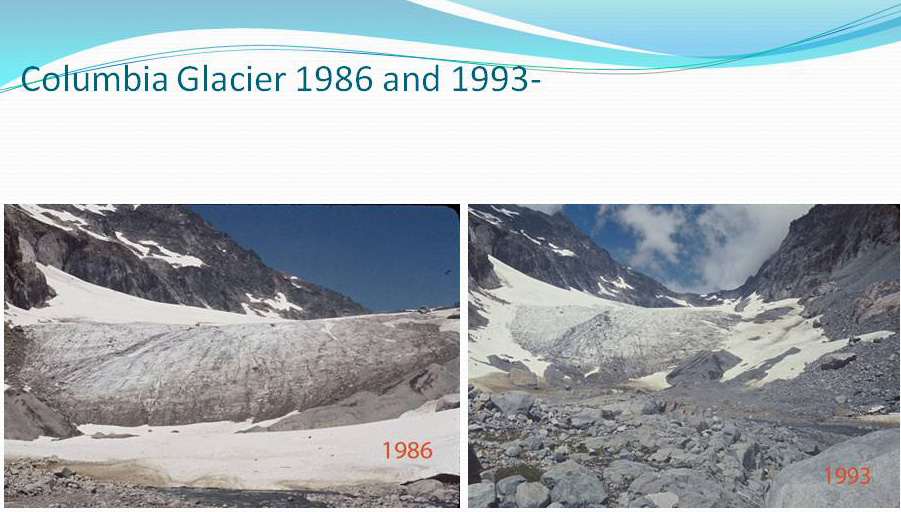
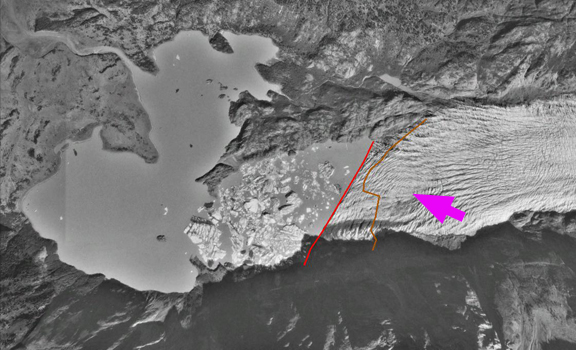
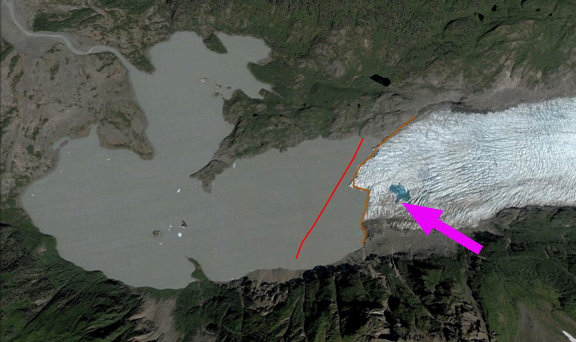
Columbia Glacier Retreat. Detailed report. 

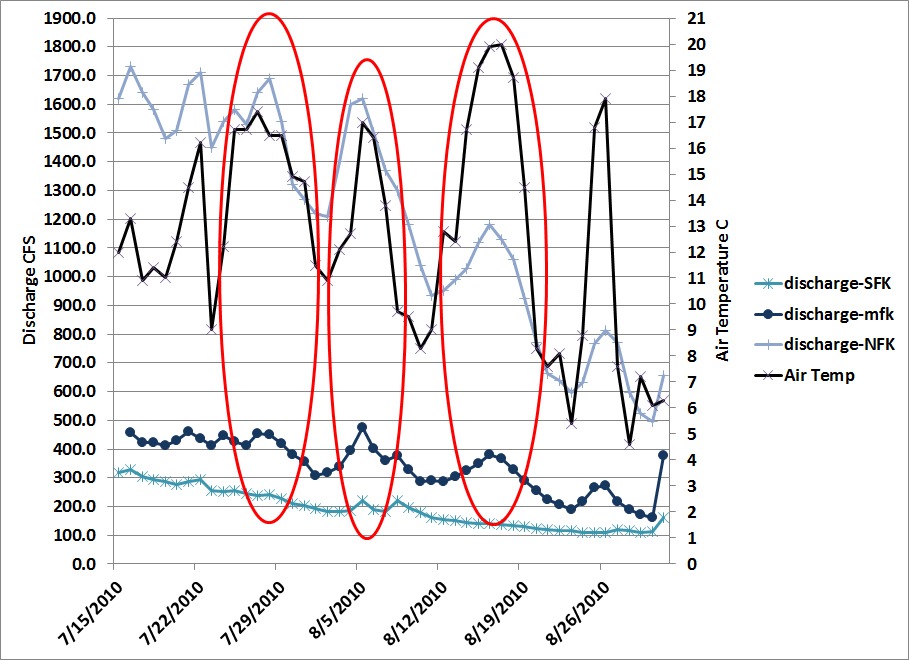
A key threshold of in-stream flow levels considered insufficient to maintain short term survival of fish stocks is below 10% of the mean annual flow (Tennant, 1976). For the Skykomish River 10% of mean annual flow is 14 m3s-1. In the Skykomish River from 1950-2013 there have been 230 melt season days with discharge below 14 m3s-1. Of these 228, or 99% of the low flow days, have occurred since 1985. The loss of 30-40% of the glacier runoff is a key reason for the onset of critical low flow days. Of more concern for aquatic life is the occurrence of extended periods of low flow (Tennant, 1976). From 1929-2009 in the Skykomish River basin there have been eight years where streamflow dropped below 14 m3s-1 for 10 consecutive days during the melt season, 1986, 1987, 1992, 1998, 2003, 2005, 2006 and 2007.  It is likely that 2015 will join this list.

skymin

Number of days when flow fell below 10% of the long term mean annual flow. Only one day from 1950 to 1985 met this criteria. Precipitation has not declined substantially during this interval, hence earlier snowmelt, reduced glacier runoff and greater evapotranspiration must be causing the increase in late summer low flow periods. The 38% reduction in glacier runoff did not lead to a significant decline in the percentage summer runoff contributed by glaciers under average conditions; the contribution has remained in the range of 1-3% from July-September. The glacier runoff decline impacted river discharge only during low flow periods in August and September. In August, 2003 and 2005 glacier ablation contributed 1.5-1.6 m3s-1 to total discharge, or 10-11% of August discharge. While declining glacier area in the region has and will lead to reduced glacier runoff and reduced late summer streamflow, it has limited impact on the Skykomish River except during periods of critically low flow, below 14 m3s-1 when glaciers currently contribute more than 10% of the streamflow.

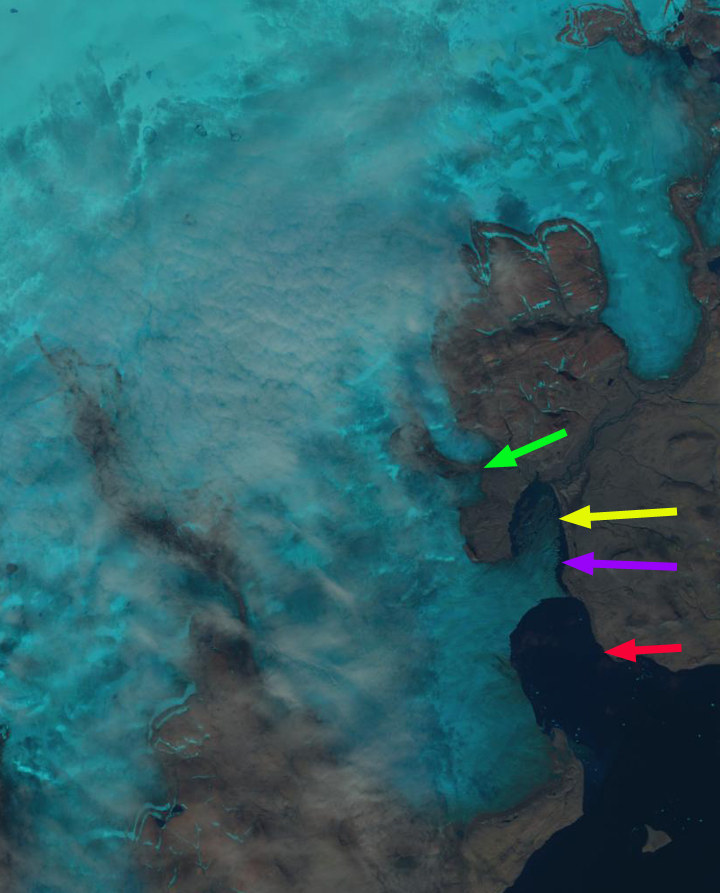
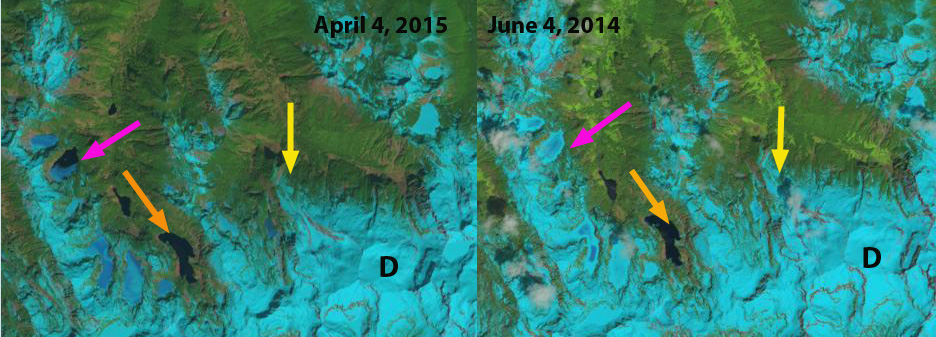
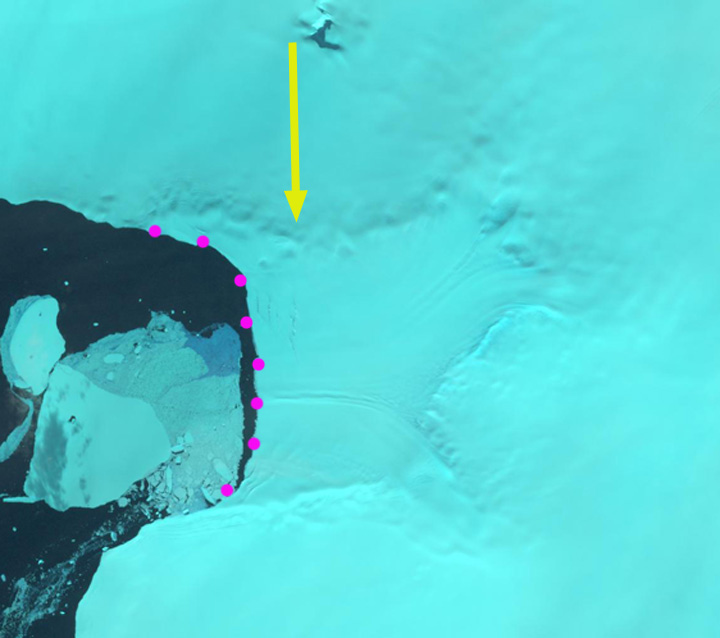
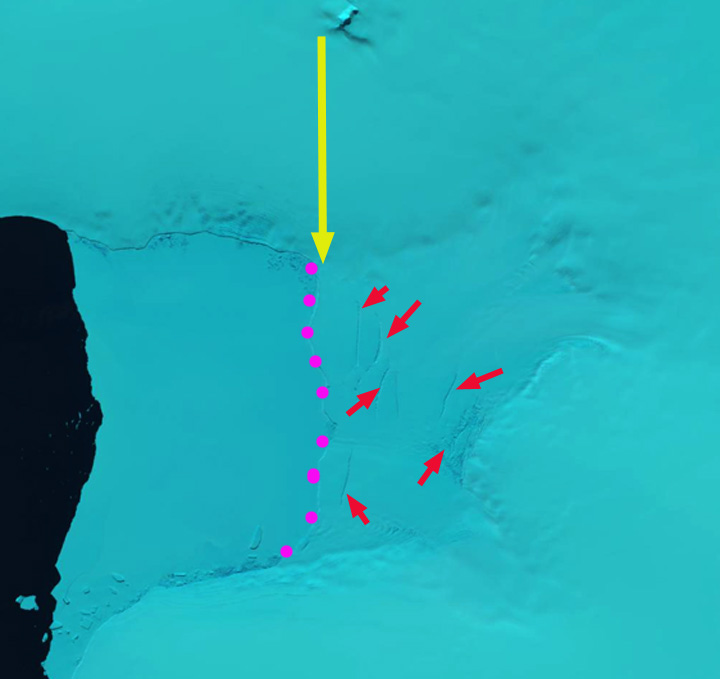
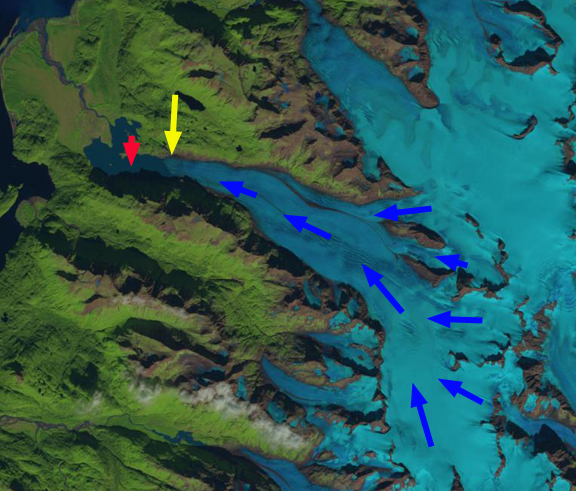
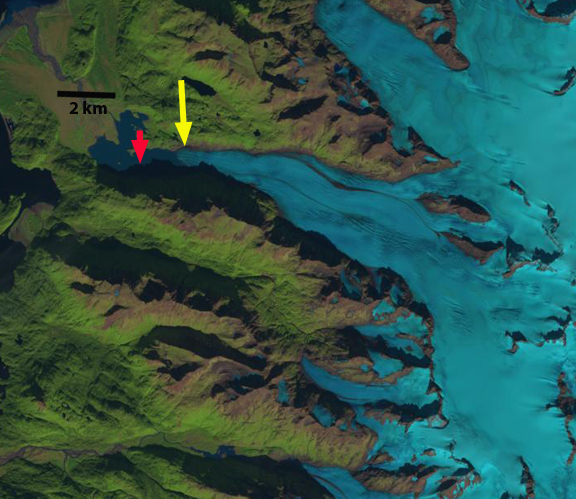
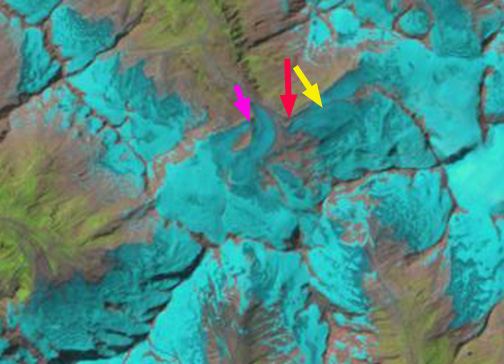
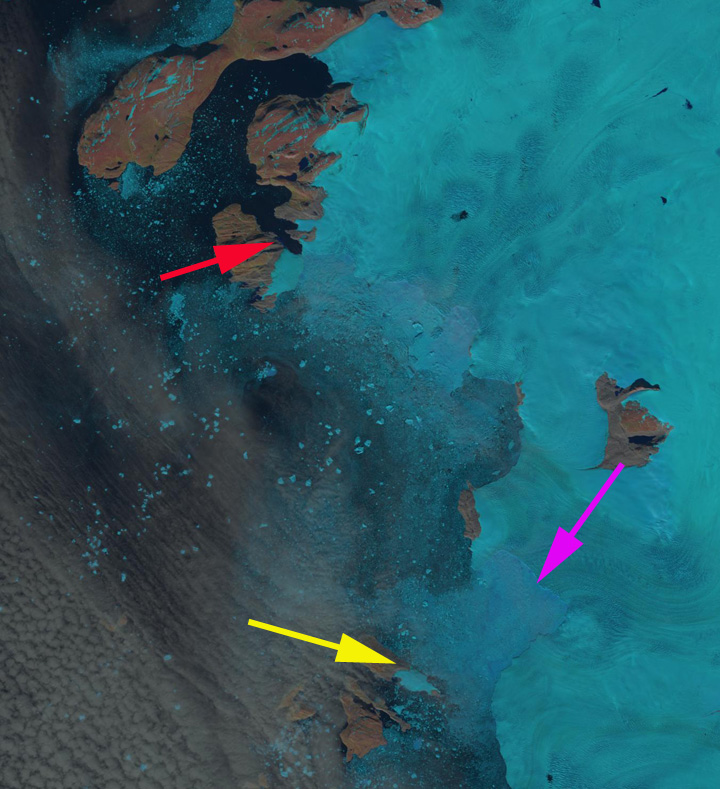
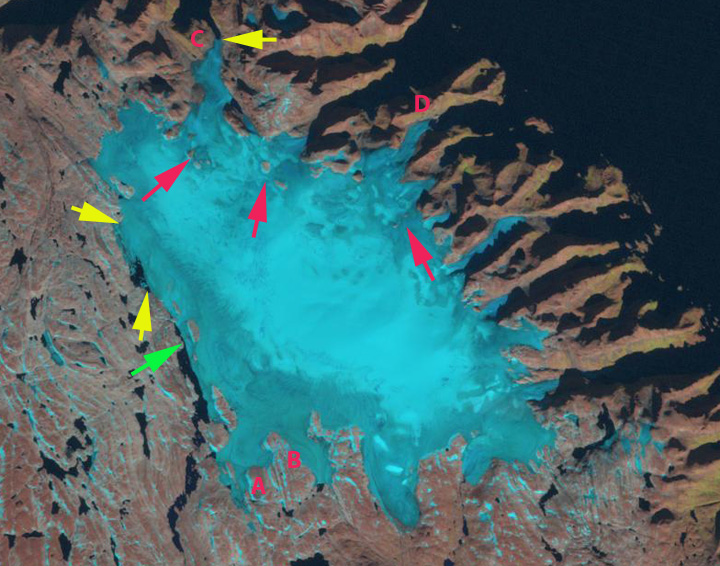
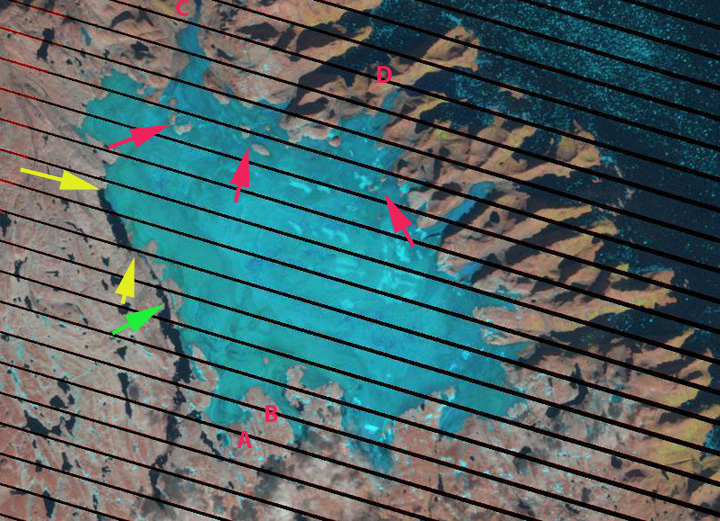
For 2015 the lack of snowpack in the Skykomish Basin is evident from a comparison of images from April 20th 2015 and June 4th, 2014. Snowpack during 2014, an average winter, was higher in mid-June than in mid-April in 2015. Arrows in each side by side are in same location. This indicates that the pluvial and nival segment of flow to the Skykomish River will be at a minimum late this summer. Currently flow at the USGS gage in Gold Bar is 28% of normal at 2050 CFS, which is an all time low for the record that begins in 1929, previous low in 1977 at 2755 CFS. The river has not reached 2750 CFS the entire month of May. Glacier flow has continued to decline with area extent losses. This combination makes it likely, that the Skykomish River will have an extended period of low flow this summer and into the fall. If the summer is drier than average, flows will likely reach a new minimum.
blanca lake compare
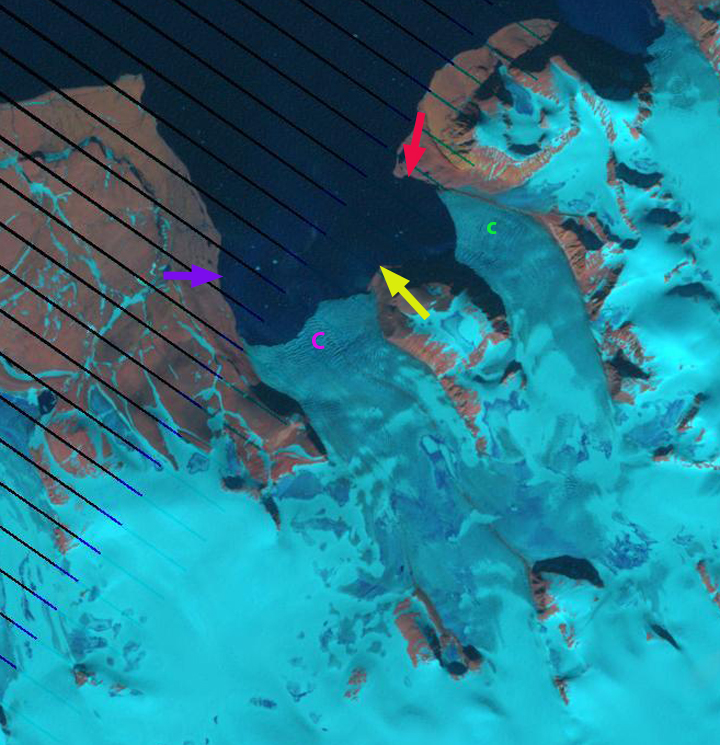
Snowpack comparison in the area of the North Fork Skykomish near Columbia Glacier (C) in April 2015 compared to a snowier June, 2014.
south fork compare
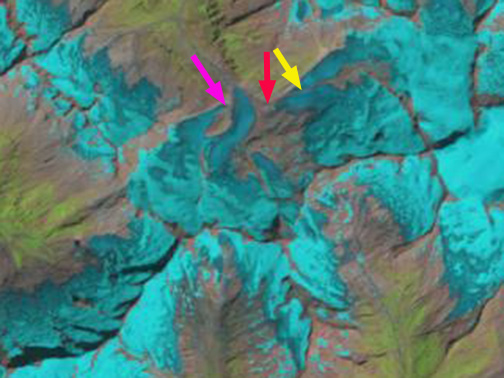
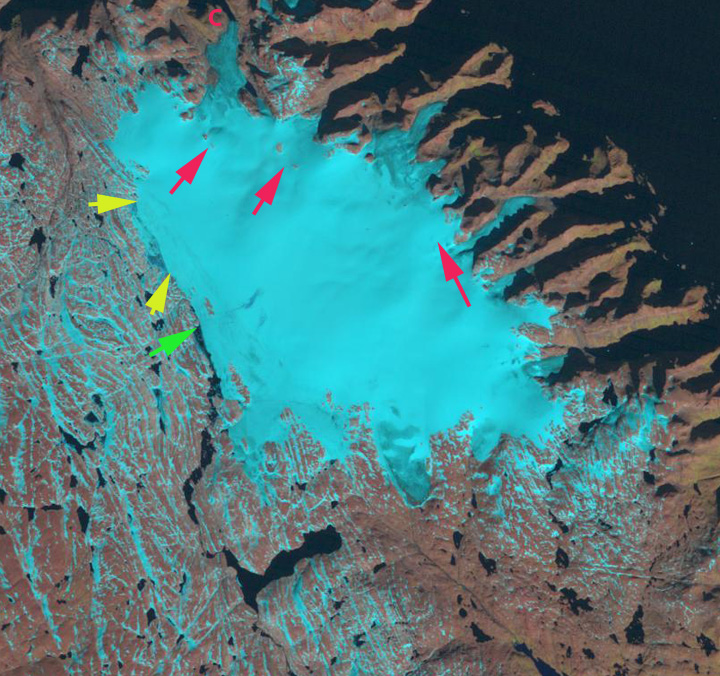
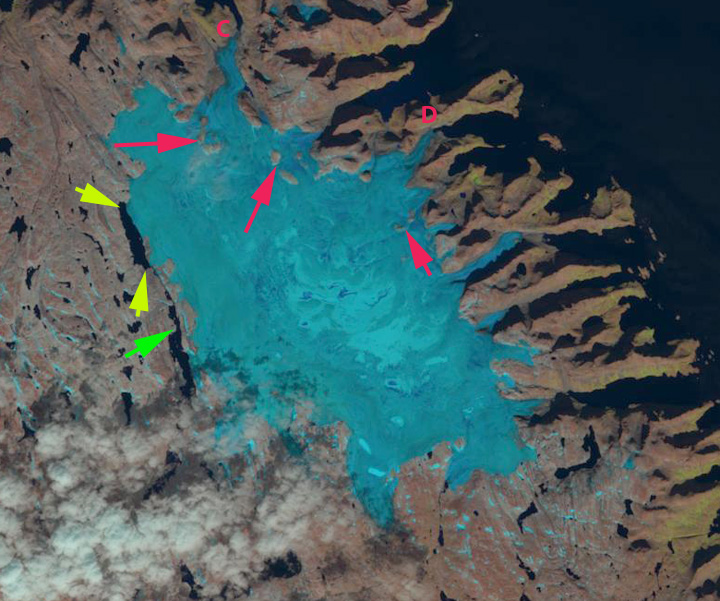
Snowpack comparison in the area of the South Fork Skykomish near Lynch Glacier (D) in April 2015 compared to a snowier June, 2014.
columbia2012
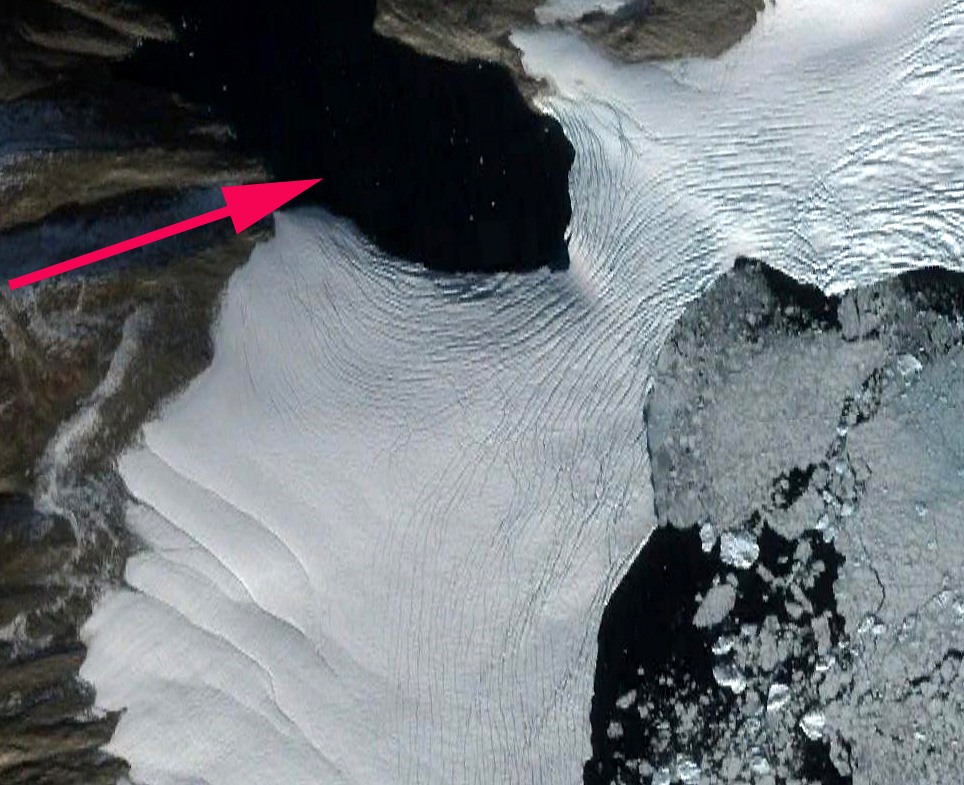
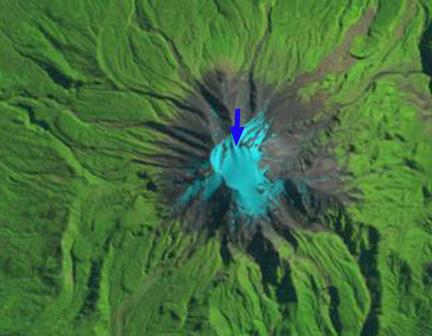
Terminus image of Columbia Glacier in March 2015 (below) with less overall snow than in the image above from August, 2013. (picture below from Rowan Stewart)
columbia terminus march

Developing Instability of Verdi Ice Shelf, Antarctica: Extensive Rift Formation

The Verdi Ice Shelf is a small ice shelf on the Beethoven Peninsula of Alexander Island on the Antarctic Peninsula. Its small size limits its global importance, but it does provide an excellent example of the rapid development of rifting that indicates potential instability. An ice shelf is a floating portion of a glacier, it buttresses glaciers that drain into it and is in turn buttressed by pinning points along the margin and within the ice shelf provided by islands and ice rises. Ice Shelf processes are well described by Davies (2014).

Cook and Vaughan (2010)  observed that in recent decades, seven out of twelve larger ice shelves around the Antarctic Peninsula have retreated significantly or been almost entirely lost. This is a pattern of behavior that indicates the ability of ice shelves to collapse entirely or significantly in a short period of time. A recent paper by Holland et al (2015) noted that the much larger Larsen C Ice Shelf is thinning from above and below. The thinning of an ice shelf is the essential pre-conditioning for collapse (Pelto, 2008). NASA last week also predicted the demise within five years of the remaining portion of Larsen B.

Holt et al (2013) outlined several key glaciological characteristics as typically preceding recent ice shelf collapses:

(1) Sustained ice-front retreat, resulting in a frontal geometry that bows inwards towards its centre from both lateral pinning points (Doake et al., 1998);

(2) Continued thinning from atmospheric or oceanic warming (Shepherd et al., 2004);

(3) An increase in flow speed:

(4) Structural weakening,  such as rifting along suture zones (Glasser and Scambos, 2008), and also rifting transverse-to-flow due to changing stress regimes within the ice shelf (Braun et al., 2009). Braun et al (2009) note that for Wilkins Ice Shelf just to the north of Verdi Ice Shelf surface melt and drainage of melt ponds into crevasses were not relevant for break-up. Increased buoyancy forces from thinning caused rift formation before the break-up in February 2008 was the key. Glasser et al (2011) examined the Röhss Glacier following the 1995 collapse of the Prince Gustav Ice Shelf, Antarctic Peninsula identifying the development of numerous structural discontinuities: rifts, crevasses and melt ponds on the ice shelf before the collapse.

Here we examine Landsat imagery of Verdi Ice Shelf from 2000-2014. To identify both frontal changes and structural changes.

LayoutForPDF
Map of the Verdi Ice Shelf region taken from the USGS Palmer Land Map.

The above map indicates retreat of 1.5-2 km of the ice front from 1973-2001 and that the front is bowed inward at the center meeting the first criteria noted above. In each image the yellow arrow indicates the 2001 ice front of Verdi Ice Shelf on the northeast side. The pink dots in each image is the complete ice front. The red arrow indicate large rifts visible in the Landsat images, which have a 30 m resolution. In 1999 there are no major visible rifts. There are a few minor rifts close to the ice front. The maximum length of the ice shelf is 14.5 km. In 2001 the frontal position has not changed significantly and no significant rifts are visible. In 2003 the ice front has retreated 0.5-1 km, there are two minor visible near the ice front, to the left (west) of the yellow arrow. In 2013 and 2014 the maximum length of the ice shelf has declined to 12.5 km, a 2 km retreat in 15 years. More importantly there are now six significant rifts in the ice shelf, including two well back of the ice front. The rifts range from 2-4 km in length, a significant portion of the entire ice shelf width. The most inland rifted area noted occurs at the inland edge of the ice shelf and instead of a single rift is an area of numerous smaller rifts. The rapid development of the rifts suggests the ice shelf has thinned to a point of instability. This does not mean it will disintegrate entirely or immediately, but does suggest that most of the ice shelf is poised to collapse in the next decade.

Similar recent ice shelf changes reviewed are: Jones Ice Shelf and Wordie Ice Shelf. The understanding of the processes has taken detailed field work by many field teams. Examples being the LARsen Ice Shelf System, Antarctica (LARISSA) team and the British Antarctic Survey supported research at James Ross Island and Wilkins/Larsen Ice Shelf.

verdi is 1999
1999 Google Earth image

verdi is 2001
2001 Landsat image

verdi is 2003
2003 Landsat image

verdi is 2013
2013 Landsat image

verdi is 2014
2014 Landsat image

Retreat of Grewingk Glacier, Alaska 1986-2014

Grewingk Glacier drains west toward the Kachemak Bay, Alaska terminating in a proglacial lake in Kachemak Bay State Park.  The glacier drains an icefield on the Kenai Peninsula, glaciers draining west are in the Kenai Fjords National Park. The glaciers that drain east toward are in the Kenai Fjords National Park, which has a monitoring program.  Giffen et al (2008) observed the retreat of glaciers in the region. From 1950-2005 all 27 glaciers in the Kenai Icefield region examined  are retreating. Giffen et al (2008)observed that Grewingk Glacier retreated 2.5 km from 1950-2005.  Here we examine Landsat imagery from 1986-2014 to illustrate the retreat of the glacier.  The icefront continues to calve into the expanding pro-glacial lake.

grewingk map

1951 based USGS Topographic map Seldovia C-3

The red arrow is the 1986 terminus location at the midpoint, the yellow arrow is the 2014 mid-point terminus location. In 1951 the glacier extended beyond the peninsula at the red arrow into the wider portion of the lake. By 1986 the glacier had retreated into the narrow section of the lake extending east into the mountains, the southern margin of the terminus is further advanced than the northern margin.  The orange dots indicate discoloration of the glacier surface from volcanic ash deposited on the glacier surface from Augustine Volcano in 1986. In 1989 there is not a marked change. In a 1996 Google Earth image, there is considerable icebergs indicating a recent collapse of a section of the terminus. The pink arrow indicates concentric crevasses, indicating a depression, the red line is the terminus in 1996 and the brown line the 2003 terminus.

By 2001 the terminus has retreated m, and the glacier front is now oriented north-south across the lake. In 2003 the depression from 1996 now has a small supraglacial lake, the terminus has retreated 500 m on the southern margin and 200 m on the northern margin. In 2013 the glacier has retreated an additional 600 m and the southern margin has now receded further upvalley than the northern margin. Blue arrows indicate direction of glacier flow.  By 2014 the glacier has retreated 1.4 km since 1986, 50 m per year. There is an increase in the glacier slope 2.5 km above the terminus where crevassing increases.  This suggests the lake will end by or at this point, which would then lead to a reduction in retreat rate.

This retreat follows that of Pederson Glacier, Four-Peaked Glacier and Spotted Glacier. The continued reduction in glacier size leads to changes to the Kachemak Bay estuary. Kachemak Bay is the largest estuarine reserve in the National Estuarine Research Reserve System. It is one of the most productive, diverse estuaries in Alaska, with an abundance of Steller sea lions, seals, sea otters, five species of Pacific salmon, halibut,herring, dungeness crabs and king crabs (NERRS, 2009). The estuary salmon fishing industry is, one of Kachemak Bay’s most important resources and livelihoods.

grewingk Glacier 1986a
1986 Landsat Image

Grewingk 1989
1989 Landsat Image

grewingk 1996 ge
1996 Google Earth Image

grewingk glacier 2001
2001 Landsat Image

grewingk 2003 ge
2003 Google Earth Image

grewingk glacier 2013a
2013 Landsat Image

grewingk glacier 2014
2014 Landsat Image


Disaggregation of Austria’s Third Largest Glacier, Obersulzbach Kees

The Obersulzbach Glacier, is situated in the uppermost part of the Obersulzbach Valley, which feeds the Salzach River system in Austria. The glacier drains the northeastern flank of Großvenediger. The glacier was the third largest glacier in Austria in the 1980’s, but in the last several decades separated into five distinct sections. Now that it is in five parts, should it be listed as such?

Yes, given that the Austrian Glacier Inventory has reclassified the glacier as five separate glaciers (Fischer et al, 2014). In this post they are numbered 1=Krimmlertorl Kees, 2=Obersulzbach Kees, 3=Bleidacher Kees, 4=Sulzbacher Kees, 5=Venediger Kees.

Nick Fisher sent me a map of the glacier prepared by the Austrian Military in the early 1930’s this is compared to the GE image of the glacier from 2012, below. According to this map, in 1934 the ice was at least 150 m deep over the current lake surface, where all the glacier streams united before heading down the ice fall. In 1934 the five branches of the Obersulzbach all joined and continued downglacier past a prominent rib on the east side of the glacier, light blue arrow, to terminate at 1980 meters, green arrow. The two western most glaciers Krimmerlertorl and Obersulzbach on the images, were joined at the pink arrow in 1934 and are well separated in 2012.  At the orange arrow in 1934 Bleidacher (3) flowed over a steep cliff and joined the other segments.  Today the glacier section ends at the top of a steep cliff.  Glacier Sulzbacher and Venediger are the largest and easternmost draining the actual slopes of Großvenediger.  They joined the other segments in 1934. By 1988 they had retreated to the red arrow but the two were still joined, by 2012 they had separated at the yellow arrow.  Hence, we now have separate glaciers that formerly joined together. The World Glacier Monitoring Service reports indicate this glacier retreated 140 meters from 1991-2000 and 345 m from 2001-2010, a substantial increase. Here we examine Landsat imagery from 1988, 1998, 2012, 2013 and 2014 to identify the retreat andand separation of the glacier into.  By 1998 a small lake less than 100 m long has formed at the end of the glacier, blue arrow.

obersulzbachkees map
Map of the Obersulzbach Region in 1934 from Nick Fisher
obersulzbach ge 2012
Google Earth image from 2012

In 1988 there is no lake visible at the end of the main terminus. The glacier has retreated 1.4 km since 1934. At the pink arrow glacier Krimmerlertorl and Obersulzbach are still joined in 1988. Glacier Sulzbacher and Venediger are also still joined at the yellow arrow and terminate at the red arrow. Glacier section Bleidacher has become detached.

By 1998 Krimmerlertorl and Obersulzbach are separated but the eastern glaciers Sulzbacher and Venediger are still joined at the yellow arrow. No lake yet exists at the terminus. Obersulzbach Glacier receded in a narrow bedrock basin since the late 1990’s and a shallow lake, Obersulzbach-Gletschersee, has formed since 1998 (Geilhausen et al, 2012). They observed that in 2009, the lake had an area of 95,000 m2 with a maximum depth of 42 m.

By 2013 all the glacier segments are separate. By 2013 the lake, Obersulzbach-Gletschersee,has grown to a length of 450 m and a with of over 200 meters. The retreat from 1988-2013 of glaciers Krimmerlertorl=0.8 km, Obersulzbach=0.6 km, Bleidacher=1.3 km, Sulzbacher=1.4 km, Venediger=1.6 km. The 2014 image is not as clear, but further retreat did occur.  The Austrian Alpine Club 124th annual survey indicated 86% of Austrian glaciers retreated from 2013-2014.

The Salzach is fed by many glaciers covering over 100 square kilometers (Koboltschnig and Schoner, 2011). These glaciers melt all summer providing considerable runoff to the numerous hydropower projects along the Salzach, that can produce 260 MW of power. The Verbund Power Plant producing 13 MW is seen below, at blue arrow. Glacier area loss will lead to declines in summer runoff.  A mass balance program has been started on Venediger Kees.

This glaciers retreat fits the pattern of other glaciers in the Austrian Alps, Oberaar Glacier, Rotmoosferner and Ochsentaler.

obersulzbachkees 1988
1988 Landsat image
obersulzbachkees 1998
1998 Landsat image
obersulzbachkees 2013
2013 Landsat image
obersulzbachkees 2014
2014 Landsat image
salzbach hydro


Verbund Power Station, blue arrow.

Island Separates from Greenland Ice Sheet in 2014, Steenstrup Glacier

The retreat of outlet glaciers along the Greenland coast continues to change the maps of the region, Steenstrup Glacier located at 75.2 N in Northwest Greenland is an example of this. The glacier terminates on a series of headlands and islands, the glacier immediately to the south is Kjer Glacier. The boundary between Steenstrup Glacier and Kjer Glacier is Red Head, Steenstrup Glacier’s northern margin is near Cape Seddon. Here we examine changes in the terminus position of Steenstrup and Kjer Glacier from 1999 to 2014. The retreat of the glacier during this interval has led to generation of new islands. Steenstrup Glacier has retreated 10 km over the past 60 years (Van As, 2010). A recent example of the retreat is the separation from the glacier of an island in 2014. In 2012 there was a narrow glacier connection, red arrow, with an island Tugtuligssup Sarqardlerssuua that is clearly not stable, based on narrowness and extensive crevassing, the connection remained in 2013 and was in 2014.

cape seddon crevasses
Google Earth 2012 image Cape Seddon/Tugtuligssup Sarqardlerssuua, how long will this connection last? Less than two years.

cape seddon comparison
Landsat image comparison of 2013 and 2014 of Cape Seddon/Tugtuligssup Sarqardlerssuua separation from Steenstrup Glacier.

steenstrup map
Image from Van As (2010).

McFadden et al (2011) noted several glaciers in Northwest Greenland; Sverdrups, Steenstrup, Upernavik, and Umiamako that had similar rapid thinning patterns of up to ~100 m a-1 since 2000. They further noted that thinning was not synchronous with Steenstrup and Sverdrups thinning fast from 2002 to 2005, Upernavik from 2005 to 2006, and Umiamako from 2007 to 2008. This is not exactly synchronous, but occurring within a few years is essentially synchronous in terms of glacier dynamics. Each glacier also had a coincident speed-up with a 20% acceleration for Steenstrup Glacier (McFadden et al, 2011). Kjer Glacier was noted as relatively stable until loss of connection with Red Head Peninsula in 2005 (Van As, 2010). This is a familiar pattern with thinning there is less friction at the calving front from the fjord walls and the fjord base, leading to greater velcoity. The enhanced flow leads to retreat and further thinning, resulting in the thinning and the acceleration spreading inland. The initial thinning comes from a combination of basal and surface melt. This has been the primary mechanism for increased velocity of outlet glacier of the Greenland Ice Sheet.

Here we examine Landsat images from 1999, 2013 and 2014 to identify changes of Steenstrup and Kjer Glacier. The yellow arrow indicates Red Head, which the glacier still reaches in 1999, though the connection is less than 2 km wide. The purple arrow indicates the ice front just north of Red Head that extends nearly due north to the next island at the icefront. The red arrow indicates the ice front of Steenstrup Glacier at Tugtuligssup Sarqardlerssuua. By 2013 the connection to Red Head has been lost, it is now an island, this occurred as noted by Van As (2010) in 2005. Retreat from Red Head is 6 km by 2013. There is a substantial embayment that develops, purple arrow southwest of an island still embedded in the icefront, indicating 4 km of retreat. North of this island that will soon lose it connection to the ice sheet, the embayment has expanded as well. The connection to the island at the north end of Kjer Glacier, has become much narrower since 1999 and will follow the route of Red Head and Tugtuligssup Sarqardlerssuua. In 2014 Steenstrup Glacier at the red arrow has separated from Tugtuligssup Sarqardlerssuua. The island west of the purple arrow still acts as a pinning point having stabilized the ice front here since 1975, but is now isolated in the same way as Red Head in 1999 and will soon be released from the glacier. From 2013 to 2014 the embayment is spreading inland and north.

The retreat here is coincident with the thinning and acceleration and follows the pattern of retreat and new island generation seen at Kong Oscar Glacier, Alison Glacier and Upernavik Glacier. The map of Greenland is continues to change at an accelerated rate, bottom image is a geologic Map from the Geological Survey of Denmark and Greenland. Red arrow again indicates Tugtuligssup Sarqardlerssuua.

steenstrup 1999ls
1999 Landsat Image

steenstrup 2013ls
2013 Landsat image

steenstrup 2014 ls
2014 Landsat image
gis sheet 5 nw
GEUS map of the region

Snow Deficit on Grinnell Ice Cap, Baffin Island, Canada

The Grinnell Ice Cap Is located on the Terra Incognita Peninsula on Baffin Island. The name suggests the reality that this is a not often visited or studied region. Two recent studies have changed our level of knowledge. Way (2015) notes that the ice cap has lost 18% of its area from 1974 to 2013 and that the rate of loss has greatly accelarated and is due to summer warming, declining from 134 km2 in 1973-1975 imagery to 110 square kilometers in 2010-2013 images. Papasodoro et al (2015) report the area in 2014 at 107 km2 with a maximum of elevation of close to 800 m. The location on a peninsula on the southern part of the island leads to higher precipitation and cool summer temperatures allowing fairly low elevation ice caps to have formed and persisted. Way (2015) in the figure below indicates the cool summer temperatures have warmed more than 1 C after 1990. Recent satellite imagery of snowcover and ICESat elevation mapping suggest little snow is being retained on the Grinnell Ice Cap since 2004. Papasodoro et al (2015) identify a longer mass loss rate of -0.37 meters per year from 1952-2014, not exceptionally different from many alpine glaciers. They further observed that from 2004-2014 this rate has accelerated to over -1 meter per year, including a thinning rate above 1.5 meters along the crest of ice cap. This can only be generated by net melting not ice dynamics. Further such rapid losses will prevent retaining even superimposed ice. Here we examine Landsat imagery from 1994 to 2014 to illustrate glacier response.

grinnell ice cap ge
Grinnell Ice Cap in Google Earth

gic summer climate
From Way (2015)

The red arrows in each image indicate areas of small nunataks that have begun to expand in the last decade. The yellow and green arrows indicate specific locations on the western margin of the ice cap where lakes are developing. Point A-D note specific locations adjacent to ice cap outlet glaciers. In 1994 the late August image indicates snowcover across most of the ice cap. The green arrow is at the northern end of a narrow lake. The yellows arrows are at the northern and southern end of a narrow ice filled depression. The nunatak area exposed at the red arrows is limited. At Point C the terminus is tidewater. In 2000 snow pack covers 40% of the ice cap. A small lake is developing at the yellow arrows. The glacier reaches the ocean at Point C and D. The glacier extends south of Point A and the outlet glacier at Point B is over a 1.2 km wide. In 2012 a warm summer led to the loss of all but snowpack on the glacier. At the red arrows the nunataks have doubled in size. At the yellow arrows a 2.5 km long lake has developed. At the green arrow a lake that has developed, is now separated from the glacier margin by bedrock. The glacier now terminates north of Point A. In 2014 again snowcover is minimal with two weeks left in the melt season. The outlet glaciers at Point C and D are no longer significantly tidewater. At Point B the outlet glacier is less than 0.5 km wide. The lake at the yellow arrows is 3 km long and 400 m wide. Some nunataks are coalescing with each other or the ice cap margin. The majority of the western margin of the ice cap has retreated 300-500 m. This retreat is surpassed at outlet glaciers by Point A and C. What is of greatest concern is the loss in thickness of over 1.5 per year on the highest portions of the ice cap, indicating no consistent accumulation zone. This results from the persistent loss of nearly all snowcover in the summer. This pattern of limited end of summer retained snowcover seen in most years since 2004, is a snow deficit that this ice cap cannot survive in our current warmer climate (Pelto, 2010). Way (2015) projects that that if the observed ice decline continues to AD 2100, the total area covered by ice at present will be reduced by more than 57%. Given the recent increases and lack of retained snowcover, suggests an even faster rate is likely.

GIC 1994
1994 Landsat image

gic 2000
2000 Landsat image

gic 2012 late2
2012 Landsat image

gic 2014 late2
2014 Landsat image

Calbuco Volcano Glaciers, Chile

Calbuco Volcano in Chile erupted this week.  It has been noted that significant pyroclastic flows/lahars have been observed travelling down the Rio Blanco fed in part by glacier melt.  Here we examine the glaciers on Calbuco.  We start with a 2012 Google Earth image that provides the clearest view.  There are three primary glaciers, the main summit ice cap , a glacier below the western rim, that is not significantly connected to the main ice cap in 2012 and a glacier descending the southwest flank.  There are numerous wind sculpted features observed from north-northeast to south-south west that also align with the flank glacier, blue arrows.  

The extent of retained snowcover in 2012 is quite poor, purple dots which would lead to significant mass balance loss and thinning. There are two locations of expanding bedrock exposure with glacier thinning, red arrows.  A review of available satellite imagery indicates that most years the summit ice cap retains good snow pack, but not in recent years with  2012, 2014 and 2015 having limited snowpack. The 2015 image is from March 26th just four weeks before the eruption. As in 2012 the glacier had lost almost all of its snowpack and was experiencing a large volume loss in 2015. This post will be updated with post eruption Landsat imagery when clear view is available. The last image in the post is from 4/27/2015 with the eruption ongoing, whether the glacier is completely gone or buried in ash impossible to discern.

calbuco glacier ge

2012 Google Earth image of Calbuco Volcano glaciers.

An examination of satellite imagery from 1985, 1998 and 2000 indicate this.  Since the majority of the glacier is right at the summit the eruption will lead to the loss of this glacier. Given the size of the main summit ice cap glacier, area of 0.95-1.05 square kilometers, a range of volume scaling method provides a volume estimate of 0.02 cubic kilometers of ice (Grinsted, 2013). The volume of glaciers has likely been limited by the frequency of eruptions in the last two centuries,; however, the volume has not been sustainable with current climate. The two main rivers draining the southwest flank glacier and summit ice cap drain south to Lago Chapo, yellow arrows. The volume of water is limited and since it is early fall snowpack on the mountain was limited as well. The lahars from glacier melt cannot match those frequently seen in Iceland such as with Eyjafjallajökull.

calbuco 2015
March 26, 2015 satellite image.

calbuco 1985

1985 Landsat image
calbuco 1998
1998 Landsat image

calbuco 2000
2000 Landsat image

calbuco 2014
2014

calbuco lago chapo
Google Earth image

calbuco4272105
Landsat image 4/27/2015

Sholes Glacier, Washington: Measuring Annual Glacier Mass Balance

Annual mass balance is the difference between ice and snow added to the glacier via accumulation and snow and ice lost via ablation and in some cases calving. Alpine glacier mass balance is the most accurate indicator of glacier response to climate and along with the worldwide retreat of alpine glaciers is one of the clearest signals of ongoing climate change (WGMS,2010). For 25 consecutive years we (North Cascade Glacier Climate Project) have measured the mass balance of Sholes Glacier. On Sholes Glacier in 2014 we completed 162 measurements of snowpack depth using probing and crevasse stratigraphy, mainly probing on this relatively crevasse free glacier.  We mapped the extent of snowcover on several occasions, and using the retreat of the snowline and stakes emplaced in the glacier observed the rate of ablation (melting). We also measured runoff from the glacier in a partnership with the Nooksack Indian Tribe, which provided an independent measure of ablation. The final mass balance in 2014 was -1.65 m of water equivalent, the same as a 1.8 meter thick slice of the glacier lost in one year. In 2014 we arrived at Sholes Glacier to find it already had 15% blue ice exposed, on August 7th. This had expanded to 25% by August 12th. This rapidly expanded to 50% by August 23rd, note Landsat comparison below. The snow free area expanded to 60% by the end of August and then close to 80% loss by the end of the summer. Glaciers in this area need 60% snowcover at the end of the melt season to balance their frozen checkbook. This percentage is the accumulation area ratio. This mass balance data is then reported to the World Glacier Monitoring Service, along with about 110 other glaciers around the world.  Unfortunately the WGMS record indicates that Global alpine glacier mass balance was negative in 2014 for the 31st consecutive year.  The video below explains how we measure mass balance each year with footage from the 2014 field season.  Of course a key aspect is hiking to the glacier and camping in a tent each year.

The Sholes Glacier thickness has not been measured, but there is a good relationship between area and thickness, that suggests the glacier would average between 40 and 60 m in thickness. The 15 m of water equivalent lost from 1990-2014 is equal to nearly 17 m of ice thickness, which would be at least 35% of the glaciers volume lost during our period of measurement.

DSC07194 sholes 915og

Sholes Glacier on August 7, 2014 and Sept. 15 2014, the glacier had lost 80% of its snowcover at this point an indicator of poor mass balance 2014.

sholes landsat 2014
Landsat 8 images of Sholes Glacier in 2014, with red line indicating snow line.

sholes probing snowpack rainbow stratigraphy

Measuring Accumulation on a glacier using Probing and crevasse stratigraphy.

DSC02001
Base Camp where we have spent more than 100 nights in a tent in the last three decades.

Dzhikiugankez Glacier Poised to Melt Away, Mount Elbrus, Russia.

Dzhikiugankez Glacier (Frozen Lake) is a large glacier on the northeast side of Mount Elbrus, the highest mountain in the Caucasus Range. The primary portion of the glacier indicated in the map of the region does not extend to the upper mountain, the adjoining glacier extending to the submit is the Kynchyr Syrt Glacier. The glacier is 5 km long extending from 4000 m to 3200 m. Shahgedanova et al (2014) examined changes in Mount Elbrus glaciers from 1999-2012 and found a 5% area loss in this short period and accelerated retreat from the 1987-2000 period. As examination of Landsat images indicates Dzhikiugankez Glacier has the lowest percent of overall snowcover, as seen in the satellite image from August 2013 with the transient snow line shown in purple. The amount of blue ice is apparent on Dzhikiugankez Glacier (D). The main changes in this glacier are not at the terminus, but along the lateral margins, indicating substantial vertical and lateral thinning. Here we examine Landsat imagery from 1985 to 2013 to identify changes. In each image the red arrow indicates bedrock on the western margin, the yellow arrow bedrock on the eastern margin, Point A an area of glacier ice extending to the upper eastern margin, the purple arrow a medial moraine exposed by retreat and the green arrow the 1985 terminus of the glacier.

Elbr01
Map of northeastern side of Mount Elbrus, summit on left. Dzhikiugankez Glacier (Dzhikaugenkjoz) is outlined in black.

elbrus glaciers tsl 2013
August 2013 Satellite image of Mount Elbrus

kinger sirt ge
Google Earth image 2013

In 1985 the glacier connects beneath the subsidiary rock peak at the red arrow, a tongue of ice extends on the east side of the rock rib at the yellow arrow, Point A. The transient snow line is at 3550 m and less than 30% of the glacier is snowcovered. The medial moraine at the purple arrow is just beyond the glacier terminus. In 1999 the subsidiary peak is still surrounded by ice and the tongue of ice at Point A though smaller is still evident. The snowline is quite high extending to 3750 m, leaving only 10-15% of the glacier snowcovered. In 2001 the main terminus has retreated from the green arrow. A strip of rock extends up to the red arrow. The snowline is at 3500 m, with a month of melting left. In 2013 a wide zone of bare rock extends up to the subsidiary peak at the red arrow.  The medial moraine, purple arrow is exposed all the way to its origin near the red arrow.  In 2013 the tongue of ice at Point A, is gone.  This glacier is retreating faster on its lateral margins as  at the terminus, a 20% reduction between red and yellow arrows from 1985 to 2013. The snowline is at 3600 m, with several weeks of the melt season left. The key problem for the Dzhikiugankez Glacier is that there is an insufficient persistent accumulation zone.  Pelto (2010) noted that a glacier cannot survive without a persistent and consistent accumulation zone, which Dzhikiugankez Glacier lacks despite being on the flanks of Mount Elbrus. Retreat of this glacier is similar to Azau Glacier, particularly the west slope of this glacier, and Irik Glacier.  Unlike these glaciers it cannot survive current climate.  The glacier is large and the glacier will not disappear quickly. Shahgedanova et al (2014) note the expansion of bare rock areas adjacent to glaciers on the south side of Mount Elbrus including Azau and Garabashi.

lednik ks 1985
1985 Landsat image

lednik ks syrt 1999

1999 Landsat image
lednik ks 2001
2001 Landsat image

lednik ks 2013
2013 Landsat image

Langfjordjokulen, Norway Retreat-Thinning

Langfjordjokulen is in the Finnmark region of northern Norway. This is a plateau glacier with a valley glacier extending east toward Langfjordhamm. The Norwegian Water Resources and Energy Directorate has monitored the length change and mass balance of this glacier from 1989-2014. The mean mass balance has been significantly negative averaging -0.7 m/year, with every year being a net loss since 1997. This is no way to sustain a glacier or a business. Retreat of the glacier has averaged 27 m/year from 2000-2014. Here we examine Landsat imagery of the glacier from 1989-2014 to identify key changes.
langford ge

In 1989 the glacier terminated at the red arrow, two glacier tongues descended from the plateau and merged below the purple arrow indicating the northern arm. A ridge extends some distance into the main plateau separating the catchment areas of the two glacier tongues, marked by the letter A.  The glacier is mainly snowcovered in August 1989 and had a negative mass balance of -0.55 m.  In 1994 the two glacier tongues are still joined,  and snowcover is extensive, retreat is limited since 1989.  In 2000 snowpack is quite limited at the time of the image, the two glacier tongues have separated and the main terminus has retreated from the red arrow. In 2014, Norway’s warmest year, snowpack retained is minimal, the glacier mass balance reported by NVE to the World Glacier Monitoring Service was -0.78 m, an improvement over the record low year of 2013, -2.61 m.  A new area of bedrock is emerging near Point A, due to glacier thinning in the plateau area which should be the accumulation zone.  The two glacier tongues are further separated.  The main terminus is at the yellow arrow a retreat of 600-700 m since 1989.  This retreat rate is faster than other periods since 1900. The retreat is similar to that of  the larger nearby Strupbreen and Koppangsbreen.  The cumulative mass loss experienced by Langfjordjokulen is a significant portion of its total volume, 25-35% assuming typical glacier thickness for a glacier with this area.  In 2014 NVE reported In Norway terminus fluctuation data from 38 glaciers  with ongoing assessment indicate, 33 retreating, and 3 were stable.  The average terminus change was -12.5 m

langford 1989
1989 Landsat image

lanford 1994
1994 Landsat image

langford 2000
2000 Landsat image

langford 20142014 Landsat image

Rapid Retreat of Freshfield Glacier, Alberta 1964-2014

The Freshfield Glacier is a large glacier southeast of the Columbia Icefield in the Canadian Rockies where recent retreat  has exposed a new glacier lake.  Today the glacier is 9.8 km long beginning at 3070 meters and ending at 2000 m near the shore of the less than 5 year old lake. This glacier during the Little Ice Age stretched 14.3 km, one of the longest in the entire range extending beyond Freshfield Lake, which was a glacier filled basin. By 1964 the glacier had retreated 1900 meters exposing Freshfield Lake. From 1964-1986 the glacier retreated up this lake basin losing another 1200 meters of length. A comparison of a 1964 photograph from Austin Post and as close to the same view as I could get in Google Earth illustrates the 50 years of retreat. The red line halfway up the lake is the 1964 terminus and the red line at the edge of the lake the terminus location in the topographic map from the 1980’s.  Here we examine Landsat images from 1986 to 2014 to further illustrate the changes. Clarke et al (2015) published this week indicates that it is likely that 70% of glacier volume in western Canada will be lost by 2100. In their Figure 4, three of the four scenarios show Freshfield Glacier as surviving to 2100. The adjacent Conway Glacier is also retreating leading to new lake formation. freshfield total
Freshfield Glacier Google Earth view
 
1964 image of Freshfield Glacier from Austin Post
freshfield compare
Google Earth view of Freshfield Glacier, indicating 1964, 1986 and 2014 terminus positions.

In each image the red arrow indicates the 1986 terminus position, the yellow arrow the 2014 terminus, pink arrow terminus of the eastern portion of the glacier in 2014, and blue dots the snow line on the date of the images.  In 1986 the glacier still reaches the western end of Freshfield Lake, the snowline is at 2600 m and the eastern terminus reaches a bedrock step beyond the pink arrow.  By 1994 the glacier had retreated to the southwest shore of the now fully formed Freshfield Lake, the snowline was between 2600 and 2700 meters.  By 1998 has retreated several hundred meters from the shore of Freshfield Lake into a new basin terminating 600 m from the 1986 terminus location. The snowline is again near 2600 m.  The eastern terminus has retreated from the bedrock step.

By 2009 the terminus has retreated from the basin where it terminated in 1998 exposing a new lake that is 300 m long the terminus no longer reaches.  The lower 1000 meters of the glacier has a thin width suggesting the glacier terminus ice thickness is also thin.  A Google Earth image from 2005 indicates two  basins, circular depressions above the terminus that indicate the collapsing and stagnant nature of the lower portion of the glacier.  The narrowness of the terminus reach is also evident.   By 2013 the glacier has further retreated from the new lake and now ends near the base of the bedrock step.  The eastern terminus has retreated to the pink arrow.  The snowline in this Sept. 22, 2013 image is at 2700 m and is close to the end of the melt season position, the equilibrium line altitude. In 2014 the terminus has retreated 1700 m from the 1986 position and 2900 m from 1964.  This is a rate of approximately 60 m year over a span of  50 years. The glacier remains nearly 50% snowcovered both in 2013 and 2014, indicating a persistent and consistent accumulation zone. The glacier terminus is nearing a bedrock step, with active crevassing on this step. This suggests that the retreat rate should slow in the short term. This glacier remains large and is not in danger of disappearing with present climate. Its behavior mirrors that of the Apex Glacier and Columbia Glacier  but is less dramatic in terms of area loss than or the disappearing Helm Glacier. Glaciers in Alberta as a whole are losing a much greater percentage of their area than Freshfield Glacier as reported by Bolch et al (2010)freshfield glacier 1986
1986 Landsat image

freshfield glacier 1994
1994 Landsat image

freshfield glacier 1998
1998 Landsat image

freshfield glacier 2009
2009 Landsat image
freshfield ge terminus
2005 Google Earth image

Red Channel|Green Channel|Blue Channel
2013 Landsat image

freshfield glacier 2014
2014 Landsat image

31 years of observations on Retreating Columbia Glacier, Washington

For the last 31 years the first week of August has found me on the Columbia Glacier in the North Cascades of Washington. Annual pictures of the changing conditions from 1984 to 2014 are illustrated in the time lapse video below. This is the lowest elevation large glacier in the North Cascades. Columbia Glacier occupies a deep cirque above Blanca Lake and ranging in altitude from 1400 meters to 1700 meters. Kyes, Monte Cristo and Columbia Peak surround the glacier with summits 700 meters above the glacier. The glacier is the beneficiary of heavy orographic lifting over the surrounding peaks, and heavy avalanching off the same peaks. This winter has been the lowest year for snowpack in the North Cascades in the 32 years we have worked here.  Below is a comparison from August 1, 2011 with Blanca Lake below the glacier still frozen and a beautiful scene on April 4, 2015 with the lake not frozen taken by Karen K. Wang.  The winter in the region was unusually warm, but not as dry as in California; however, in the snowmelt and glacier fed river basins summer runoff will be low this year.


Blanca Lake Aug. 1, 2011 on left and April 4, 2015 on right (Karen K. Wang, www.karenkwang.com)
Blanca Lake Aug. 1, 2011 on left,  and April 4, 2015 on right (Karen K. Wang, www.karenkwang.com)

Over the last 31 years the annual mass balance measurements indicate the glacier has lost 14 meters of thickness. Given the average thickness of the glacier of close to 75 meters in 1984 this represents a 20% loss in glacier volume. During the same period the glacier has retreated 135 meters, 8% of its length. Most of the loss of volume of this glacier has been through thinning not retreat.  To survive a glacier must have a persistent and consistent accumulation zone (Pelto, 2010).  On Columbia Glacier in 1998, 2001, 2003, 2004, 2005, 2009 and 2013 limited snowpack was retained, resulting in thinning even on upper part of the glacier.  This thinning of the upper glacier indicates the lack of a persistent accumulation zone such as in 2005, note the exposed annual ice and firn layers green arrows, this indicates the lack of retained accumulation in recent years.  This indicates the glacier is in disequilibrium and cannot survive. Mapping of the glacier from the terminus to the head indicates a similar thinning along the entire length of the glacier.  The overall mass balance loss parallels that of the globe and other North Cascade glaciers in the last three decades.

columbia accumulation zone 2005

2005 Accumulation zone of Columbia Glacier


On left cumulative mass balance of Columbia Glacier compared to the WGMS global record and other North Cascade glaciers. On right change in surface elevation along the glacier from terminus to head indicating a 14-15 m thinning on average.

A comparison of images from  1986, 2007 and 2013 photograph provide a view of  glacier change at the terminus. The blue arrows indicate moraines that the glacier was in contact with in 1986, and now are 100 meters from the glacier. The green arrow indicates the glacier active ice margin in 1986 and again that same location in 2007 now well off the glacier. The red arrow indicates the same location in terms of GPS measurements, this had been in the midst of the glacier near the top of the first main slope in 1986. In 2007 this location is at the edge of the glacier in a swale. The changes are more pronounced in 2013 as the terminus slope continues to decrease. The low snowpack in 2015 on the glacier in March, 2-3 m versus 6-8 m, will lead to considerable changes in the terminus this summer, that we will assess.

1986 Terminus Columbia Glacier

columbia 2007 comp

2007 Terminus Columbia Glacier

columbia glacier2013 comp.

2013 Terminus Columbia Glacier

Jill Pelto painted the glacier as it was in 2009 (top) and then what the area would like without the glacier in the future, at least 50 years in the future (middle), and Jill at the sketching location (bottom), turned 180 degrees to view Blanca Lake. The lake is colored by the glacier flour from Columbia Glacier to the gorgeous shade of jade.

Clearly the area will still be beautiful and we will gain two new alpine lakes with the loss of the glacier. After making over 200 measurements in 2010 we completed a mass balance map of the glacier as we do each year. This summer we will be back again for the 32nd annual checkup.  There will be likely be record low snowpack, comparable to 2005 the worst year from 1984-2014.

2010 Mass Balance map of Columbia Glacier