
Grasshopper Glacier in the Wind River Range of Wyoming has a southern terminus calving into a lake , sometimes referred to as Klondike Glacier, and a northern terminus. The southern terminus is calving and retreating expanding the unnamed lake it terminates in. The southern glacier has retreated 350 m since 1966. This lakes drains north under the glacier and down the valley under the Grasshopper Glacier. This is quite unusual to have a stream draining under the glacier from a lake at a terminus of the glacier. The lake can drain to the east if it rises to the 12,000 foot threshold. This was the case in 1994. The terminus area is not being fed by the upper accumulation zone to the northwest any longer. The terminus is stagnant and will continue to melt away. The lake has existed since at least 1950. In 2003 it drained substantially and quickly below the glacier causing a downstream flood. An ice dam break released a glacier flood is a jokulhaup. The lake was reported by the USGS to have drained 90%. In the 2006 image it has largely refilled, but notenough to drain to the east again. It is likely given the stagnant nature of the glacier, that the drainage conduit will not be fully closed, and the lake can drain through the channel on more of an ongoing basis. The northern terminus has retreated 730 m the most extensive retreat in the Wind River Range. The main accumulation area on the west side of the glacier has become segmented by large bare rock areas as noted by comparing the 1966 map and 2006 image. The 1966 boundary indicated in orange noted area circled in burgundy in the second image below. 
 The combined retreat of the two terminus is over one kilometer this is 40 % of its 1966 length of 2.4 km. The significant thinning and marginal retreat at the head of the glacier is symptomatic of a glacier that will disappear with current climate. The glacier seldom has significant snowcover at the end of the melt season is with the current climate will melt away. In 2009 the glacier did have significant snowcover at the end of the melt season for only the third time in the last 10 years.
Category: Glacier Observations
Post detailing changes in a glacier
Spearhead Glacier and Decker Glacier retreat, Whistler, British Columbia
Spearhead Glacier is just east of the Whistler-Blackcomb Ski area in sw British Columbia and can be reached easily from the top Blackcomb lift. Adjacent to Spearhead is Decker Glacier . Both glaciers flow northwest and have retreated extensively. Recently both have developed new alpine lakes at their termini that illustrate the recent increase in retreat that could continue thanks to these new lakes. Spearhead Glacier has retreated between 500 and 600 meters since 1928. The glacier lost 62 m in mean thickness since 1928 Koch and others (2009) found. A map of the region indicates the extent of the glaciers in the range from the Little Ie Age and today Osborn and others (2007). The first image is from 2003, the low sloped glacier has few crevasses and end in a gently sloping terminus at the edge of the bedrock basin. Notice in the fall 2008, second image, that a new lake has formed at the terminus Spearhead Glacier.
 This lake is expanded further in 2009 as seen in this view below across the lake back at the glacier.
  This looks much like the expanding lake view and stagnant terminus area of Colonial Glacier in the North Cascades. The glacier is largely confined to a single basin, that suggests the potential for considerable lake expansion as the glacier retreats. There is a step in the glacier in the image above, that indicates the likely maximum extent, notice the bedrock step on the right side of the glacier. Decker Glacier retreat is even more substantial as a percentage of glacier area. illustrated in a comparative image from Osborn and others (2007)
 The glacier has also developed a new lake, leading to the breakup of a portion of the end of the glacier, notice the rifted ice pieces in the image below from October 2008. That was not present in the lower image from 2003. This area of broken ice at the end of the glacier and near the image bottom, represents nearly a third of the total glacier area. It is not as apparent as it is in summer conditions when the lake is not frozen over.

Impact of Artesonraju Glacier, Peru Retreat
Artesonraju Glacier is a 3.3 km long glacier in the Cordillera Blanca of Peru drains west from Nevado Artesonraju. Updated July 2015 at
The glacier feeds both Lake Artesonraju, a new lake that formed after 1930 and Lago Paron. The two lakes are dammed by glacier moraines and together have posed a hazard of a glacier dammed lake outburst. In 1951 an outburst of water and alluvium traveled from the upper Artesonraju Lake into Lago Paron, raising the water level in Paron causing downstream flooding and concern about the strength of its moraine dam. 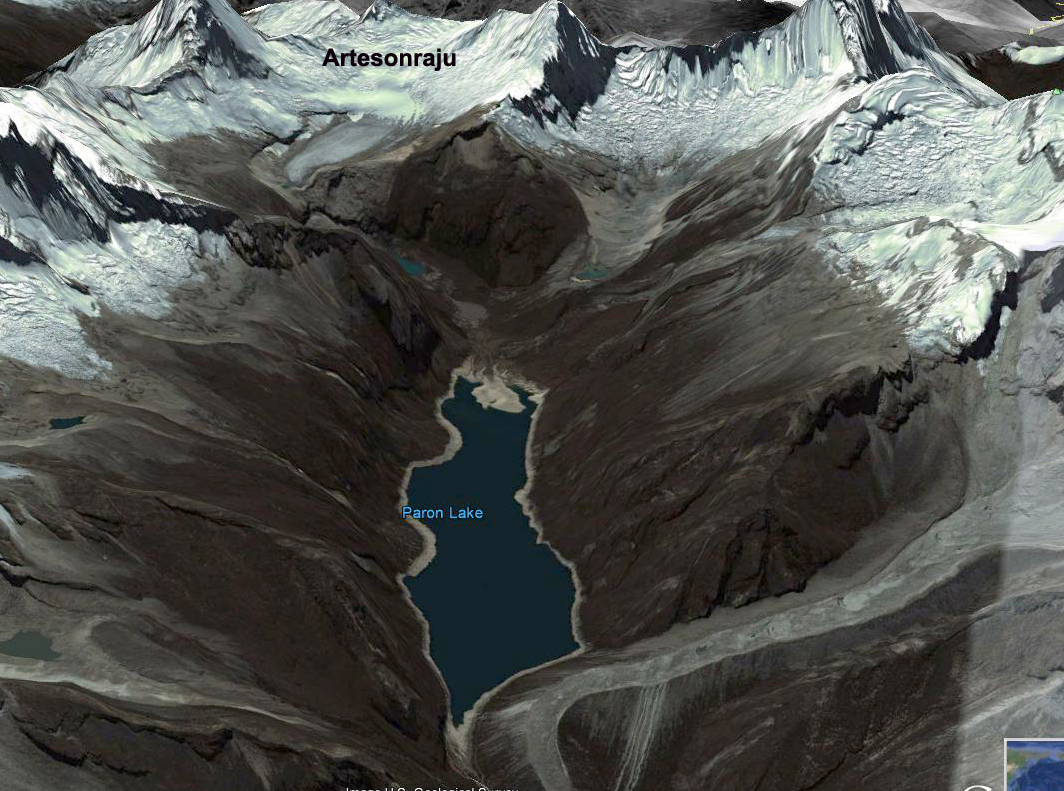
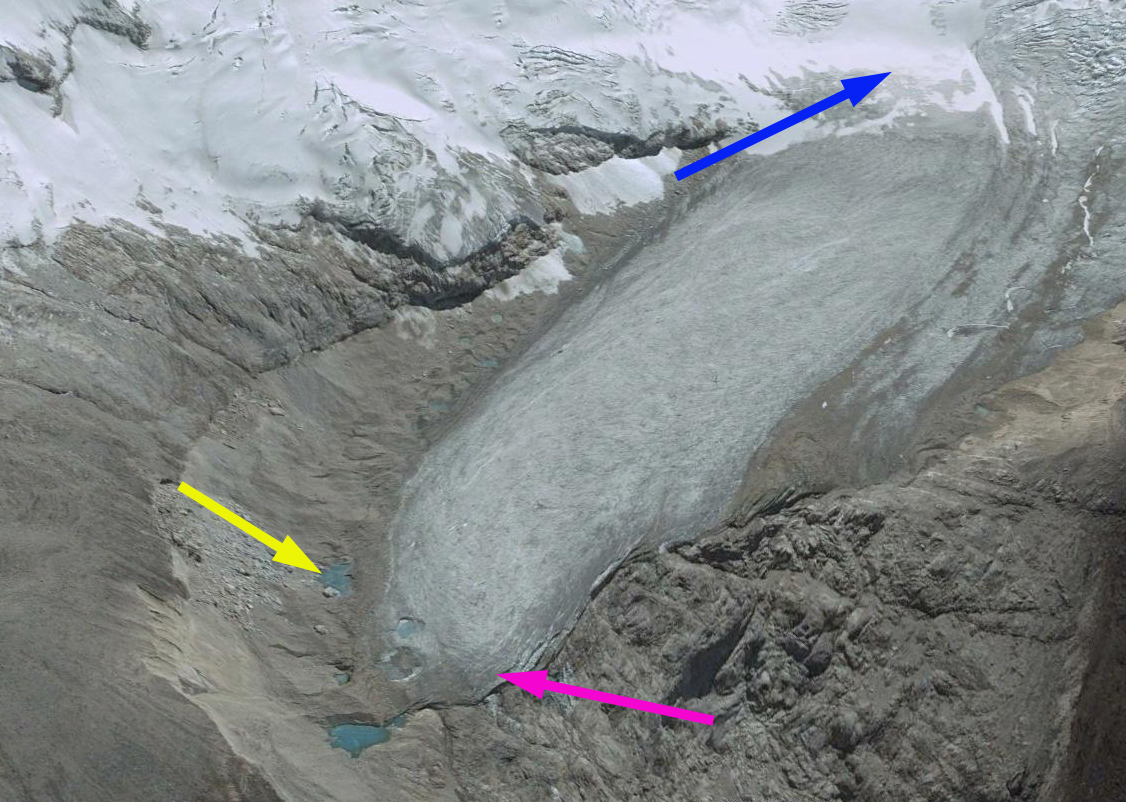
There are numerous moraine dammed lakes in Peru, the dams are just comprised of gravel, sand and clay dumped by the glacier. High water levels caused by upstream floods, avalanches or landslides can cause failure of these moraine dams and down stream flood damage prompted the Peruvian government to develop a strategy to address the problem. They began in the by building tunnels , concrete pipes, through the moraine to allow drainage to a safe level, they then rebuilt the moraine over the drainage system and strengthened it. Since development these systems have worked preventing serious flood issues from the lakes. At Lago Paron a hydropower project has been built that is fed by the tunnel drainage system and Lago Paron has been partially drained to service the hydropower facilities needs. The hydropower faility is owned by Egenor, owned largely by Duke Energy. The lake level has declined substantially by 2003 as the trimline indicates in the image above. This had led to a battle over water resources with local farmers. This Artesonraju Glacier that is the principal feeder to the two lakes retreated 1140 meters from 1932-1987 and by 2004 had retreated another 200 meters. From 2003 to 2013 the glacier continued to retreat and the terminus to narrow. An expanding lake at the terminus is evident in the Google Earth images of 2003 and 2012, pink arrow. A melt pond has also drained at the yellow arrow as the glacier thinned. In the 2013 Landsat image the terminus has further narrowed.
2003 Google Earth image

2012 Google Earth image
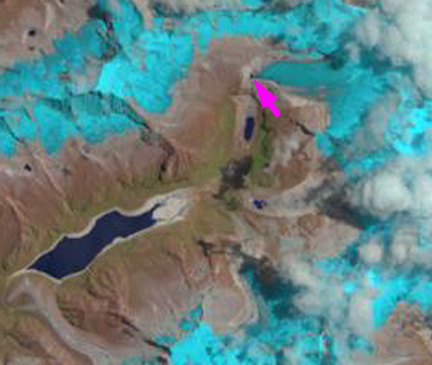
2013 Landsat Image
This is 30% of its length gone in the last 75 years.The lower section of the glacier is flat, uncrevassed and is continuing to thin and melt. The upper reaches of the glacier are heavily crevassed indicating continued vigorous flow fed by healthy accumulation on the flanks of Nevado Artesonraju and Nevado Piramide. The equilibrium line of this glacier is at 5150 m, investigations by the Tropical Glaciology Group, Innsbruck, Austria and Hydrology Resources and Glaciology group in Huarez, Peru. In 2005, the surface on many parts of the flat tongue showed that sublimation is important to the mass balance when short wave radiation is limited, and short wave radiation dominates melting during the day.
A new book by Mark Carey, In the Shadow of Melting Glaciers, examines the history of the impact of these glaciers on Andes towns in the Cordillera Blanca.
Rwenzori Glacier Retreat-Loss
The Rwenzori Range,Uganda typically referred to as Mountains of the Moon have been rapidly losing their glacier cover. The small, steep glaciers descend the peaks of Mt. Stanley: 5111 m, Mt. Speke: 4891 m and Mt. Baker:4873 m.  The Georg Kaser, University of Innsbruck visited the range twice in the early 1990’s to prepare maps of glacier change to compare to a 1906 map derived from documents of the Duke of Abruzzi’s expedition, the 1955 map made from vertical air-photos. They determined the area of the glaciers to be 6.5 km2 in 1906, 3.2 km2 in 1955 and 1.7 km2 in the 1990’s, note Speke Glacier as an example. This represents a 70% area loss.
  An updated satellite based analysis by Texas A&M’s Klein and Kincaid showed that the glaciers in the Rwenzori have decreased in area from 2.55 km2 in 1987 to 1.31 km2 in 2006. I have had the good fortune to work in the field with both Georg Kaser, Taku Glacier, Alaska and Andrew Klein, Easton Glacier, Washington, both have made tropical glaciers one of their specialties.
 This is nearly a 50% loss in 20 years. The climate trends and glacier extent trends are not in favor of the glaciers lasting for long. This is reinforced by a comparison of images from Mount Stanley from the World Wildlife Fund.
Vista Glacier, Glacier Peak WA Retreat
Vista Glacier is the northernmost of the large valley glaciers on the east side of Glacier Peak. The glacier begins at 2475 m beneath Kennedy Peak. We examined all of the glaciers around Glacier Peak in detail in the 1990’s to document their changes since observed by C.E. Rusk 100 years earlier. The glacier during the LIA joined the Ermine Glacier and extended down to 1345 m. By 1900 when Asahel Curtis photographed this glacier it had retreated 1300 m. By 1946 the glacier had retreated an additional 600 m separating from Ermine Glacier to a minimum at 1900 m. In 1955 the glacier began a slow advance that had ended by 1975 with a total advance of 105 m. In 1985 at our first visit the glacier was again retreating, total retreat was 10-20 meters from the advance moraines. By 1994 the glacier had retreated nearly 100 m and by 1997 had retreated to the 1946 position. The retreat has continued and by 2006 the glacier had retreated 300 meters from its 1975 advance position. This glacier like all 47 glaciers we observe in the field in the North Cascades is continuing a significant retreat. Below is a sequence of images from the 1984 map, 1996 aerial photograph, and the 2006 satellite image. The latter has the orange 1975 terminus position noted, the purple line on the 2006 image is the current terminus. The dotted purple line on the aerial photograph marks the area that consistently retains accumulation. 

 In 1994 Cliff Hedlund and I were surveying the terminus when we found a beautiful ice cave beneath the glacier. The rock just behind Cliff in the cave is apparent now out in the open in the 2006 satellite image. We surveyed the position in 1994.
 The lower several hundred meters of the glacier are uncrevassed indicating limited flow on this fairly steep slope.
  The arrow in the picture above indicates the ice surface level in 1985, the glacier has thinned 20 meters in this region. A view of the glacier from indicates the recession better, the blue dotted line is the ice margin in 1975. The picture below is from Sept. 2009 the lack of snowpack on the lower 70% of the glacier is evident. The blue dotted line is the glacier margin in 1975, and in 1985 it had changed little. This advance left a very evident moraine that will deteriorate with time.
  Measuring snow depth up the middle of this glacier in 1994 and 1997 we found limited areas with accumulation of greater than 2 m in early August. Note the annotated aerial photograph showing consistent snow covered area. This makes the glacier prone to losing most of its snow cover in many years such as occurred 2005 or 2009. This indicates considerable retreat will occur even with present climate. The last image is Cliff Hedlund and I on glacier in 1994, Cliff unfortunately is no longer with us, but was a great field companion and the only person I knew who could create a good spear point from rock using an antler.
Taku Glacier Equilibrium Line Altitude Summer Rise
A key measure of the mass balance of a glacier is the equilibrium line altitude (ELA). Mass balance for non-calving glaciers is the difference between snow accumulation on a glacier and snow and ice loss from the glacier. The ELA is the point at which accumulation equals melting. On temperate alpine glaciers this is the snowline where snow transitions to bare glacier ice. Its elevation at the end of the summer marks the annual ELA. For a glacier to be in equilibrium at least 50-70% of the glacier must be in the accumulation zone still at the end of the summer. The range of percentages is determined by the specific regional climate and glacier geographic characteristics. A key observation for mass balance calculation is the shift of the ELA-snowline during the course of the melt season. The magnitude of the shift over a given time period is a measure of the melt rate. The shift can be observed in satellite imagery and when combined with field measurements quantifies melting. As the melt season begins the snow cover extent is large on a glacier. The key is how rapidly it rises during the melt season. On Taku Glacier for example in 2004 and 2006 a series of satellite images indicates the rise in the ELA. Below are images from May 26, 2006, then July 29, 2006 and then Sept. 15 2006. Indicating the rise of the snowline. These are followed by annotated images showing the rise of the ELA during the summer melt season in 2004 and 2006 on Taku Glacier. 


On the ground the Juneau Icefield Research Program measures the snow depths and snow melt during July and August. The above images from May 26, July 29 and Sept. 15 2006 indicate the rise of the ELA during the course of the melt season, from 1200 to 2600 to 3200 feet. Snow depths at the the Sept. 15 ELA, where snowpack=0, was 2 m on July 22. Thus, we had 2 meters of snow melt at 3200 feet between July 22 and Sept. 15. In 2004 the snowline was at 2800 feet on July 15, snowpack was 1.6 meters at the eventual Sept. 1 snow line of 3400 feet. In 45 days 1.6 m of snow was lost at 3400 feet. In 2004 the melt rate was 0.036 meters per day and in 2006 0.038 meters per day. In 2009 July began with a low ELA of 500 m after a cool snowy winter and spring. By the end of the month the ELA was over 800 meters. This 300 meter rise and the associated melt was a record for July as were temperatures in Southeast Alaska in July 2009. As the 2010 melt season begins the Taku Glacier remains snowcovered, though the blue colors near the terminus indicate melt water is saturating the snowpack on 4/10/2010. What will the 2010 melt season bring? Check back here to see. 
Donne Glacier Retreat New Zealand
Donne Glacier descends the spectacular east face of Mount Tutoka in southwest New Zealand. This glacier has been undergoing rapid retreat this decade creating a new alpine lake. The National Institute of Water & Atmospheric Research (NIWA) conducts an annual survey of the snowline of New Zealand glaciers. In order to thrive a glacier must have at 50-70% of its area snowcovered at the end of the summer melt season. For NZ glacier NIWA has noted 67% as the key to equilibrium conditions. If then snowline is above normal the glacier will lose mass, if the snowline is lower than normal the glacier will gain mass. Since 2000 the snowline has been above normal in nine of the ten years, only in 2005 was the snowline slightly lower than normal (NIWA, 2010). In 2009 the snowline was the highest of any of the years The result of a decade of high snowline’s is glacier mass loss and retreat. Below is a sequence of images from 2000, 2003, 2006 and 2009 of Donne Glacier the first and last images are from NIWA and the middle two are Google Earth images.


In 2000 the glacier reaches almost all the way across the newly forming unnamed lake. By 2003 the large debris covered section has detached and the lake has doubled in size. In 2006 the faint orange line indicates the 2003 terminus position. The retreat of 100 meters has led to further lake expansion. In the 2009 images the glacier is still ending in the expanding lake, and is still actively flowing. The number of crevasses and the snowcover existing even in poor snow years such as 2003, 2006 and 2009 indicate the glacier still has a persistent accumulation zone. The glacier begins near 2200 meters and descends to about 1300 meters in 2 kilometers. A persistent accumulation zone is key to survival. The retreat and formation of new alpine lakes is also occurring at two nearby glaciers that NIWA observes. Gunn Glacier (below) and Park Pass Glacier (above), in the Google Earth images. Both glaciers end in lakes still occupied by icebergs that used to be part the terminus of the glacier. The icebergs did not calve off so much as representing disintegration of the terminus. The tongue visible on Park Pass Glacier in the middle of the lake is now gone. 

Paradise Glacier Ice Caves Lost
From the 1930’s through the early 1980’s Paradise Glacier’s ice caves were world famous. Today they are gone. In 1906 Paradise Glacier was a single glacier that extended down to an elevation of 6000-6200 feet. The image below is from the book The Mountain that was God.  In the 1930’s the glacier separated into an upper and a lower part. The caves were in the lower part, that filled a relatively flat valley at an elevation of 6500 feet. Ice caves cannot form beneath a glacier that is moving substantially, as the movement would close up the cavities. Ice caves form under stagnant, melting sections of the glacier.
  The 1971 USGS map, see below, indicated the lower Paradise Glacier was 1.1 km long and had an area of .14 square kilometers. By 1981 the glacier had retreated to the upper half of the valley that had been filled with ice caves, second image below. In the 1981 image, from Jim Kuresman, note the mountain peak in the center that is in the 1906 image as well. There is no remaining snowcover either on the lower glacier, a glacier cannot survive without an accumulation zone that has significant persistent snowcover even at summers end.
 In 1985 I visited the ice caves, and they were still impressive, although much reduced in size, number and length.
  i returned to the ice caves in 1993 and found no ice caves remaining and no glacier either. The Paradise Ice Caves valley in 2005 (Greg Louie) and 2007 (David Head image) is beginning to sprout some vegetation where hikers tread through ice caves a generation before. The glacier fits the regional pattern of glacier retreat and loss.

 You can observe in the upper left of the 2005 and 2007 images that the upper Paradise Glacier still exists, though it is retreating, the last picture is the terminus of the upper Paradise Glacier. In 2009 the upper Paradise Glacier lost all of its snowcover, not a good sign for its long term survival. Below is the Google Earth view of the area from 2009 imagery. A comparison with the map indicates that not only has the lower Paradise Glacier been lost, but so has the Williwakas Glacier.
Fleming Glacier Acceleration and Retreat, Antarctica
Recent observations indicate that the Fleming Glacier on the Antarctic Peninsula which used to feed the Wordie Ice Shelf is accelerating and thinning even faster(Wendt et al, 2010) This is leading to the production of numerous tabular icebergs from the glacier front as seen below from a 2009 Google Earth image.  . A is a rift that is also the ice front toward the upper right. B and C are rifts that will produce future tabular ice bergs. D is an iceberg with an area of just under 1 square kilometer. Wordie Ice Shelf was the northernmost large Ice shelf on the western AP. The ice shelf disintegrated between 1970 and 2000. From an area of 1900 km2 in 1970 to 100 km2 in 2009 as mapped by the British Antarctic Survey. The first image is from the BAS in 1989. Followed by a series of maps illustrating its demise put together by the BAS and USGS
 The breakup was suggested to have occurred due to a warming trend in the region that began in the 1970’s generating meltwater . There is also thinning and weakening around some of the pinning points where the ice shelf was grounded. This is similar to observations from Wilkins Ice Shelf.
The Wordie Ice Shelf was fed by several major tributary glaciers including the Fleming Glacier.
(Rignot and others (2005) used satellite radar interferometry to observe changes in behavior of Fleming Glacier from 1995 to 2004 identifying a 40-50% increase in glacier velocity from the terminus to 50 km above the terminus and a two meter per year thinning. More recent Airborne thickness data indicate thinning has increased to 3 or 4 m per year in the lower reach of the glacier during the 2004-2008 period (Wendt et al, 2010). Rignot and other (2005) further observed that 6.8 ± 0.3 km3/yr of ice, which is much larger than snow accumulation of 3.7 ± 0.8 km3/yr. This imbalance has certainly increased with acceleration.
Without the presence of a thick, slow moving ice shelf buttressing the Fleming Glacier it has accelerated. Below is a map from Wendt et al (2010) showing the Fleming Glacier former margins. Below that is Google Earth Image showing the nature of the calving front. Notice the tabular ice bergs that have and are about to break off. Below that is an image further up glacier, a nunatak has appeared in mid glacier that is not evident in the 1989 image. 

 As observed for the Jakobshavn and Pine Island Glacier thinning leads to reduced buttressing and increased glacier flow.
North Cascade Glacier 2010 Mass Balance Forecast
Beginning in 2006 the North Cascade Glacier Climate Project began to forecast glacier mass balance from atmospheric circulation index data. To be useful for water resource managers such a forecast must be made early in the spring. This is when snowpack begins melting at elevations below the glaciers and reservoirs can begin to be recharged. A first generation forecasting model that relied on October-March Pacific Decadal Oscillation and El Nino Southern Oscillation Index values was developed. The mass balance forecast method reliably determined if the mass balance of North Cascade glaciers would be negative, equilibrium or positive in 22 of the last 26 years. Most people may be under the impression that the snowmelt season is well underway, in fact 2010 has seen a record loss of snowpack extent through March this year in North America. A look at the snow cover depletion using data from the Rutgers Global Snow Lab beginning in either the 7th, 8th or 9th week and ending with the 14th week indicates this record melt. In the second image the rapid snow cover loss is further apparent. In the Northern Hemisphere for example February 2010 was the third most extensive snow cover extent of the last 44 years, March the 18th of the last 44 years, and April the 41st most of the last 44 years (Rutgers University Global Snow Lab). This change indicates a record snow cover melt off in 2010 for the last 44 years. This can happen on a glacier as well.
 However, for glaciers the snowmelt season usually ends close to May 1. The melt season in the North Cascades is still not upon us. Typical maximum accumulation occurs around May 10.
  The best long term snowpack data is for April 1, hence that date is often used to evaluate the end of winter snowpack for snow measurement stations most of which are well below glacier elevations. This year snowpack on April 1 averaged 0.82 meters. There has been no year with positive mass balance and snowpack on April 1 below 1.0 meters.
  If we look solely at the indices both PDO and ENSO had positive values this winter. This is similar to the case in 1987, 1993, 1994, 1995, 1998, 2003, 2004,and 2005 all negative balance years.
  The rule for the model is that if PDO and ENSO are positive glacier mass balance will be negative. Both of the indices reflect sea surface temperature in the Pacific, and positive values favor warmer SST’s near the west coast. Lastly we have the temperature forecast from NOAA for spring which for the area shows a high degree of confidence for above normal temperatures from April-June.
  All of the above indicate glacier mass balance will be negative in the North Cascades this year even though the galciers are deeply buried in snow right now.
Harrison Glacier, Glacier National Park Slow Recession
There continues to be a persistent misconception that all glaciers in Glacier National Park will be gone by 2030, I get asked that by journalists frequently and when I point out that is not the case they are surprised. An examination of 15 Glacier National Park glaciers using the recently published Alpine Glacier Survival Forecast method, indicates that 10 of the 15 glaciers are experiencing a disequilibrium response and will disappear, the other five have been shrinking little. A simpler and more visual look at the survival issue, illustrates why though they all are diminishing the glaciers will not all be gone by 2030. Blackfoot and Harrison Glacier are the two largest glaciers and show minimal changes in the accumulation zone. Both glaciers continue to retreat with the main termini retreating approximately 100-120 m since 1966. In this post we take a close look at the Harrison Glacier the most vigorous and slowest receding of the few remaining Glacier National Park glaciers. Key and Fagre (2003) utilized a model to construct the future of glaciers in the Blackfoot-Jackson watershed, and determined that all would be gone by 2030 with continued substantial warming, but not with limited additional warming. Based on the slow recession and equilibrium response of Blackfoot and Harrison Glacier to recent climate over the last 40 years these two glaciers are not going to disappear within the next 30 years. Harrison Glacier has according to the ongoing work of Northern Rocky Mountain Science Center (NOROCK) Has lost 9% of its areas between 1966 and 2005, a 40 year period. In the first image below the glacier is outlined in the 1966 map of Harrison glacier overlaid in Google Earth. The orange outline is left on the following three images all from Google Earth’s historic imagery files. The map indicates the area of crevasses above the main terminus. A look at the glacier over the last two decades indicates the glacier remains vigorous in terms of flow, as indicated by the many crevasses. In every image from 1991 second image to 2003 and 2005 last two images, even in these later summer images the glacier retains snowpack in its upper accumulation zone. This suggest a glacier that can survive current climate at a diminished size. 


 The above images indicate the slow recent recession of the Harrison Glacier, which unlike the majority in the park is only slowly receding. This is in contrast to nearby Shepard Glacier and Grinnell Glacier which often are devoid of snow and are losing area at a rate of 10% per decade, four times that of Harrison Glacier. Why the difference? Most of the glaciers lay on the east or northeast slopes-lee side of the mountain ridges and have significant avalanching from the slopes above. Grinnell Glacier has a significant accumulation area at 7000 feet and Harrison Glacier at 9000 feet. Hence, the greater change in area as seen between the 1996 orange margin and 2006 recent margin for Grinnell Glacier
Mer de Glace, Glacier Retreat-A Receding Sea
Mer De Glace drains the north side of Mont Blanc. This is the largest glacier in this section of the Alps, it is 12 km long. The “sea of ice” terms not only refers to the size of the glacier, but also to the ogives, curved color bands formed at the base of the icefall. This sea of ice is slowing down as well as thinning and retreating. This has led to the lowest 12% of the glacier being stagnant and appears ready to melt away in the coming decades. A new paper Vincent et al (2014) model Mer de Glace into the future and generate a retreat of 1200 m by 2040, this is likely a minimum. 
Post has been relocated and update at
Mer de Glace
