
The Petermann Glacier in northwest Greenland is significantly different than the fast flowing large outlet glaciers, such as the Jakobshavn and Helheim Glacier we here so much about. It is also different from neighboring Humboldt Glacier. Petermann Glacier is much thinner at the calving front and moves much slower. The result is the volume flux from this glacier is much less than Jakobshavn which loses 40 cubic kilometers per year, versus 1 cubic kilometer at the calving front of Peteramann and 12 cubic kilometers at the grounding line. A detailed review of some of the differences is explored in an article I wrote for Realclimate in 2008.
In 2011 the fjord in front of the glacier emptied of ice by July 22. The glacier itself has yielded no substantial icebergs or retreat following on the spectacular losses in 2010 noted below. The main rift near the ice front has not shown significant expansion, in the MODIS image below from 8/31/2011, Middle image. This lack of response in 2011 is not a surprise as after a substantial calving event in 2008, it was not until 2010 that the next one occurred, 2012 seems like a better bet. The change from July 28, 2010 (top image) is still amazing.
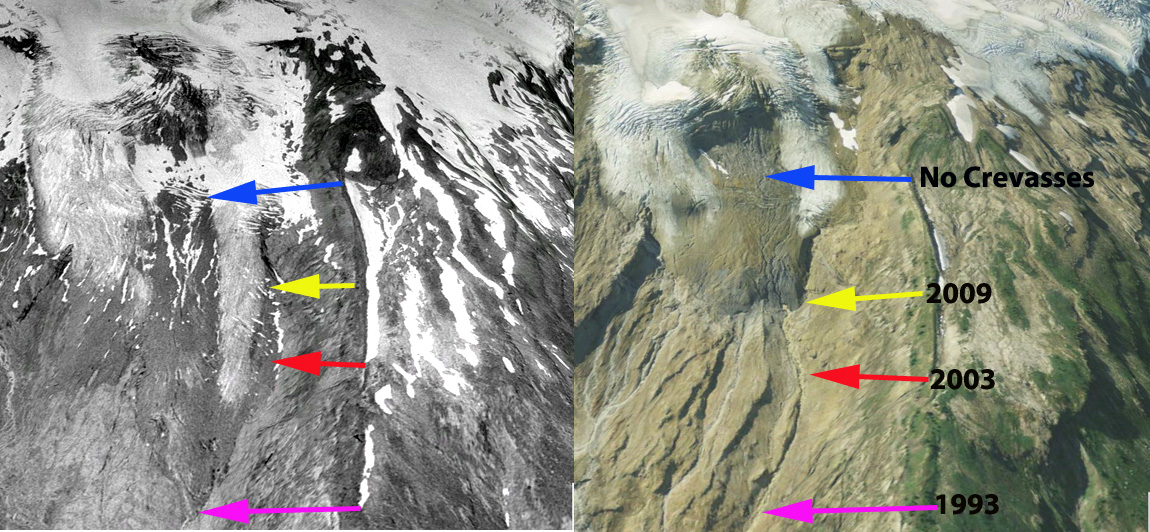
Update July 2012, the rift has led to the anticipated iceberg calving event well documented at Icy Seas and Arctic Sea Ice, see last image in sequence for the 2012 event. The glacier becomes thicker with distance from the calving front as of now there are now incipient rifts to note in the NASA MODIS image below. This combined with the thicker ice suggests that another iceberg calving event is not imminent, and cannot be forecast as the previous two were with a lead time of at least a year. There is a small area of weak ice, a melange at the blue arrow that is likely to provide smaller icebergs during the course of this summer.


In 2008 Petermann Glacier lost a substantial area, 29 km2 due to calving as noted by Jason Box at Ohio State. and a crack well back of the calving front indicates another 150 km2 is in danger, Crack C. This preconditioned area of weakness noted in 2008 is explored in satellite images below. Of course recent events of Aug. 2010 have resulted in a number of updates to this post. Petermann Glacier has a floating section 16 km wide and 80 km long, that is, 1280 sq. km. This is the longest section of floating glacier in the Northern Hemisphere. As of 8/5/2010 this floating section is now reduced to about 250 sq km in area and 65 km long. This impending loss I commented upon two years ago, and that Pat Lockerby has been focussed on this summer, has now occurred. This does not herald the end of the retreat. The loss of this much frontal ice should lead to glacier acceleration and some additional rifting in the near future. Unlike most Antarctic ice shelves this glacier is well buttressed by fjord walls and not prone to a rapid collapse. Inland of the grounding line unlike on Pine Island Glacier the Petermann Glacier goes from 500 meters below sea level at its bed to near sea level in a distance of 100 km. This limits the ability to form an ice shelf. Crack C is the main rift existing behind the calving front. A comparison of this crack from 2008 and 2010 indicates it has extended considerably toward the middle of the glacier. I have annotated two very detailed NASA images labeling the Supraglacial stream (SGS) channel that was interrupted by the rift severing it from the previous supraglacial stream channel (PGS). I have also labelled the turns in Crack C, note the 2007 end of the rift at the and the 2010 rift end indicated by blue arrows in the 2010 image. Also note the right hand blue arrow indicating the SGS entering the C crack and creating a bit of open water. The rift has now extended nearly to the center of the glacier and the central supraglacial stream. 
 The crack is going to spread and will lead to another major calving event. It seems unlikely it will occur in 2011, 2012 more likely. The rift as of April 18, 2010 in the image below from the Danish Meterological Institute MODIS library, is nicely visible, the bright white is likely indicating the presence of snow that has drifted into the rift.
  In 2011 the fjord in front of the glacier emptied of ice by July 22. The glacier itself has yielded no substantial icebergs and the main rift near the ice front has not shown significant expansion, in image below from 8/31/2011
The cropped image from Pat Lockerby indicates the newly created iceberg the largest in the Northern Hemisphere. The area of floating ice on the Jakobshavns in contrast has varied from year to year with retreat but has remained less than 40 sq. km. The size of the floating tongue provides the potential for a longer exposure and greater melting at the base of the glacier. This is also due to the slow velocities, 1 kilometer per year. The slow velocity results in a greater duration of surface and basal melting, which effectively thins the glacier to a mere 60-70 meters at the calving front. Petermann Glacier loses 90% of its thickness before it reaches the calving front thinning from 600-700 m at the grounding line primarilly due to basal melting. The calving front protrudes a mere 5-10 m above sea level, not your typical towering ice cliff you generally envision for a large Greenland outlet glacier. This reflects the fact that the ice at the front is only 60-70 m thick (Higgins, 1990). Thus, at 500-600 meters of thickness is lost to melting. This is largely basal melting as demonstrated by Johnson and others (2010). The glacier velocity is close to 1 km per year, 3/meters day, about 10% of the velocity of Jakobshavn (Rignot, 2000). The volume of the ice lost is much less than that from the loss of a comparable area by Jakobshavn because the ice is an order of magnitude thinner. Radar assessment by Howard Zebkar, Stanford Univeristy of glacier velocity indicates the acceleration near the grounding line as the glacier narrows and friction is reduced, then deceleration as the glacier thins after becoming fully afloat.
A recent paper by Joughin et al (2010) illustrates why Petermann Glacier is the key glacier in NW Greenland. It is their Figure 3 shown here that indicates on the left the large inland extent of high velocity of this glacier and on the right the recent lack of acceleration. An acceleration will require further ice tongues losses.  The key to this glacier’s second major ice loss this decade, after limited retreat in the last century, is thinning of the floating tongue. The thinning weakens the glacier and reduces the degree of anchoring to the fjord walls. The loss of this ice should then lead to acceleration, developing more crevassing and glacier retreat. The crack seen in the image of Petermann Glacier (ASTER image provided by Ian Howat of Ohio State) is more of a rift, like those on Larsen Ice Shelf, than a crevasse.
 The transverse rift is further connected to longitudinal-marginal rifts. Illustrating the poor connection of the Petermann Glacier to its margin and lack of a stabilizing force this margin has, even 15 km behind the calving front. This is not the only rift of its kind on the glacier. Also note that like on Larsen Ice Shelf the rift crosscuts surface streams. These illustrate the significance of surface melting, which reached a record in 2008 (Box and others, 2009). In 2010 the floating tongue lost its snow cover earlier than normal. This is important as Johnson et al (2010) have noted that basal melting is high closer to the grounding line, but not as high near the terminus, indicating that surface melting is a mechanism of thinning near the calving front. The surface melting does not enhance flow on this section of the glacier at all, as it is already afloat.
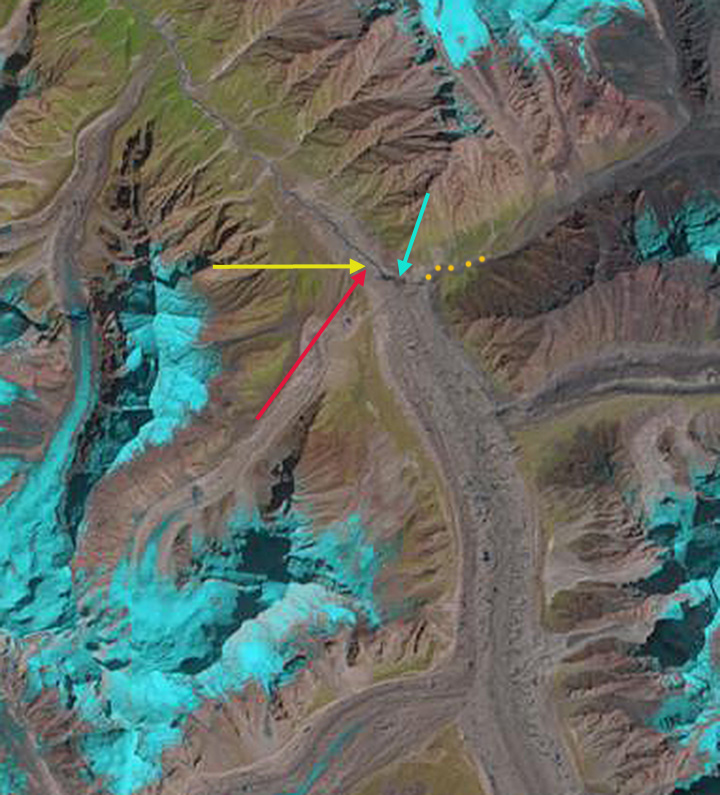
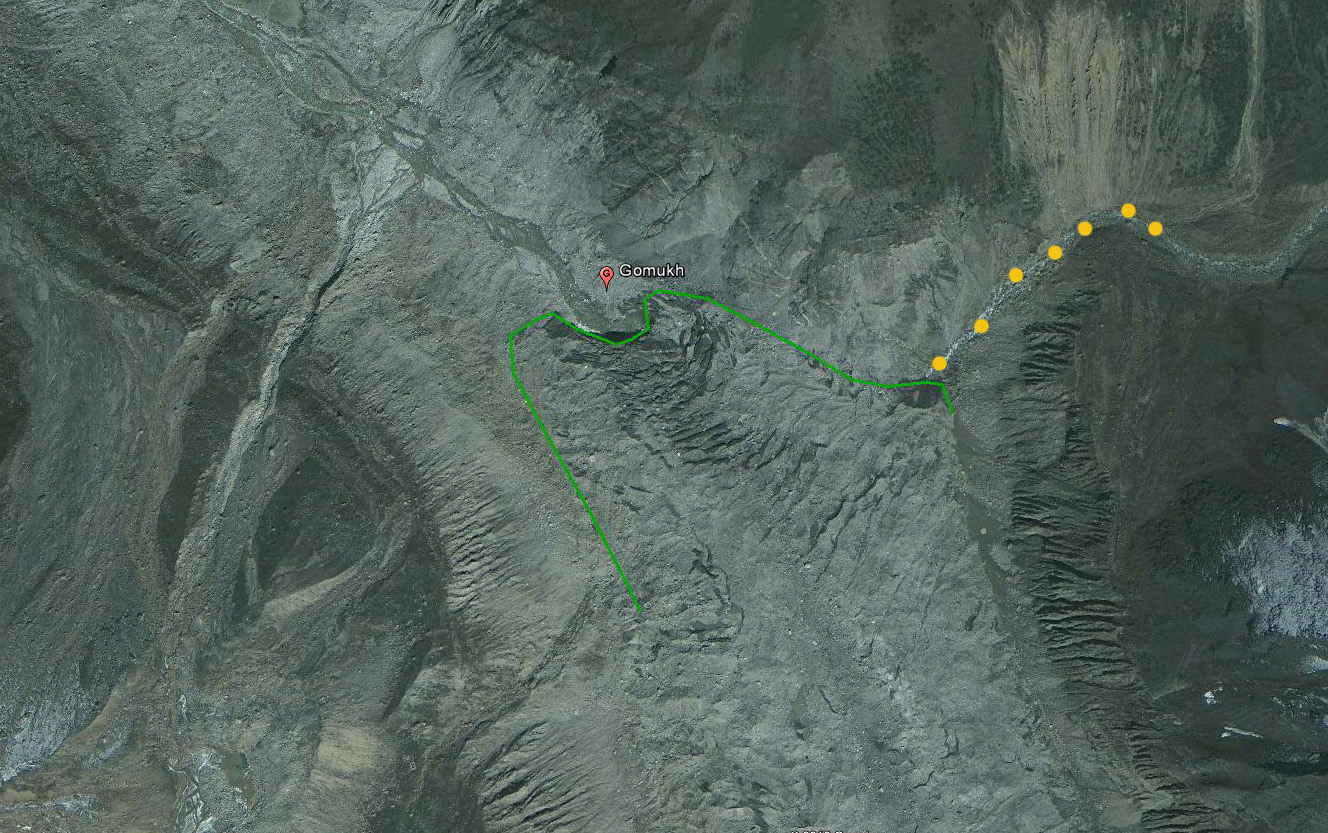
The images below are a series of Landsat images provided by the USGS, from 2002, 2006 and 2007. These illustrate the shift in the terminus and in the position of key rifts A, B and C. The distance back from the terminus has diminished for A and B from 2002 to 2007. In 2006 to 2007 the shift in the position of C is also evident.The final image is a larger scale indicating the entire valley section of the Petermann Glacier. The darker blue hue indicates that this is bare ice and is in the ablation zone. This is true in each year examined. The transition to the lighter hue, indicates the snowline, which is a short distance above the valley tongue. Petermann Glacier is poised to lose a greater area as it retreats than Jakobshavn Glacier, but a smaller total volume. 


Higgins, A. 1990. Northern Greenland glacier velocities and calf ice production. Polar Forschung, 60, 1-23.


 Boulder Glacier in August 2008.

