35th Annual Field Season Monitoring North Cascade Glaciers Preliminary Assessment


We monitor the response of North Cascade glacier to climate change and the consequent impacts for water resources and the ecosystem, as illustrated here by Megan Pelto and Jill Pelto.

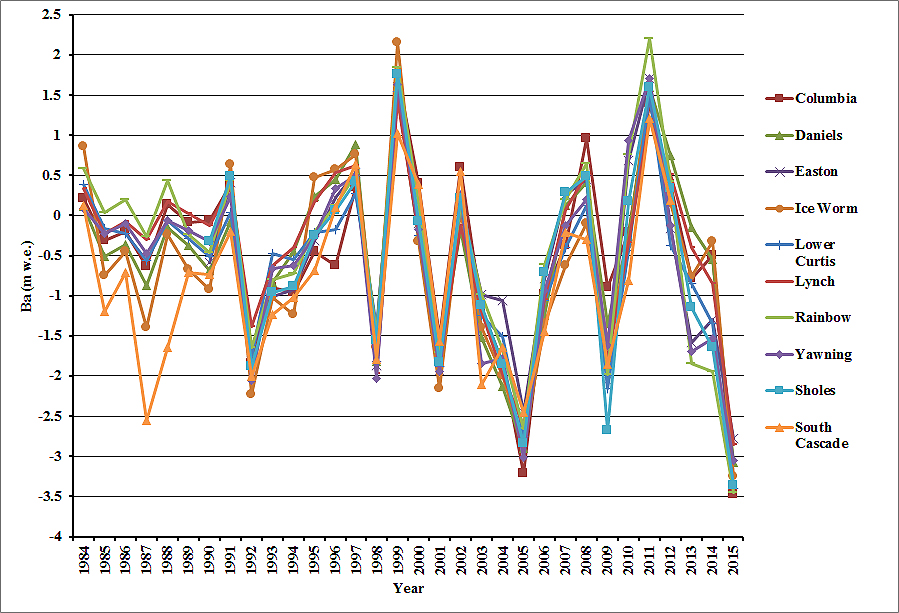
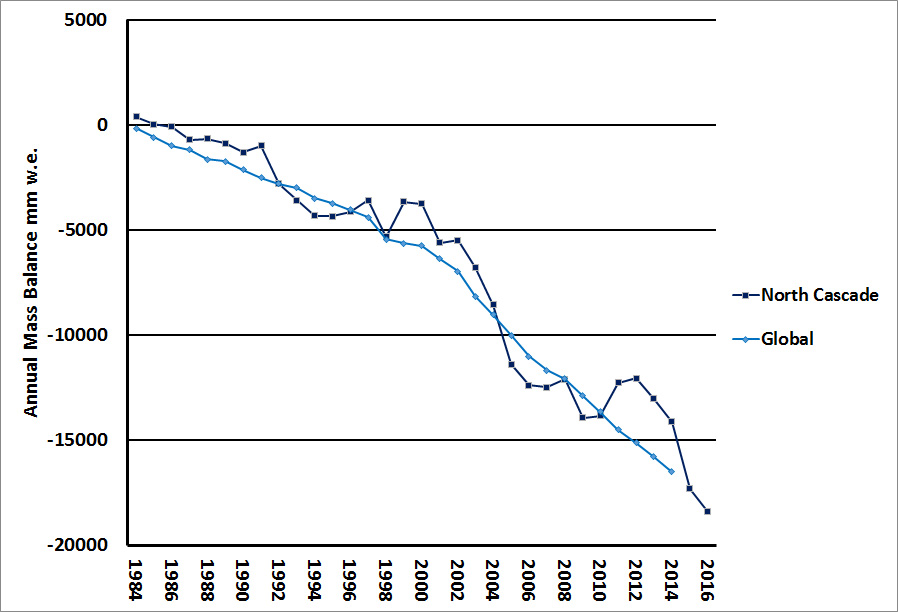
For the 35th consecutive year I headed to the North Cascade Range, Washington to monitor the response of glaciers to climate change. During the course of this study we  observed several of the glaciers we monitor disappear.  Two of the glaciers we monitor are now part of the 42 glaciers comprising the World Glacier Monitoring Service reference glacier network, where annual mass balance has been assessed for more than 30 years consecutively.

The 2018 winter season featured relatively normal snowpack despite a winter of wide temperature fluctuations, Feb freezing levels 400 m below the mean and December 500 m above the mean. Summer melt conditions featured a high freezing levels in May, normal freezing levels in June and high levels in July (NA Freezing Level tracker). The summer melt season through Aug. 20th has been exceptionally warm and dry, which has also helped foster forest fires. The melt rate during the August field season was 35% above normal.

We assessed the mass balance of eight glaciers.  All eight will have significant negative mass balances in 2018. Retreat was measured on six of the glaciers where the terminus was exposed, all had retreated since 2017.

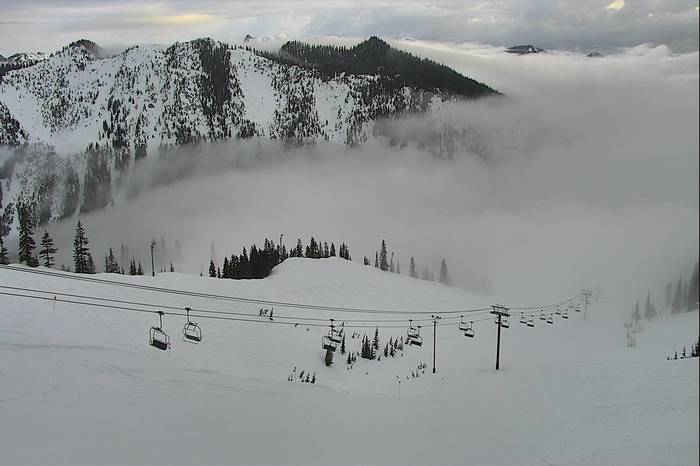
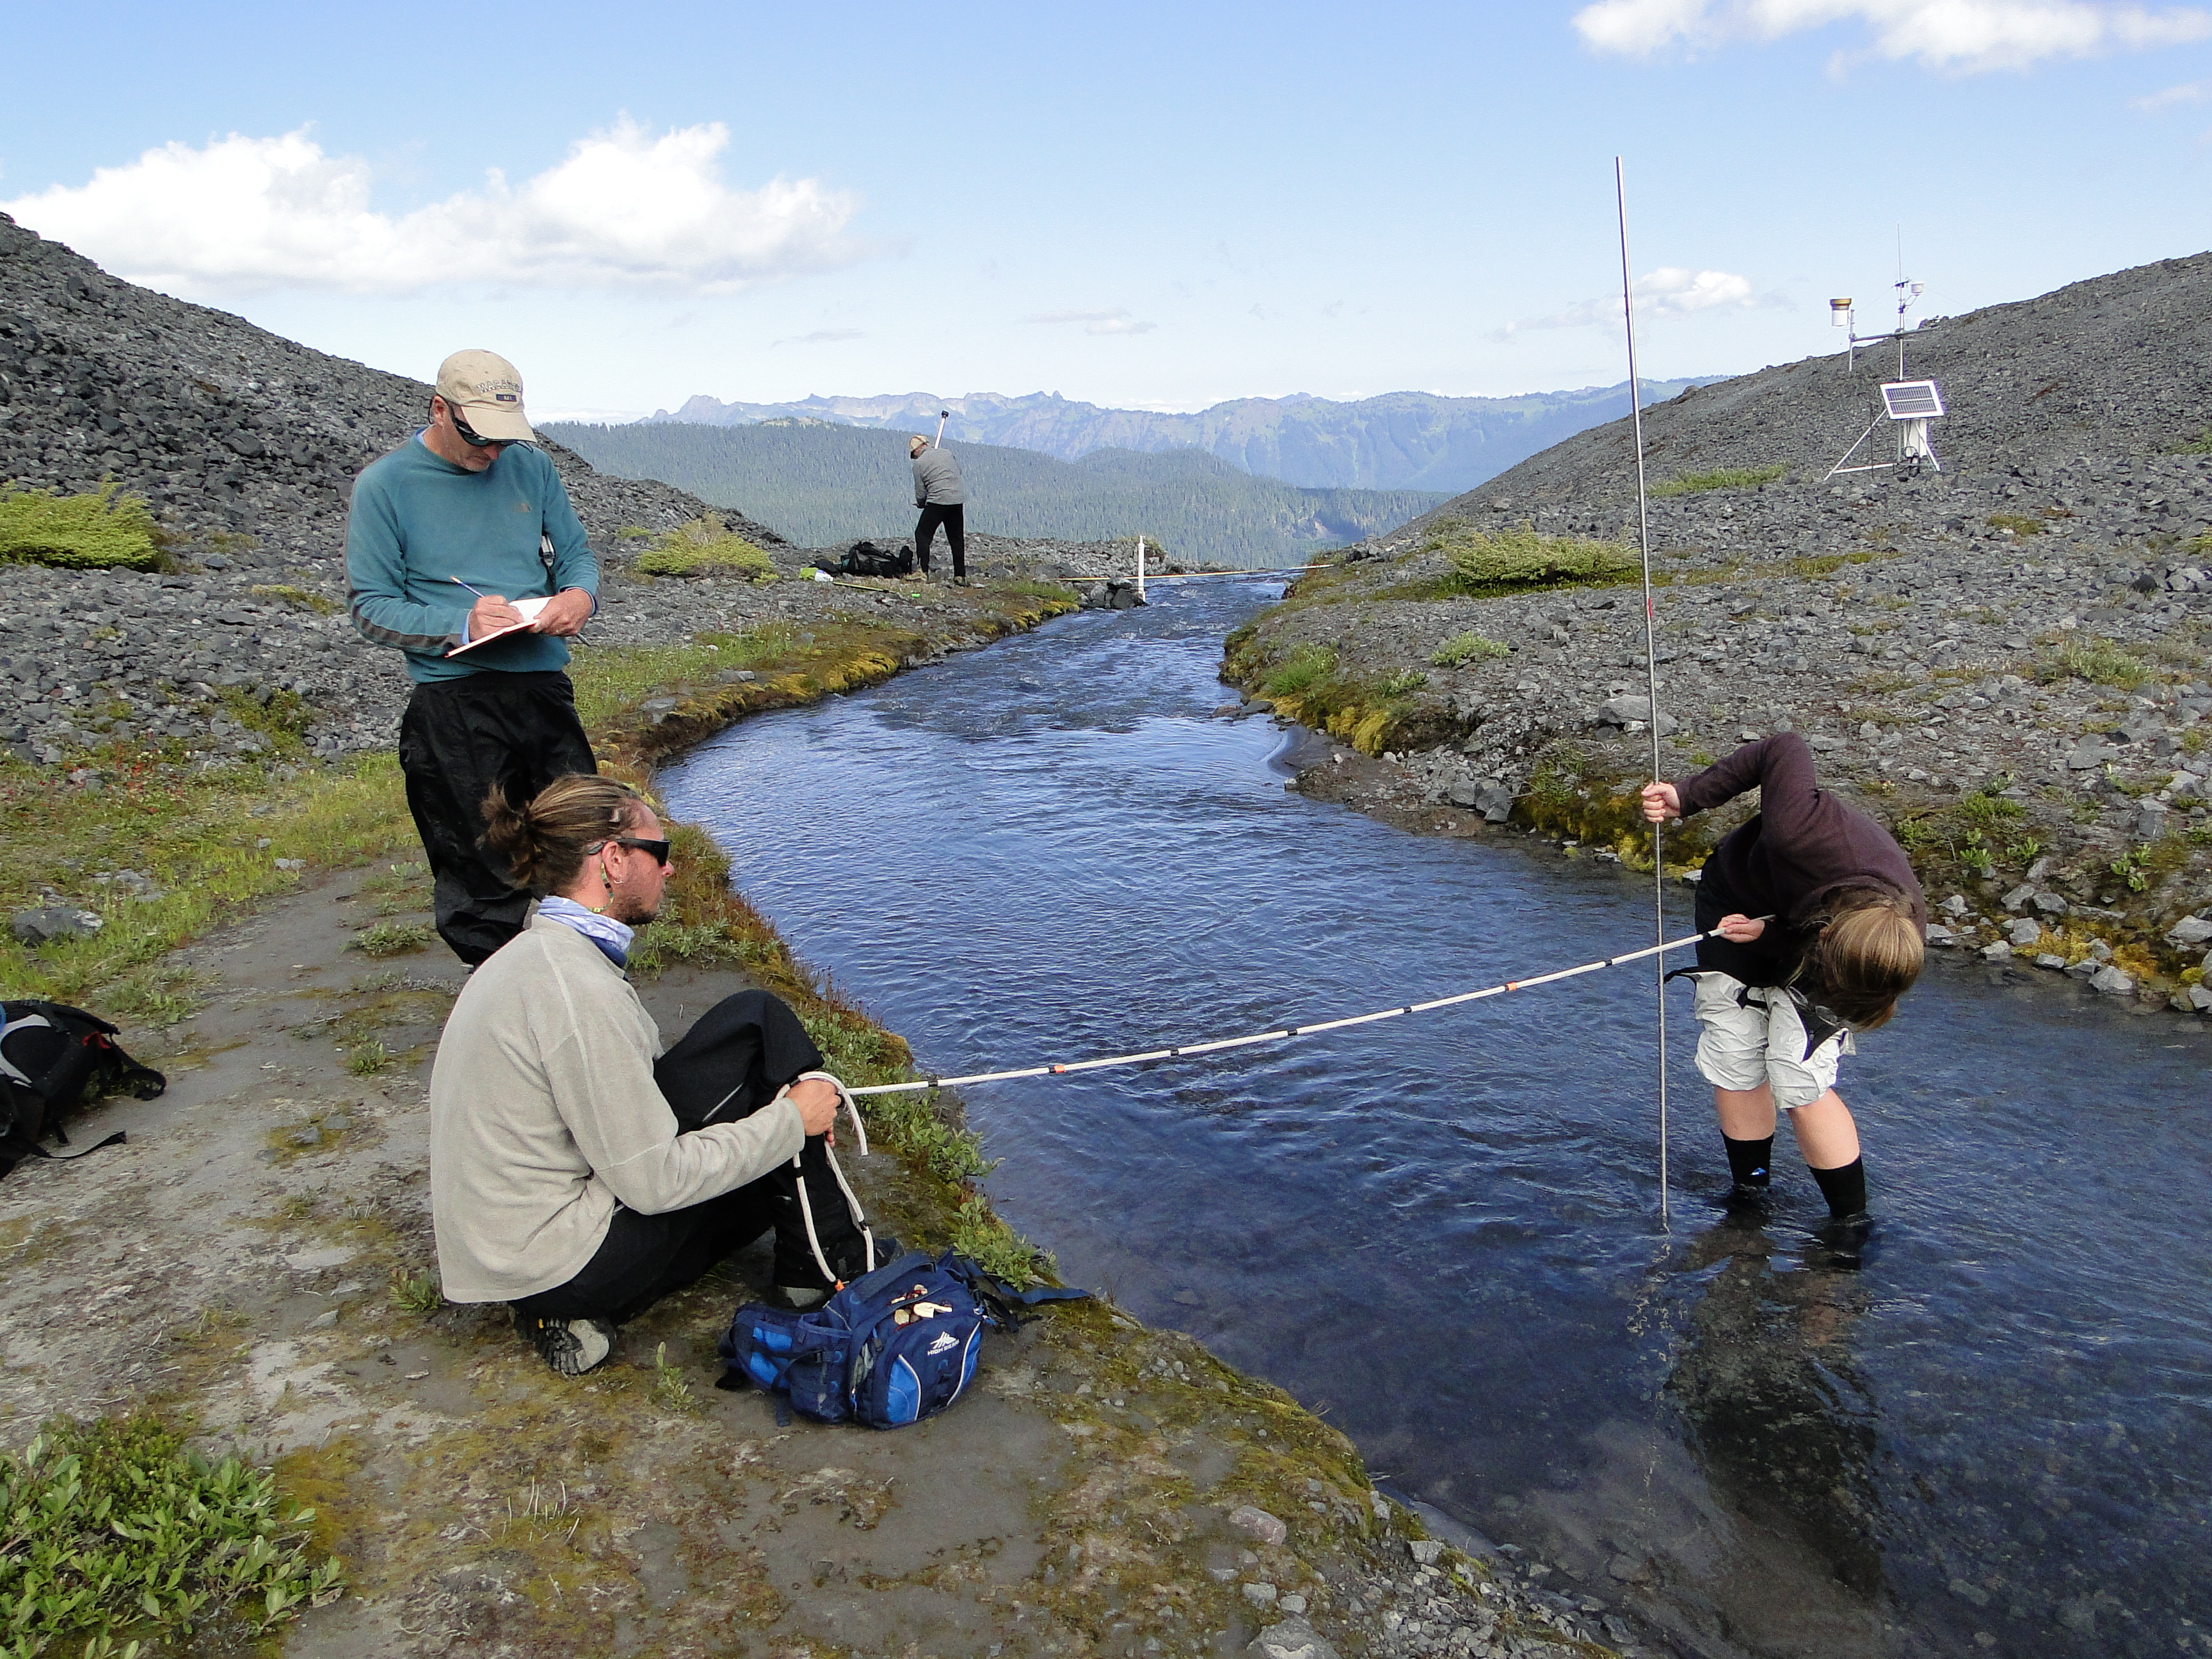
Sholes Glacier Runoff Monitoring Location in early August 2018

This year the field team consisted of:

Mariama Dryak, UMaine graduate student quantifying iceberg melt rates and meltwater fluxes around the Antarctic Peninsula using satellite imagery.  She is the US national committee representative for the Association of Polar Early Career Scientists, co-chair of USAPECS and helps coordinate the USAPECS blog. Mariama is also the creator and editor of an environmental advocacy blog Let’s Do Something BIG., which highlights the need for effective science communication and the need for greater diversity in the earth sciences.

Erin McConnell, UMaine graduate student, who is studying ice core stable isotope records from the Eclipse Icefield, St. Elias Range, Yukon.She has written about the equal importance of communicating science and the science itself..

Jill Pelto, UMaine graduate student studying paleoclimate records recording past ice sheet changes in the Transantarctic Mountains and an artist, joining the field team for the 10th year. Her work has taken her to Antarctica, New Zealand and Falkland Islands and has been widely featured by Earth Issue,  The Smithsonian, and Edge Effects.

Mauri Pelto, Nichols College academic dean, World Glacier Monitoring Service Representative and director of the North Cascade Glacier Climate Project .  I am heading into the North Cascades for the 35th year. The results will from this year will be promptly published with the AGU From a Glaciers Perspective Blog and the North Cascade web site.  A video encapsulation of the field year will also be developed as in past years. Putting the long term record in perspective was the 2018 Water publication on the long term mass balance record.

Observing snowpack thickness retained in August on Rainbow Glacier

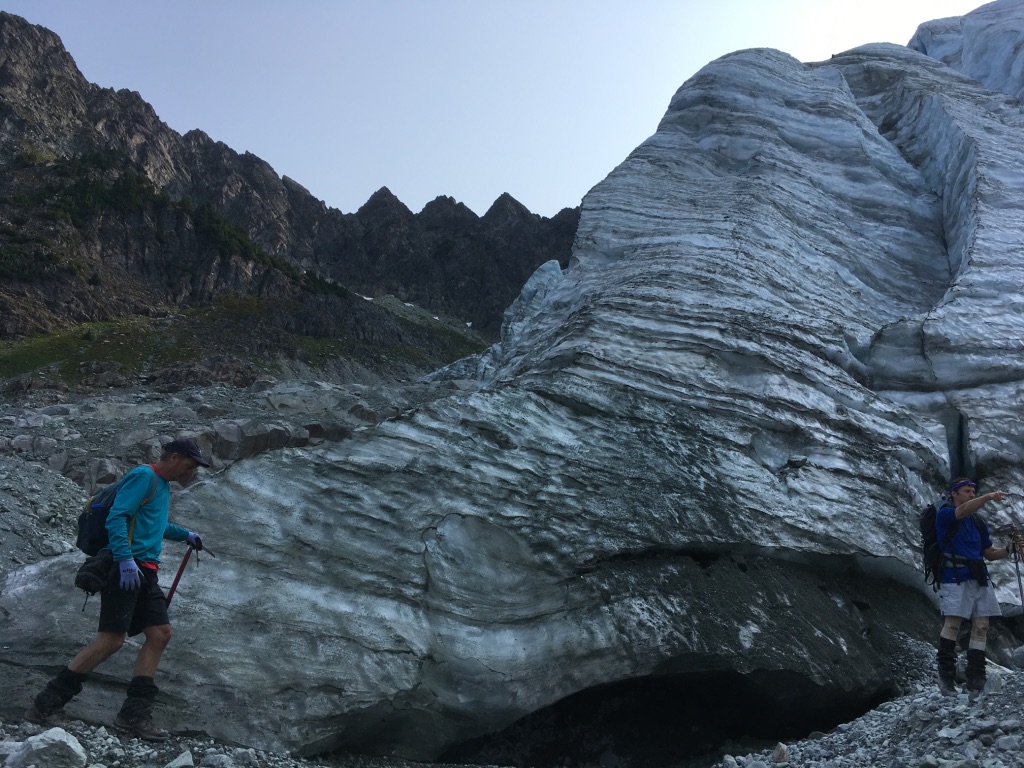
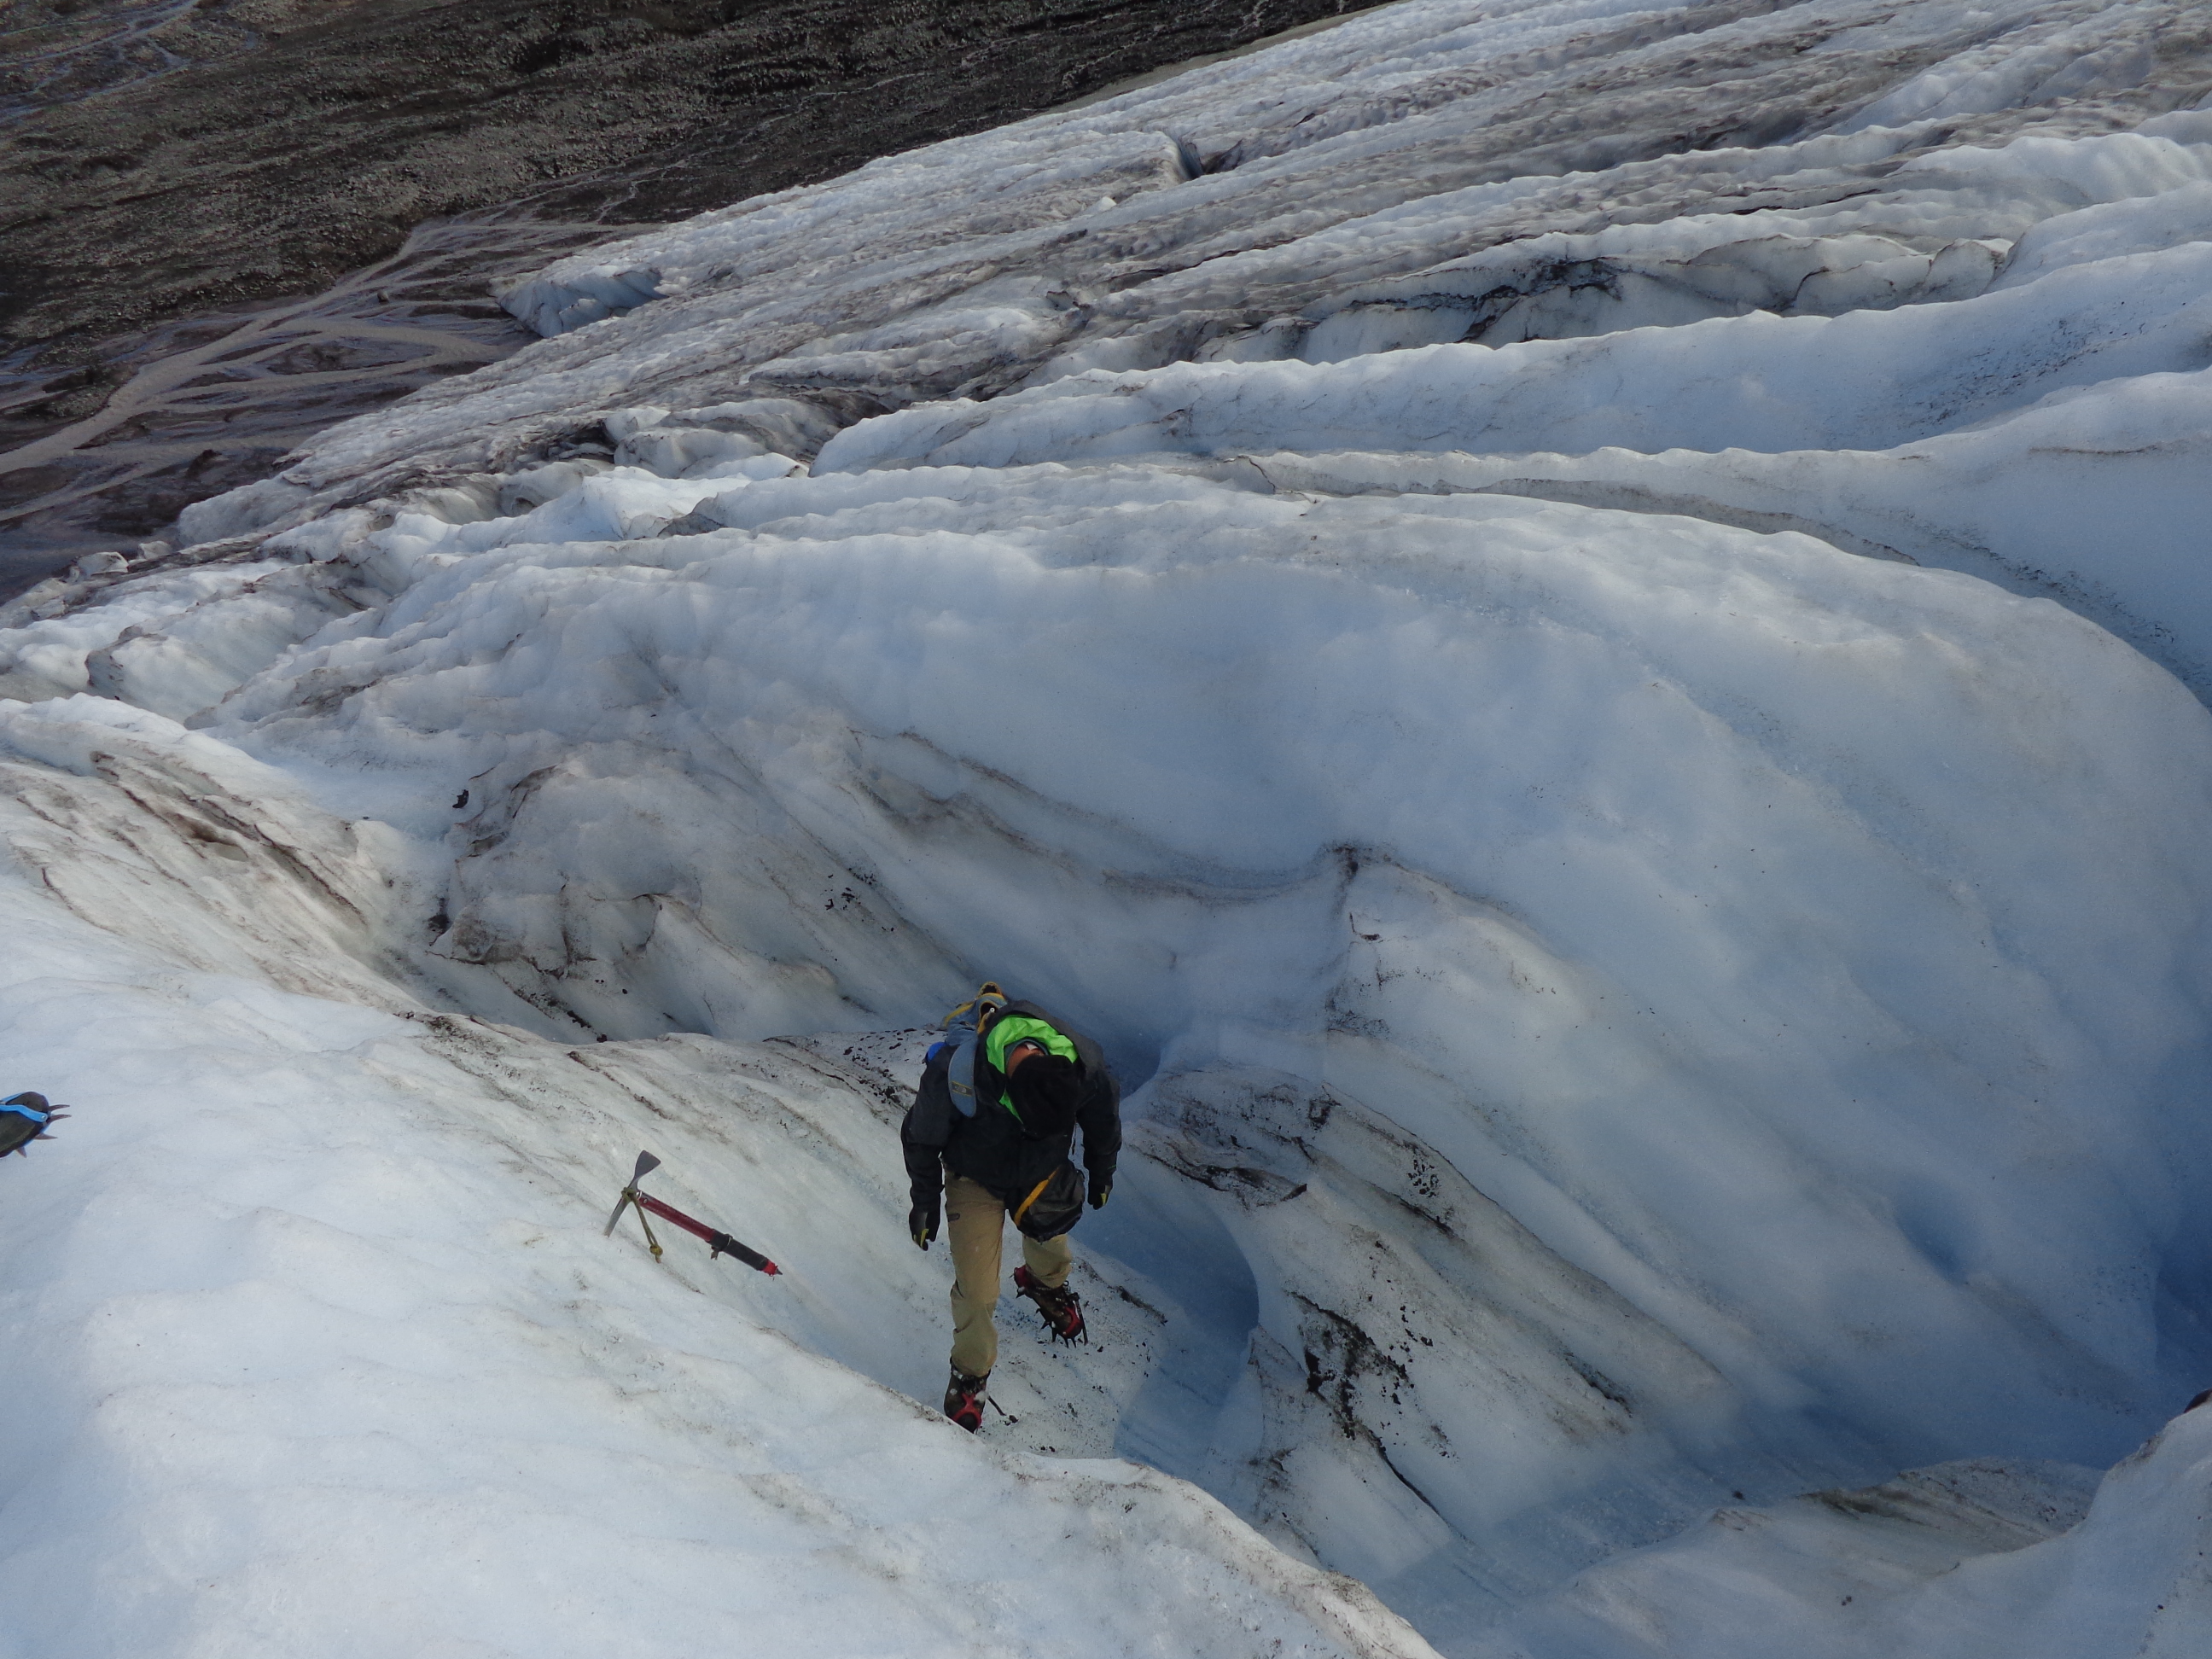
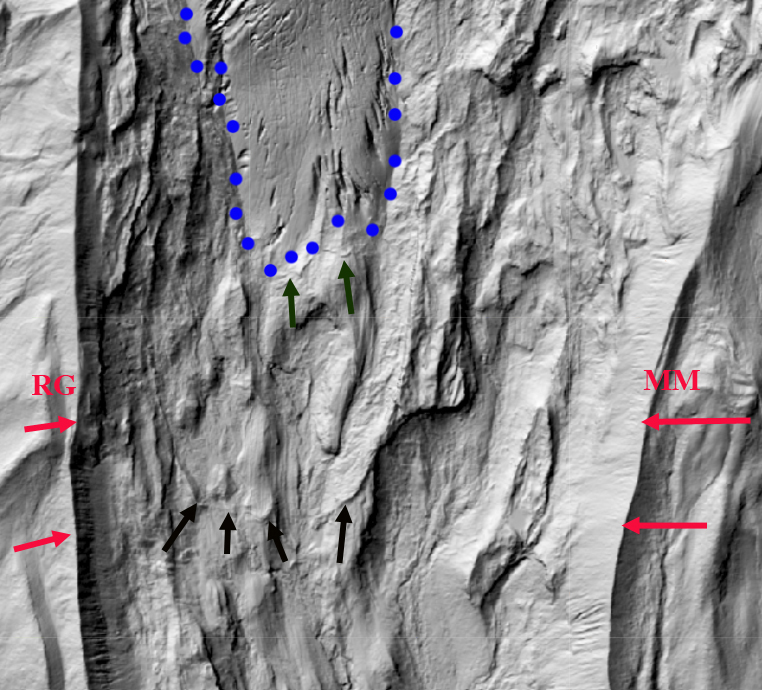
Mapping terminus of Lower Curtis Glacier

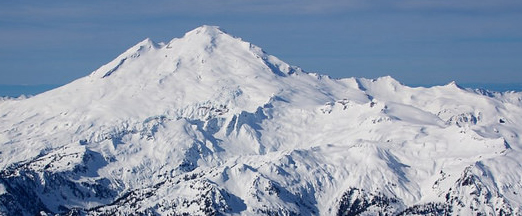
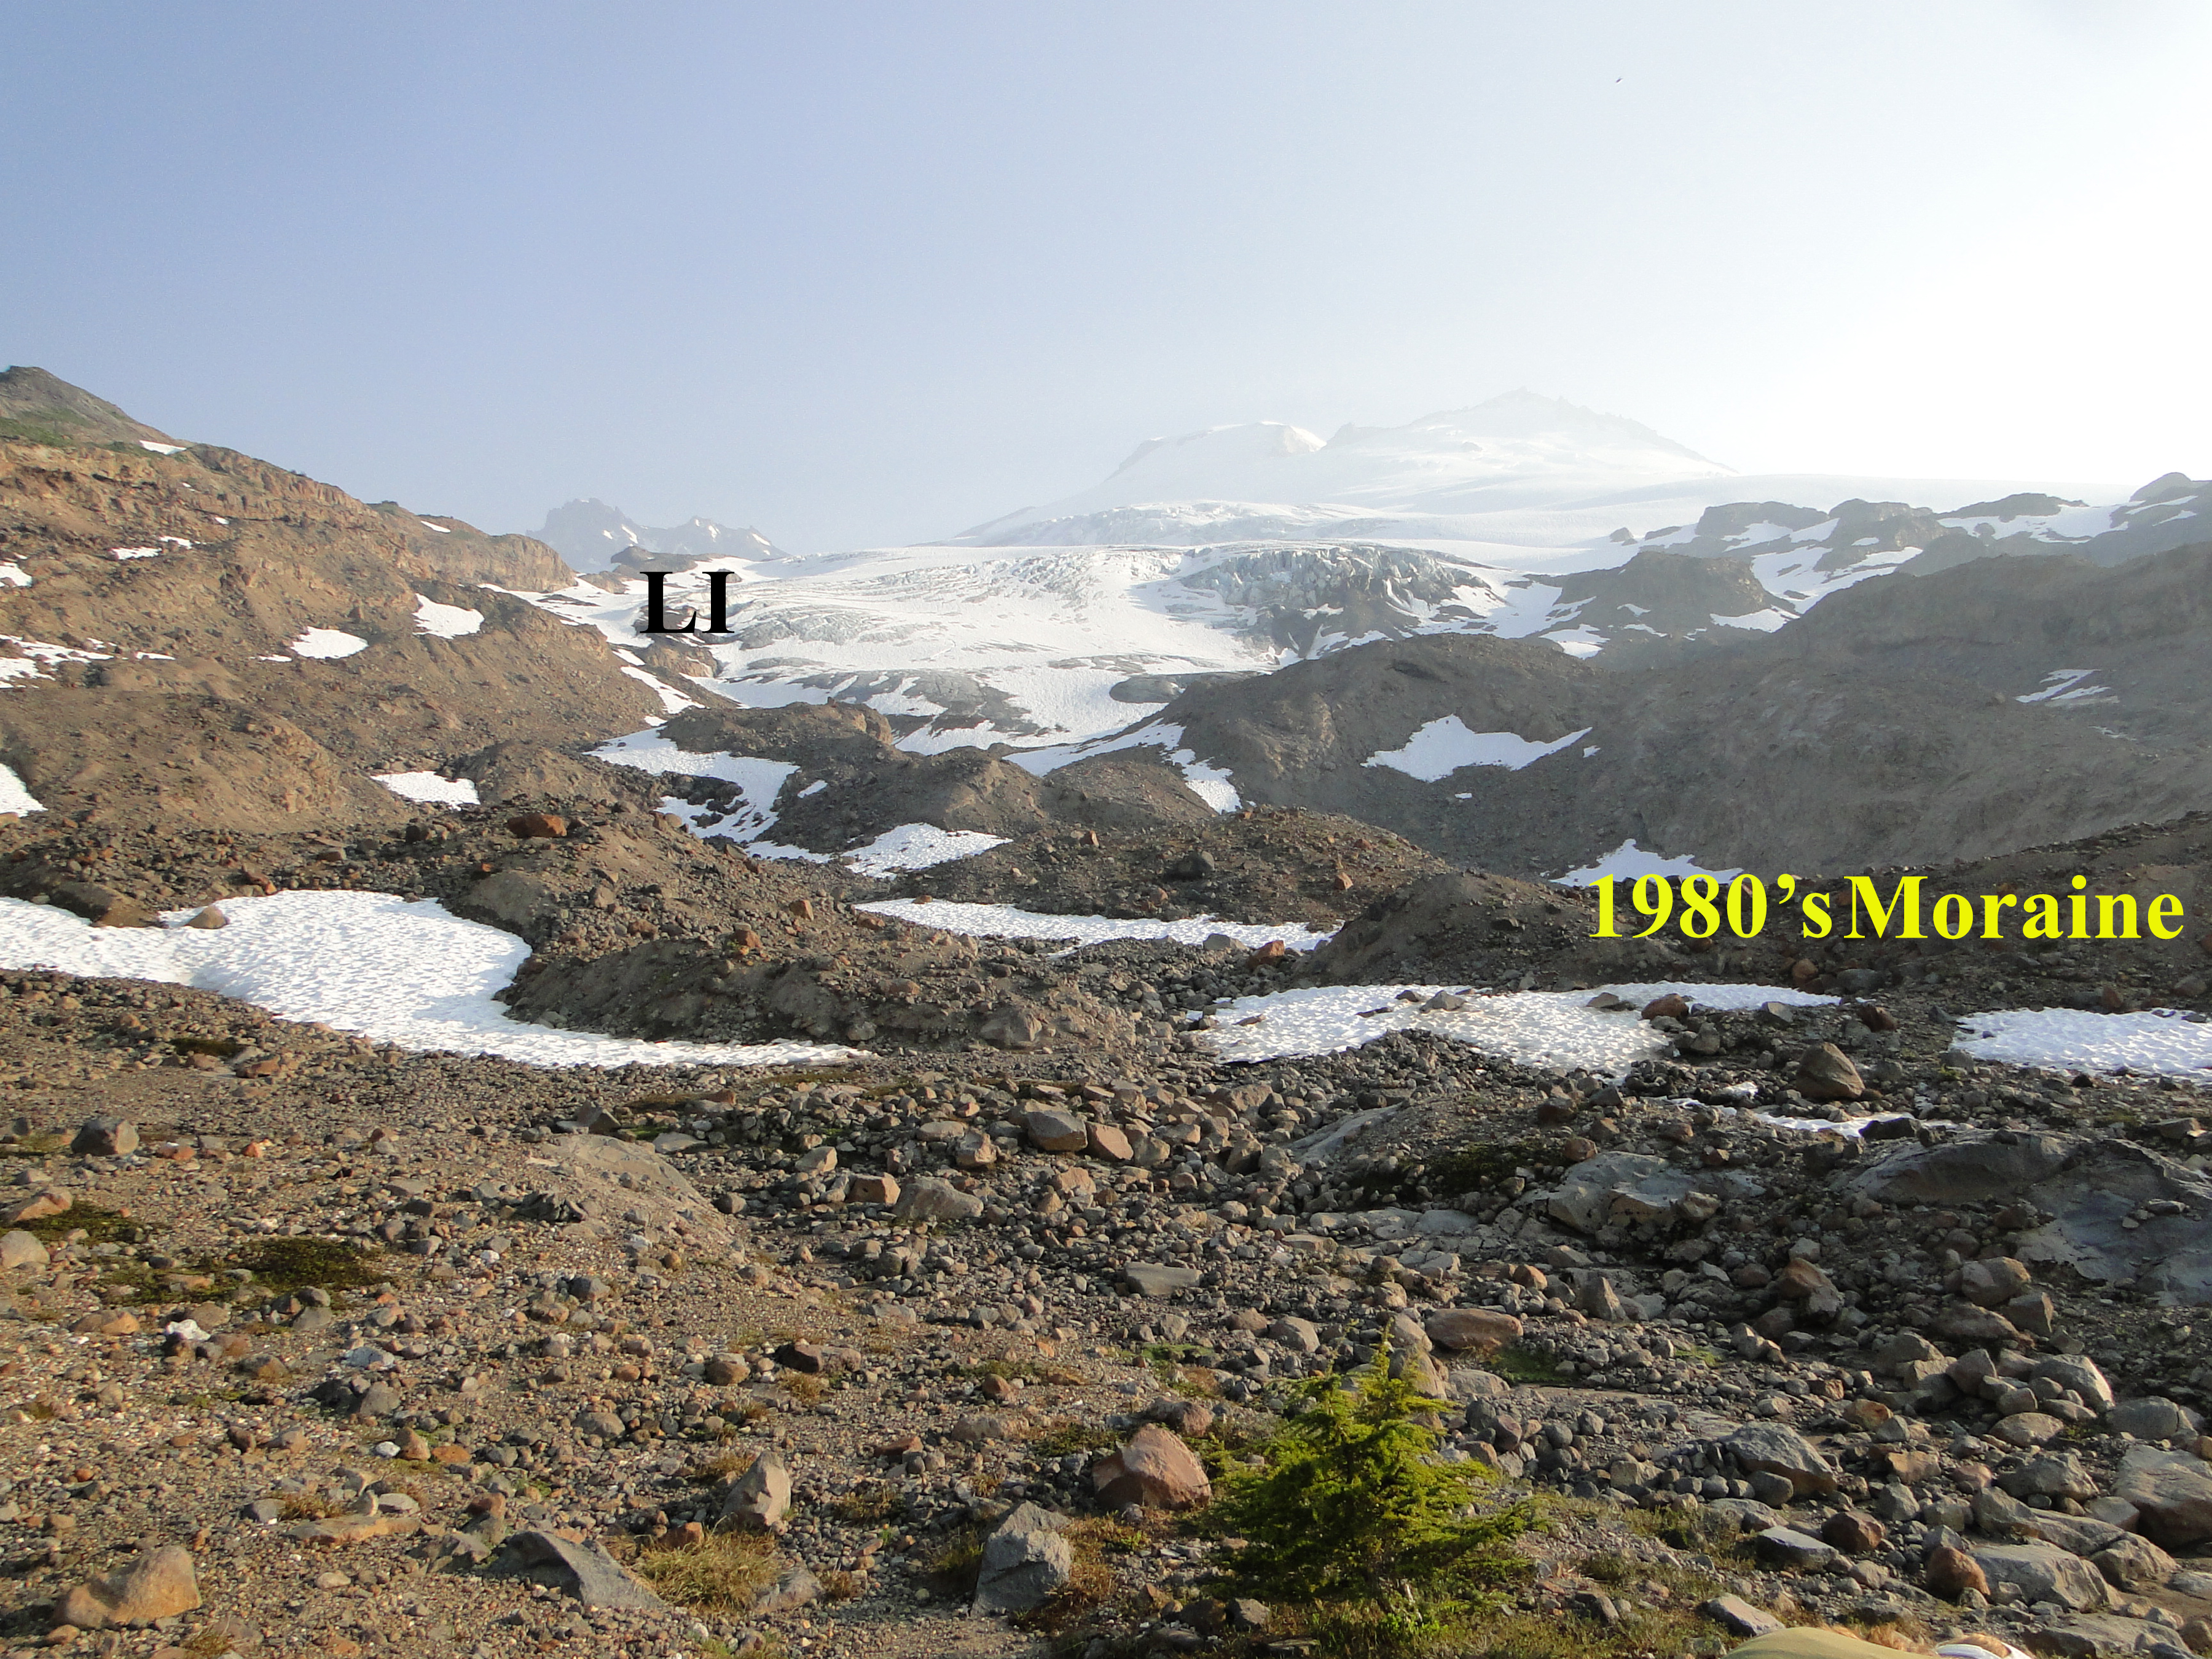
Terminus of Columbia Glacier with evident forest fire smoke haze.

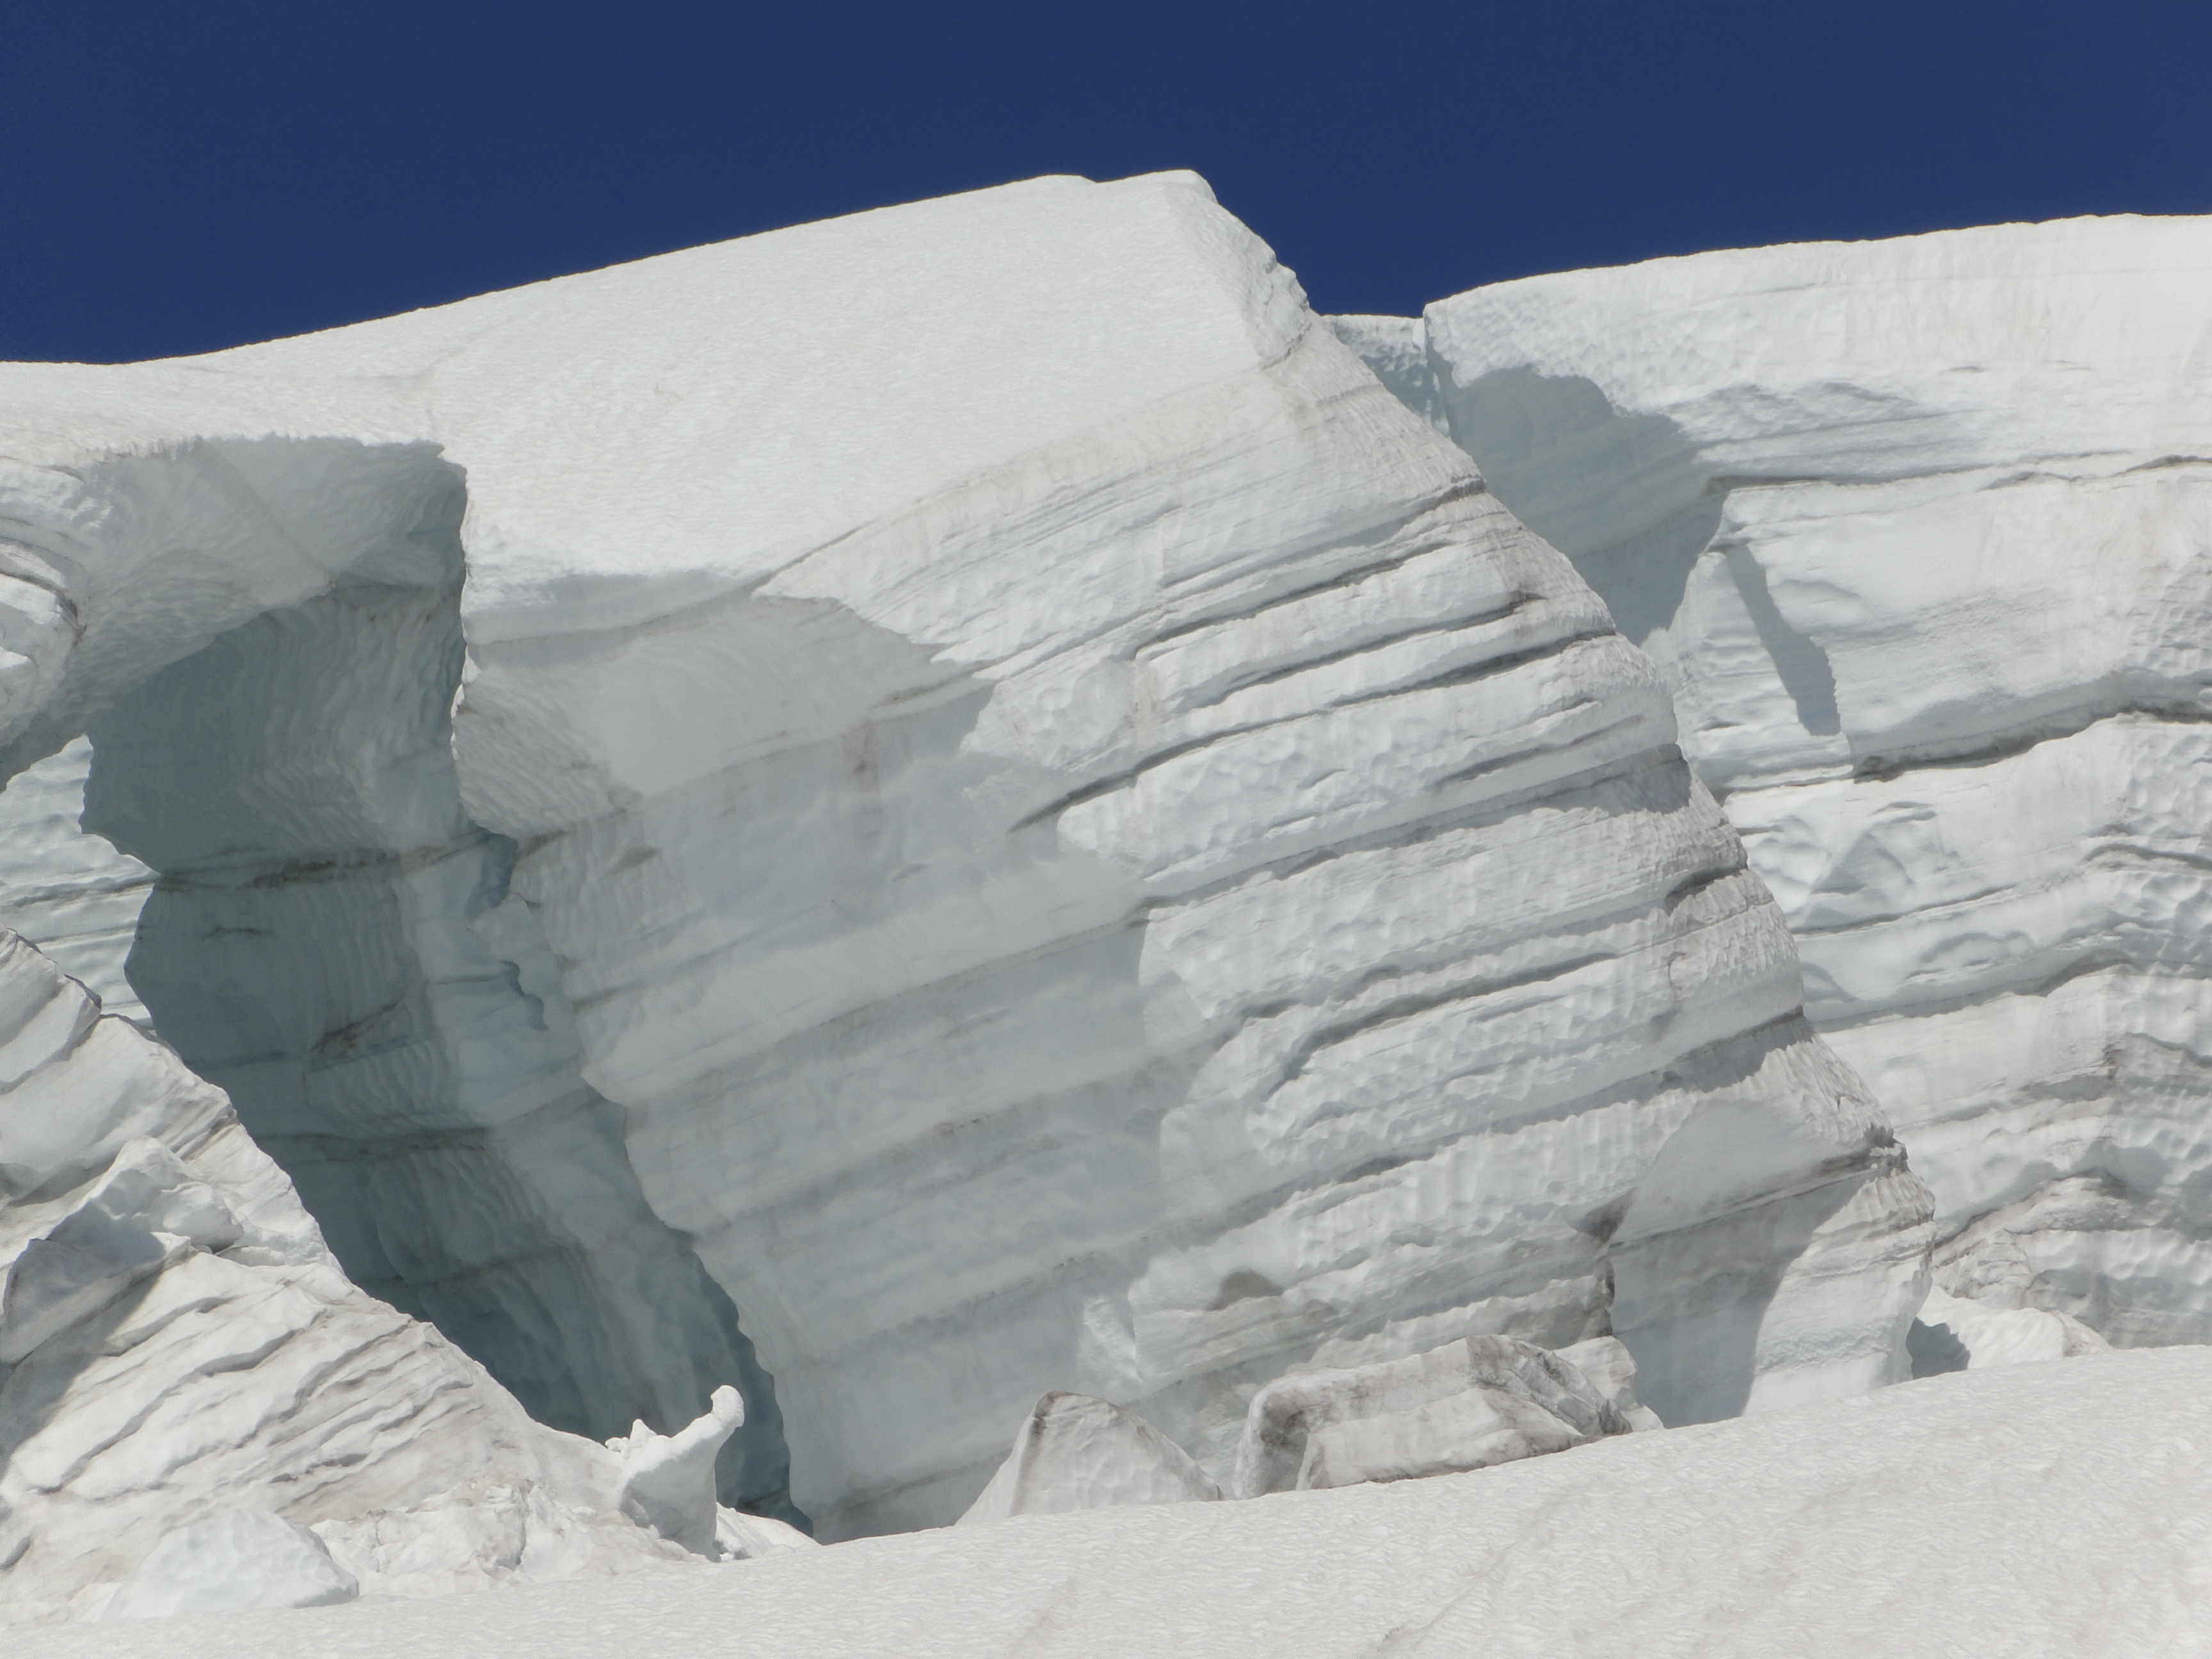
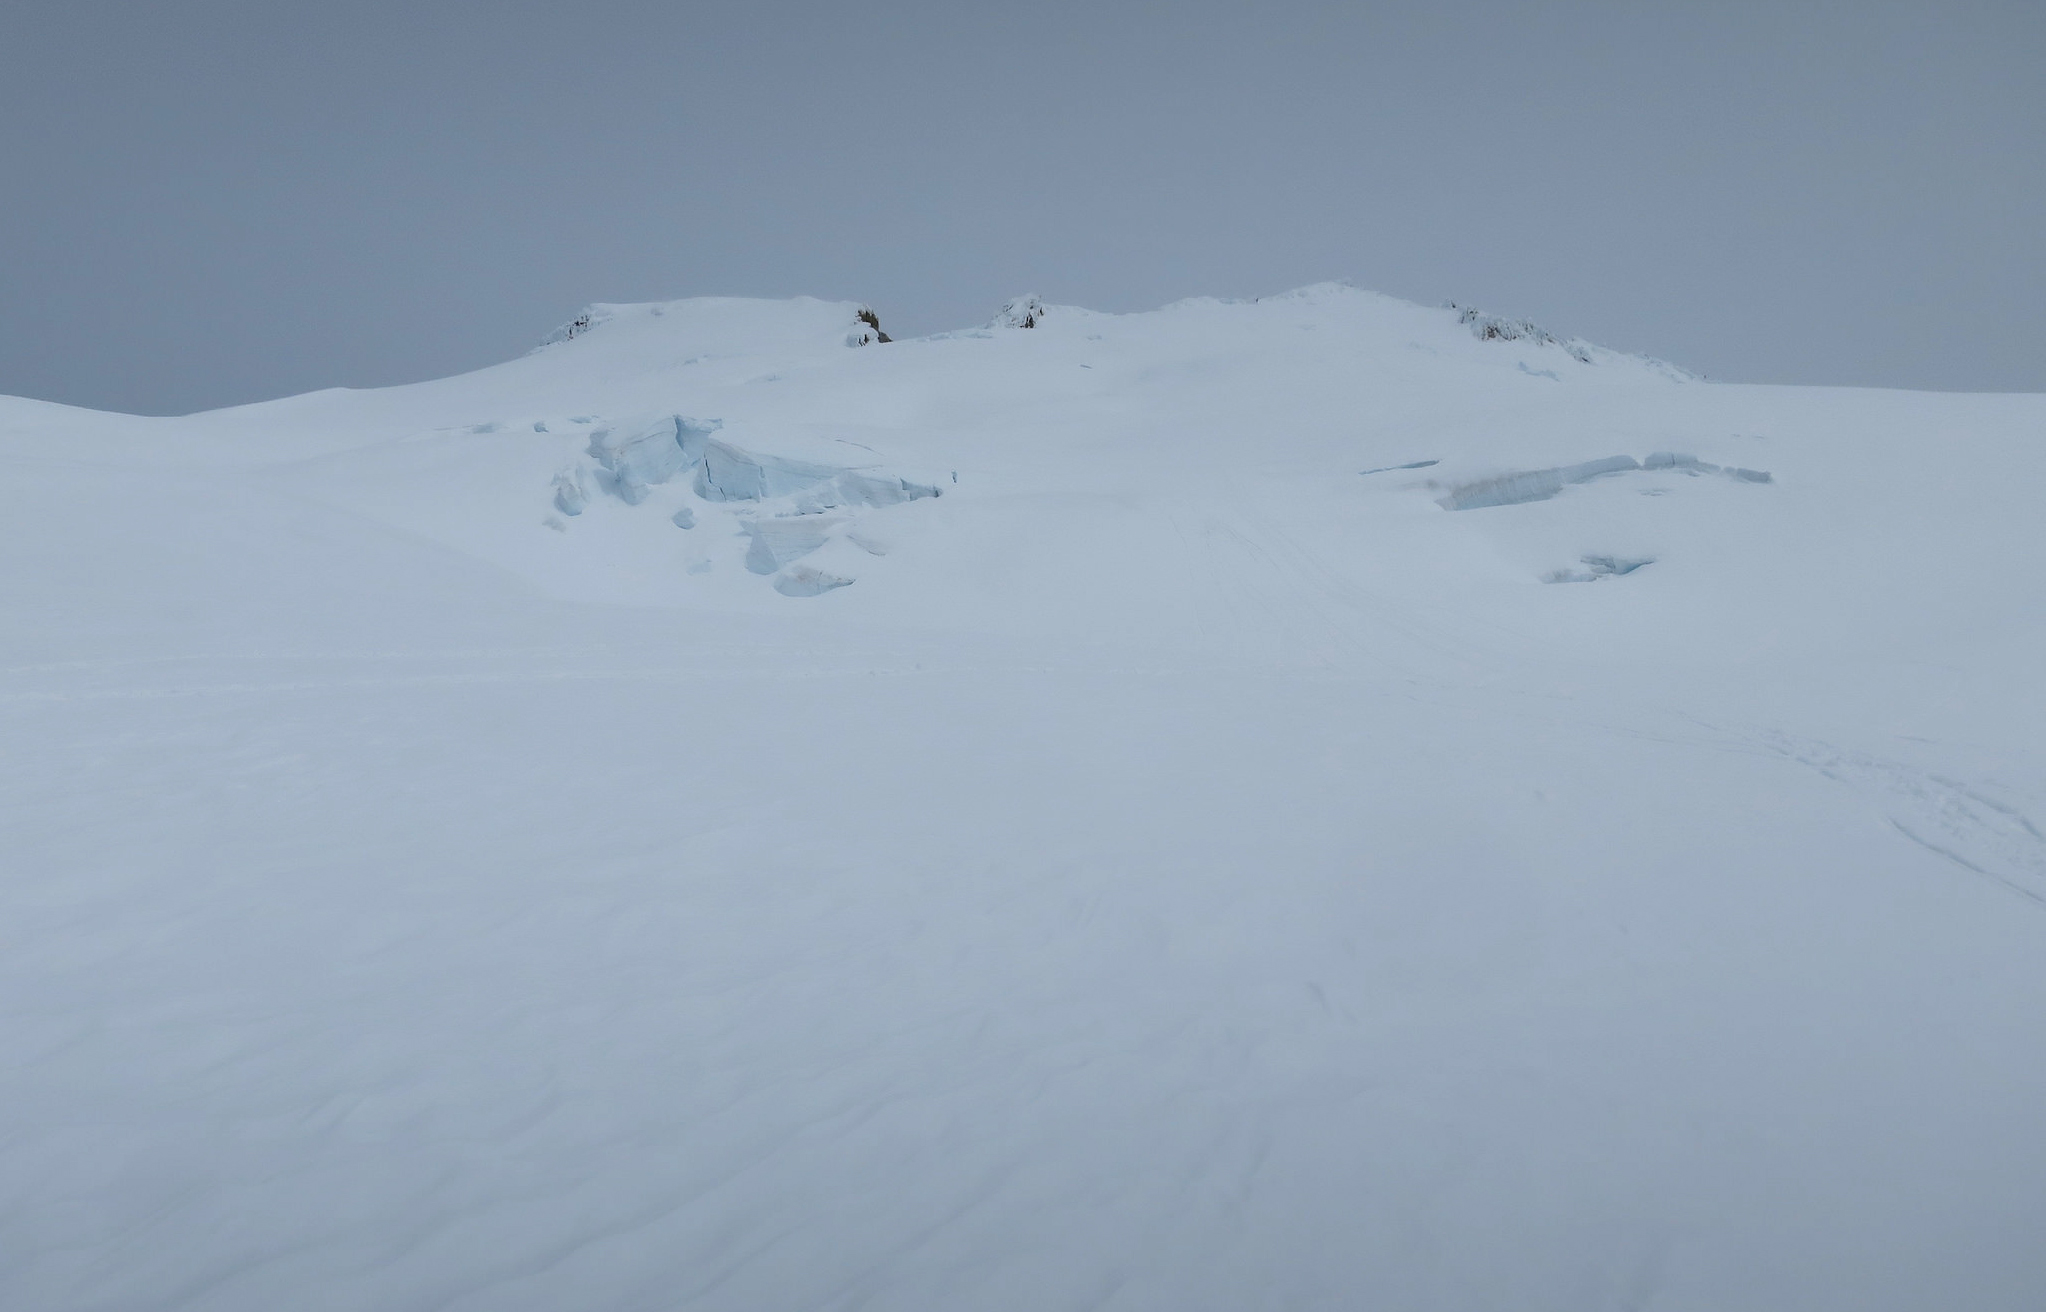
Easton Glacier Icefall at 2500 m, indicating a typical 2.25 m thick accumulation layer.

Honeycomb Glacier Retreat, Washington New Lake Lost Nunatak

Honeycomb Glacier in Google Earth imagery from 1998 and 2016.  The dark orange line is the 1998 margin, we mapped the margin in the field in 1995 and in 2002.  The light orange line is the 2007 margin and the yellow line the 2016 margin. Note crevassing diminished as well. 

Honeycomb Glacier is one of the longest and largest glaciers in the North Cascades.   In 1979 it was 3.9 km long and had an area of 3.5 km2. By 2016 the area had declined to 2,6 km2 and it has retreated 2.6 kilometers since its Little Ice Age Maximum. The glacier was an imposing site to C.E. Rusk who recounted his early 20th century exploration (1924). Like all 47 glaciers observed by the North Cascade Glacier Climate Project it has retreated significantly since 1979. The glacier feeds the headwaters of the Suiattle River, which is also an important salmon stream, for chinook, coho, sockeye and pink salmon (WDFW,2018).

A 1960 photograph taken by Austin Post, USGS shows the glacier ending with no lake at its terminus. The terminus is gentle and has no crevasses, indicating it is relatively stagnant and poised to melt away. The glacier has retreated 1.3 km from its Little Ice Age moraines at this point. In 1967 another Austin Post image indicates a new small lake forming at the terminus.
honeycomb

In 1995 we mapped  the margin of the glacier ending in this lake, where the glacier ended in 1967 and took a photograph back to the glacier. As seen below retreat to this point was 400 m.

honeycomb 1995

A pair of images from Bill Arundell in 1973 and Lowell Skoog in 2006 indicate the scale of the retreat, these images do not show the actual terminus but do show the main nunatak-rock island and how much it has become exposed in the 33 years. This nunatak was hardly evident in 1960, and in a 1940 image of the glacier literally did not yet exist.honeycomb-glacier-1977-2006

The terminus had retreated 400 m from the 1967 position to 1995. In 1987 a new lake began to form at the terminus of the glacier at 1680 m. The glacier is shown ending in this lake in 2002 from both the far end of the lake and the nunatak above the lake, the glacier had retreated 210 m since 1995. In 2006 the glacier retreated from the end of this lake. This is a shallow lake that may eventually be filled in by glacier sediments. The terminus is flat and stagnant ending at 1680 m in the lake. Thus, the rapid retreat will continue, the glacier is still not close to acheiving a post LIA equilibrium. Glacier retreat from 1940-1967 averaged 9 m/year. Retreat was minor between 1967 and 1979. The retreat rate from 1979-1998 was greater at 16 m/year, with a total retreat of 300 m. The retreat than increased from 1998-2016 with the west branch retreating 800 m and the east branch 500 m. The nunatak in the middle of the glacier, which was beneath the ice in 1940 was 90 m above the ice in 2002 when we mapped it.  By 2009 it was no longer a nunatak as the glacier did not merge downstream of the this bedrock knob.

The retreat of this section of the glacier results in a reduced melt area of ~1 km2 in the last 40 years.  This in turn reduces summer glacier runoff as there is no longer snow/ice melting each day under the warm summer conditions. Flow in the Suiattle River in late summer and early fall has declined as a result. In 2002 during mapping of the glacier images from above and below the nunatak indicate the stagnant nature of the ice below the nunatak.

honeycomb new lakehoneycomb2002a


Ablation Variation with time Across Variable Glacier Surface

Bands of clean and dirty ice on Sholes Glacier

This post was prompted by comments from Ruth Mottram about funding for ablation process studies and the work by Fausto et al (2016) that noted non-radiative forces dominated the energy fluxes for ablation on the Greenland Ice Sheet during a period of  high ablation in July 2012.  This reminded me of a study we conducted some 25 years ago on the variation of ablation through time across a variable glacier surface.  The surface had both rough and smooth sections, debris covered and clean ice, plus stream channels.

We drilled four stakes into the glacier and ran a wire between each stake pair, then measured the distance from this wire to the surface at a 1 m interval over the span of one one month of the ablation season.  The study was  designed to examine a question developed in a conversation with Henrik Thomsen at an International Glaciological Society conference in 1988.  The question focused on his ablation studies on the Greenland Ice Sheet in the 1980’s.  I had been on Jakobshavn Glacier previously, but had not done any ablation work as the focus was on glacier velocity (Pelto et al 1990).  We both had observed variable surface melts rates across adjacent small areas, but such a differential ablation could not be sustained for long, without increasing the surface relief and in turn altering ablation.  How then did ablation rate vary spatially and temporally across the rough surface ?

The conversation focused on the example of an average area of the ablation zone of the GIS where the surface has varied albedo as well as surface roughness across small regions.  Take an area the size of a tennis court for example that has 0-1 meter variations in ice surface level, what is the spatial and temporal variation of ablation.  If we start with a relatively flat surface the areas of low albedo will have a higher ablation rate and develop into depressions. If we have a 1 m wide band of lower albedo ice that ablates faster, how deep can the depression be before other processes slow the ablation of this new depression.  The topographic high now experiences greater solar radiation and sensible radiation.  If we have relatively clean ice, the surface high points experience greater wind and solar radiation ablation, but the lows can have greater water saturation, which can enhance melt, or reduce it if the surface refreezes.

The measurements of ablation variation conducted did lead to a publication focussed on the debris cover change impact (Pelto, 2000).  The changes simply due to surface roughness did not.  Why you ask?  What was observed in several cases of ridges that were on the order of 1-2 m wide and 30-70 m high in an environment lacking surface streams, was the ridges shifted in both relief and location with time.  This illustrated that small bands/areas of high ablation were not sustainable, as they become depressions.  The surrounding surface prominence’s become the focus of increased ablation, hence the surface tries to return to a somewhat level form.  Overall ablation rate had a limited variation across the tennis court size area, with the mean ablation for the month of 1.4 m, and a standard deviation of 0.23 m.  The areas of the glacier the dirty parts of the glacierThe question I emerged with was does this homogenizing of the ablation rate increase the mean as faster ablation rate areas raise overall ablation or lower the ablation rate as lower ablation rate areas are a limiting factor?  The observations of extreme melt in the North Cascades in 2015 left me thinking the former (Pelto, 2018).


How Unusual Was 2015 in the 1984–2015 Period of the North Cascade Glacier Annual Mass Balance?

Sholes Glacier during the first week of August 2015 versus and average year such as in 2017.  Note stream gage and weather station at this site. The greater extent of bare ice enhances ablation as for a given temperature there is a higher ablation rate for ice then snow. Columbia Glacier a WGMS reference glacier viewed from above the glacier at Monte Cristo Pass at the start of August in 2015 and 2016.  Note the lack of retained snow in 2015 and the multiple firn layers exposed. 

This post is a shortened version of the publication out this week in Water.

In 1983, the North Cascade Glacier Climate Project (NCGCP) began the annual monitoring of the mass balance on 10 glaciers throughout the Washington mountain range, in order to identify their response to climate change. Annual mass balance (Ba) measurements have continued on seven original glaciers, with an additional two glaciers being added in 1990. The measurements were discontinued on two glaciers that  disappeared and one was that separated into several sections. This comparatively long record from nine glaciers in one region, using the same methods, offers some useful comparative data in order to place the impact of the regional climate warmth of 2015 in perspective.  This led to the most negative annual balance of the last 26 years on every glacier.

2015 Climate

The 2015 winter accumulation season featured 51% of the mean (1984–2014) winter snow accumulation at six long-term USDA SNOTEL stations in the North Cascades, namely, Fish Creek, Lyman Lake, Park Creek, Rainy Pass, Stevens Pass, and Stampede Pass. This was exceptional as it was the second lowest out of the 32 years of the mass balance observation series. The winter season was exceptional for warmth, being the warmest winter season on record in the state of Washington. The freezing level in 2015 averaged 1645 m in the Mount Baker region from November–March, compared with an average of 1077 m (John Abatzoglou, Freezing Level Tracker). The previous record for the mean November–March freezing level, since the record began in 1948, was 1500 m.

Freezing Level November-March on Mount Baker, WA from Freezing Level Tracker 1948-2017.

In 2015, the mean May–September temperature at Diablo Dam was 2.2 °C warmer than the long term mean, and it was the second warmest to 1958 in the 1950–2015 record. For June–September, the mean temperature was 2.0 °C warmer than the long term mean, and was also second to 1958 as the warmest. The combination of the warmest melt season in over 50 years and the second lowest accumulation season snowpack in the last 30 years was a good indication that the glacier mass balance would be quite negative.
In 2015, the sea surface temperature waters that had developed in the winter of 2013/14, persisted off the coast of the Pacific Northwest, with anomalies generally exceeding 2 °C (Di Lorenzo and Mantua, 2016)

Glacier Mass Balance 2015

The mean annual balance of the NCGCP glaciers is reported to the World Glacier Monitoring Service (WGMS), with two glaciers, Columbia and Rainbow Glacier, being reference glaciers.  The mean Ba of the NCGCP glaciers from 1984 to 2015, was −0.54 m w.e.a−1 (water equivalent per year), ranging from −0.44 to −0.67 m w.e.a−1 for individual glaciers. In 2015, the mean Ba of nine North Cascade glaciers was −3.10 m w.e., the most negative result in the 32-year record. The correlation coefficient of Ba was above 0.80 between all North Cascade glaciers, indicating that the response was regional and not controlled by local factors. In 2015, out of the nine glaciers where the Ba was examined, the AAR was 0.00 on seven of the glaciers, 0.05 on the Rainbow Glacier, and 0.26 on the Easton Glacier. For each glacier, the 2015 Ba was the most negative of any year in their entire record. The South Cascade Glacier had a negative mass balance of −2.72 m w.e. in 2015, which was the most negative Ba reported since the suite of continuous mass balance measurements began in 1959 [USGS, 2017].  The probability of achieving the observed 2015 Ba of −3.10 is 0.34%.

 
Annual mass balance of North Cascade glaciers, note the similar annual response indicating regional climate conditions are the overriding driver of mass balance. 

On June 15, when the automatic weather station and discharge station were installed adjacent to the Sholes Glacier, the snowpack was similar to a typical early August snow cover. On the Sholes Glacier, the AAR fell from 0.55 on 9 July to 0.00 on 9 September. This was the first year since the monitoring had begun in 1984 that the mean AAR in early August was below 0.25. The result was an exposure of the older firn layers and a general decrease in albedo. In early August, the AAR was below 0.1 for all of the glaciers, except for the Easton Glacier. On the Columbia Glacier, the AAR on August 1 was the lowest observed yet at 0.12, with six weeks remaining in the melt season. The early exposure of glacier ice was important as the melt rate was faster, as was indicated by the greater melt factor.  The North Cascade mass balance cumulatively over the last 30 years matches closely the global mean mass balance loss.

Map of North Cascade glaciers observed in this study. 

Comparison of North Cascade cumulative and Global cumulative glacier mass balance


North Cascade Winter Snowpack Status 2018

2018 Winter Freezing levels at Mount Baker (November 2017-March 2018). 

The accumulation season on most Northern Hemisphere glaciers extends through April. The key benchmark for snowpack water assessment in alpine ranges is typically April 1, as that is the average maximum snowpack for an alpine range.  In 2018 the North Cascade Range had freezing levels above the long term mean, but at the 21st century mean.

A result of higher freezing levels is more rain on snow events and winter melt events.  This reduces the retained April 1 snowpack, which is measured as snow water equivalent (SWE).  An examination of the trends in April 1 SWE at the six long term North Cascade stations, winter precipitation at the most reliable North Cascade weather stations, and the ratio between the two indicates a similar decline in snowpack and snowpack/winter precipitation ratio, while winter precipitation has increased.   The  ratio between SWE and precipitation, snowpack storage efficiency-on right axis, has been in decline,  as noted by Mote et al (2008) and Pelto (2008).  This ratio change has driven most of the SWE.

For 2018 precipitation is 2.7 m with, 1.1 m of that retained on average as April 1 SWE.  The April 1 SWE is similar to the 2016 and 2017 values.  

At the sites closest to the glaciers with snowpack measurements the April 1 snow depth is 4.21 m at Lyman lake and 4.24 m at Mount Baker ski area.  At Stevens Pass there is a snow depth of 3.53 m, which is approximately the average, webcam image below is from 4/6/2018. As winter wraps up, snowpack is relatively normal despite a winter of wide temperature fluctuations, Feb freezing levels 400 m below the mean and December 500 m above the mean. The glaciers still have 3-6 weeks for accumulation to build up, while melt get underway lower on the mountains.  We will be in the field again in 2018 to examine snow depths and melt across the North Cascade glaciers.

A view up toward the icefall on Easton Glacier at 2000 m.

Stevens Pass ski area from Webcam 4/6/2018

Monte Cristo Range waiting for spring to begin

Mount Baker coated with March 2018 snowpack.


Easton Glacier, Mount Baker, WA Annual Retreat & Mass Loss 1990-2017

Mass balance, terminus and supra glacial stream assessment are illustrated in the video, Filmed by Mauri Pelto, Jill Pelto, Melanie Gajewski, with music from Scott Powers.

This is the story of  the annual monitoring of Easton Glacier, Washington.  We have been monitoring Easton Glacier on Mount Baker, a stratovolcano in the North Cascade Range, Washington since 1990.  Each year we survey the terminus position, measure its mass balance, assess crevasse depths and map surface elevation on a transect across the glacier.  In 1990 Easton Glacier was in contact with an advance moraine built from the late 1950’s- 1980’s.  The advance moraine is noted in the 2015  Washington DNR Lidar  image of the terminus area by black arrows. The green arrows indicate the recessional moraine from the winter of 2015. Red arrows indicate the Little Ice Age lateral moraines Railroad Grade (RG) to the west and Metcalfe Moraine (MM) to the east. From 1990-2017 the glacier has retreated 370 m, including 65 m in the last three years. The second Lidar image indicates the transect where the surface elevation is mapped, red line.  This is close to 2000 m in elevation, and in a good snow year retains snowpack and in most recent years has lost its snowpack (note paired image below). In 2015 the worst year, the snowpack had been lost by the end of July. Note the comparison of the 2017 transect snowpack and 2015 lack of snowpack.

Washington DNR Lidar image of Easton Glacier , black arrows indicate 1980’s advance moraine, green arrows 2015 winter moraine and red arrows the Little Ice Age lateral moraines. Blue dots indicate the glacier margin.


Washington DNR Lidar image of Easton Glacier. Blue dots indicate the glacier margin.  Red line the cross glacier profile.

A view along the cross glacier profile at 2000 m in early August of 2015, snowpack gone already and in 2017 with 2 m of snowpack remaining. 

More than 5000 measurements of snow depth and melt have been completed illustrating the glacier has lost 16.6 m of water equivalent thickness, over 18 m of thickness from 1990-2016.  For a glacier that averaged 70 m in thickness in 1990 this is ~25% of the volume of the glacier gone.  The glacier has not maintained sufficient snow cover at the end of the summer to have a positive mass balance, this is the accumulation area ratio.  The mass balance and terminus data is reported annually to the World Glacier Monitoring Service.  The area lost in the terminus region due to the retreat has been 0.22 km2.

The glacier has also slowed its movement as it has thinned, evidenced by a reduction in number of crevasses. In the lowest icefall Jill Pelto has surveyed the crevasse depths finding a mean depth 20 m and a maximum depth of 32 m. This glacier supplies runoff to Baker Lake and its associated hydropower projects.  Our annual measurements here and on Rainbow Glacier and Lower Curtis Glacier in the same watershed provide a direct assessment of the contribution of glaciers to Baker Lake.  The glacier is also adjacent to Deming Glacier, which supplies water to Bellingham, WA. The Deming is too difficult to access, and we use the Easton Glacier to understand timing and magnitude of glacier runoff from Deming Glacier.  Deming Glacier has retreated a greater distance during this period, 705 m, but has lost a similar area.

Annual terminus survey in 2015 terminus exposed to melting by early July.  In 2017 terminus being exposed first week in August. Taken from same location.

Crevasses measurement in lower icefall and on the cross profile.  In both cases crevasse depth is measured, on the profile 2017 winter snow depth remaining measured. 

Easton Terminus viewed from our benchmark location just beyond 1980’s margin. Tree in foreground is over 50 years old.


Lower Curtis Glacier Annual Terminus Response to Climate Change

Side view of Lower Curtis Glacier in 2013, 2015 and 2017, illustrating the reduced slope and height of glacier front in just four years.

Terminus observations have been reported to the WGMS from 2500 glaciers with 46,500 specific observations since the late 19th century, which you can explore with the glacier viewer application. Here we examine what it looks like to report from a glacier each year.  I have visited this glacier 34 consecutive years, each time camping in a tent near the glacier, a fun spot indeed when the weather cooperates. The Lower Curtis Glacier is an avalanche fed cirque glacier on Mount Shuksan in the North Cascades of Washington. It is a south facing and low elevation glacier for the range. This is an unusual combination that is supported by the heavy accumulation via avalanching from the upper slopes of Mount Shuksan. The glacier displays a magnificent set of annual layers in its terminus tongue. The terminus tongue is a spectacular wall of seracs that quickly rises 55 m above the bedrock. There are typically 50 layers visible indicating that this most of the ice in the glacier is 50 years of less in age.

Lower Curtis Glacier Front in 2007 and 2017 taken from same location.  Both retreat and thinning of the front in the decade is evident. 

From 1908 to 1950 the glacier retreated from the valley bottom into the cirque. The glacier advanced from 1950-1985 down slope and has retreated since.  Each year we survey the terminus location, measure the mass balance and survey the glacier surface elevation on a cross profile. Here we report on the annual terminus survey from 2007-2017.  The frontal change reported to the World Glacier Monitoring Service has been 2007=-13 m, 2008=-17 m, 2009=-20 m, 2010=-7 m, 2011=-5 m, 2012=-6 m, 2013=-5 m, 2014=-12 m, 2015=16 m, 2016=-16 m and 2017=12 m. This is a total of 129 m of retreat in 11 years, nearly 12 m per year. A longitudinal profile up the middle of the glacier indicates that it thinned 30 meters from 1908-1984 and 22 m from 1985-2016. Because of its heavy accumulation via avalanching the glacier moves rapidly and is quite crevassed at the terminus with large high seracs at the glacier front. In 2007 the height of the terminus seracs was 45 m, by 2014 the seracs were 37 m high and in 2017 had shrunk to 26 m high and not as steep.  The imposing tongue has certainly diminished. The glacier retreat fits the pattern in the region, with all Mount Baker a glaciers retreating (Pelto, 2015).

34th Annual, 2017 North Cascade Glacier Climate Project Field Season

2017 Field Season Video

For the thirty fourth consecutive summer we headed into the field to monitor the continued response of North Cascade glaciers to climate change.  In 1984 when I began this program we selected 10 key glaciers to monitor.  Two of these have now disappeared.  All the glaciers have retreated extensively and lost considerable volume.  The mass balance loss is 19 m of water equivalent thickness, which is over 20 m of ice thickness loss on glaciers that averaged less than 75 m thick. This is significant with 25-30% of their entire volume lost. This project continues to monitor glacier loss and the runoff they provide.  We also complete an annual inventory of ice worms on Sholes Glacier and mountain goats on Ptarmigan Ridge region.  In 2017 our key project was a continue partnership with the Nooksack Indian Tribe monitoring glacier melt and runoff in the North Fork Nooksack River basin.  We have not yet had the chance to determine the daily glacier discharge and the resultant contribution to the North Fork Nooksack River. The dry conditions of August certainly will lead to many days with  more than 40% of the flow coming from glacier melt as was the case in 2015. 

The snowpack on April 1st snowpack was 110% of normal, by June 1st, the snowpack was trending down steeply, but
remained well above the last four years and similar to 2012. Summer turned out to be the driest on record in Seattle and

June 1 snowpack comparison

tied for the warmest for the June 21-Sept. 22nd period (KOMONews).  In the mountains the overall melt season temperatures for May 1 through Sept. 30th was 0.15 C cooler than 2015 values, due to a cooler spring.  The most striking feature of the field season was the forest fire smoke largely from British Columbia that obscured views most days. 

Of the glaciers observed one had a significant positive balance, one a slight positive balance-essentially equilibrium and seven had negative mass balances.  The two glaciers with the most positive balance were the Sholes and Rainbow Glacier, adjacent glacier on the north side of Mount Baker.  The nearby Mount Baker ski area reported 860 inches of snow in 2017, significantly above average.  Compared to other locations in the range this winter snowfall was a positive anomaly, that also was observed on the nearby glaciers. The snow water equivalent in multiple crevasses on Rainbow Glacier at 2000 m in early August was 3.8-4.1 m.  On both Easton and Rainbow Glacier the mass balance gradient was steeper than usual.  On Rainbow Glacier the mass balance was -3 m at 1500 m, 0 at 1700 m and +2.5 m at 200 m as summer ended. We also observed terminus retreat on every glacier.   Retreat averaged 12 m in 2017, lower than in 2015 or 2016.  More striking than retreat in some cases is thinning that reduces slope and frontal thickness.  On Lower Curtis Glacier the terminus seracs are 15 m shorter than two years ago.  On Columbia Glacier the lowest 200 m of the glacier has a slope that has declined by 5 degrees in the last three years and the glacier terminus has retreated 60 m in two years. 


Observing Glacier Runoff Changes Under the Same Weather Conditions


View of Sholes Glacier on August 8th in 2015 left and 2017 right.  Note difference in ratio of snow surface to ice surface exposed. 

Sholes Glacier is at the headwaters of Wells Creek in North Fork Nooksack River watershed in Washington.  We have been measuring the mass balance of this glacier annually since 1990 and runoff in detail since 2012 (Pelto, 2015).  Glacier runoff in this watershed during late summer frequently provides more than a third of all runoff for the watershed, this occurred on 37 days in 2015 and 19 days in 2016.  This water is critical for local hydropower, irrigation and fall salmon runs. We measure glacier runoff all summer long directly at a stream gage 150 m from the glacier.  We also measure ablation directly on the glacier.  The amount of runoff is dependent on the area exposed for melting, glacier area in this case, the melt rate which is largely determined by temperature and the surface type, snow and ice having different melt rates.

A typically reliable method to calculate glacier runoff is a degree day model.  This model is based solely on daily observed temperature and the glacier surface type. The degree day melt rate factor for snow and for ice are different.  Based on 27 years of ablation measurements on the glacier the melt factors for snow is 0.0045 m w.e. d-1C-1 and for ice 0.0060 m w.e. d-1C-1  which falls within the range of temperate glacier observations (Hock, 2003).  If you multiply this result by the area of the glacier the glacier runoff is determined. 


For a specific day the determination of runoff looks like:

Glacier Runoff=( 14 C * 0.0045 m w.e. d-1C-1)(550,000 m2) + (14C*0.0060 m w.e. d-1C-1)(100,000m2)

This equals 43,000 m3 for the day or 0.5 m3/second from Sholes Glacier.  In fact our measurement of discharge on this day was 41,330 m3 and the observed melt rate was within 5% of the calculated amount.  In August the average streamflow in the North Fork Nooksack at the USGS gage is 22 m3/second.  We have observed that ablation rates on Sholes Glacier are consistent with those on other glaciers in the watershed.  For the watershed as a whole the glacier runoff on this particular day would be 9.4 m3/second or ~40% of mean daily August runoff provided by glacier melt. 

It has been interesting in the case of the Sholes Glacier to observe how different the runoff rate/volume is for the same weather conditions depending solely on changes in snow and ice cover area.  Note in the images above from 2015 and 2016 the change in the percent of the glacier that is snowcovered.  Also note the difference below from 2014 and 2017.  Given the same weather conditions the melt rate formula suggest that ice covered areas will yield 33% more runoff.  This in fact has been the case with observed runoff on a 14 C day in 2015 yielding 30% more runoff than on the a 14 C day in 2017.  The difference is no ice exposed in 2017 and 85% of the glacier area being bare ice on the observed day in 2015.  The change during a melt season as indicated by snowcover change in 2016 from August 16th to Sept. 8th, illustrates the importance of understanding the changing distribution of snow and ice on the glacier on a weekly basis for determining glacier runoff. 

On 8/8/2014 the glacier was 85% snowcovered

On 8/8/2015 the glacier was 15% snowcovered

On 8/8/2016 the glacier was 97% snowcovered

On 8/8/2017 the glacier was 100% snowcovered

View of Sholes Glacier on August 8th in 2014 left and 2016 right.  Note difference in ratio of snow surface to ice surface exposed. 

Jill Pelto and Andrew Hollyday measuring flow below Sholes Glacier.

Pete Durr Probing snowpack on Sholes Glacier

Sholes Glacier August, 16 2016
Sholes Glacier Sept., 8 2016

34th Annual Field Program NORTH CASCADE GLACIER CLIMATE PROJECT 2017


2016 Field Season Video

NORTH CASCADE GLACIER CLIMATE PROJECT 2017

For the thirty fourth consecutive summer it is time to head into the field to monitor the continued response of North Cascade glaciers to climate change.  In 1984 when I began this program we selected 10 key glaciers to monitor.  Two of these have now disappeared.  All the glaciers have retreated extensively and lost considerable volume.  The mass balance loss is 19 m of water equivalent thickness, which is over 20 m of ice thickness loss on glaciers that averaged less than 75 m thick. This is significant with 25-30% of their entire volume lost. This project looks at the implications of the glacier loss as we complete an annual inventory of ice worms on Sholes Glacier, mountain goats on Ptarmigan Ridge region and monitor runoff all summer below Sholes Glacier with the Nooksack Indian tribe. 

Illustration of research (Megan Pelto and Jill Pelto)

The result of volume loss and area loss is that despite higher melt rates, the reduction in area of melting glaciers has led to a decline in glacier runoff in the region. The reduced runoff effects salmon, hydropower and irrigation. Details of the runoff impacts are detailed in a Book “Climate Driven Retreat of Mount Baker Glaciers and Glacier Runoff and summarized in Salmon Challenges from the Glaciers to the Salish Sea.

The focus will be on mass balance observations, longitudinal profiles and terminus observations. For Mount Baker, Washington the winter freezing level was much lower than the previous two winters, and was 100 m below the long term mean. The snowpack on April 1st snowpack was 110% of normal, by June 10th, the snowpack is trending down steeply, but remained just above average.  Since then a persistent dry period and the impending heat wave that begins today, Aug. 1 has led to rapid snow loss.  The most recent  comparable year is 2009, which featured a good winter snowpack and very warm mid to late summer conditions. We will first travel north to Mount Baker and the Easton Glacier.    Of the 40 glacier in the World Glacier Monitoring Service Reference glacier list we have two Columbia and Rainbow, as soon as Easton Glacier has 30 years, the minimum requirement it will be added, that is in 2019. The field team consists of Mauri Pelto, 34th year, Jill Pelto, UMaine for the 9th year, Anthony Himmelberger, Clark University 1st year.  Tom Hammond, 14th year will join us for a selected period as will Pete Durr, Mt. Baker Ski Area, 2nd year.   We will report on our findings in a month. Field photos will be posted periodically on Twitter.

Measuring terminus change and snowpack thickness in 2016

Aug.   2:  Hike into Easton Glacier
Aug.   3:  Easton Glacier
Aug.   4:  Easton Glacier
Aug.   5:  Hike Out Easton Glacier, Hike in Ptarmigan Ridge
Aug.   6:  Sholes Glacier
Aug.   7:  Rainbow Glacier
Aug.   8:  Sholes Glacier
Aug.   9:  Hike out and into Lower Curtis Glacier
Aug. 10:  Lower Curtis Glacier
Aug. 11: Hike out Lower Curtis Glacier- Hike in Blanca Lake
Aug. 12:  Columbia Glacier
Aug. 13:  Columbia Glacier
Aug. 14:  Hike out Columbia Glacier; Hike in Mount Daniels
Aug. 15:  Ice Worm Glacier
Aug. 16:  Daniels and Lynch Glacier
Aug. 17:  Ice Worm Glacier, Hike out Mount Daniels-Hike out-

Looking Inside a Glacier

Here we provide a visual look inside a glacier in the North Cascades of Washington.  Glaciers are not all the same, but the key internal ingredients in summer typically are in varied ratios: ice, meltwater, sediment and biologic material.  In this case there are torrents of water pouring through the interior of the glacier, generated at the surface the day we are filming.  We do measure the discharge and velocity of these streams.  Once they drain englacially they are much slower as there are numerous plunge pools.  There are also plenty of water filled crevasses. Some of the streams have considerable sediment in them, usually large clasts given the high velocity and low bed friction.  In this case there are also a great many ice worms clinging to the walls of a water filled crevasse, and the walls of the stream channels.  All of this water than merges by the terminus into an outlet stream.  This again we measure.  On the glacier we are measuring melt and at the end of the glacier runoff provides an independent measure of this melt as well. The water then heads downstream supplying many types of fish enroute to the ocean.

The last three years have led to considerable mass loss of glaciers in the area.  This means less snowcover at the surface, which leaves less room for the ice worms to live and forces them into the meltwater regions.  This also leads to more supraglacial stream channels, which develop and deepen.  In many cases the streams deepen to the point that they become englacial. The increased ice area also should stress glacier ice worms as they live on algae, which resides largely in snow, which is less extensive and persistent in recent summers.

Thirty-third Annual North Cascade Glacier Climate Project Field Season Underway

fig8-1
Base Map of the region showing main study glaciers, produced by Ben Pelto.

From President Reagan to President Obama each August since 1984 I have headed to the North Cascade Range of Washington to measure the response of glaciers to climate change.  Specifically we will measure the mass balance of nine glaciers, runoff from three glaciers and map the terminus change on 12 glaciers. The data is reported to the World Glacier Monitoring Service.  Three glaciers that we have monitored annually have disappeared since 1984.

In 2016 for Mount Baker, Washington the freezing level from January-April was not as high as the record from 2015, but still was 400 m above the long term mean. The snowpack on June 1st was three weeks behind last year’s record melt, but still three to four weeks of head of normal. July has been exceptionally cool reducing this gap. With all the snow measurement stations losing snowcover by July 1, the gap is uncertain until we arrive on the glaciers. This will not be a good year, but will be a significant improvement over last year, likely more in the 2012 or 2013 category.  Each location is accessed by backpacking in and camping in tents.

We will first travel north to Mount Baker and the Easton Glacier, we will be joined by Oliver Lazenby, Point Roberts Press.  We will then circle to the north side where I expect we will be joined by Jezra Beaulieu and Oliver Grah, Nooksack Indian Tribe.  Jen Lennon from the Sauk-Suiattle Tribe and Pete Durr, Mount Baker Ski Patrol are also planning to join us here.   When we head into Columbia Glacier Taryn Black from U of Washington will join us. The field team consists of Mauri Pelto, 33rd year, Jill Pelto, UMaine for the 8th year, Megan Pelto, 2nd year, and Andrew Hollyday, Middlebury College.  Tom Hammond, 13th year will join us for a selected period.

[ngg_images source=”galleries” container_ids=”38″ display_type=”photocrati-nextgen_basic_imagebrowser” ajax_pagination=”1″ template=”/nas/wp/www/sites/blogsorg/wp-content/plugins/nextgen-gallery/products/photocrati_nextgen/modules/ngglegacy/view/imagebrowser-caption.php” order_by=”sortorder” order_direction=”ASC” returns=”included” maximum_entity_count=”500″]

Aug.   1:  Hike into Easton Glacier.
Aug.   2:  Easton Glacier
Aug.   3:  Easton Glacier
Aug.   4:  Hike Out Easton Glacier, Hike in Ptarmigan Ridge
Aug.   5:  Sholes Glacier
Aug.   6:  Rainbow Glacier
Aug.   7:  Sholes Glacier and/or Rainbow Glacier
Aug.   8:  Hike out and into Lower Curtis Glacier
Aug.   9:  Lower Curtis Glacier
Aug. 10: Hike out Lower Curtis Glacier- Hike in Blanca Lake Mail Pickup Maple Falls, WA 98266
Aug. 11:  Hike in Columbia Glacier
Aug. 12:  Columbia Glacier
Aug. 13:  Hike out Columbia Glacier; Hike in Mount Daniels
Aug. 14:  Daniels and Lynch Glacier
Aug. 15:  Ice Worm Glacier
Aug. 16:  Ice Worm Glacier, Hike out Mount Daniels-Hike out