Observing Glacier Runoff Changes Under the Same Weather Conditions


View of Sholes Glacier on August 8th in 2015 left and 2017 right.  Note difference in ratio of snow surface to ice surface exposed. 

Sholes Glacier is at the headwaters of Wells Creek in North Fork Nooksack River watershed in Washington.  We have been measuring the mass balance of this glacier annually since 1990 and runoff in detail since 2012 (Pelto, 2015).  Glacier runoff in this watershed during late summer frequently provides more than a third of all runoff for the watershed, this occurred on 37 days in 2015 and 19 days in 2016.  This water is critical for local hydropower, irrigation and fall salmon runs. We measure glacier runoff all summer long directly at a stream gage 150 m from the glacier.  We also measure ablation directly on the glacier.  The amount of runoff is dependent on the area exposed for melting, glacier area in this case, the melt rate which is largely determined by temperature and the surface type, snow and ice having different melt rates.

A typically reliable method to calculate glacier runoff is a degree day model.  This model is based solely on daily observed temperature and the glacier surface type. The degree day melt rate factor for snow and for ice are different.  Based on 27 years of ablation measurements on the glacier the melt factors for snow is 0.0045 m w.e. d-1C-1 and for ice 0.0060 m w.e. d-1C-1  which falls within the range of temperate glacier observations (Hock, 2003).  If you multiply this result by the area of the glacier the glacier runoff is determined. 


For a specific day the determination of runoff looks like:

Glacier Runoff=( 14 C * 0.0045 m w.e. d-1C-1)(550,000 m2) + (14C*0.0060 m w.e. d-1C-1)(100,000m2)

This equals 43,000 m3 for the day or 0.5 m3/second from Sholes Glacier.  In fact our measurement of discharge on this day was 41,330 m3 and the observed melt rate was within 5% of the calculated amount.  In August the average streamflow in the North Fork Nooksack at the USGS gage is 22 m3/second.  We have observed that ablation rates on Sholes Glacier are consistent with those on other glaciers in the watershed.  For the watershed as a whole the glacier runoff on this particular day would be 9.4 m3/second or ~40% of mean daily August runoff provided by glacier melt. 

It has been interesting in the case of the Sholes Glacier to observe how different the runoff rate/volume is for the same weather conditions depending solely on changes in snow and ice cover area.  Note in the images above from 2015 and 2016 the change in the percent of the glacier that is snowcovered.  Also note the difference below from 2014 and 2017.  Given the same weather conditions the melt rate formula suggest that ice covered areas will yield 33% more runoff.  This in fact has been the case with observed runoff on a 14 C day in 2015 yielding 30% more runoff than on the a 14 C day in 2017.  The difference is no ice exposed in 2017 and 85% of the glacier area being bare ice on the observed day in 2015.  The change during a melt season as indicated by snowcover change in 2016 from August 16th to Sept. 8th, illustrates the importance of understanding the changing distribution of snow and ice on the glacier on a weekly basis for determining glacier runoff. 

On 8/8/2014 the glacier was 85% snowcovered

On 8/8/2015 the glacier was 15% snowcovered

On 8/8/2016 the glacier was 97% snowcovered

On 8/8/2017 the glacier was 100% snowcovered

View of Sholes Glacier on August 8th in 2014 left and 2016 right.  Note difference in ratio of snow surface to ice surface exposed. 

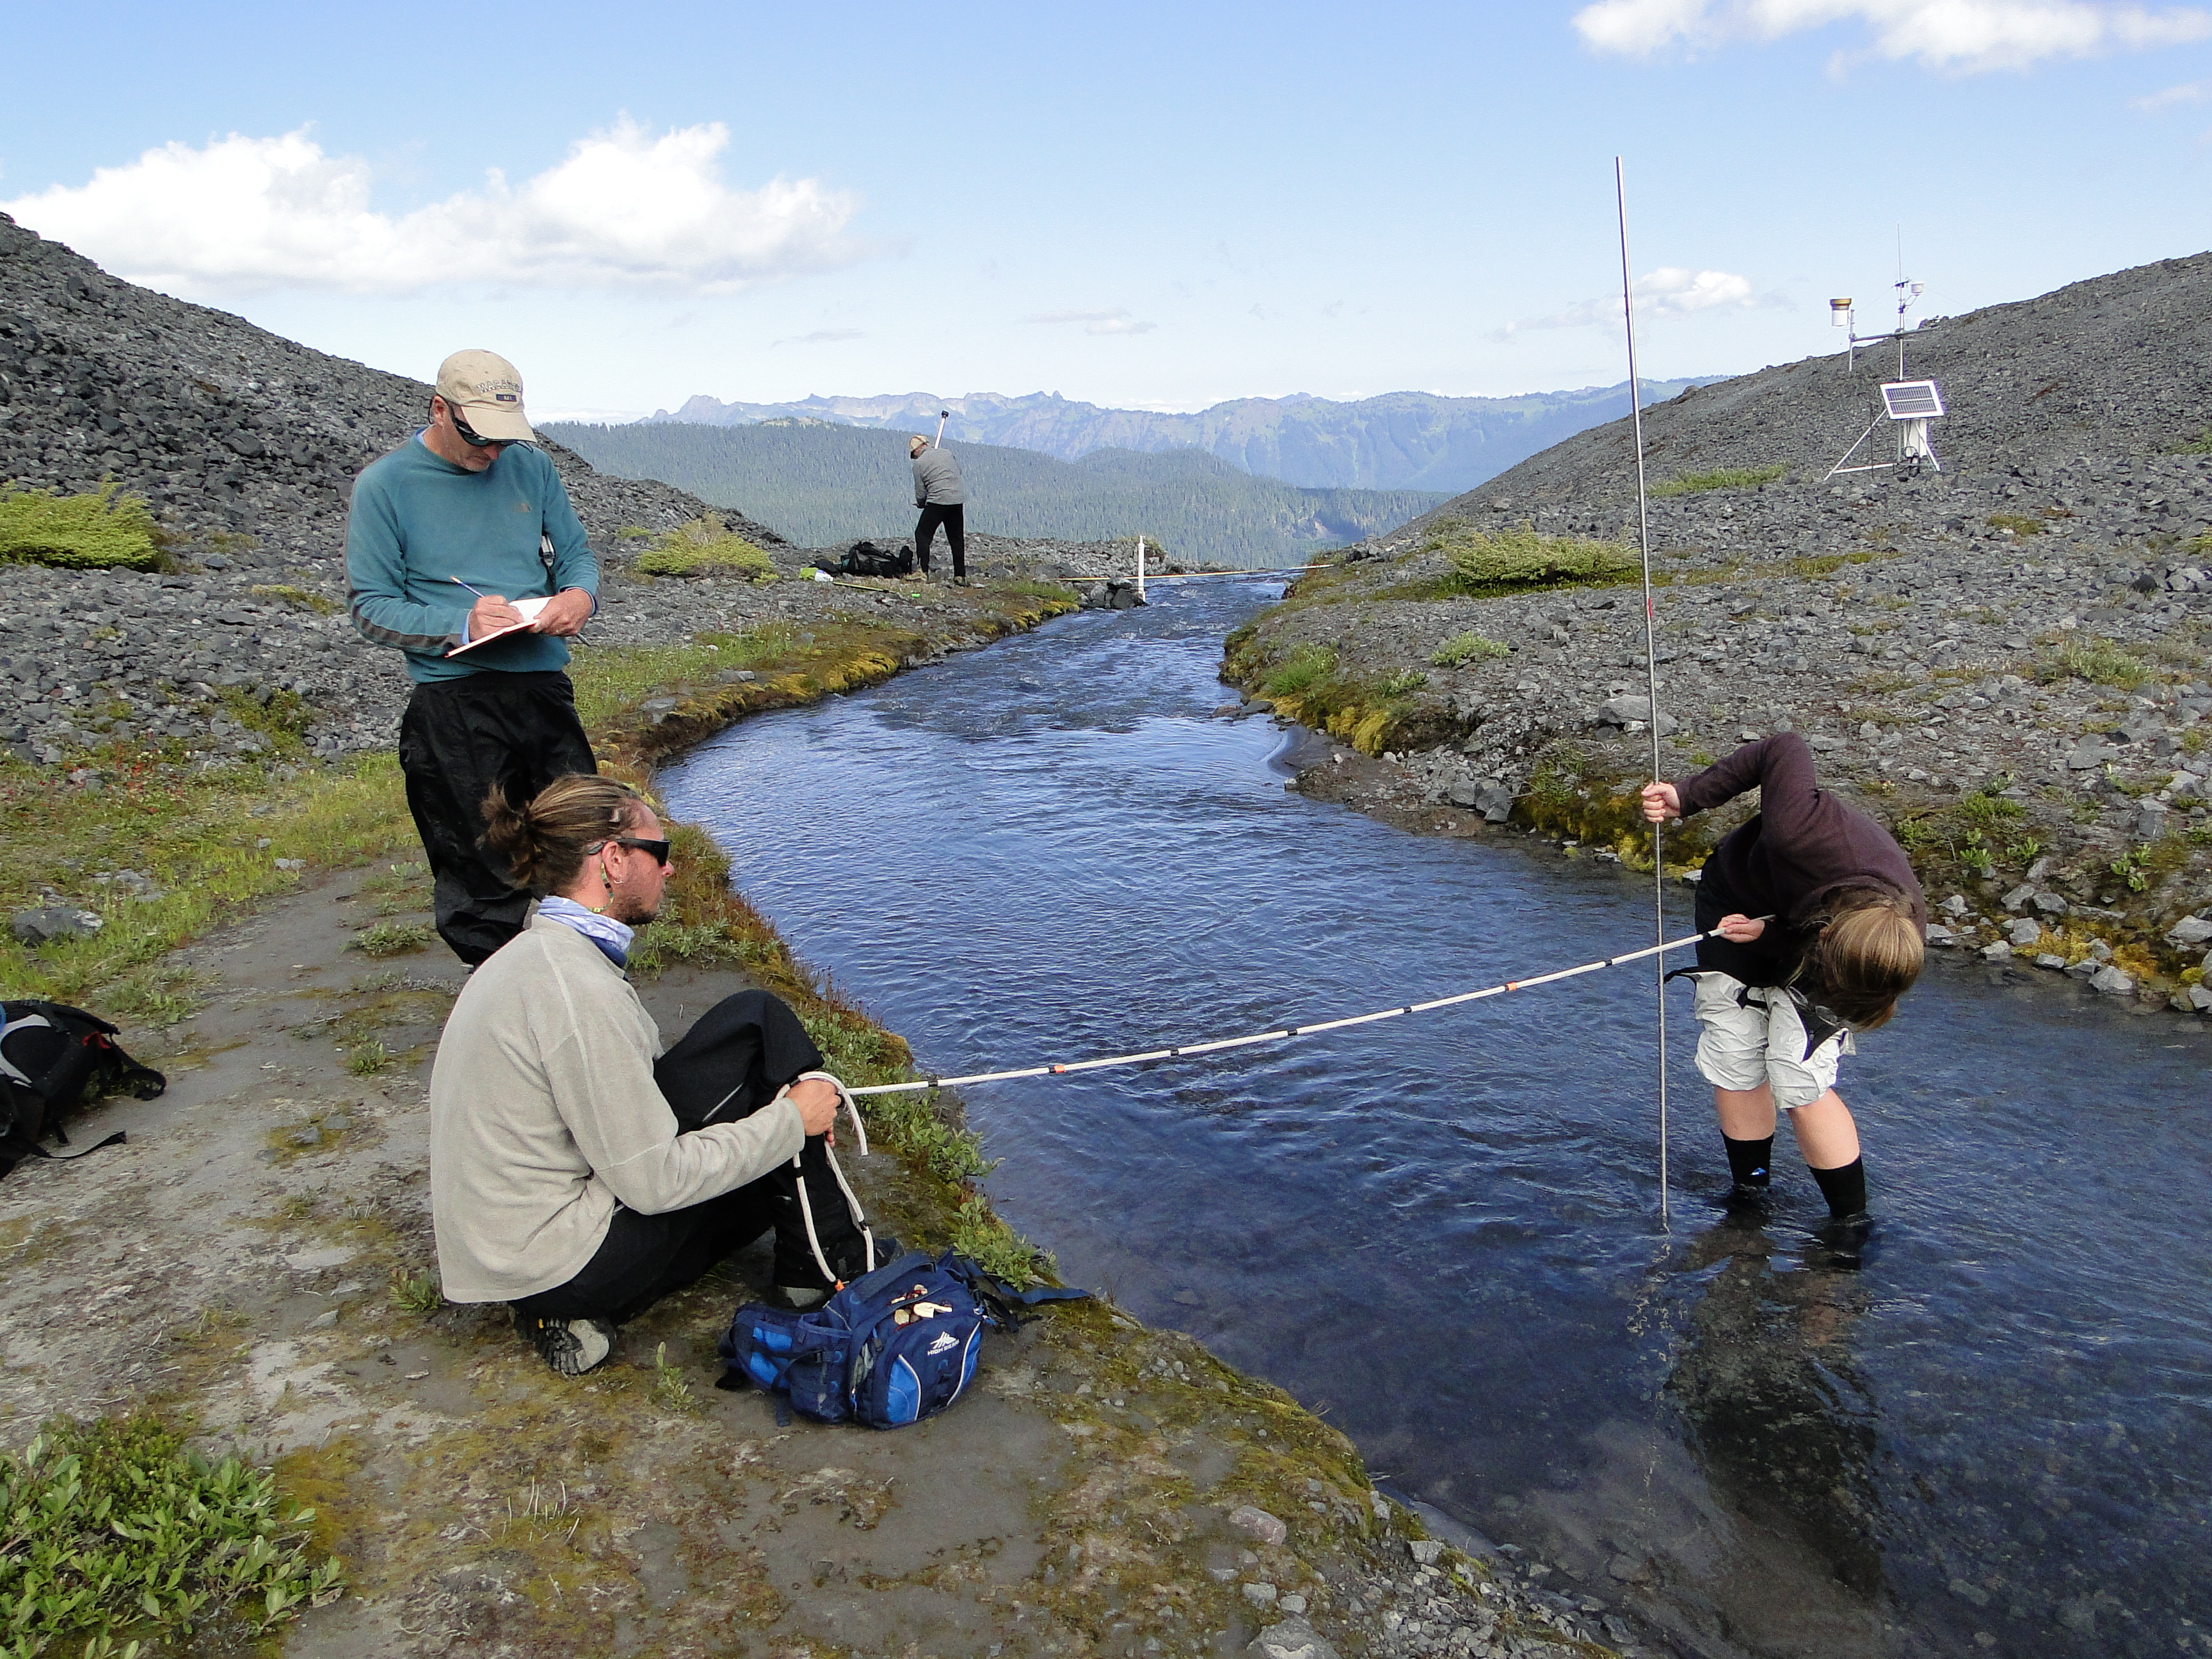
Jill Pelto and Andrew Hollyday measuring flow below Sholes Glacier.

Pete Durr Probing snowpack on Sholes Glacier

Sholes Glacier August, 16 2016
Sholes Glacier Sept., 8 2016

34th Annual Field Program NORTH CASCADE GLACIER CLIMATE PROJECT 2017


2016 Field Season Video

NORTH CASCADE GLACIER CLIMATE PROJECT 2017

For the thirty fourth consecutive summer it is time to head into the field to monitor the continued response of North Cascade glaciers to climate change.  In 1984 when I began this program we selected 10 key glaciers to monitor.  Two of these have now disappeared.  All the glaciers have retreated extensively and lost considerable volume.  The mass balance loss is 19 m of water equivalent thickness, which is over 20 m of ice thickness loss on glaciers that averaged less than 75 m thick. This is significant with 25-30% of their entire volume lost. This project looks at the implications of the glacier loss as we complete an annual inventory of ice worms on Sholes Glacier, mountain goats on Ptarmigan Ridge region and monitor runoff all summer below Sholes Glacier with the Nooksack Indian tribe. 

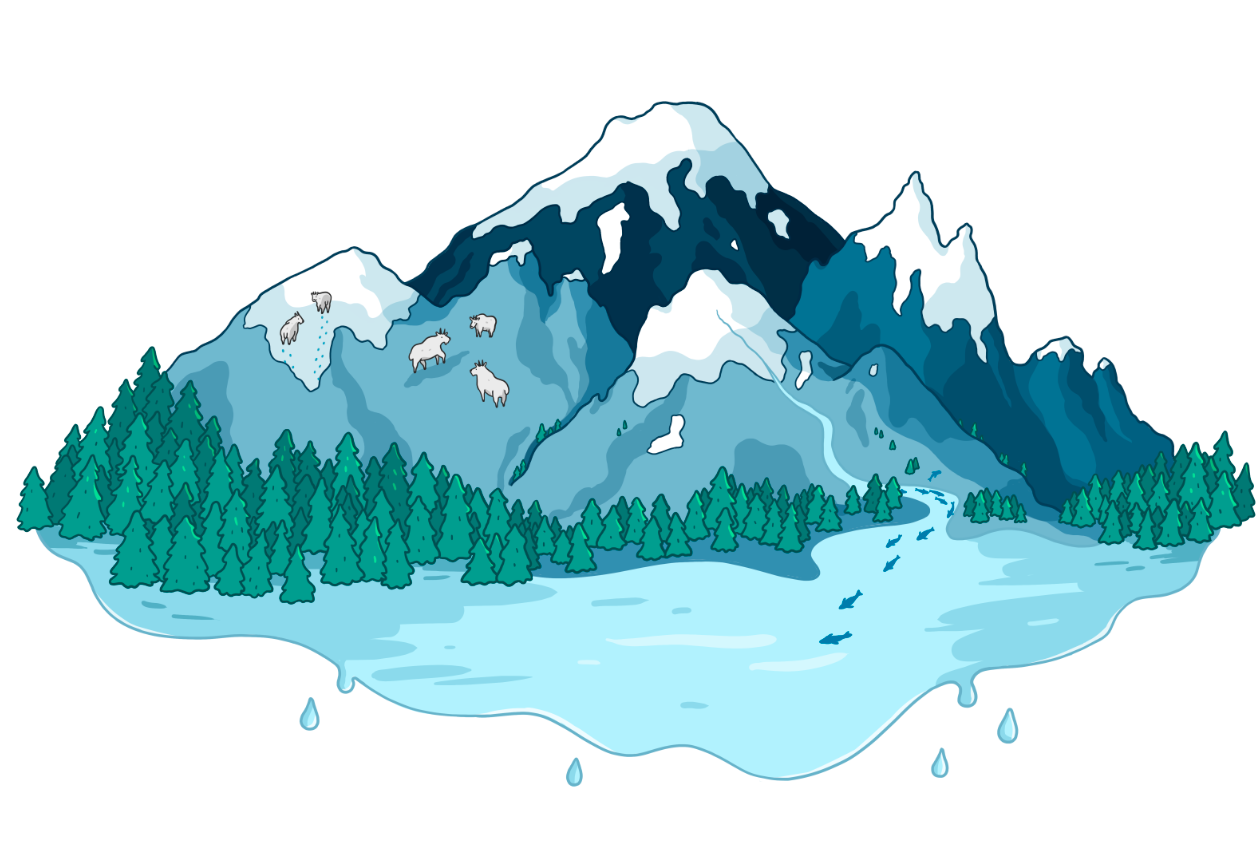
Illustration of research (Megan Pelto and Jill Pelto)

The result of volume loss and area loss is that despite higher melt rates, the reduction in area of melting glaciers has led to a decline in glacier runoff in the region. The reduced runoff effects salmon, hydropower and irrigation. Details of the runoff impacts are detailed in a Book “Climate Driven Retreat of Mount Baker Glaciers and Glacier Runoff and summarized in Salmon Challenges from the Glaciers to the Salish Sea.

The focus will be on mass balance observations, longitudinal profiles and terminus observations. For Mount Baker, Washington the winter freezing level was much lower than the previous two winters, and was 100 m below the long term mean. The snowpack on April 1st snowpack was 110% of normal, by June 10th, the snowpack is trending down steeply, but remained just above average.  Since then a persistent dry period and the impending heat wave that begins today, Aug. 1 has led to rapid snow loss.  The most recent  comparable year is 2009, which featured a good winter snowpack and very warm mid to late summer conditions. We will first travel north to Mount Baker and the Easton Glacier.    Of the 40 glacier in the World Glacier Monitoring Service Reference glacier list we have two Columbia and Rainbow, as soon as Easton Glacier has 30 years, the minimum requirement it will be added, that is in 2019. The field team consists of Mauri Pelto, 34th year, Jill Pelto, UMaine for the 9th year, Anthony Himmelberger, Clark University 1st year.  Tom Hammond, 14th year will join us for a selected period as will Pete Durr, Mt. Baker Ski Area, 2nd year.   We will report on our findings in a month. Field photos will be posted periodically on Twitter.

Measuring terminus change and snowpack thickness in 2016

Aug.   2:  Hike into Easton Glacier
Aug.   3:  Easton Glacier
Aug.   4:  Easton Glacier
Aug.   5:  Hike Out Easton Glacier, Hike in Ptarmigan Ridge
Aug.   6:  Sholes Glacier
Aug.   7:  Rainbow Glacier
Aug.   8:  Sholes Glacier
Aug.   9:  Hike out and into Lower Curtis Glacier
Aug. 10:  Lower Curtis Glacier
Aug. 11: Hike out Lower Curtis Glacier- Hike in Blanca Lake
Aug. 12:  Columbia Glacier
Aug. 13:  Columbia Glacier
Aug. 14:  Hike out Columbia Glacier; Hike in Mount Daniels
Aug. 15:  Ice Worm Glacier
Aug. 16:  Daniels and Lynch Glacier
Aug. 17:  Ice Worm Glacier, Hike out Mount Daniels-Hike out-

Looking Inside a Glacier

Here we provide a visual look inside a glacier in the North Cascades of Washington.  Glaciers are not all the same, but the key internal ingredients in summer typically are in varied ratios: ice, meltwater, sediment and biologic material.  In this case there are torrents of water pouring through the interior of the glacier, generated at the surface the day we are filming.  We do measure the discharge and velocity of these streams.  Once they drain englacially they are much slower as there are numerous plunge pools.  There are also plenty of water filled crevasses. Some of the streams have considerable sediment in them, usually large clasts given the high velocity and low bed friction.  In this case there are also a great many ice worms clinging to the walls of a water filled crevasse, and the walls of the stream channels.  All of this water than merges by the terminus into an outlet stream.  This again we measure.  On the glacier we are measuring melt and at the end of the glacier runoff provides an independent measure of this melt as well. The water then heads downstream supplying many types of fish enroute to the ocean.

The last three years have led to considerable mass loss of glaciers in the area.  This means less snowcover at the surface, which leaves less room for the ice worms to live and forces them into the meltwater regions.  This also leads to more supraglacial stream channels, which develop and deepen.  In many cases the streams deepen to the point that they become englacial. The increased ice area also should stress glacier ice worms as they live on algae, which resides largely in snow, which is less extensive and persistent in recent summers.

Thirty-third Annual North Cascade Glacier Climate Project Field Season Underway

fig8-1
Base Map of the region showing main study glaciers, produced by Ben Pelto.

From President Reagan to President Obama each August since 1984 I have headed to the North Cascade Range of Washington to measure the response of glaciers to climate change.  Specifically we will measure the mass balance of nine glaciers, runoff from three glaciers and map the terminus change on 12 glaciers. The data is reported to the World Glacier Monitoring Service.  Three glaciers that we have monitored annually have disappeared since 1984.

In 2016 for Mount Baker, Washington the freezing level from January-April was not as high as the record from 2015, but still was 400 m above the long term mean. The snowpack on June 1st was three weeks behind last year’s record melt, but still three to four weeks of head of normal. July has been exceptionally cool reducing this gap. With all the snow measurement stations losing snowcover by July 1, the gap is uncertain until we arrive on the glaciers. This will not be a good year, but will be a significant improvement over last year, likely more in the 2012 or 2013 category.  Each location is accessed by backpacking in and camping in tents.

We will first travel north to Mount Baker and the Easton Glacier, we will be joined by Oliver Lazenby, Point Roberts Press.  We will then circle to the north side where I expect we will be joined by Jezra Beaulieu and Oliver Grah, Nooksack Indian Tribe.  Jen Lennon from the Sauk-Suiattle Tribe and Pete Durr, Mount Baker Ski Patrol are also planning to join us here.   When we head into Columbia Glacier Taryn Black from U of Washington will join us. The field team consists of Mauri Pelto, 33rd year, Jill Pelto, UMaine for the 8th year, Megan Pelto, 2nd year, and Andrew Hollyday, Middlebury College.  Tom Hammond, 13th year will join us for a selected period.

[ngg_images source=”galleries” container_ids=”38″ display_type=”photocrati-nextgen_basic_imagebrowser” ajax_pagination=”1″ template=”/nas/wp/www/sites/blogsorg/wp-content/plugins/nextgen-gallery/products/photocrati_nextgen/modules/ngglegacy/view/imagebrowser-caption.php” order_by=”sortorder” order_direction=”ASC” returns=”included” maximum_entity_count=”500″]

Aug.   1:  Hike into Easton Glacier.
Aug.   2:  Easton Glacier
Aug.   3:  Easton Glacier
Aug.   4:  Hike Out Easton Glacier, Hike in Ptarmigan Ridge
Aug.   5:  Sholes Glacier
Aug.   6:  Rainbow Glacier
Aug.   7:  Sholes Glacier and/or Rainbow Glacier
Aug.   8:  Hike out and into Lower Curtis Glacier
Aug.   9:  Lower Curtis Glacier
Aug. 10: Hike out Lower Curtis Glacier- Hike in Blanca Lake Mail Pickup Maple Falls, WA 98266
Aug. 11:  Hike in Columbia Glacier
Aug. 12:  Columbia Glacier
Aug. 13:  Hike out Columbia Glacier; Hike in Mount Daniels
Aug. 14:  Daniels and Lynch Glacier
Aug. 15:  Ice Worm Glacier
Aug. 16:  Ice Worm Glacier, Hike out Mount Daniels-Hike out

Conducting Long Term Annual Glacier Monitoring

2015 time lapse easton

Easton Glacier in 1990, 2003 and 2015 from same location. Below Painting by Jill Pelto of crevasse assessment using a camline.

camline

This is the story of how you develop and conduct a long term glacier monitoring program.  We have been monitoring the annual mass balance of Easton Glacier on Mount Baker, a stratovolcano in the North Cascade Range, Washington since 1990.  This is one of nine glaciers we are continuing to monitor, seven of which have a 32 year long record. The initial exploration done in the pre-internet days required visiting libraries to look at topographic maps and buying a guide book to trails for the area.  This was followed by actual letters, not much email then, to climbers who had explored the glacier in the past, for old photographs.  Armed with photographs and maps we then determined where to locate base camp and how to access the glacier.  The first year is always a test to make sure logistically you can reach enough of the glacier to actually complete the mass balance work with a sufficiently representative network of measurement sites.  The second test is if you can stand the access hike, campsite, and glacier navigation, to do this every year for decades; if the answer is no, move on.  That was the case on Boulder Glacier, also on Mount Baker:  poor trail conditions and savage bugs, were the primary issue. Next we return to the glacier at the same time each year, completing the same measurements each year averaging 210 measurements of snow depth or snow melt annually.  This occurs whether it is gorgeous and sunny, hot, cold, snowy, rainy, or recently on this glacier dealing with thunderstorms.  You wake up, have your oatmeal and coffee/cider/tea, and get to work.  Lunch on the snow features bagels, dried fruit, and trail mix. Happy hour features tang or hot chocolate depending on the weather.  It is then couscous, rice, pasta or quinoa for dinner, with some added dried vegetable or avocado.  The sun goes behind a mountain ridge and temperatures fall, and the tent is the haven until the sun returns.  Repeat this 130 times on this glacier and you have a 25 year record. During this period the glacier has lost 16.1 m of water equivalent thickness, almost 18 m of thickness.  For a glacier that averaged 70 m in thickness this is nearly 25% of the volume of the glacier gone.  The glacier has not maintained sufficient snow cover at the end of the summer to have a positive balance, this is the accumulation area ratio, note below.  The glacier has retreated 315 m from 1990-2015.  This data is reported annually to the World Glacier Monitoring Service.  The glacier has also slowed its movement as it has thinned, evidenced by a reduction in number of crevasses. During this time we have collaborated with researchers examining the ice worms, soil microbes/chemistry, and weather conditions on the ice. This glacier supplies runoff to Baker Lake and its associated hydropower projects.  Our annual measurements here and on Rainbow Glacier and Lower Curtis Glacier in the same watershed provide a direct assessment of the contribution of glaciers to Baker Lake.  The glacier is adjacent to Deming Glacier, which supplies water to Bellingham, WA. The Deming is too difficult to access, and we use the Easton Glacier to understand timing and magnitude of glacier runoff from Deming Glacier.

The glacier terminates at an elevation of 1650 m, but thinning and marginal retreat extends much higher.  A few areas of bedrock have begun to emerge from beneath the ice as high as 2200 m. The changes in ice thickness are minor above 2500 m, indicating this glacier can retreat to a new equilibrium point with current climate.

Mass balance, terminus and supra glacial stream assessment are illustrated in the video, Filmed by Mauri Pelto, Jill Pelto, Melanie Gajewski, with music from Scott Powers.

easton 2010
Mass balance Map in 2010 of Easton Glacier used in the field for reference in following years. 
easton aar

Accumulation Area Ratio/Mass balance relationship for Easton Glacier

North Cascade Winter Snowpack 2016, 33rd Field Season Approaches

This 2016 winter has proved much different than in 2015.  In 2015 exceptional warmth led to record low snowpack despite above average precipitation.  The warmth is illustrated using the North American Freezing Level Tracker for our Sholes Glacier site. The highest mean level by far is 2015, 500 m above average versus 180 m above average this winter.  The low snowpack combined with a long warm melt season in 2015 led to the highest mass losses from North Cascade glaciers in our 32 years of observations.

2016 freezing level

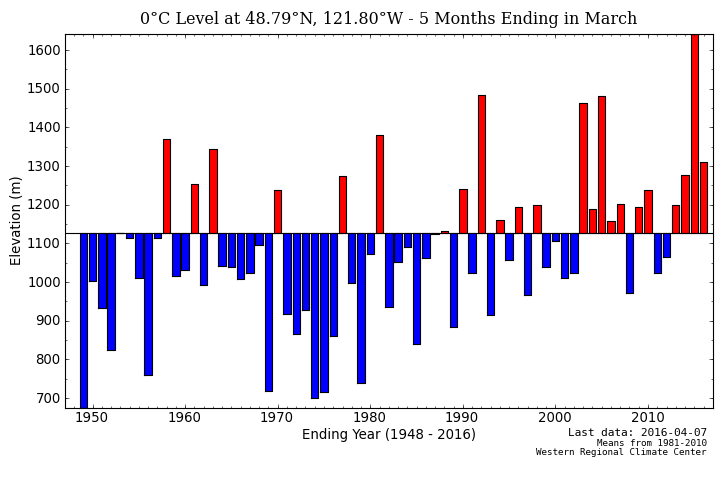
Freezing Levels for the November-March period at Sholes Glacier in the North Cascades.

A key date for snowpack assessment has always been April 1.  As a result there is good data set from six of the invaluable  USDA SNOTEL sites in the North Cascades since 1946.  A comparison of snowpack water equivalent (SWE) and total precipitation yield a ratio of SWE retained on April 1 to total precipitation.   The result is the ratio between SWE and precipitation, snowpack storage efficiency has been in decline,  as noted by Mote et al (2008) and Pelto (2008). The best long term precipitation stations in the region are Diablo Dam and Concrete, we use the average of the two. The storage efficiency ratio  was a minimum in 2015 at only 19% of precipitation retained as snowpack.  In 2016, 43% of precipitation has been retained leading to snowpack that is 10% above the mean for the 1984-2015 period.Winter precipitation over the period has a positive trend and SWE a negative trend. This declining ratio led Jon Riedel of the North Cascades National Park Service to observe that we now need 120% of average precipitation to achieve average snowpack. It is interesting to note that 2014, 2015 and 2016 had quite similar November-March total precipitation.  With 2016 slightly exceeding 2014 for snowpack.

In 2014 the glaciers had a poor year, not due to low snowpack but to high melt season temperatures.  What will transpire in 2016 will be the focus on our 33rd consecutive annual field season monitoring North Cascade glaciers. In the last 10 days warm weather in the region has led to significant snowpack melt.  At low elevation sites snowpack depth and SWE have decreased by 20% at sites like Trinity 2930 feet. Just 10 miles away at Lyman Lake at 5980 feet the snow depth decreased from 170 inches to 142 inches, but SWE has not declined.  As is typical this early snowmelt period leads to percolation and either refreezing or storage within the snowpack. This is still an important ripening that must occur before SWE can drop.  Typically SWE reaches a maximum at the elevations of glaciers between May 1 and 10.  A 10 day warm period as has occurred may indicate an early peak, but April could also feature more snow storms that will lead to future increases. From Alaska to British Columbia  to Washington groups are heading into the field to assess snow depth on glaciers at the end of this winter season.  Snowpits, snow stakes emplaced last last summer and Ground Penetrating Radar will all be deployed.

swe-ppt ratio

Trends in winter precipitation November-march in the North Cascades , average of Concrete and Diablo Dam.  Mean SWE at six USDA SNOTEL station on April 1 (Fish Lake, Lyman Lake, Park Creek, Rainy Pass, Stampede Pass and Stevens Pass). Ratio of April 1 SWE and winter precipitation.

april 1 swe 84-16

Mean SWE at six USDA SNOTEL station on April 1 (Fish Lake, Lyman Lake, Park Creek, Rainy Pass, Stampede Pass and Stevens Pass.

DSC06954

Assessing snow depth on Easton Glacier using crevasse stratigraphy. 

galcier peak raising three hikers april 2016

Image above of Glacier Peak and below of Monte Cristo Peaks in the North Cascades on April 9, 2016 from a trip to Bedal Peak by raising3hikers at NWHikers.net. The blanket of snow remains deep. 

monte cristo

Foss Glacier, WA Needs Snow Queen Elsa’s Help to Survive

foss compare

Comparison of Foss Glacier in 1988 and 2015 from the west ridge of Mount Daniel.  The glacier has lost 70% of its area in 30 years. Black arrows indicate bedrock area emerging amidst the glacier. 

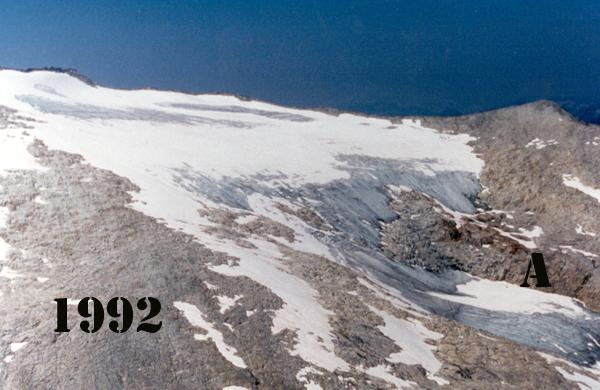
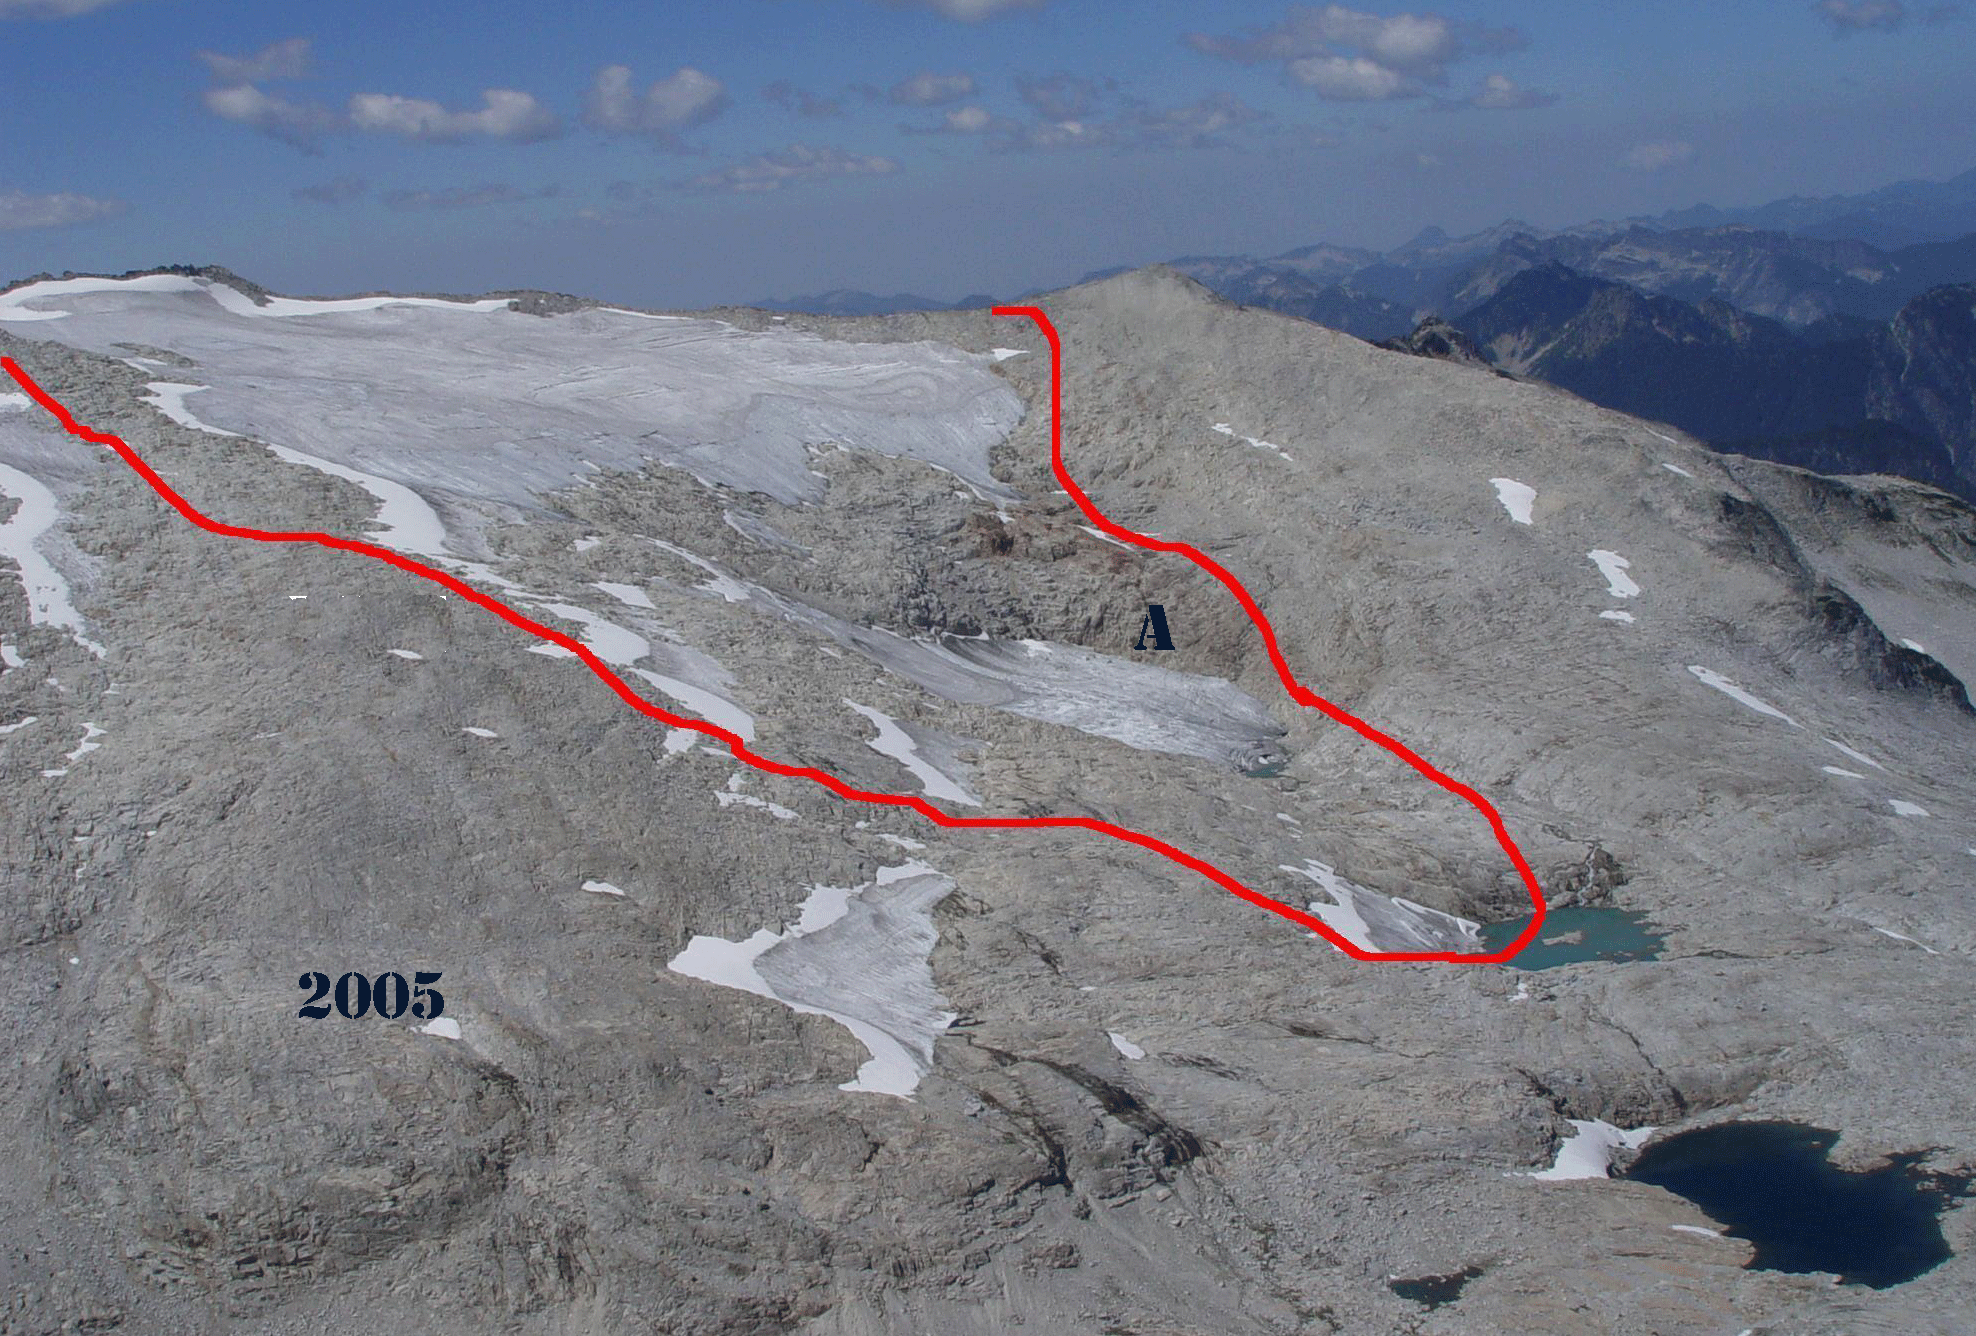
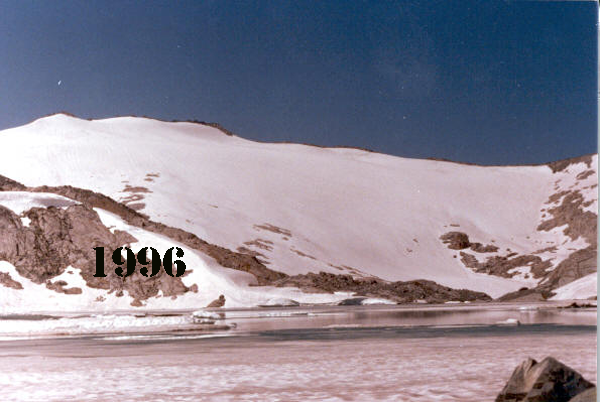
Foss Glacier is a slope glacier covering the northeast face of Mount Hinman at the head of the South Fork Skykomish River in the North Cascades of Washington. In the 1958 map of the region the glacier covered 0.8square kilometers.  By 1984 when we first mapped the glacier margin the glacier had lost little area, and was at 0.7 square kilometers. In 1988 the glacier extended from 2325  m to 1890 m in one continuous swoop.  Glacier thickness was in the 30-40 m range.  There were few crevasses, and some of the supraglacial streams were particularly long for this region, 600 m is the longest mapped which was more than 50% of the glacier length. By 1992 the glacier was developing some significant bedrock outcrops emerging amidst the glacier.  The terminus was retreating and the lower slope terminus lobe below 1950 m was clearly going to detach. Foss Glacier had by the middle of August lost all of its snowcover in 1992, 1993, 1994, 1998, 2003, 2005, 2009, 2014 and 2015.  This has led to thinning of the upper reaches of the glacier.  Thinning of the upper reaches of a glacier is an indicator of a glacier that cannot survive current climate. The lower section detached from the upper section in 2003 and melted away in 2015.  In 2015 the glacier has fragmented into four parts and will continue to melt away. Annual balance measurements indicate a loss of over 18 meters of average ice thickness, which for a glacier that averaged 30-40 m in thickness represents approximately 50% of the volume of the glacier lost.  In 2005 the glacier had lost 40% of its total area in 15 years, the terminus area had detached, Point A, and there was no snow retained (Pelto, 2015).  This was the third straight year of almost no retained snowcover. A glacier cannot survive without a consistent/persistent accumulation zone, which is where snow is retained.  A view of the changing area from the shore of Pea Soup Lake indicates how Foss Glacier  in 1996 dominated the slope of Mount Hinman to 2007 when it did not. By 2015 after 30 years of mass balance measurement, the program was discontinued as the glacier had now lost 70% of its area in the previous 30 years. Unless Snow Queen Elsa can put the freeze on during summer, this glacier will not survive long.

The importance here is for late summer streamflow in the Skykomish River.  Glacier retreat and changes in summer runoff have been pronounced in the Skykomish River Basin, North Cascades, Washington from 1950-2009 (Pelto, 2011). An analysis comparing USGS streamflow records for the 1950-1985 to the 1985-2009 period indicates that summer streamflow (July-September) has declined 26% in the watershed, spring runoff (April-June) has declined 6%, while winter runoff (November-March) has increased 10%.  From 1929-1985 streamflow was less than 14 cubic meters/second during the glacier melt season on a single day in 1951. From 1986-2015 there were, 264 days with discharge below 14 m3/s-1 with 11 periods lasting for 10 consecutive days. The minimum mean monthly August discharge from 1928-2015 occurred in 2015, 2003 and 2005 when streamflow was 11.8 m3s-1, 15.1 m3s-1 and 15.2 m3s-1 respectively.   Despite 15% higher ablation rates during the 1984-2009 period, the 45% reduction in glacier area led to a 35-38% reduction in glacier runoff between 1958 and 2009 (Pelto, 2011). The glacier runoff decline impacted river discharge only during low flow periods in August and September. In August, 2003 and 2005 glacier ablation contributed 1.5-1.6 m 3 s -1 to total discharge, or 10-11% of August discharge. While declining glacier area in the region has and will lead to reduced glacier runoff and reduced late summer streamflow, it has limited impact on the Skykomish River except during periods of critically low flow, below 14 m3 s -1 when glaciers currently contribute more than 10% of the streamflow.

foss92dg

A 1992 view downglacier illustrating the limited crevassing, surface streams and thin nature of the ice.

foss stream

Along a surface stream that has endured long enough to develop into a meandering system.

foss 1992

1992 view of Foss Glacier from Mount Daniel

foss 2005

By 2005 the glacier had separated into several segments and lost 30% of its area in the last 15 years.  The terminus lobe was now detached.  There is also no snow left.
foss96

1996 View of Foss Glacier across Pea Soup Lake

foss glacier 07

2007 View of Foss Glacier across Pea Soup Lake

foss 2015ov

2015 view of Foss Glacier from Mount Daniel. 


Climate Driven Retreat of Mount Baker Glaciers and Changing Water Resources

breakfast2

We have spent 300 nights in a tent just on this mountain collecting data from 1984-2015 in this study that the book documents.

This post has the same title as a book released last month as part of the Springer Briefs in Climate Studies series.  The nice thing about publishing research emerging from 30 years of field research in a book  is that I had a chance to include 104 figures in 107 pages.   Here I give a brief synopsis of the book and a key figure from each of the six chapters.This book presents the impact of climate change on Mount Baker glaciers, USA, and the rivers surrounding them. Glaciers are natural reservoirs that yield their resource primarily on warm dry summer days when other sources are at their lowest yield. This natural tempering of drought conditions will be reduced as they retreat. Mount Baker, a volcano in the Cascades of Washington, is currently host to 12 principal glaciers with an area of 36.8 km2. The glaciers yield 125 million cubic meters of water each summer that is a resource for salmon, irrigation and hydropower to the Nooksack River and Baker River watersheds. Recent rapid retreat of all 22 glaciers is altering the runoff from the glaciers, impacting both the discharge and temperature of the Nooksack and Baker River. Over the last 30 years we have spent 270 nights camped on the mountain conducting 10,500 observations of snow depth and melt rate on Mount Baker. This data combined with observations of terminus change, area change and glacier runoff over the same 30 years allow an unusually comprehensive story to be told of the effects of climate change to Mount Baker Glaciers and the rivers that drain them.

Red Channel|Green Channel|Blue Channel

Chapter 1: Panchromatic sharpened Landsat image of the glacier of Mount Baker in Aug. 2014, rendered by Ben Pelto (UNBC).  

We have worked on each of these glaciers except Thunder Glacier.  After advancing from 1950-1979, the glaciers have all been in retreat, in 2015 the average retreat was 390 m since 1985. 

easston compare

Chapter 2 Comparison of Easton Glacier from our base camp in 2003 and 2015, where we have spent over 90 nights.  We measure the retreat of each glacier in the field as they respond to climate change.

fig 3-23

Chapter 3 looks at mass balance of glaciers in the area including the Sholes Glacier Daily ablation measurements over the last 30 years allow determination of a relationship between daily melt and air temperature. Other factors matter, but  air temperature does yield a good relationship.

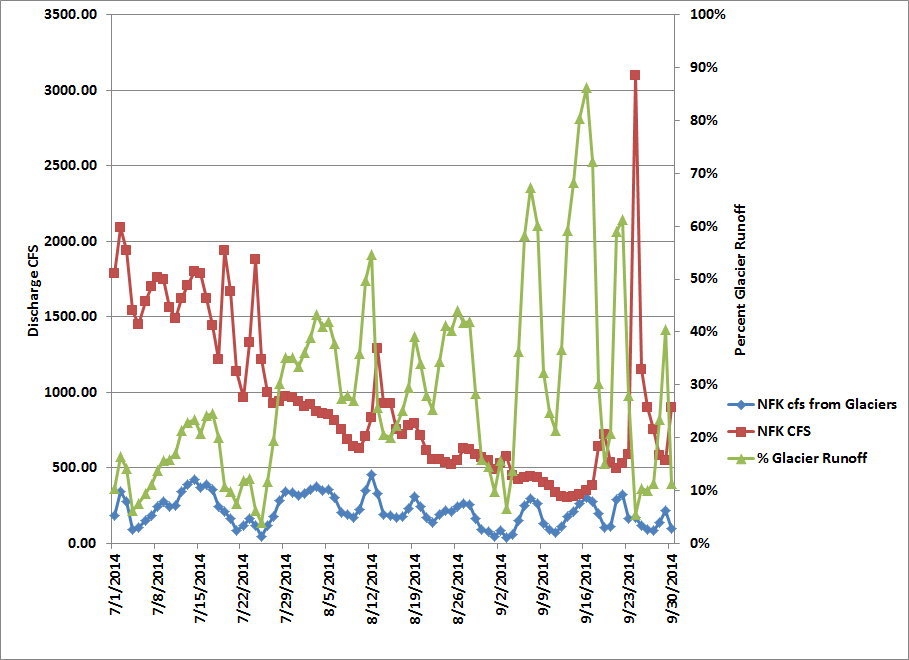
nfk glacier contributiion


Chapter 4 Glacier runoff provides a critical water resource to the Nooksack River.  We measure meltwater runoff from Sholes Glacier and observe glacier melt on several glaciers in the basin.  This allows determination of the contribution of glaciers to the watershed.  In 2014 contributions from glaciers exceeded 40% of total North Fork Nooksack River streamflow on 21 days after Aug. 1.   This is a critical period for salmon migration in the watershed.

fig 5-6

Chapter 5 Glacier runoff is measured below the Sholes Glacier in conjunction with Oliver Grah and Jezra Beaulieu, Nooksack Tribe.  This is the record for part of the 2014 field season at the gage site.

fig 6-22

Chapter 6  Deming Glacier in 2011 Google earth image illustrating retreat. The glacier has retreated 420 m from 1979 to 2015. 


Visualizing Glacier Melt Impacts

Key questions emerge from the summer of 2015 in the Pacific Northwest glacier basins. That can both be visualized and quantified.

With record temperatures and minimum flows in most rivers in the Cascade Range during July and August of 2015, a key question was how much did glaciers contribute in basins that are glaciated?  Note the water pouring off the glacier and the lack of snowcover in the first few minutes of the video.

You can examine flow per unit watershed area as a first order observation. In the unglaciated South Fork discharge was 0.5 cfs/square mile, rising to 0.7 cfs/square mile in the lightly glaciated Skykomish River and 4.3 cfs/square mile in the heavily glaciated North Fork Nooksack.   For a more direct measure we measured ablation from July 29 to August 17th in the North Fork Nooksack and Skykomish River basin.  With the Nooksack Tribe we also measured discharge below glaciers in the North Fork but those recorders are still deployed in the field.

Because the glaciers had mostly ice, not snow at the surface, melting was enhanced.  We found in the Skykomish Basin that glacier runoff was 45 CFS versus a mean discharge of 375 CFS , this is 12% of the total flow despite covering only 1.3 % of the basin.  In the North Fork Nooksack glacier runoff was 340 CFS versus total flow of  460 CFS, this is 74% of the total flow though only 6.1 % of the basin has glacier cover. In both cases the glaciers contributed a river flow percentage 12 times greater than the percent of basin area they cover.  With a substantial loss in glacier area occurring this summer, next year glacier runoff for the given climate conditions will be reduced. Given this higher flow the glacier fed streams offer less stressful conditions this summer to salmon.

How much did glacier runoff water temperature amelioration?

In the South Fork Nooksack without glaciers stream temperature was above 20 C on eight days between Aug.1 and Aug. 20. In the North Fork Nooksack with glacier contribution, the stream temperature peaked at 13-14 C.

With the early loss of snowcover and exposure of the underlying ice, how are glacier ice worms impacted?  In the video note ice worms featured in the first minute in a glacier filled crevasse.

These worms live on snow algae primarily, which would seem to be in short supply in a summer with limited snowpack on the glaciers.  How well can they survive being on the glacier ice for extended periods?  For the 21st year we conducted ice worm population surveys.  The numbers were the lowest we have seen at 175-250 ice worms per square meter, but it should be next year when the full impact would be evident.

How much glacier area will be lost?  Note the visual of terminus retreat.
The summer is not over, but our observations indicate a 5-7 % volume loss will occur.  This should be approximately equaled by area loss.  Hopefully good satellite imagery in September will provide a specific answer.  The Aug. 17th Landsat image is excellent. Retreat just this summer has been 40 m on Easton Glacier, 32 meters on Columbia Glacier, 25 meters on Sholes Glacier and 30 meters on Lower Curtis Glacier.

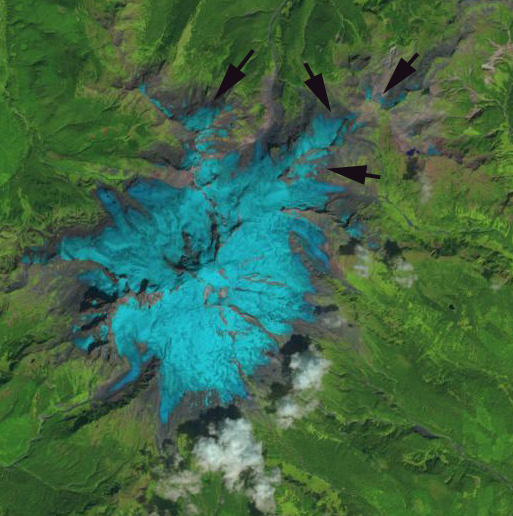
mount baker 9172015


Aug. 17 Landsat image.  Arrows indicate areas where we observed rapid area loss of glacier ice this summer. 

Disastrous Year for North Cascade Glacier Mass Balance (Snow/Ice Economy)


Mass loss of North Cascade glaciers visualized.

A disastrous year is unfolding in 2015 for North Cascade glaciers, if normal melt conditions continue the range will lose 5-7% of its entire glacier volume in one year! For the 32nd consecutive year we were in the North Cascade Range, of Washington to observe the mass balance of glaciers across the entire mountain range. The melt season is not over, but already the mass loss is greater than any other year, with six weeks of melting left. An alpine glacier’s income is the snow that accumulates, and to be have an equilibrium balance sheet for a year, alpine glaciers typically need 50-65% snowcovered surfaces at the end of the melt season.  Below the accumulation zone, net assets are lost via ablation.

In 2015 of the 9 glaciers we examined in detail, 6 had less than 2% retained snowcover, which will be gone by the end of August.  Two more had no 2015 snowpack greater than 1.7 m in depth, which will also melt away before summer ends.  Average ablation during the August field season was 7 cm per day of snow, and 7.5 cm of ice. Only one glacier will have any retained snowcover at the end of the summer, we will be checking just how much in late September. This is the equivalent of a business having no net income for a year, but continuing to have to pay all of its bills. Of course that comes on top of more than 27 years of consecutive mass balance loss for the entire “industry” of global alpine glaciers.  The business model of alpine glaciers is not working and until the climate they run their “businesses” in changes, alpine glaciers have an unsustainable business model. Below this is illustrated glacier by glacier from this summer.  A following post will look at the glacier runoff aspect of this years field season.  The Seattle Times also featured our summer research.JillPeltoGMB_720_494_s_c1_c_c

Jill Pelto Painting of mass balance time series loss from 1984 to 2014. 

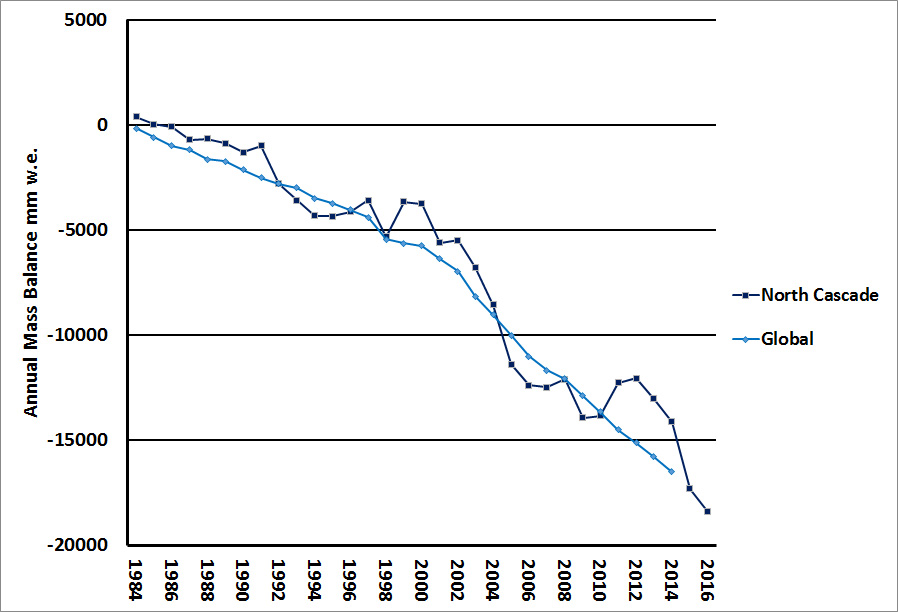
In a recent paper published in the Journal of Glaciology spearheaded by the WGMS group  (M. Zemp,  H. Frey, I.Gartner-Roer, S.Nussbaumer, M.Hoelzle, F.Paul, W.Haeberli and F.Denzinger), that I was co-author on, we examined the WGMS dataset on glacier front variations (~42 000 observations since 1600), along with glaciological and geodetic observations (~5200 since 1850).  The data set illustrated that “rates of early 21st-century mass loss are without precedent on a global scale, at least for the time period observed and probably also for recorded history.The rate of melting has been accelerating, and in the decade from 2001 to 2010, glaciers lost on average 75 centimetres of their thickness each year”, this is compared to the loss in the 1980’s and 1990’s 25 cm and 40 cm respectively each year (Pelto, 2015).  A comparison of the global and North Cascade Glacier mass balance records since 1980 indicate the cumulative loss, at bottom.

DSC08917

Columbia Glacier terminus August 3, 2015 with new expanding lake.

DSC00199

Upper portion of Columbia Glacier on Aug. 5, 2015 note lack of snowcover and all previous firn layers (firn is snow that survived a melt season but is not yet glacier ice).

DSC00503

Foss Glacier lacking snowcover and losing area fast this summer, this glacier will lose more than 15% of its volume in 2015.

DSC00435

Measuring firn from 2011-2014 retained in a crevasse on Easton Glacier, 2015 snowpack lacking.

DSC00429

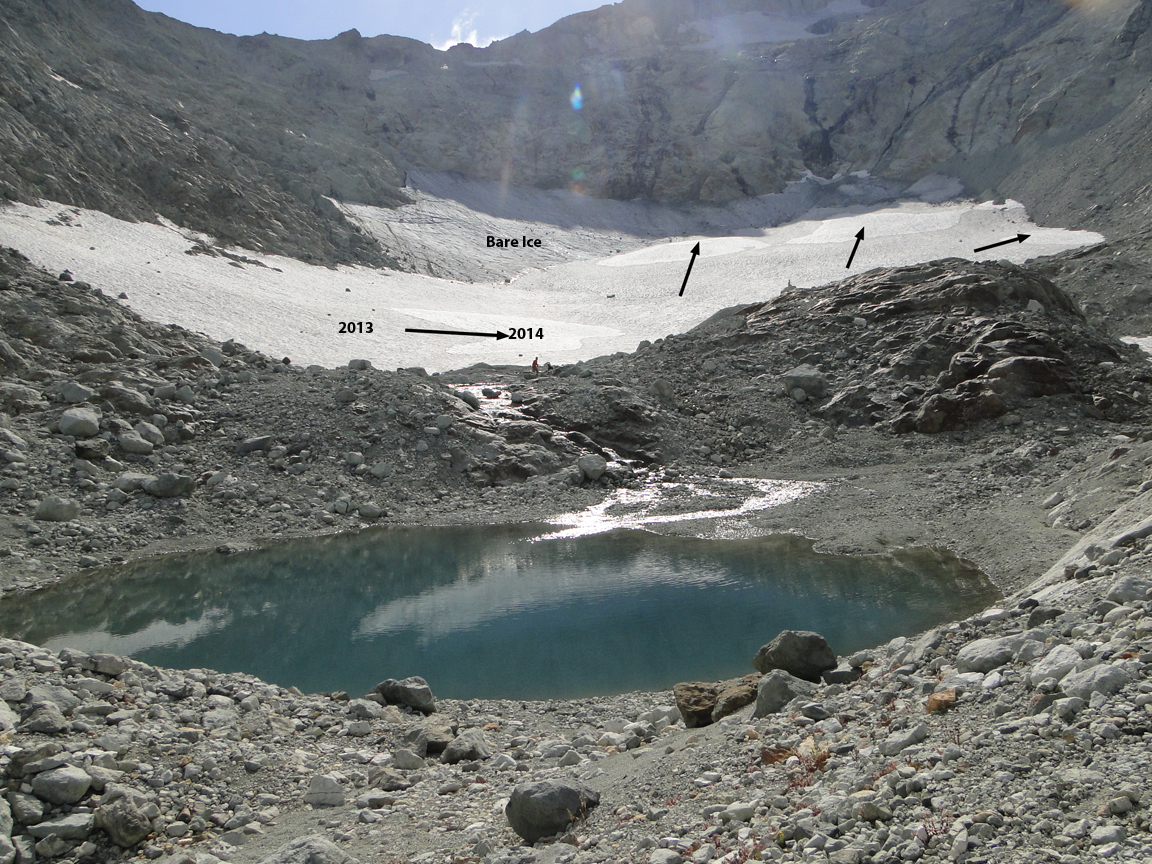
The typical end of summer snowline elevation on Easton Glacier, bare ice and firn in 2015.

DSC09197

Rainbow Glacier amidst the normal accumulation zone, where there should be 3-4 m of snowpack, none left.

DSC09602

Lynch Glacier view across the typical end of summer snow line region on Aug. 17th 2015.

DSC00413

Terminus of Lower Curtis Glacier with many annual layers exposed to rapid melt, 31 m of retreat from spring to August 11th, 2015.

DSC00448

ice worm firn

Only firn from 2013 and 2014 and bare ice at surface of Ice Worm Glacier.

ba2014


Comparison of cumulative glacier mass balance in the North Cascades and Globally (WGMS)

DSC00348

Primary field team for the from left, Mauri Pelto (Nichols College), Jill Pelto (UMaine), Tyler Sullivan (UMaine), Ben Pelto (UNBC) and Erica Nied (U-Colorado) summer with contributions from Justin Wright, Tom Hammond, Oliver Grah and Jezra Beaulieu not pictured

Embarking on the 32nd Annual North Cascade Glacier Climate Project


sholes compare
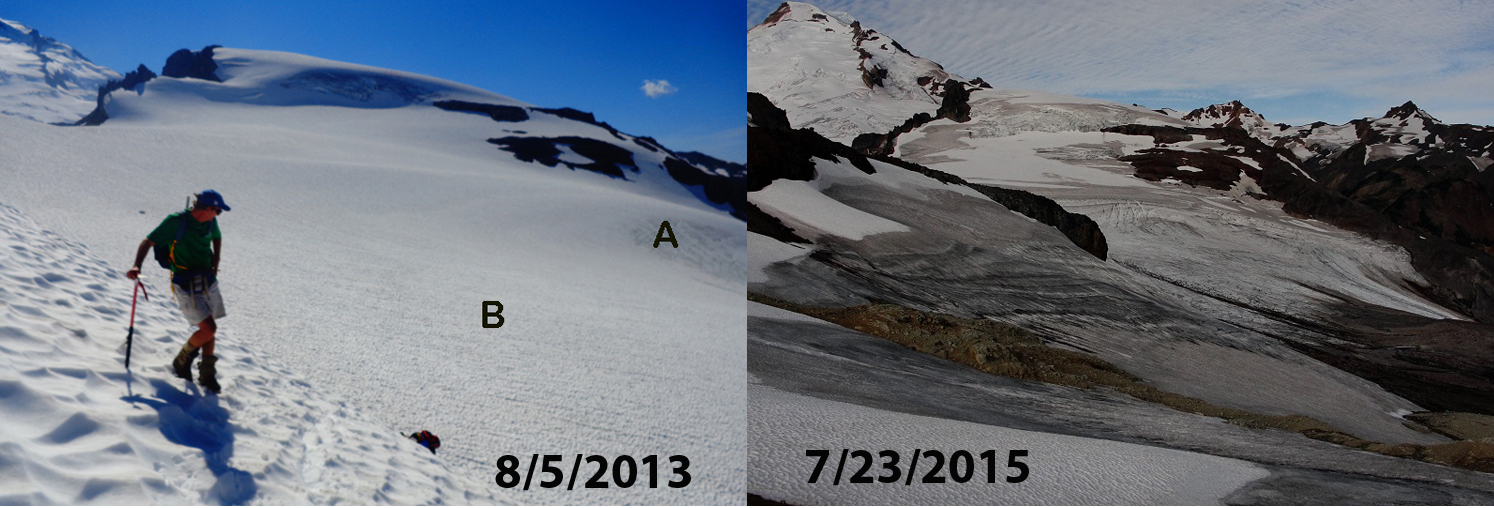
Sholes Glacier snowcover Aug. 5, 2013 (Jill Pelto) and Sholes Glacier July 23, 2015 (Oliver Grah)

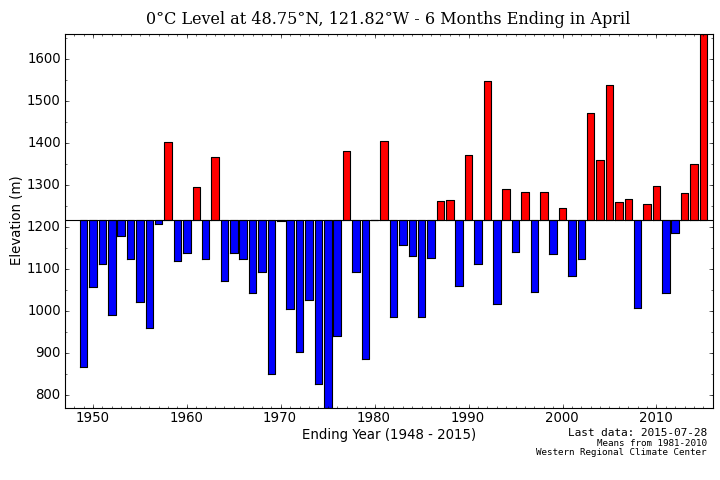
For the 32nd straight summer we will be investigating North Cascade glaciers and their response to climate change over the next three weeks (that means no new posts until Aug. 20).  In 1984 the program was initiated to study the impacts of climate change across an entire mountain range, instead of on just one glacier.  This had been a high priority of the National Academy of Science, I felt I could address.  The glaciers in the North Cascades provide water resources for irrigation, hydropower, salmon and municipal supply.  During our 32 years we have seen the loss of 25% of the entire glacier volume of the range.  Unfortunately 2015 is almost certainly going to be the worst year during this period.  We will likely lose over 5% of the volume of these glaciers in one year.  The problem has been high freezing elevations in the winter, note the difference from other years below.  Because of the drought conditions glaciers are even more crucial to runoff, note the daily spike in flow due to glacier melt in the Nooksack River in July, black arrows.  Blue arrow indicates rain storm.

winter 2015nooksack

Freezing levels on Mount Baker during winter 2015 versus previous winters.  Nooksack River discharge from the USGS in July.

This has been followed by the warmest June and now July the region has seen. This has led to record low streamflow from either rain, groundwater or snowpack from non-glacier areas.  The result is that in glacier fed basins glacier runoff which is above normal because of the warm temperatures is even more important.  We are measuring flow below glaciers and melting on glaciers to quantify the percent of total flow contributed by glaciers.  In 2014 in the North Fork Nooksack River glaciers contributed more than 40% of total stream discharge in the river on 21 days, all in August and September. We again with the Nooksack Indian Tribe will be examining the issue, particularly at Sholes Glacier. We will also be measuring the mass balance, terminus change and mapping ten glaciers we visit every year, including Columbia Glacier seen below.

columiba compare

Terminus of Columbia Glacier and accumulation zone looking bare in 2005, the lowest snowpack year of the last 32 until this year

The glaciers are all in Wilderness areas which means no motorized vehicles or equipment, we have to hike everything in.  This has provided the opportunity to spend over 600 nights in a tent examining the glaciers, hiking/skiing over 3000 miles across the glaciers, and eating oatmeal each morning for breakfast.  It has also provided the opportunity to train and work with more than 60 different scientists.  This year the field team consists of Erica Nied from the University of Colorado, Tyler Sullivan from the University of Maine, Jill Pelto from the University of Maine for the seventh year and myself for the 32nd year.  We will be joined at times by Justin Wright, Oregon State, Tom Hammond, University of Washington, Ben Pelto University of Northern British Columbia, Oliver Grah and Jezra Beaulieu of the Nooksack Indian Tribe. Below are three videos from last year that illustrate: 1: Visual report on initial 2015 findings 2: How and why we measure mass balance.3. The Nooksack Indian Tribe perspective on threats of glacier runoff and our measurements of it.


Big Four Glacier & Ice Caves, WA: a short future?

The Big Four ice caves area popular hiking destination 90 minutes northeast of Seattle in the North Cascades.  This ice mass is currently the lowest elevation glacier in the lower 48 states. It is fed by tremendous avalanching from higher on Big Four Mountain.  During the winter the snow piles up on the avalanche fan.  In the summer the waterfall from above carves tunnels under the snow-ice mass.  At some point in June or July the tunnels are enlarged enough to allow people, but also warm air to enter.  This leads to further tunnel expansion.  In warm summers the tunnels get large enough by late summer that collapses of the roof occur.  Unfortunately this year the caves are already in late summer form and an expected collapse tragically led to the 1 person killed and five injured this week.  Here we examine the formation and now demise of this odd glacier in the last decade. There are no pictures of the ice caves in this post, as it is not a place to enter this year.

The 1999-2002 period featured heavy winter snowpack and avalanching boosting Big Four.  The summer of 2003 was the first of three cruel seasons to Big Four.  In this image you cannot note the blue case to all but the very top of the avalanche cone, indicating it is older snow.  There is further two layers that look  to be annual layers on the right side of the image.  This suggests to me, the base is a 1999, layer, than a 2000 layer, than a broader dirty band and a 2002 layer, followed by a 2003 snowpack,.  The summer of 2001 was warm and no snowpack would have survived, causing the wider dirt band. In 2003-2005 a series of dismal winters and warm summers led to the near total loss of the Big Four Avalanche fan, at this point it was not a glacier.

From 2006-2012 a series of good summers led to redevelopment, which prompted David Head to contact me to investigate in 2009 if it was a glacier.  He provided a series of images from 2005-2008 indicating the changes.  We then headed to the glacier in 2009 to investigate in detail. In 2009 we mapped the glacier, from above and below. We found it had an area of 0.07 square kilometers, the glacier had a center length of 370 m, had a width at the toe of 270 m, an average slope of 22 degrees an average depth of 32 m a maximum depth of 55 m, and a volume of ~2 million cubic meters. There was blue glacier ice evident and a few crevasses on the upper portion. It was a glacier. The glacier gained at least 30 m in thickness over the majority of its area from 2005-2008, which is an extraordinarily short period. This year for the first time no avalanches reached the avalanche fan. Last summer was at record warmth, with the snowmass ablated to its smallest extent since 2005. The ice cave entrances were wide with a rainbow shaped arch, not an engineering setup for stability. This did not change over the winter. Hence, it is like having two summers in a row without winter. Contrast the June 2008 image to April 2015 (from Kellbell), quite a difference. There is no snow on Big Four even in April this year, the blue glacier ice is exposed and ablating starting then. The ice mass is rapidly ablating in the warm early summer of 2015 and will reach its smallest size since 2005 by the end of the summer. It is likely too thick to melt it all this year, but it may well surpass the 2005 minimum size. It will no longer be a glacier by the end of the summer. That is unusual to watch a glacier form and melt away in a decade. There will be more collapses in the ice caves this summer as it recedes to a meager size.

big four time lapse

2003-2007 Time lapse of Big Four
big four June 2008
June 2008 image
big four 10202008
October 2008 image
big four 2009
August 2009 image

big four20150327
April 2015 (Kellbell)