
Annual mass balance is the difference between ice and snow added to the glacier via accumulation and snow and ice lost via ablation and in some cases calving. Alpine glacier mass balance is the most accurate indicator of glacier response to climate and along with the worldwide retreat of alpine glaciers is one of the clearest signals of ongoing climate change (WGMS,2010). For 25 consecutive years we (North Cascade Glacier Climate Project) have measured the mass balance of Sholes Glacier. On Sholes Glacier in 2014 we completed 162 measurements of snowpack depth using probing and crevasse stratigraphy, mainly probing on this relatively crevasse free glacier. We mapped the extent of snowcover on several occasions, and using the retreat of the snowline and stakes emplaced in the glacier observed the rate of ablation (melting). We also measured runoff from the glacier in a partnership with the Nooksack Indian Tribe, which provided an independent measure of ablation. The final mass balance in 2014 was -1.65 m of water equivalent, the same as a 1.8 meter thick slice of the glacier lost in one year. In 2014 we arrived at Sholes Glacier to find it already had 15% blue ice exposed, on August 7th. This had expanded to 25% by August 12th. This rapidly expanded to 50% by August 23rd, note Landsat comparison below. The snow free area expanded to 60% by the end of August and then close to 80% loss by the end of the summer. Glaciers in this area need 60% snowcover at the end of the melt season to balance their frozen checkbook. This percentage is the accumulation area ratio. This mass balance data is then reported to the World Glacier Monitoring Service, along with about 110 other glaciers around the world. Unfortunately the WGMS record indicates that Global alpine glacier mass balance was negative in 2014 for the 31st consecutive year. The video below explains how we measure mass balance each year with footage from the 2014 field season. Of course a key aspect is hiking to the glacier and camping in a tent each year.
The Sholes Glacier thickness has not been measured, but there is a good relationship between area and thickness, that suggests the glacier would average between 40 and 60 m in thickness. The 15 m of water equivalent lost from 1990-2014 is equal to nearly 17 m of ice thickness, which would be at least 35% of the glaciers volume lost during our period of measurement.
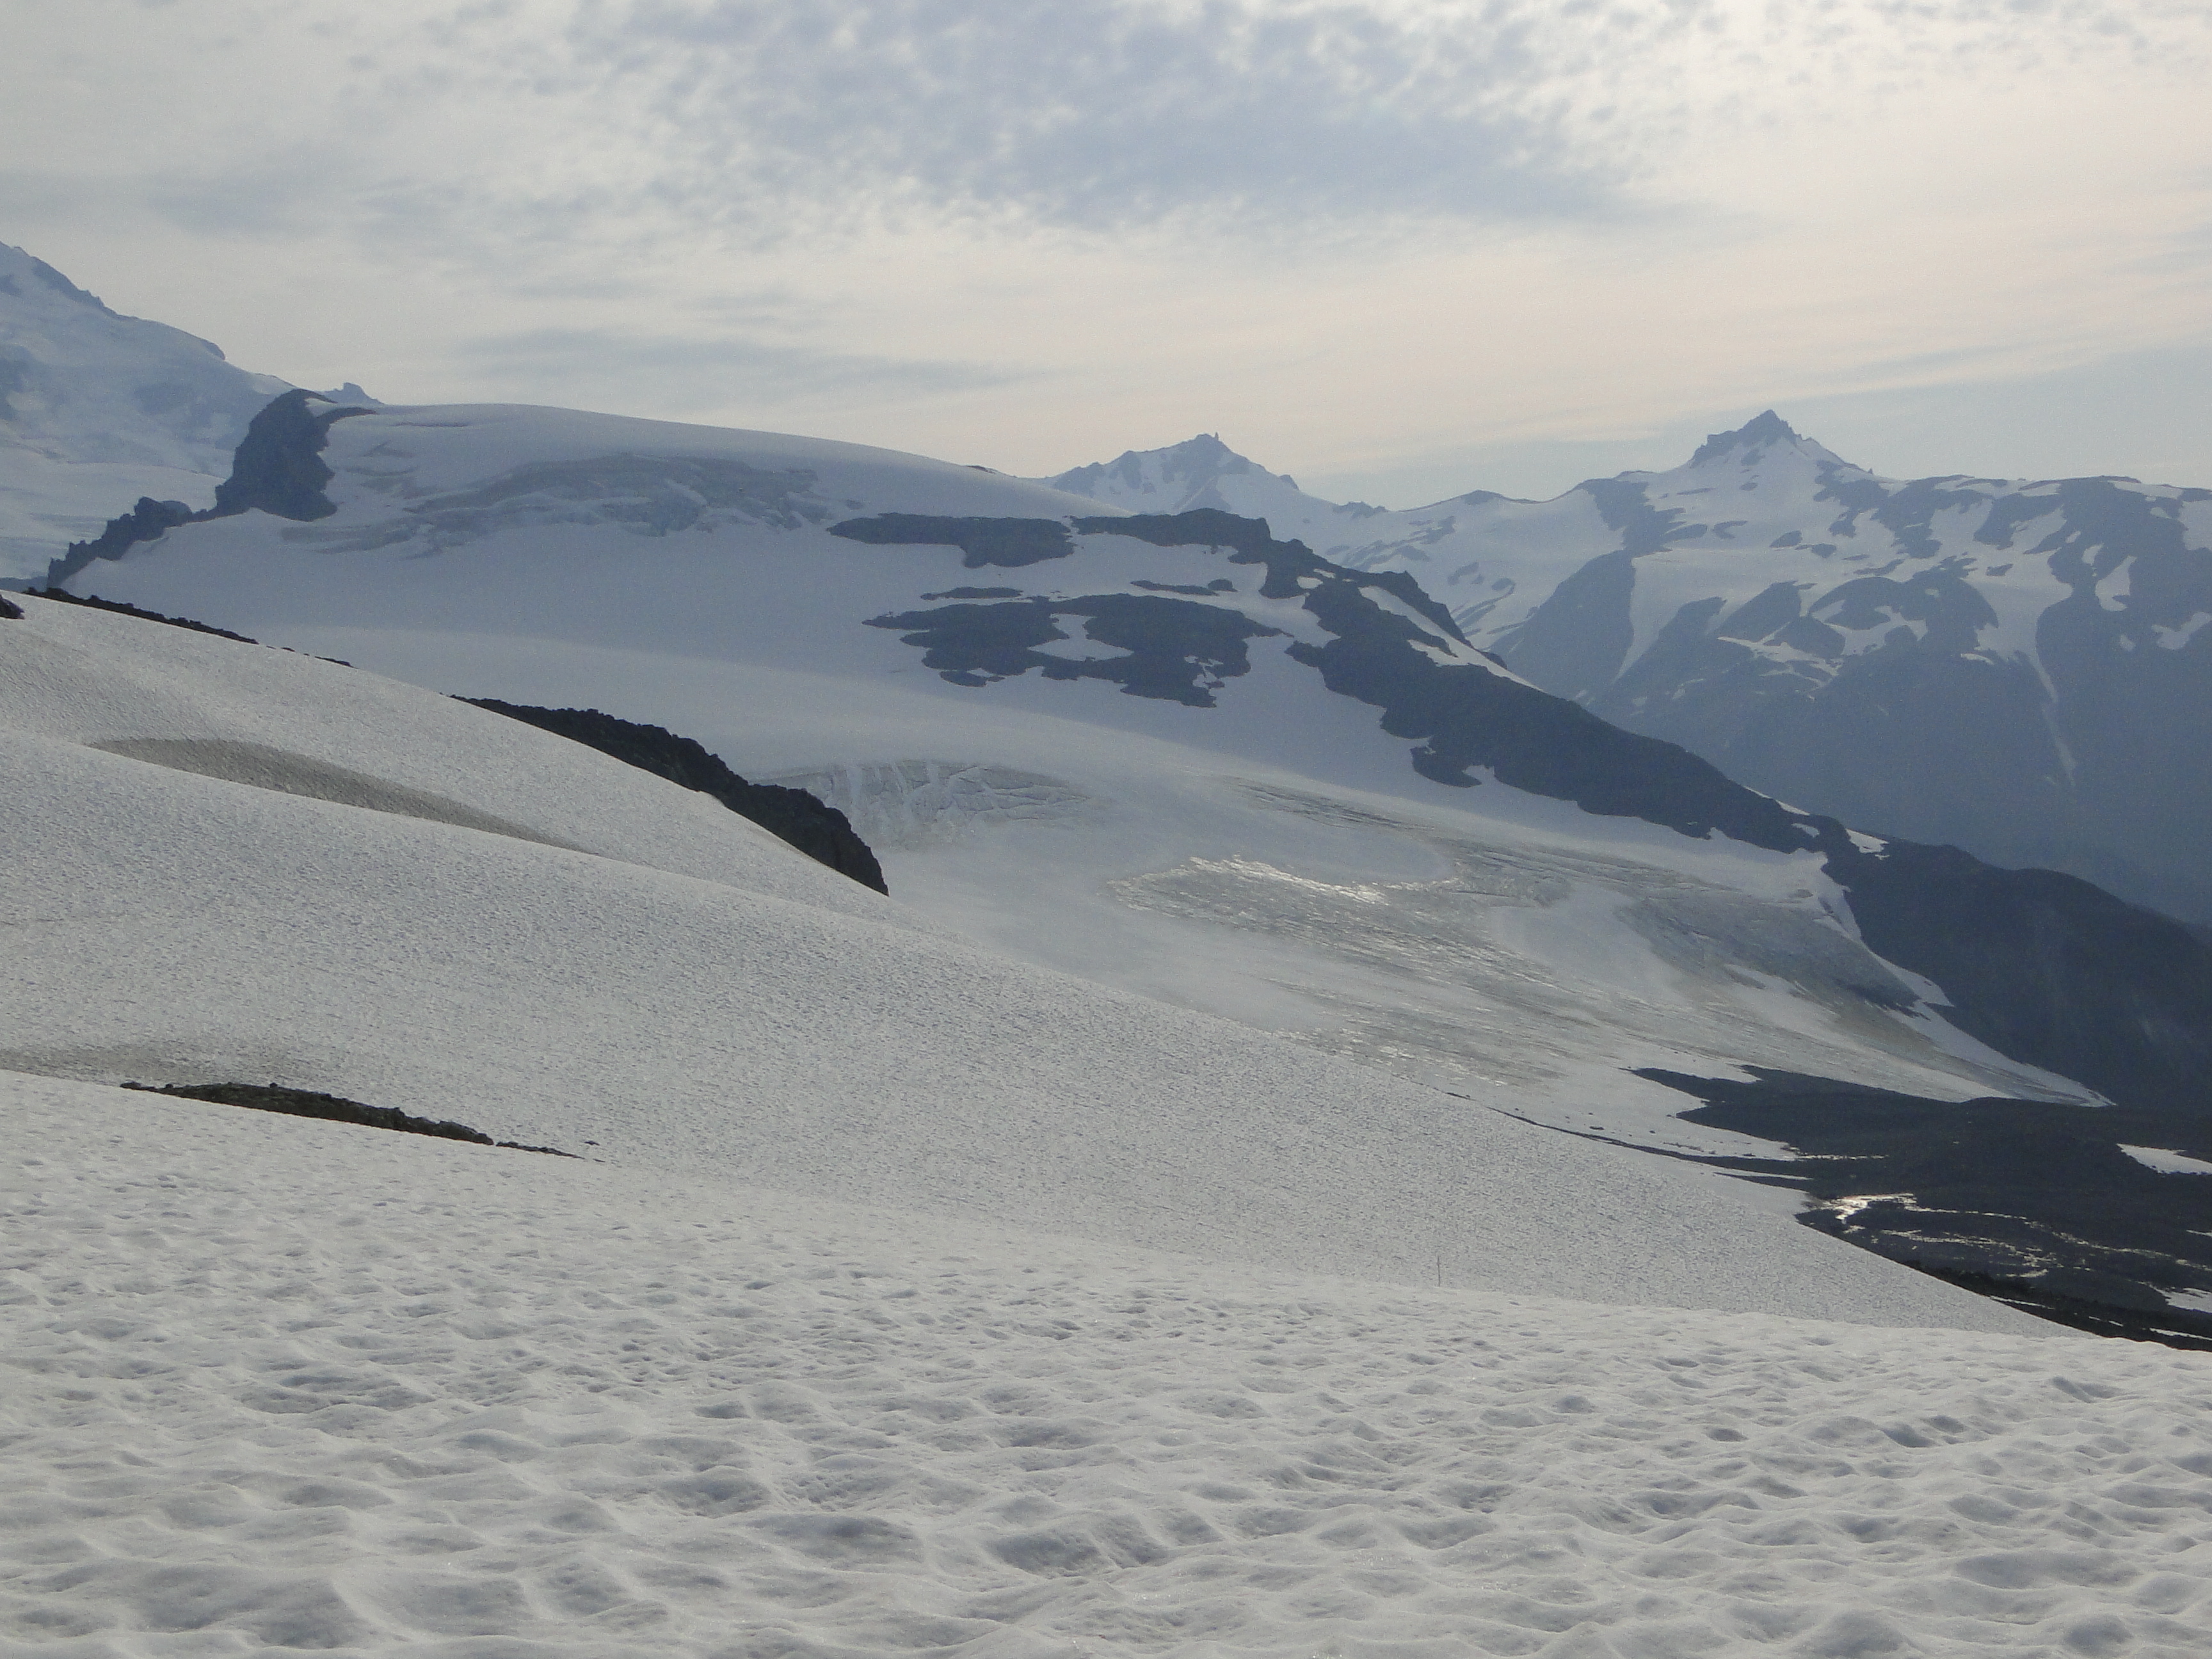
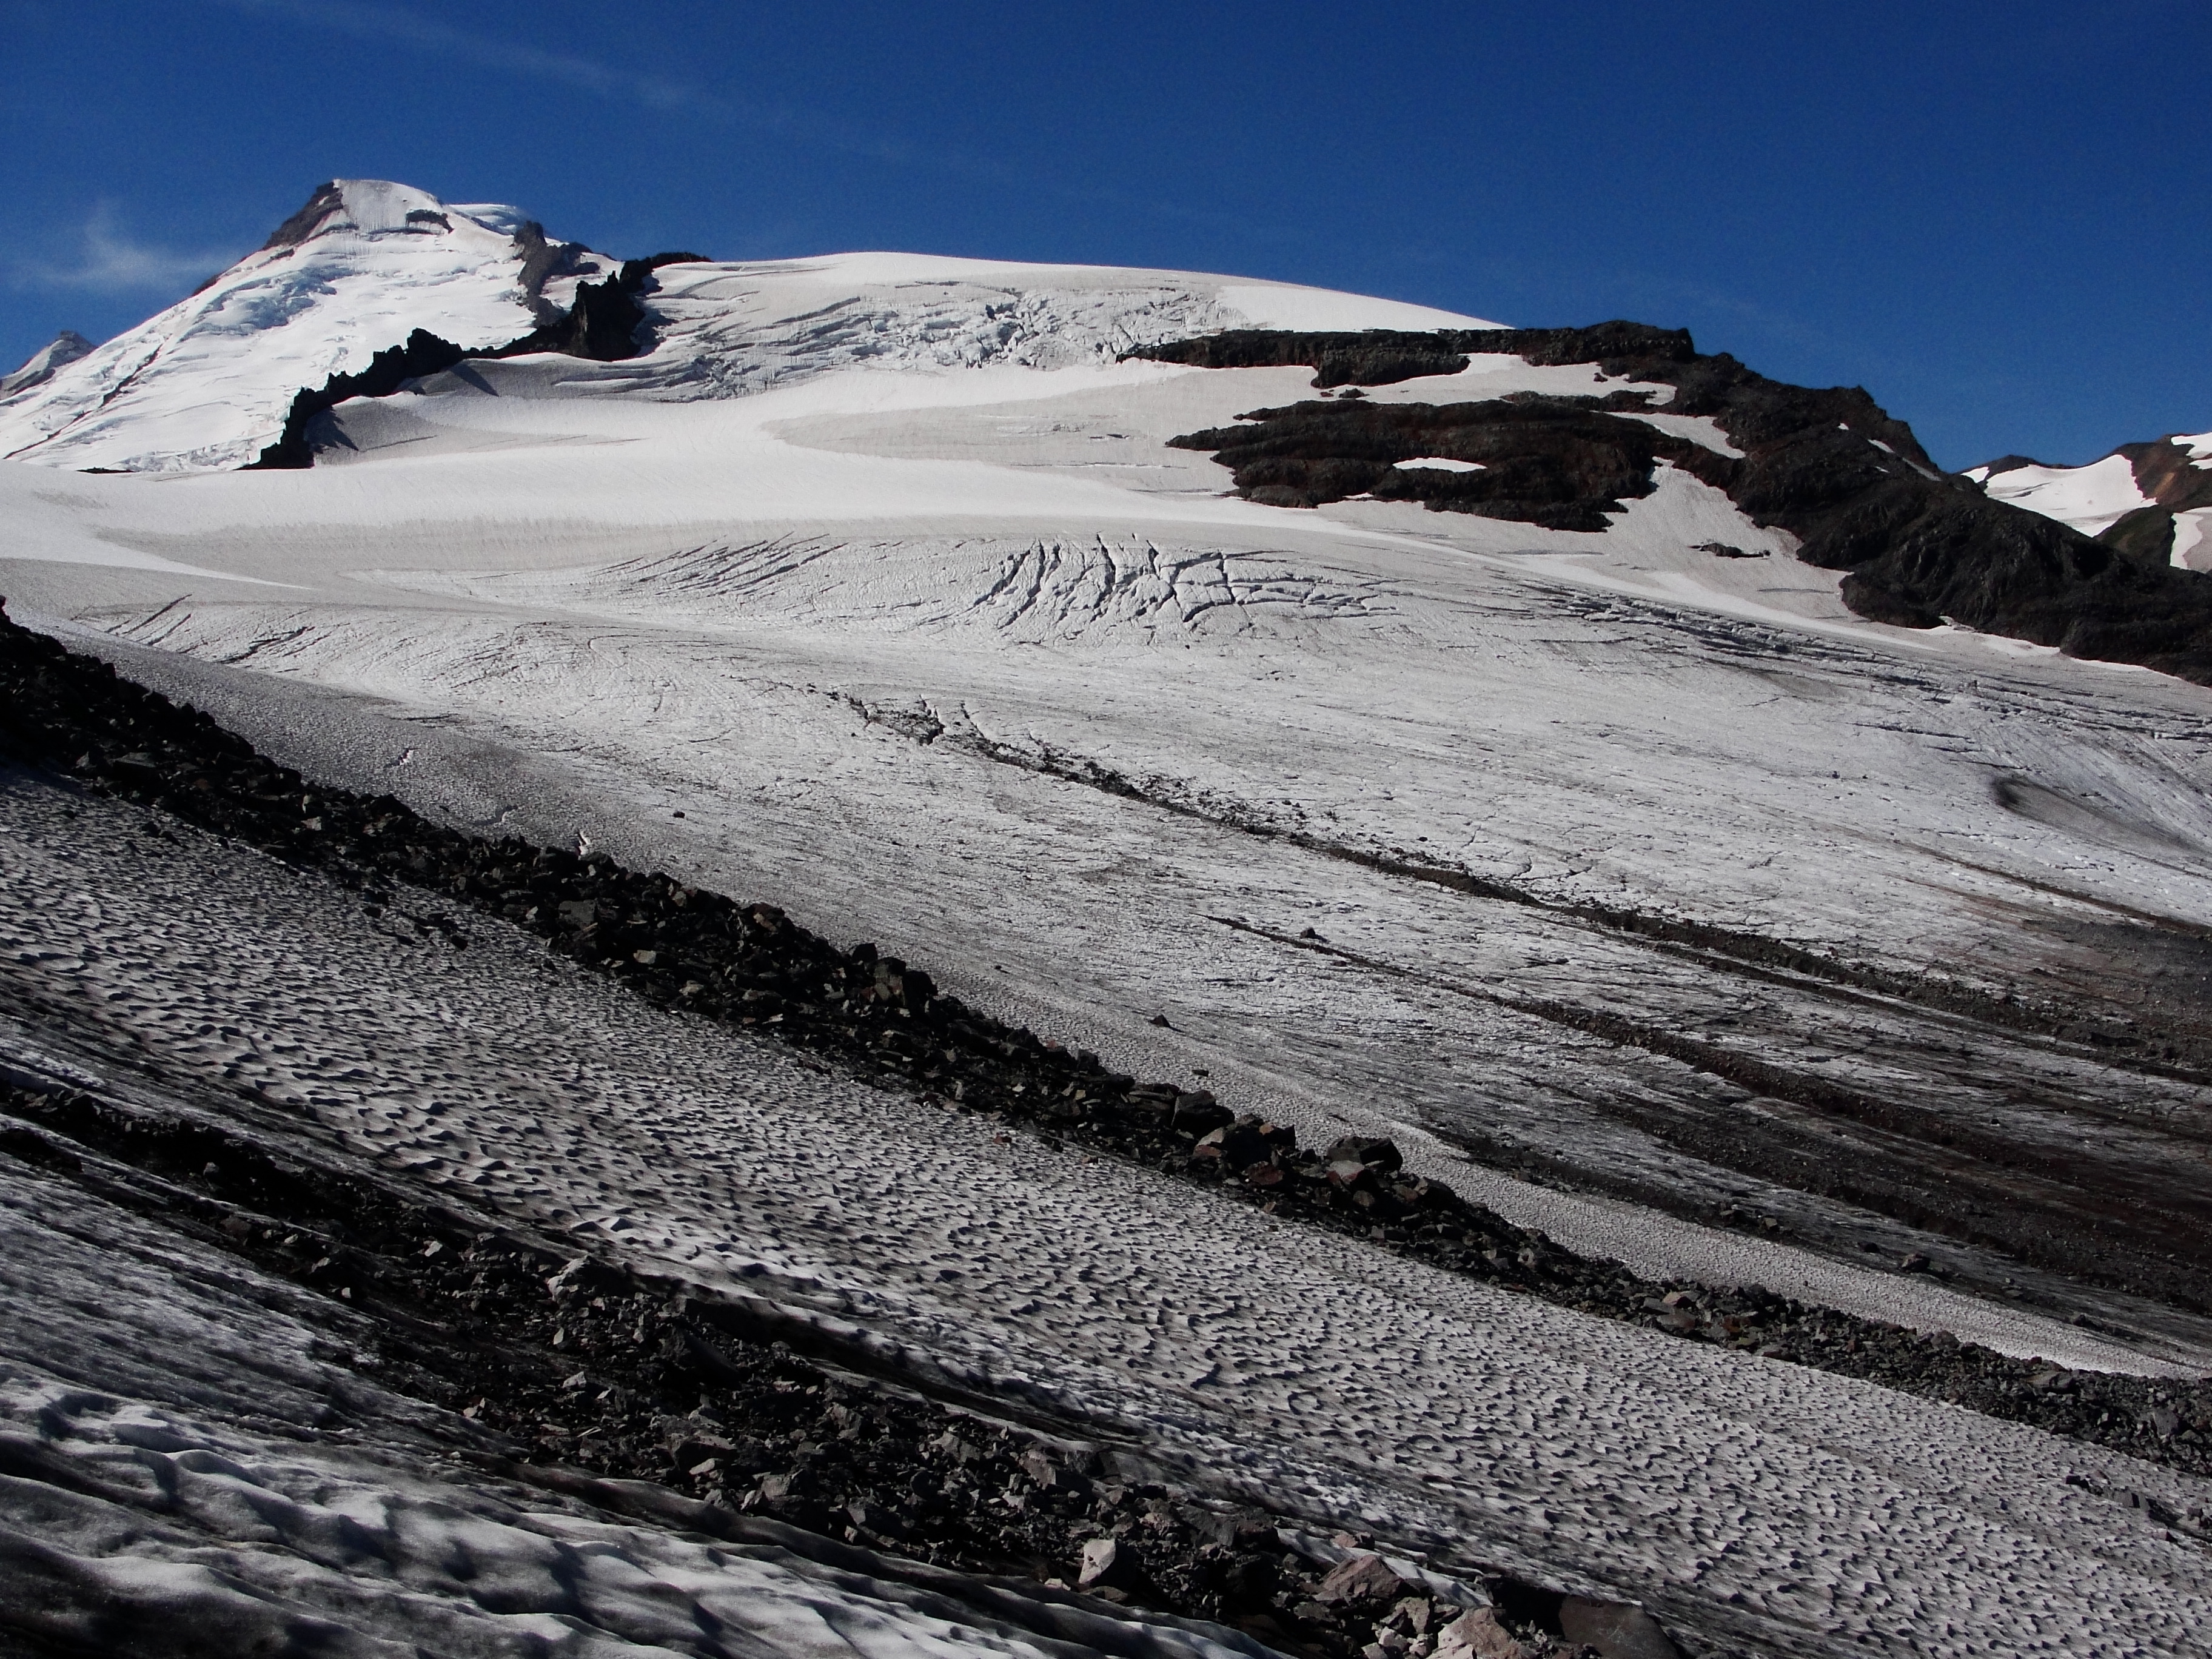
Sholes Glacier on August 7, 2014 and Sept. 15 2014, the glacier had lost 80% of its snowcover at this point an indicator of poor mass balance 2014.

Landsat 8 images of Sholes Glacier in 2014, with red line indicating snow line.
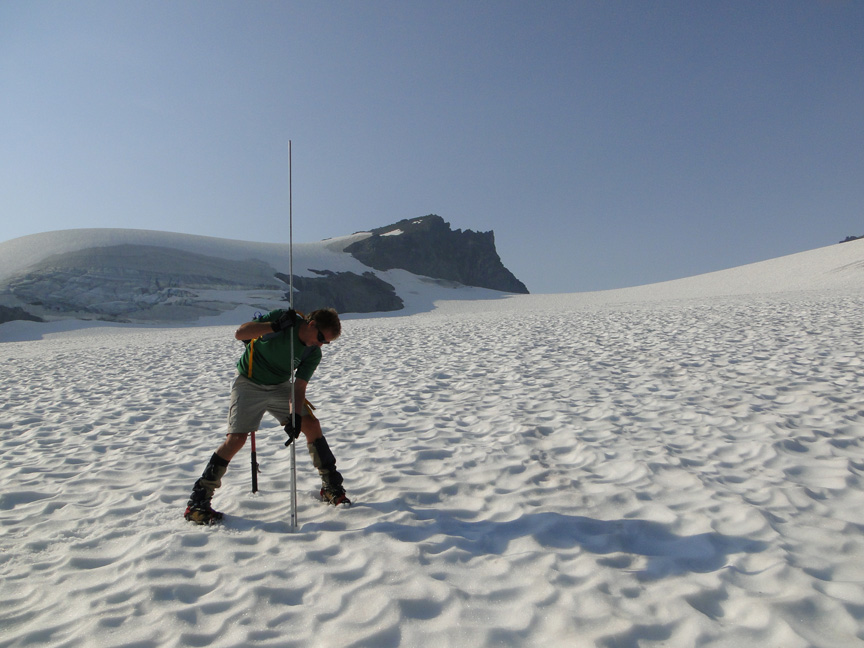
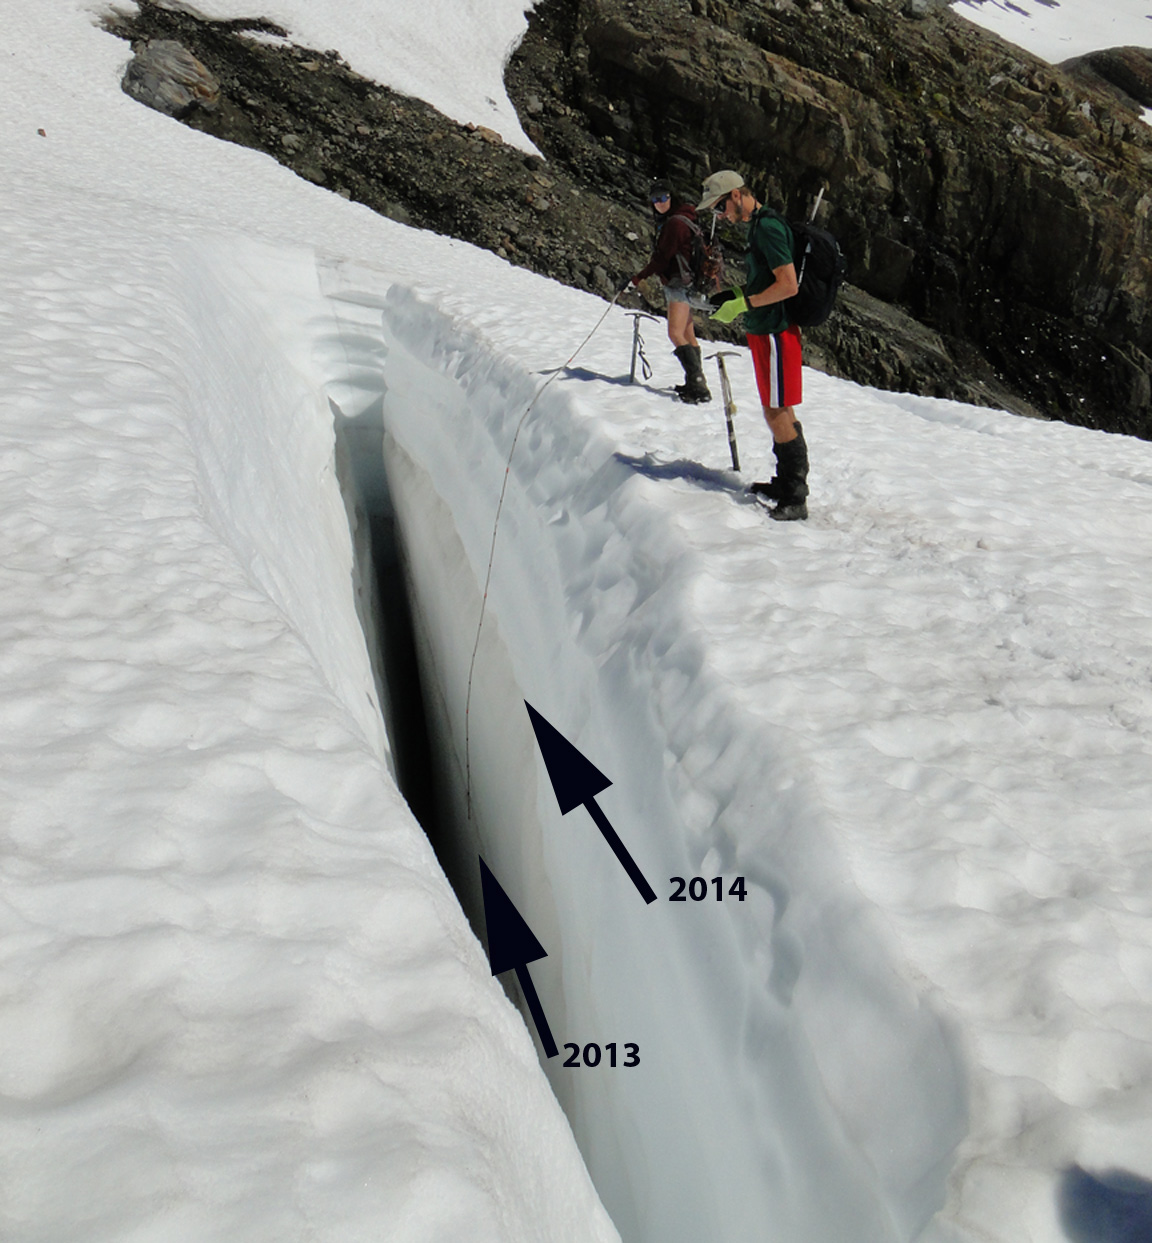
Measuring Accumulation on a glacier using Probing and crevasse stratigraphy.
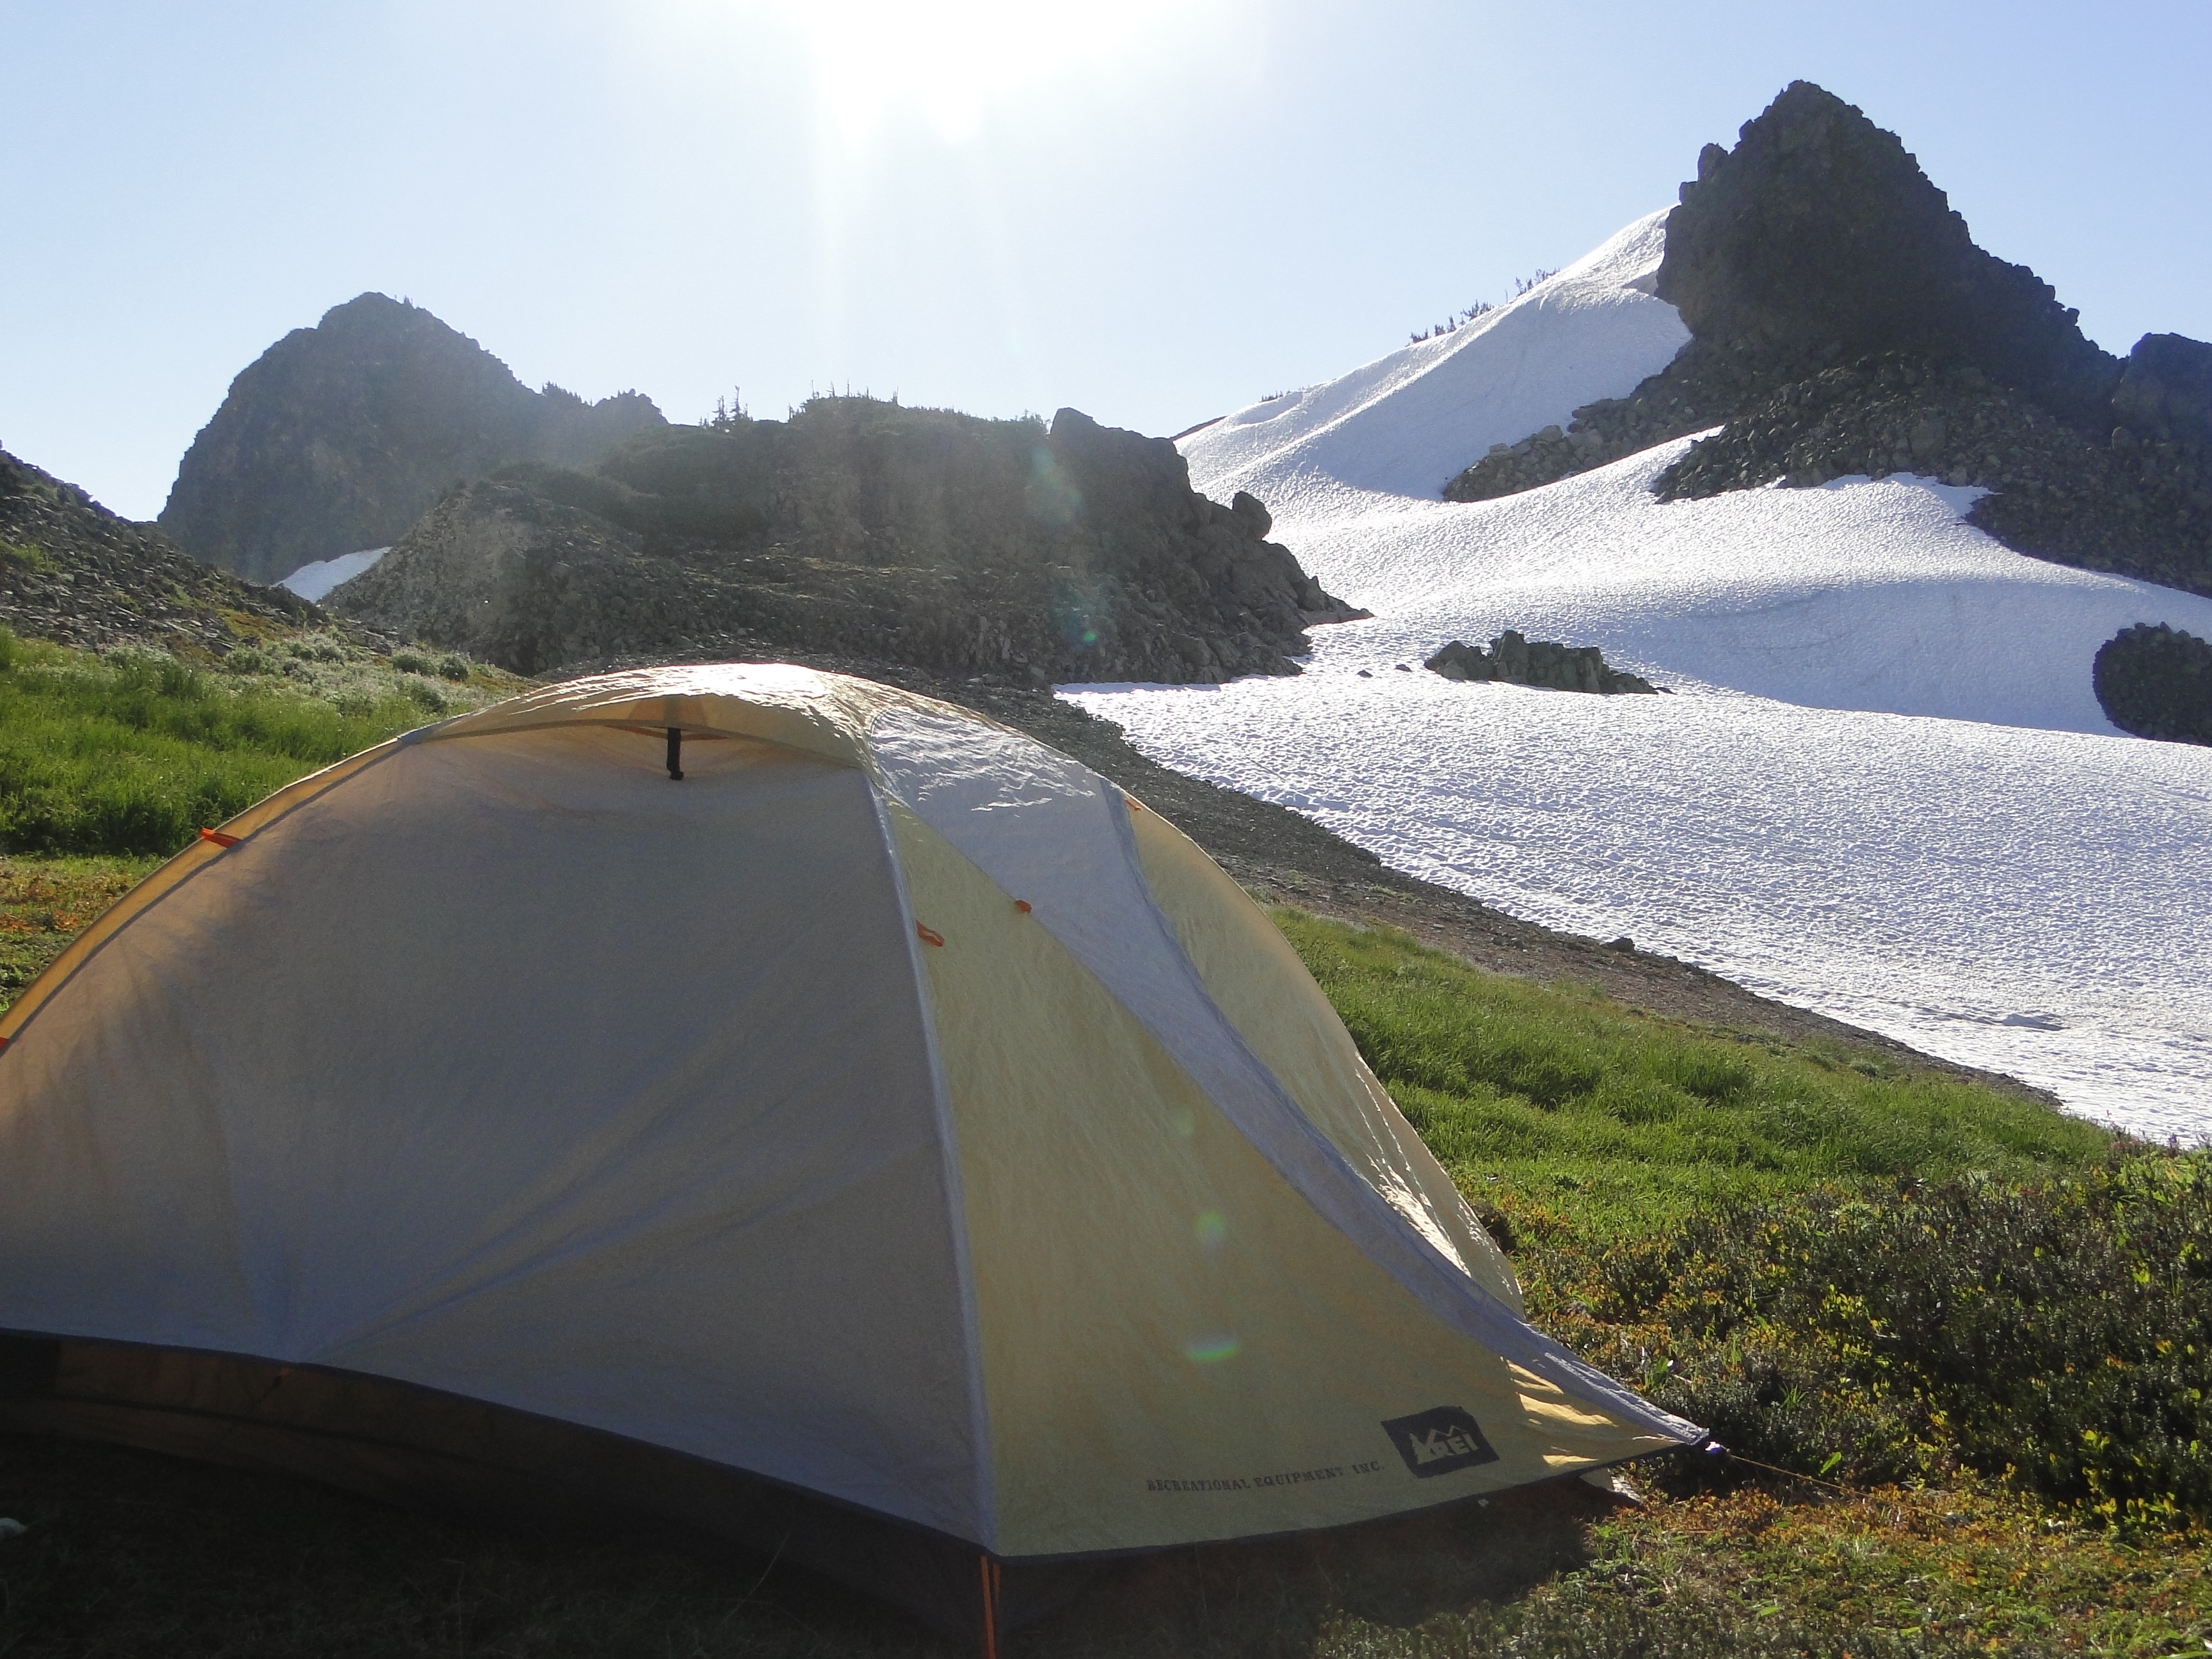
Base Camp where we have spent more than 100 nights in a tent in the last three decades.
 Despite the advantages of snow accumulation the glaciers mass balance since 1984 has average -0.5 m a year for a cumulative loss of 13 m. For a glacier that averages 60 m in thickness this is over 20% of its volume. Details of the