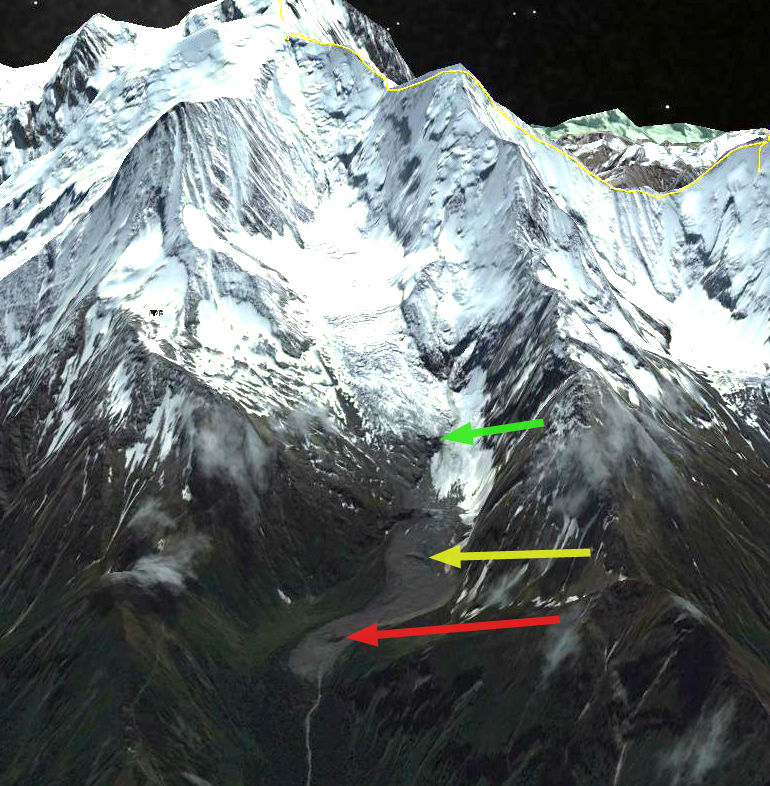
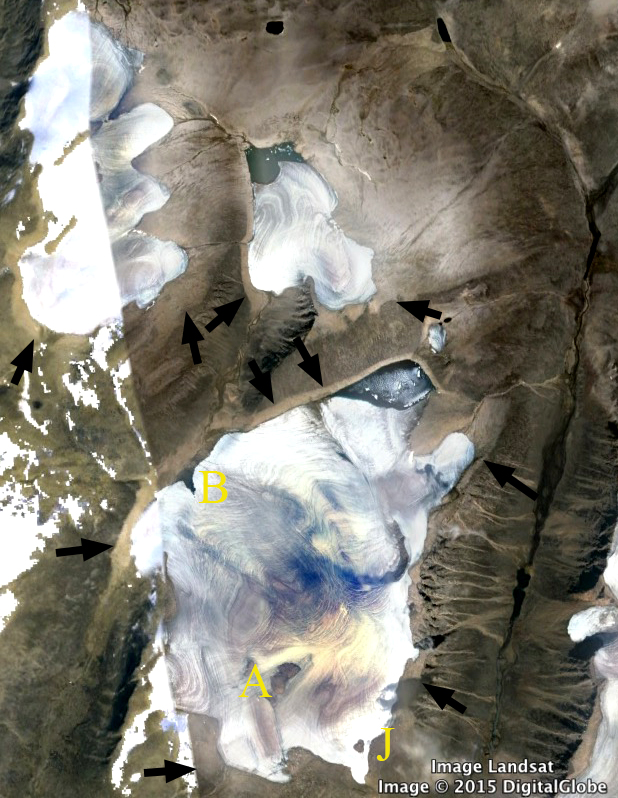
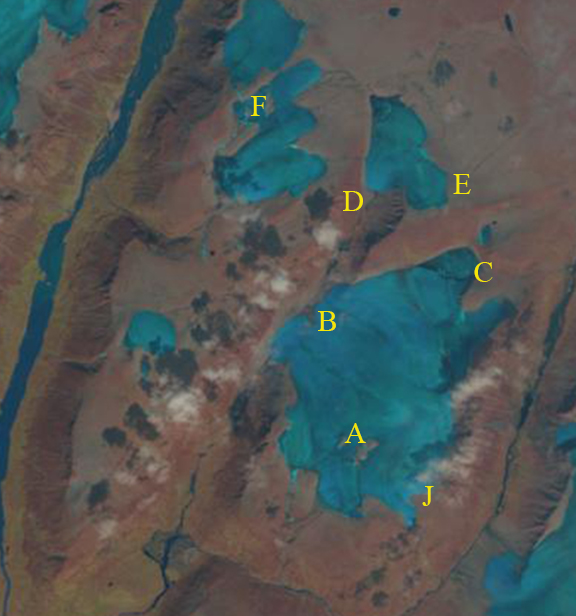
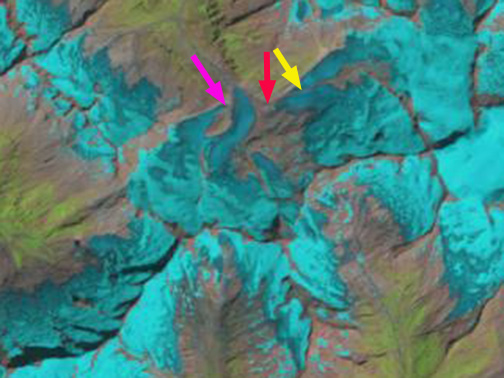
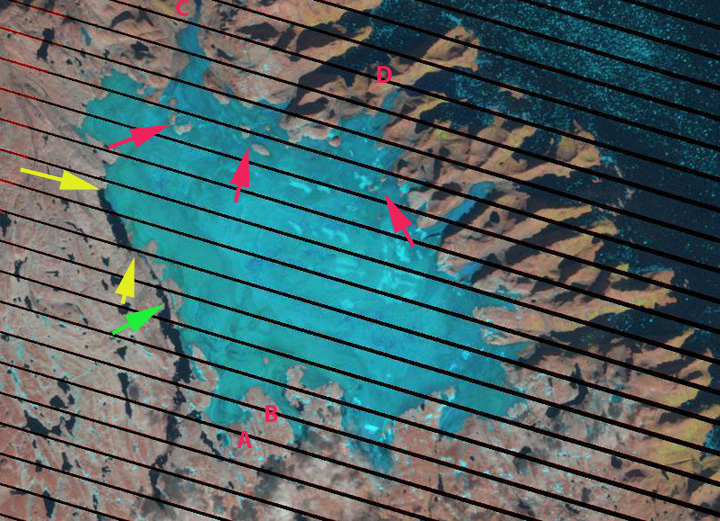
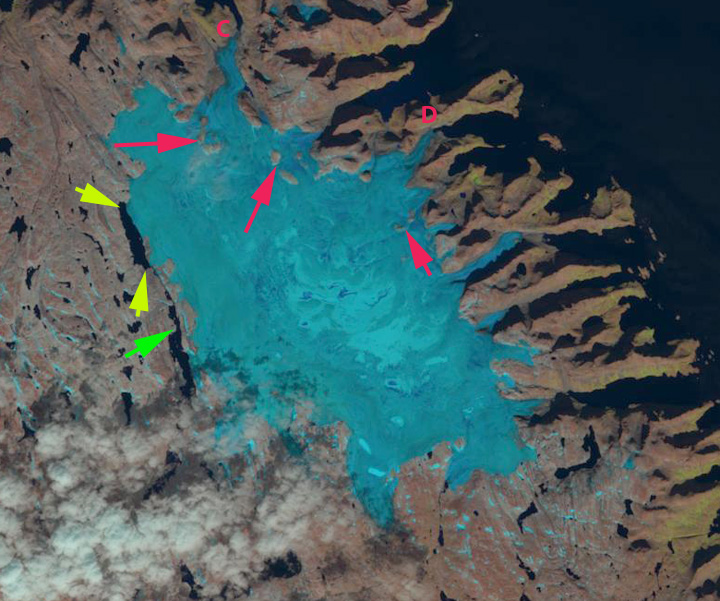
Figure 7.4. Vilkitskogo South Glacier (Vs) and Vilkitskogo North Glacier (Vn) compared in 1990 and 2015 Landsat images. Red arrows indicate 1990 terminus positions, yellow arrows 2015 terminus positions and purple arrows upglacier thinning.
Vilkitskogo Glacier has two termini that were nearly joined in Vilkitsky Bay in 1990. The glacier flows from the Northern Novaya Zemlya Ice Cap to the west coast and the Barents Sea. The glacier has been retreating like all tidewater glaciers in northern Novaya Zemlya (LEGOS, 2006). Carr et al (2014) identified an average retreat rate of 52 meters/year for tidewater glaciers on Novaya Zemlya from 1992 to 2010 and 5 meters/year for land terminating glaciers. For Vilkitskogo they indicate retreat into a widening fjord, and that the south arm has a potential bathymetric pinning point. The increased retreat rate coincides with the depletion of ice cover in the Barents Sea region and a warming of the ocean. Both would lead to increased calving due to more frontal ablation and notch development similar to at Svalbard (Petlicki et al. 2015)
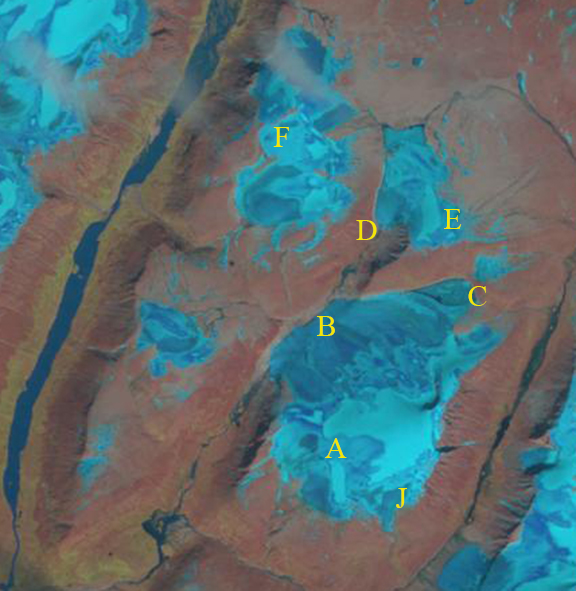
The north and south glaciers both terminated at the mouth of their respective fjords in 1990, with the southern arm ending on a small island/peninsula extension. In 1994 there is limited evident retreat. By 2001 embayments had developed particularly along the peninsula separating them. By 2015 Vilkitskogo North has retreated 5000 m along the northern side of the fjord and 4000 m along the south side since 1990. This fjord has no evident pinning points, and the rapid calving retreat should continue. Vilkitskogo South has retreated 1000 m on the west side and 1800 m on the east side.The retreat has exposed a new island in the center of the glacier. The glacier is currently terminating on another island. Retreat from this pinning point will allow more rapid retreat to ensue. Upglacier thinning is evident in the expansion of bedrock areas and medial moraine width, purple arrows. This indicates the retreat will be ongoing. There is still a large are of snowcover across the summit of the ice cap each year. The retreat has the same unfolding story as Krivosheina, Nizkiy and Glasova Glacier

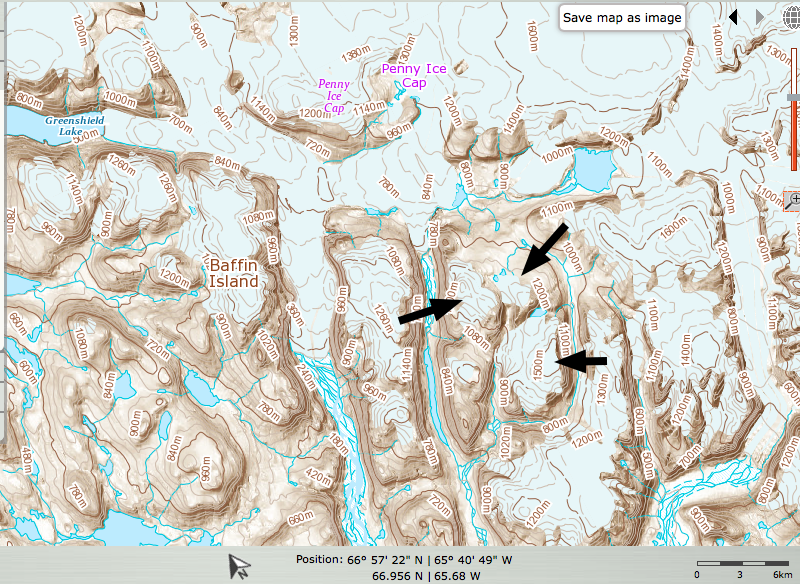
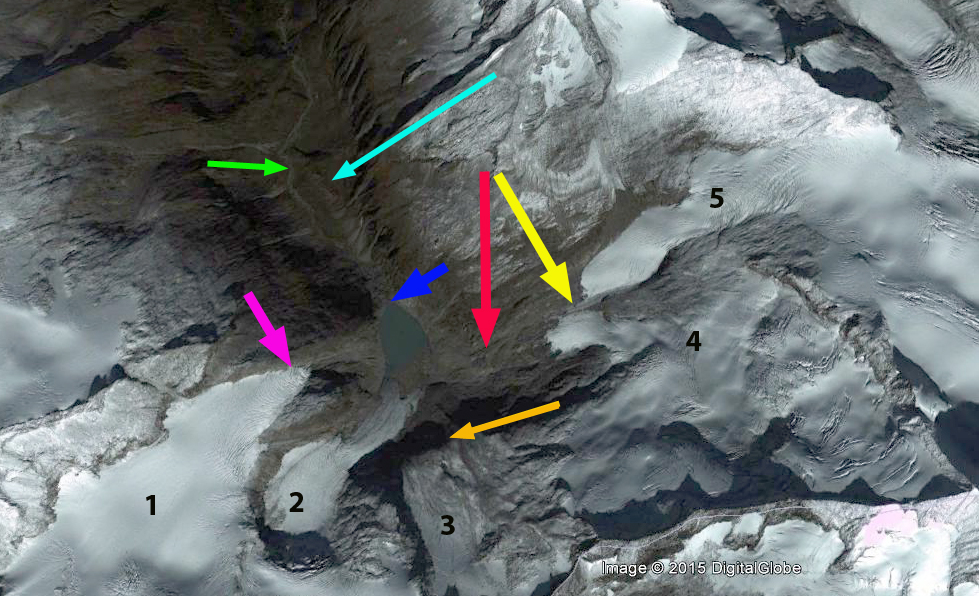
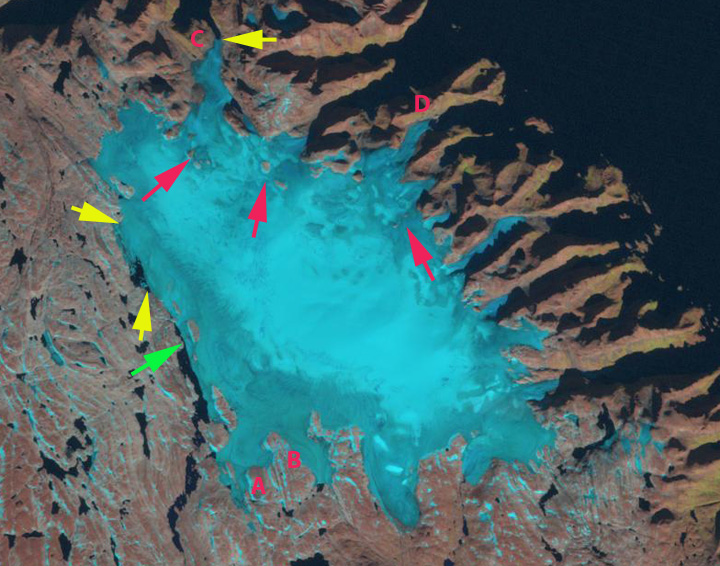
1994 Landsat Image

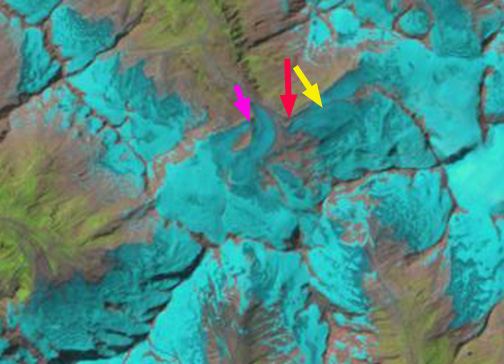
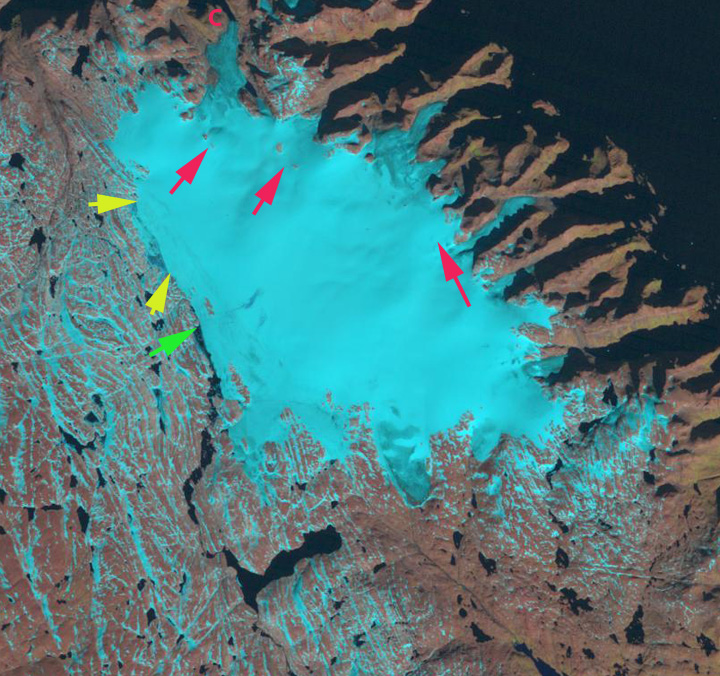
2001 Landsat image