
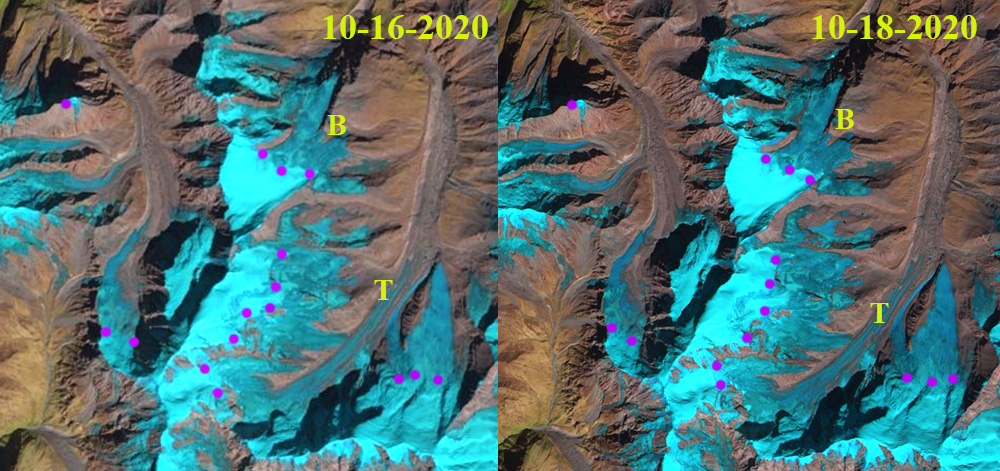
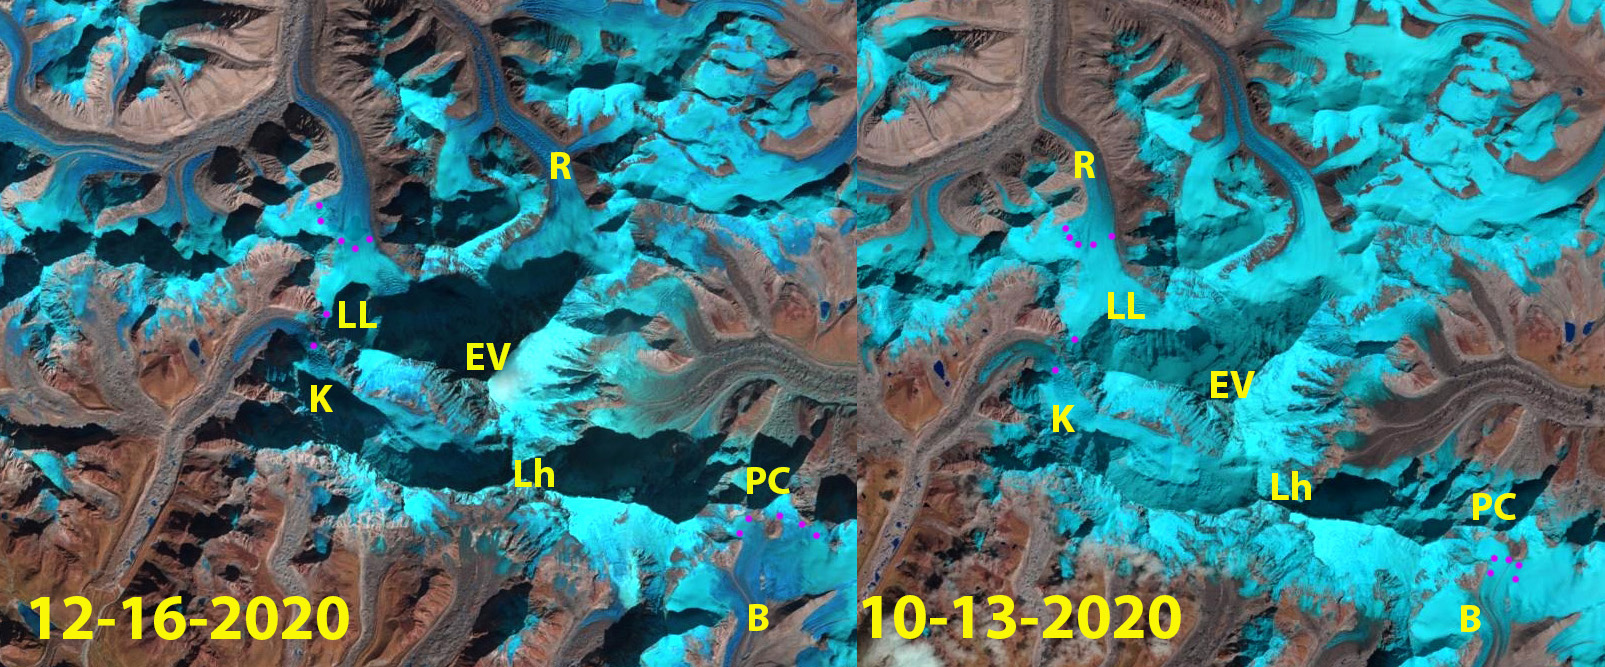
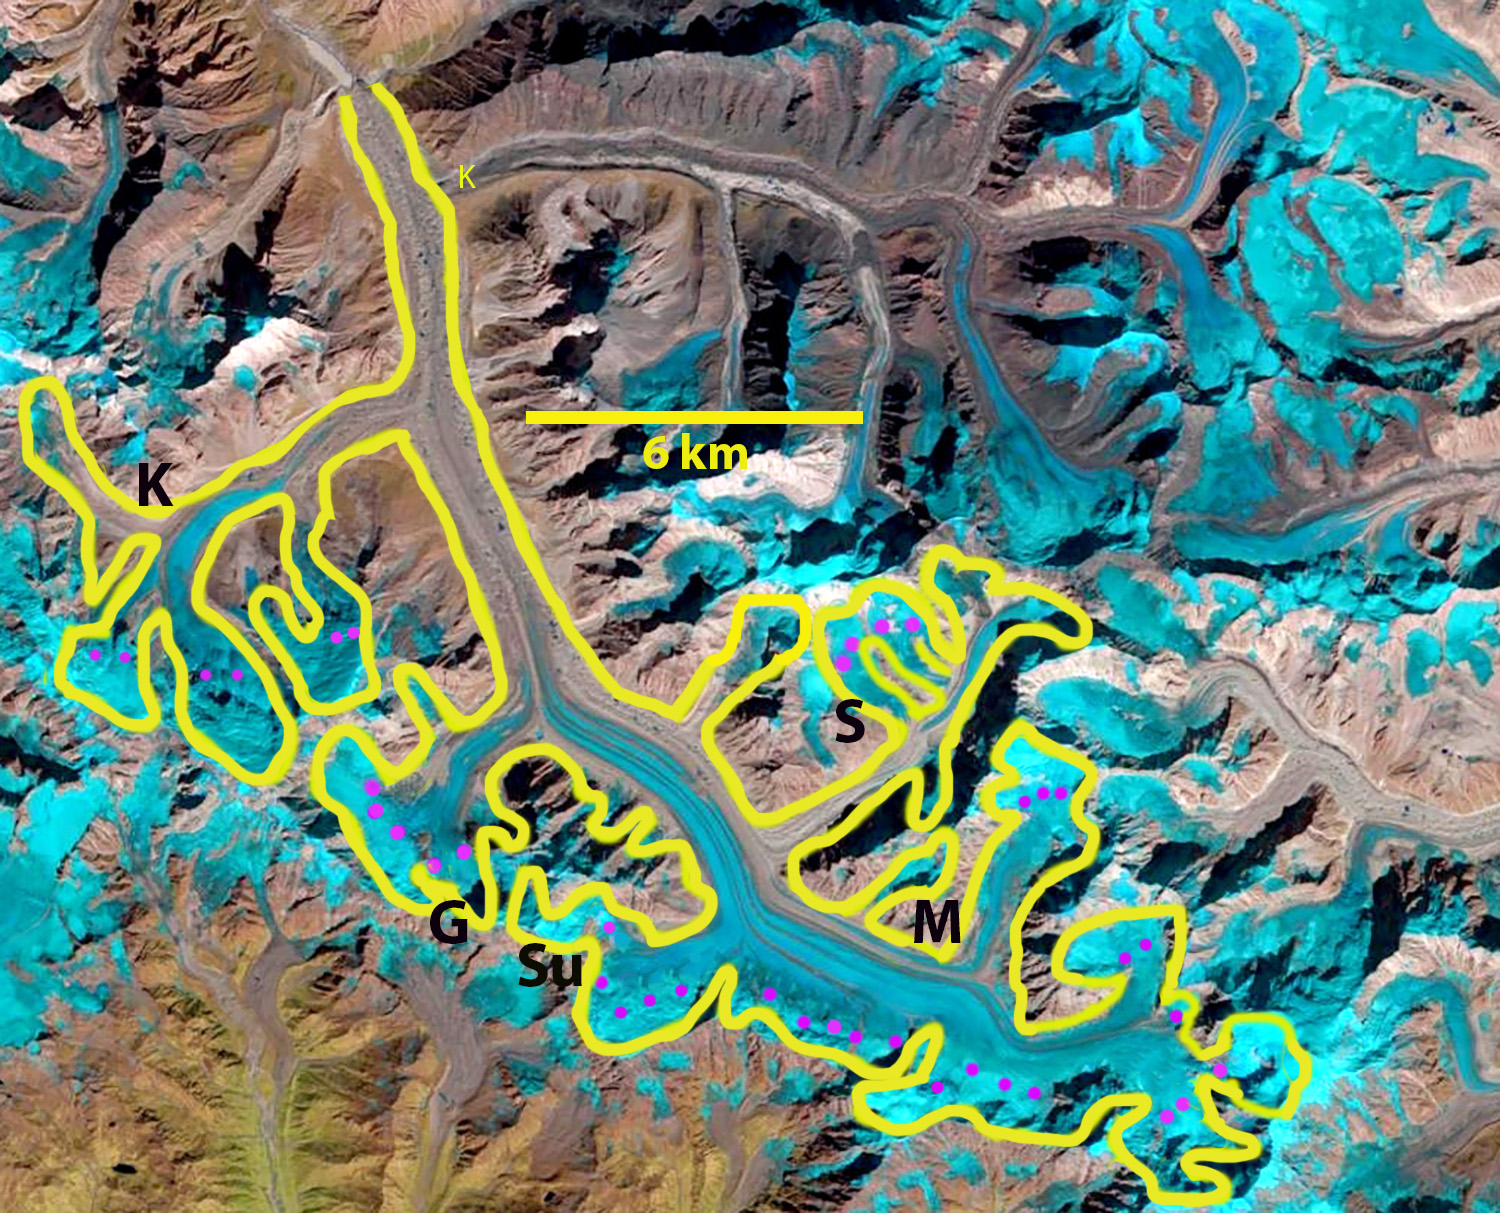
Snowline elevation on Trisul (T) and Bethartoli Glacier (B) in a 10-26-2020 Landsat and 10-18-2020 Sentinel image. The snowline ranges from 5800-6000 m, purple dots.
The catastrophic landslide and resulting flood in the Rishi Ganga basin Uttarakhand, India on Feb. 7 was triggered on a formerly glaciated slope at 5600 m detailed in a blog post by Petley (2021). This event occurred after a post-monsoon season featuring high snowlines on adjacent glaciers and the warmest January in the last six decades in Uttarakhand, India. Glacier snowlines are a proxy for the elevation where melting predominates. Were these preconditioning factors? Here we examine the elevation of the glacier snowlines in 2020.
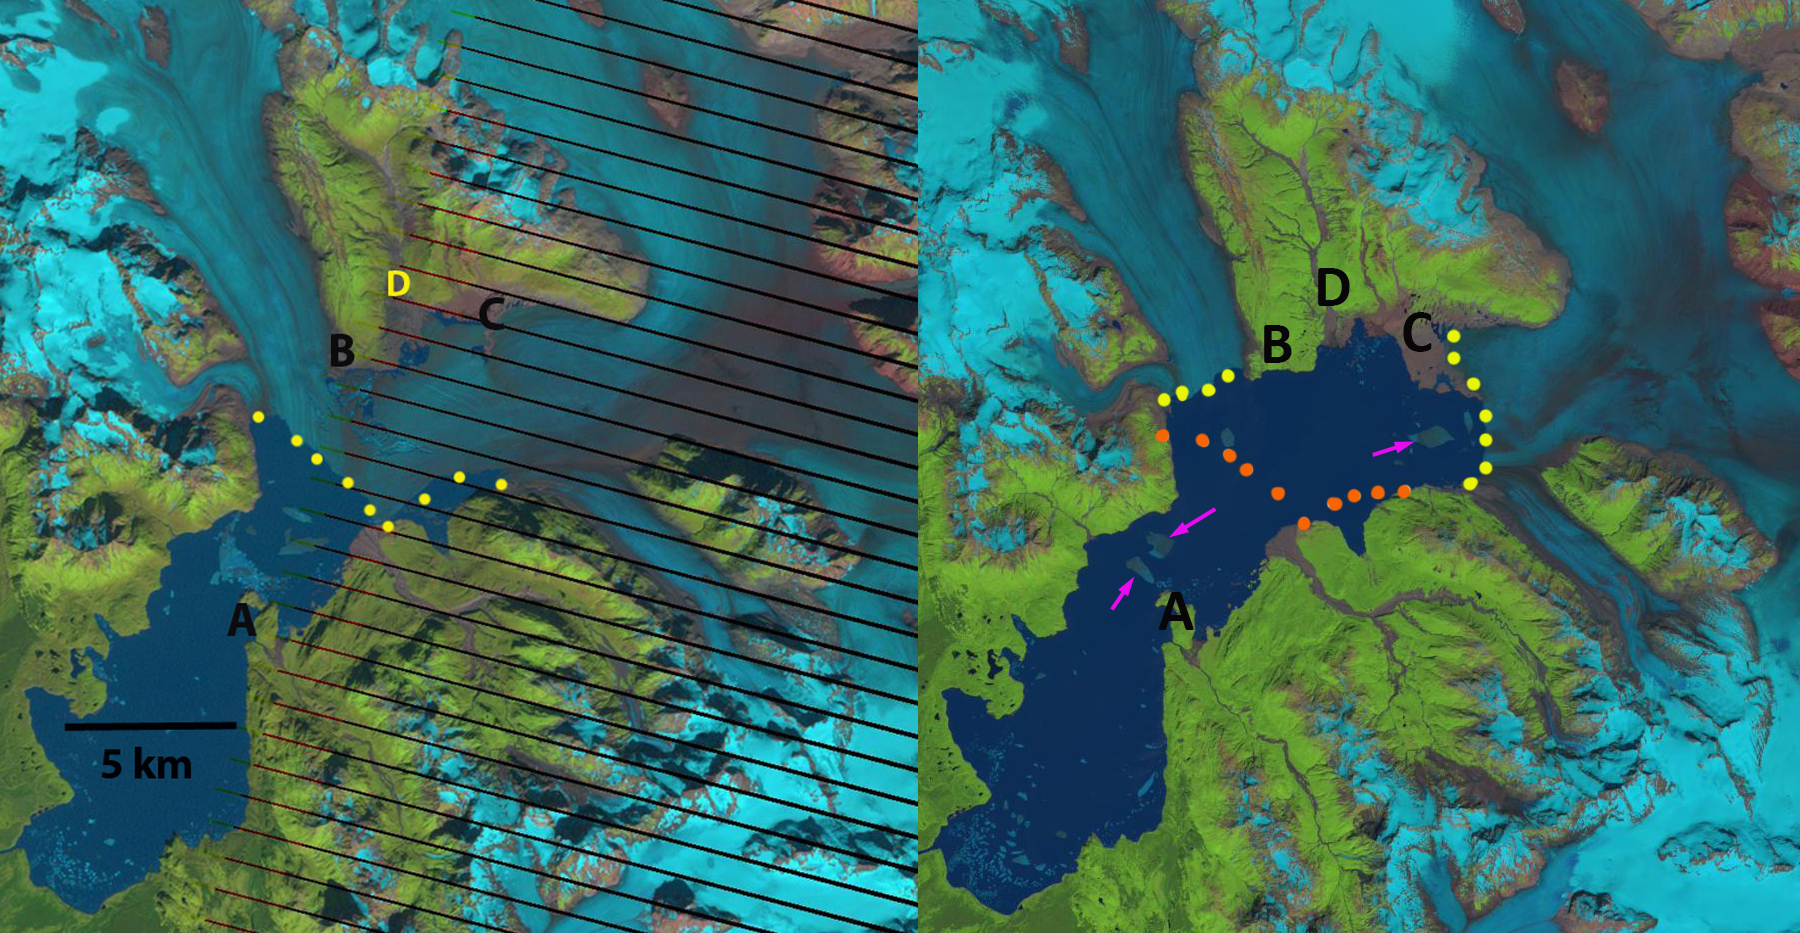
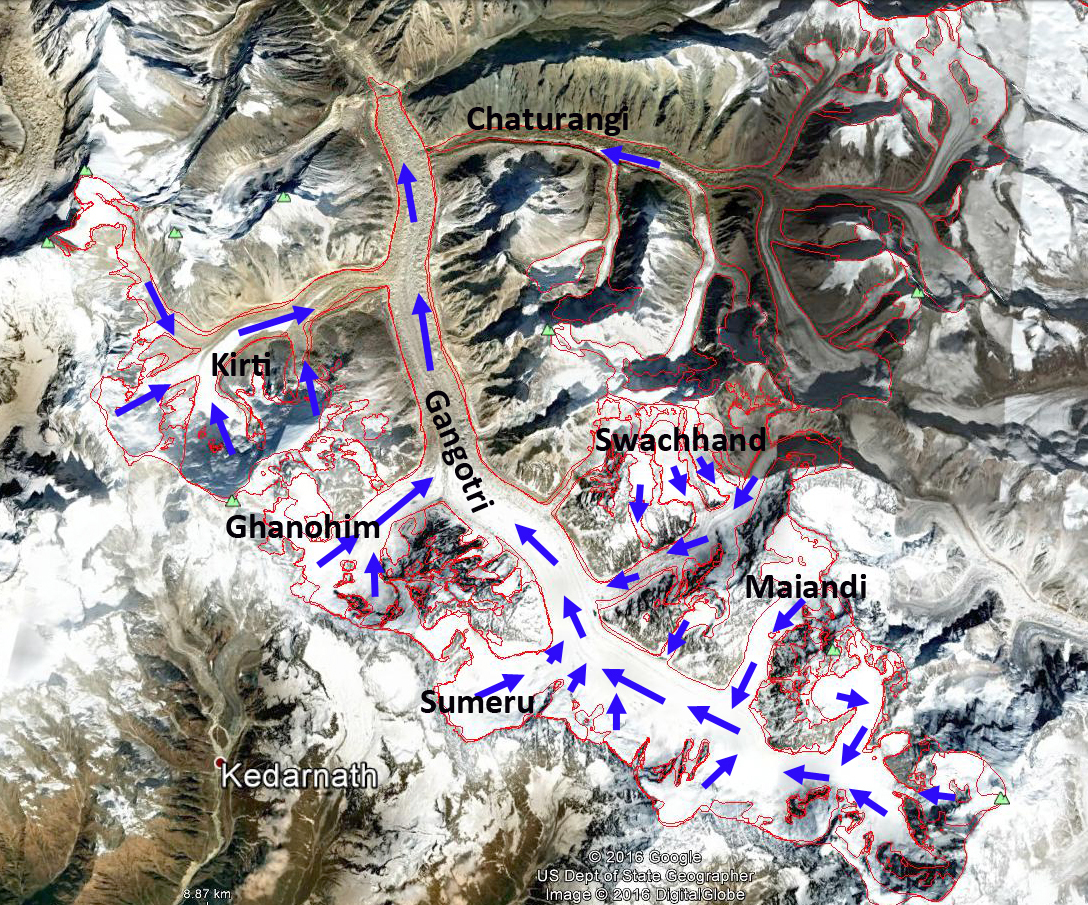
The headwaters of the Rishi Ganga Basin, India feature a number of large glaciers draining the slope of Nanda Devi, Trisul and other high Himalayan peaks. The response of glaciers of the Rishi Ganga basin to climate change was examined by Kumar et al, (2020). They found a 10% reduction in glacier area from 1980-2017. They further observed the ELA to fluctuate from 5200-5700 m.
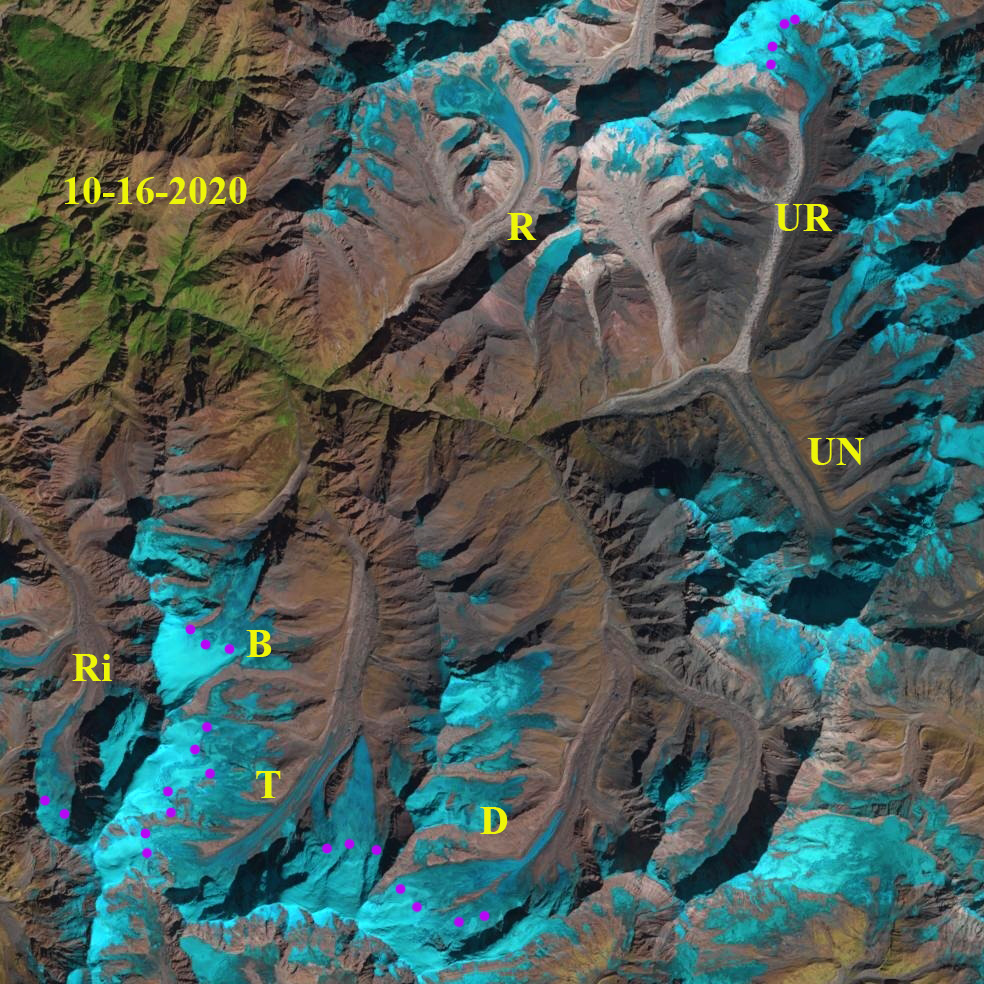
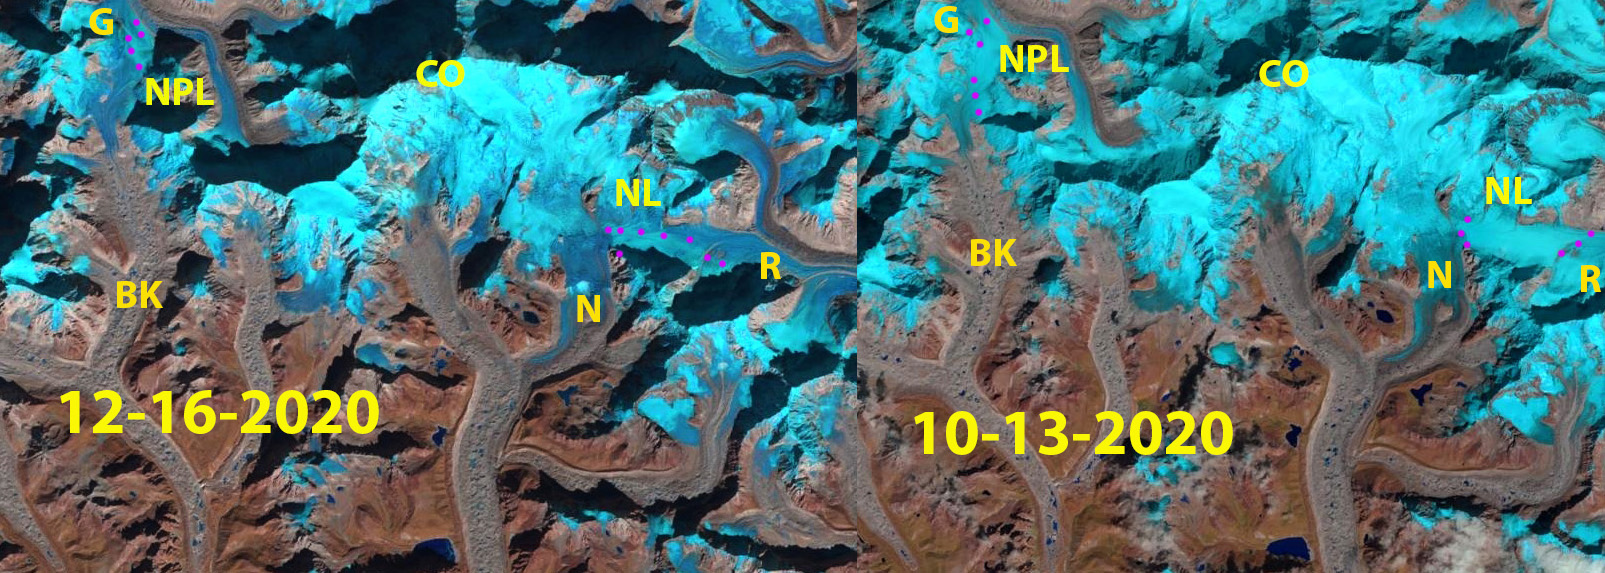
Nanda Devi region glaciers in 10-16-2020 image indicating the snowline at between 5800 and 6000 m on all the glaciers in the upper Rishi Ganga: Bethartoli (B), Dakshini (D), Ramani (R), Rinti (Ri), Trisul (T), Uttar Nanda Devi (UN), Uttar Rishi (UR).
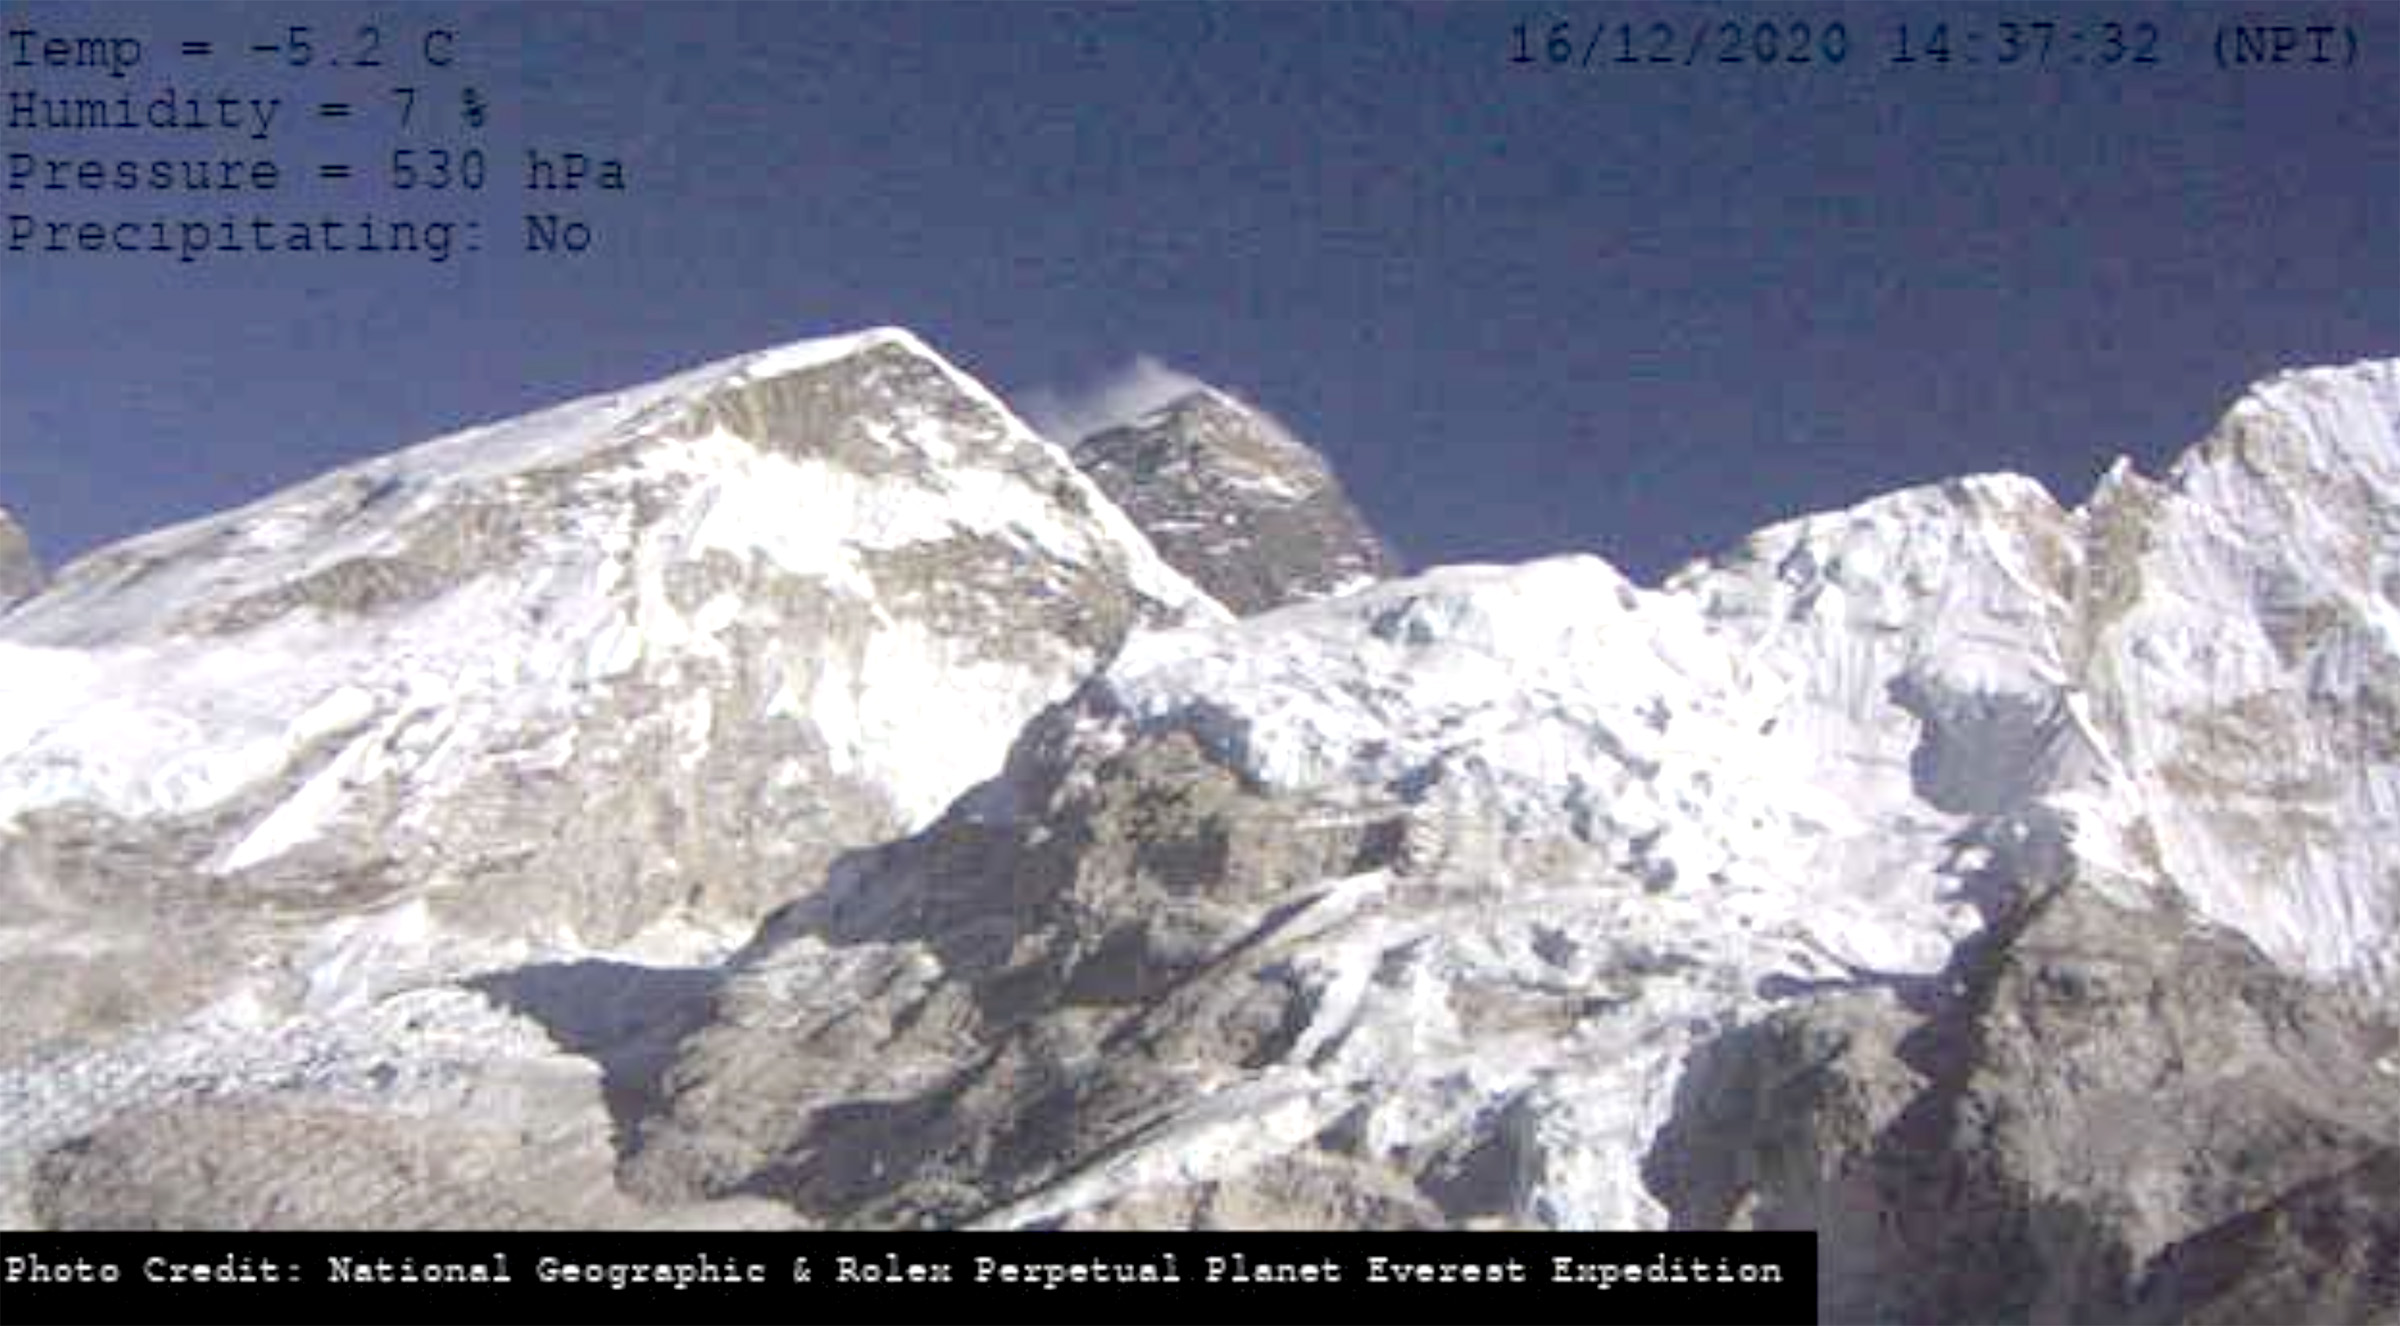
In 2020 at the end of the summer monsoon the snowline on glaciers in the Rishi Ganga Basin were high at 5600-5700 m on Sept.13 as noted in particular on Trisul (T), Rinti (Ri), Ramani (R), Uttar Rishi (UR), Uttar Nanda Devi (UN), Dakshini (D) and Bethartoli Glacier (B) and an Rinti Glacier to the west that the landslide debris ended falling below. By mid October the snowline on the glaciers had risen to ~5800-6000 m on these seven glaciers in Landsat and Sentinel imagery. On Ramani Glacier there is no retained snowpack with the top elevation of the glacier at 5800 m. The amount of dark blue bare ice is striking. The snowline indicates an elevation that the freezing level during that year frequently rose above. This indicates the freezing line rose above the trigger elevation site ~5600 m frequently enough in 2020 that melting exceeded snowfall. This is higher than Kumar et al (2020) had observed during the recent period of increased glacier snow lines. By January 11, 2021 the area was blanketed by snow down to 4400 m, the subsequent warm period led to widespread melting and snow cover loss up to at least 5000 m on Trisul Glacier and Uttar Rishi Glacier. The freezing line and glacier snowline elevations in the post monsoon period are similar to near Mount Everest, where the January warmth led to even greater high elevation melt (NASA, 2021).
Whether the unusually high elevation melting and freezing levels observed on glaciers in the region in 2020 were pre-conditioning cannot be answered with analysis such as this, but it does demonstrate the the elevation range of landslide initiation was below the observed glacier snow lines in 2020 and in an elevation zone that experienced unusual melt conditions in 2020. The increased freezing levels in the region over the last several decades were documented for the Mount Everest area by Perry et al (2020),indicative of a long term trend.
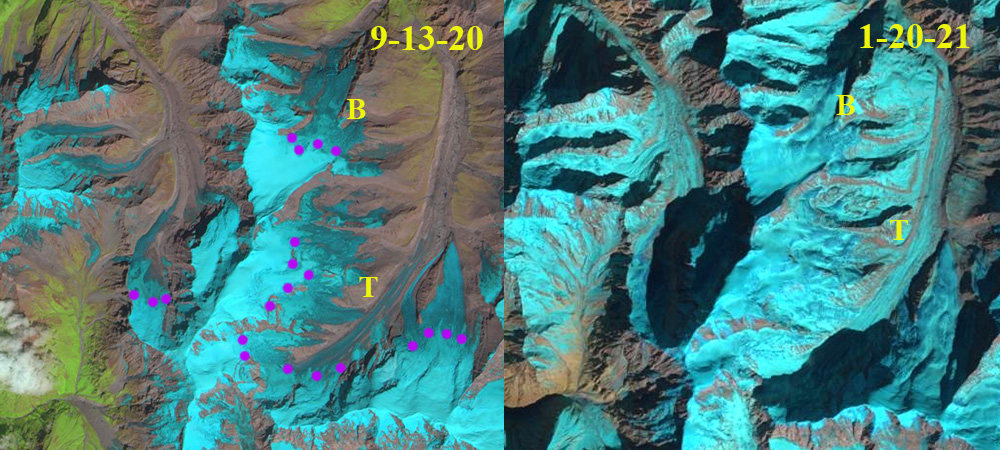
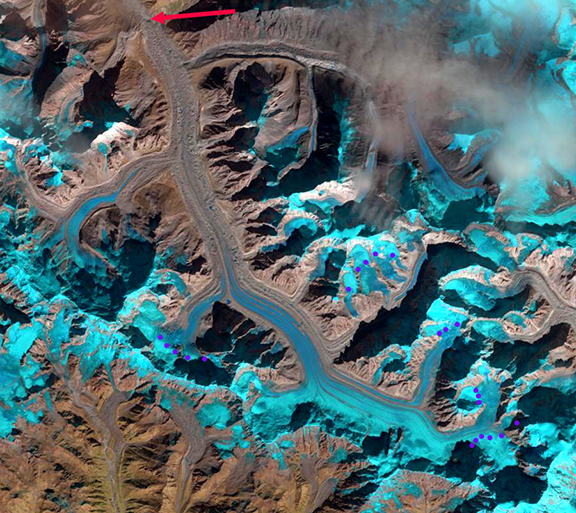
Snowline elevation on Trisul (T) and Bethartoli Glacier (B) in a 9-13-2020 Landsat and 1-20-2021 Sentinel image. The snowline ranges from 5600-5700 m in September.


