The North Cascade Glacier Climate Project 2020 field season was our 37th consecutive year of glacier observations. The field team consisted of Cal Waichler, Mariama Dryak, Jill Pelto and Mauri Pelto. Each team member has studied glaciers on more than one continent and is passionate about science communication, using either art, videography or writing.

Mauri Pelto, Jill Pelto, Cal Waichler and Mariama Dryak from left to right on Easton Glacier the 2020 field team (Jill Pelto Photograph).
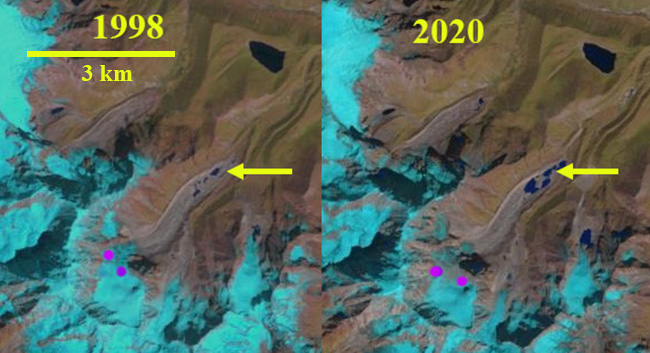
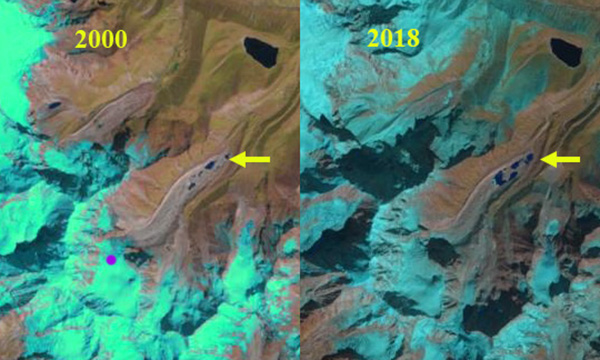
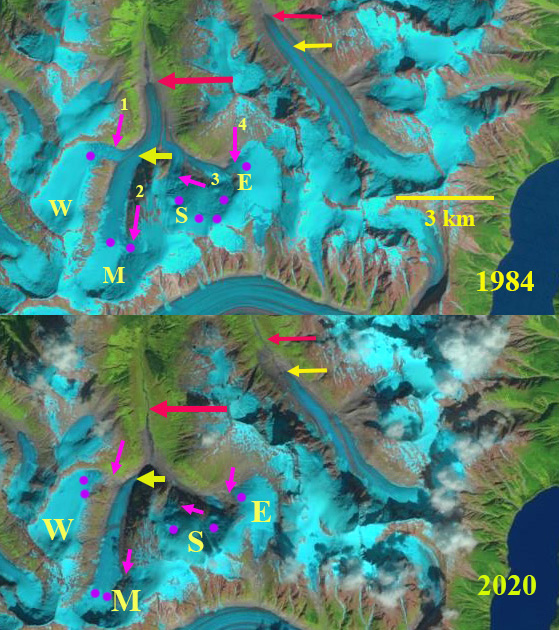
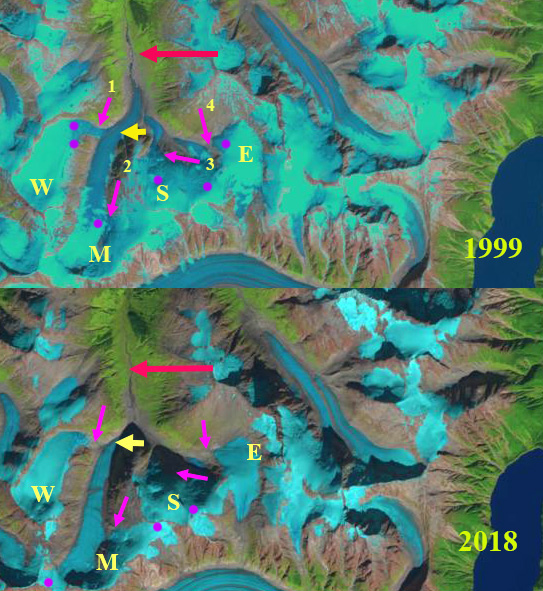
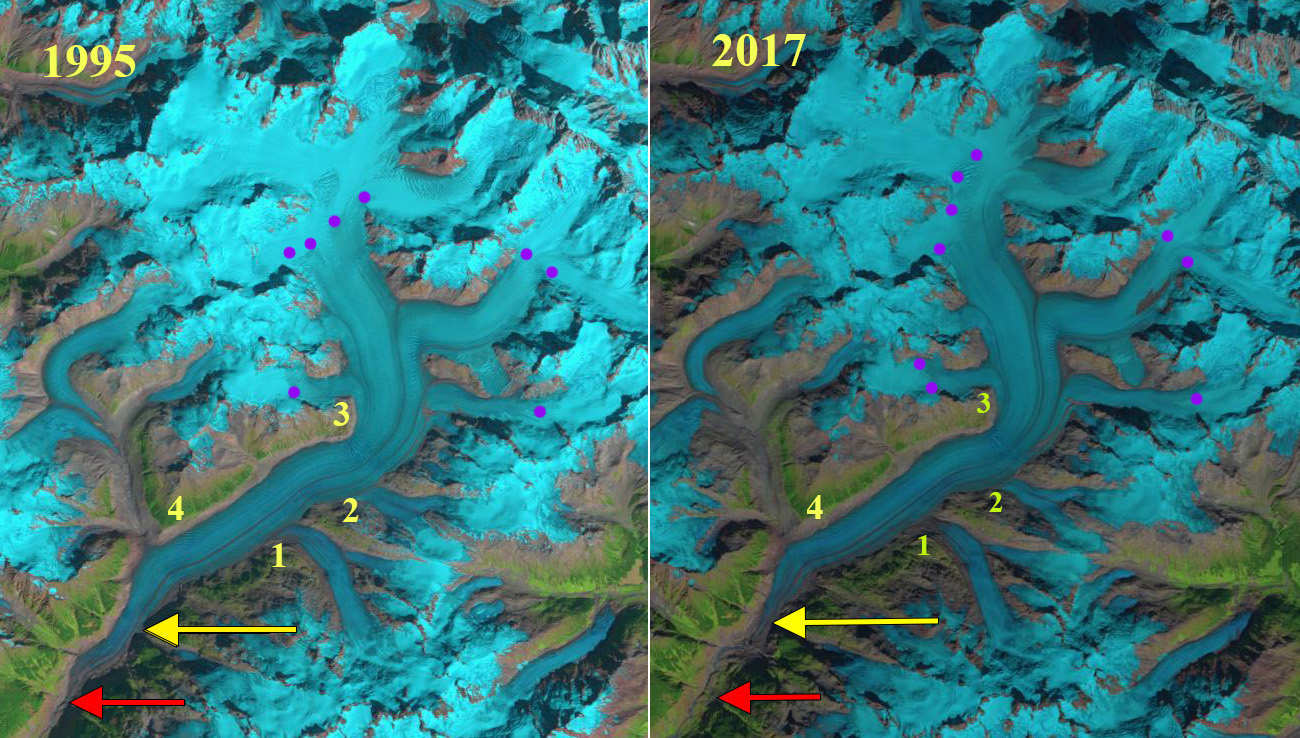
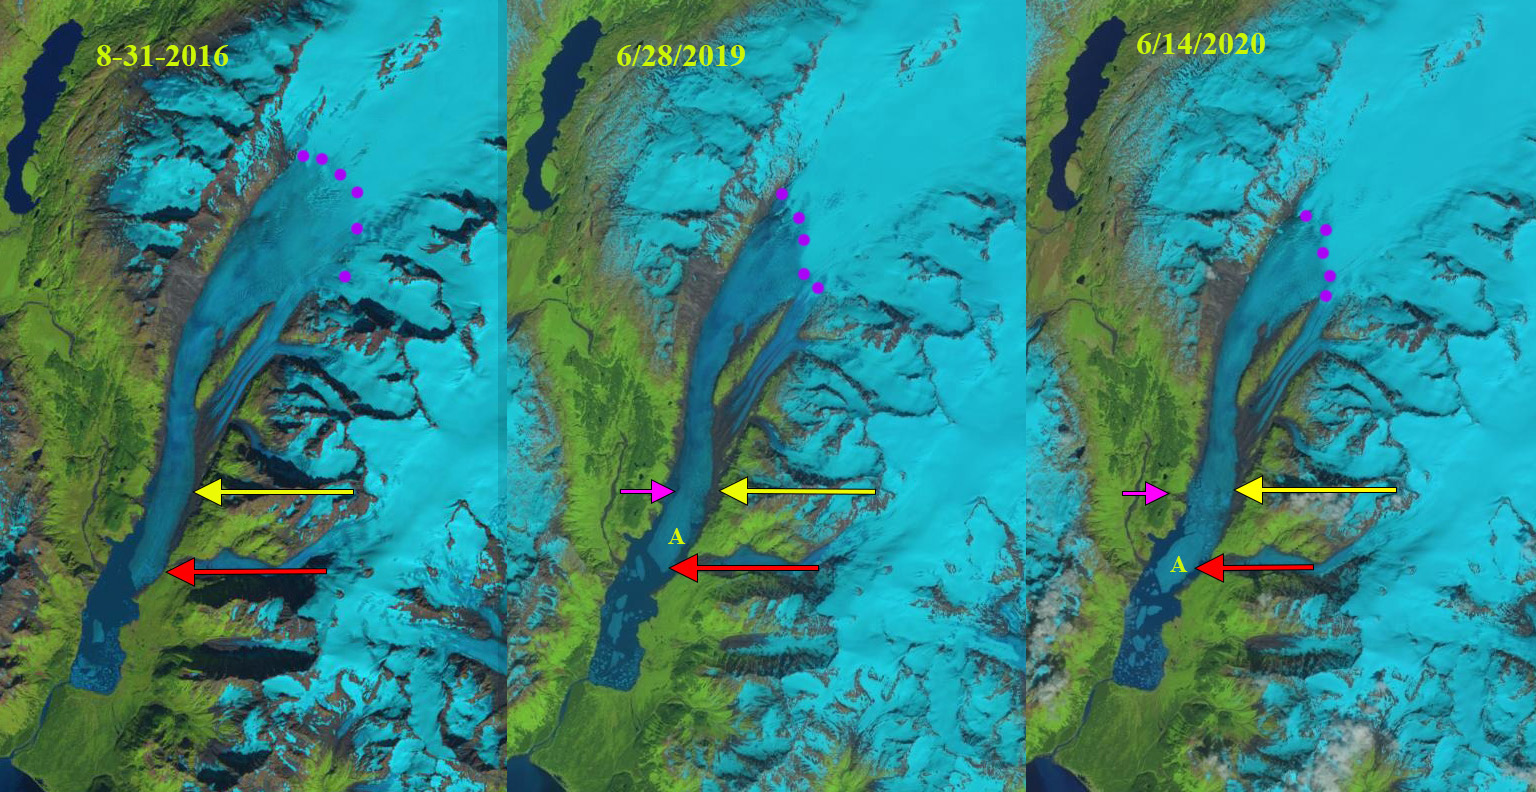
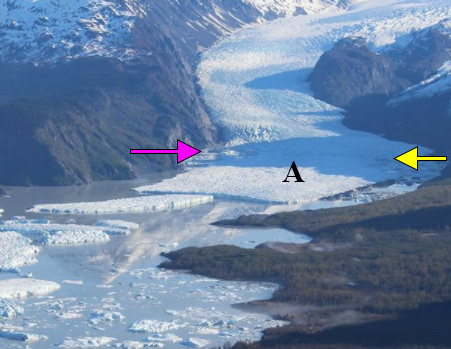
At Columbia Glacier the field team was joined by Michelle Tanz a Wlderness Stewardship Fellow for the National Forest Service. The initial observation was that the 2 km bushwhack around Blanca Lake has gotten much brushier as the alpine meadow becomes more sub-alpine. Columbia Glacier is a low elevation avalanche fed glacier that developed a new lake at its terminus a decade ago that continues to expand. The east side of the glacier has been thinning much faster than the west side altering the very shape of the glacier. Observed snowpack in 2020 was below average except for on the slopes of the main west side avalanche fans. The upper basin at 1550-1650 m averaged 2.2 m of snowpack at the 70 probing locations, which is 70% of normal. This snowpack will not survive the melt season, only snowpack in the main avalanche fans will remain. Terminus retreat has been 217 m since our first observation in 1984.
Lower Curtis Glacier is fed by avalanches from the slopes of Mt. Shuskan. We were joined in the field by Tom Hammond for the 17th consecutive year and artist Claire Giordano. There was a similar pattern to Columbia Glacier in that snowpack across most of the glacier was below average, while the primary avalanche fan on the east side had above average snowpack. The avalanche fans on the central headwall of the glacier fed from the Upper Curtis Glacier continue to thin rapdily, as avalanching has declined. The terminus slope which had been a daunting 42 degrees in 2015 is now 34 degrees. For the sixteenth consecutive year we had at least one artist in the field, below are field sketches from Cal Waichler and Jill Pelto and a painting from Claire Giordano. We will be combining the science findings and art in forthcoming articles on Lower Curtis and Easton Glacier.

Claire Giordano working on painting of Lower Curits Glacier and Mt. Shusksan (Mariama Dryak Photograph).

Jill Pelto completes sketch, while sitting on ice chunk, of Easton Glacier icefall (Mariama Dryak Photograph).

Cal Waichler annotated story board style sketches both capture and explain the scene at Columbia Glacier (Mariama Dryak Photograph).
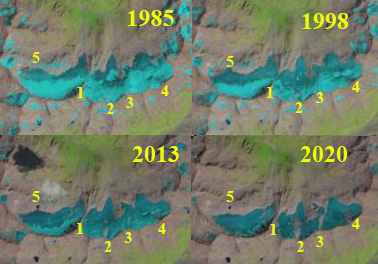
Rainbow Glacier has a terminus that is largely buried by avalanches, but is now is close to detaching from the main valley glacier. Snowpack at 1700 m averaged 2.4 m which is 75% of average. The saddle with Mazama glacier at 2000-2100 m averaged 3.9 m, which is 85% of normal. Subglacial bedrock knobs continue to become more prominent in expanding crevassing above and slope below the slope change, as the glacier thins.
Sholes Glacier had the highest percentage of surface blue ice of the glaciers observed. Snowpack had been reduced from at a rate of 8 cm/day during the first week of August, a relatively warm period. A snow cave at the terminus could be entered from a terminus crevasse that was 50 m long, 10 m wide and 2-5 m high. This is indicative of a relatively stagnant rapidly retreating terminus. From 2014-2020 the glacier has retreated 80 m, which is equivalent to the retreat from 1990-2014. Glacier runoff continues to be monitored just below the glacier by the Nooksack Tribe, while we provide continued rating curve development. Runoff during early August was averaging 0.25 m3/sec.
On Easton Glacier the terminus slope was the gentlest we had seen in our 31 years of consecutive observations. The terminus has retreated 430 m in this period. The significant thinning in the last few years had both reduced crevassing in the lowest icefall, but had reduced crevasse depth. Jill Pelto has been observing the crevasses depth in all the open crevasses in this icefall over the last decade. The biggest change has been from 2018-2020 with average depth being reduced by 40%. Snowpack on the bench at 2000 m averaged 2.4 m at the 45 observation sites, which is 75% of normal. The snowpack remained below normal at 2200 m, before a sharp increase to above normal snowpack averageing 5.1 m in 14 crevasse observations at ~2500 m. At this same elevation retained snowpack, now firn from previous years averaged 2.25 m. Based on the storm stratigraphy one significant difference was the result of an atmospheric river precipitation event of 12+ cm of precipitation from 1/31-2/2, that led to a snow depth and snow water equivalent decline at the Middle Fork Nooksack Snotel at 1550 m, while above 2300 m this all fell as snow. The freezing levels were above 2000 m for much of the event. The better high elevation snowpack will help Easton Glacier’s mass balance in 2020.
Easton Camp from adjacent to 1990 terminus position (Jill Pelto Photograph).

Crevasse stratigraphy at 2500 m on Easton Glacier indicates an average of 5.1 m of 2020 snowpack in crevasses and 2.25 m for previous annual layers from the 2016-2019 period (Mauri Pelto and Jill Pelto Photographs)

 Ya
Ya


