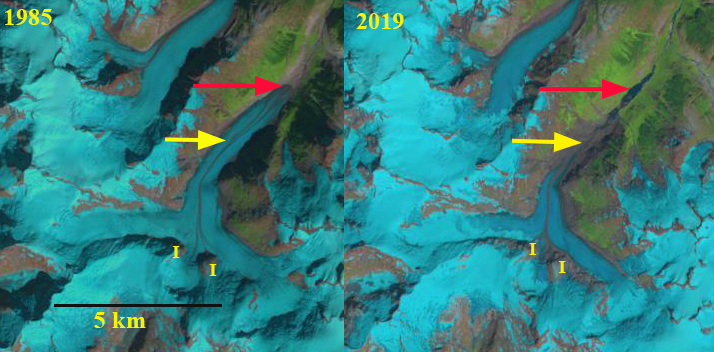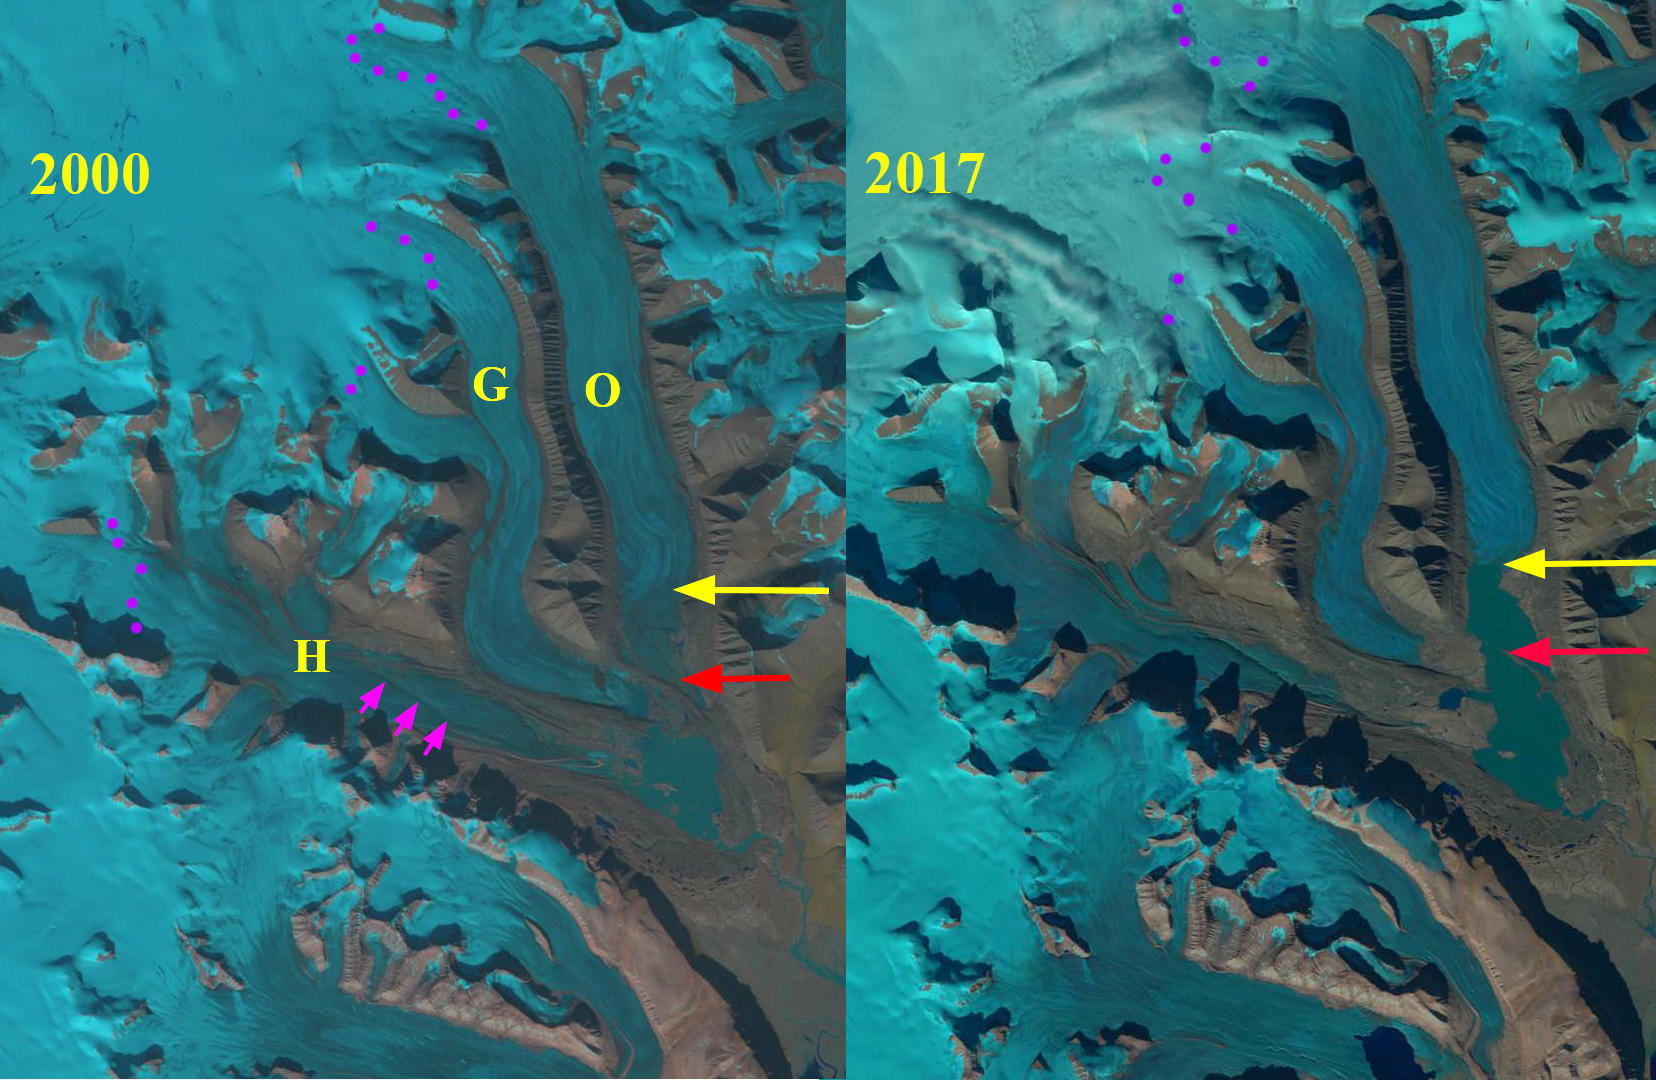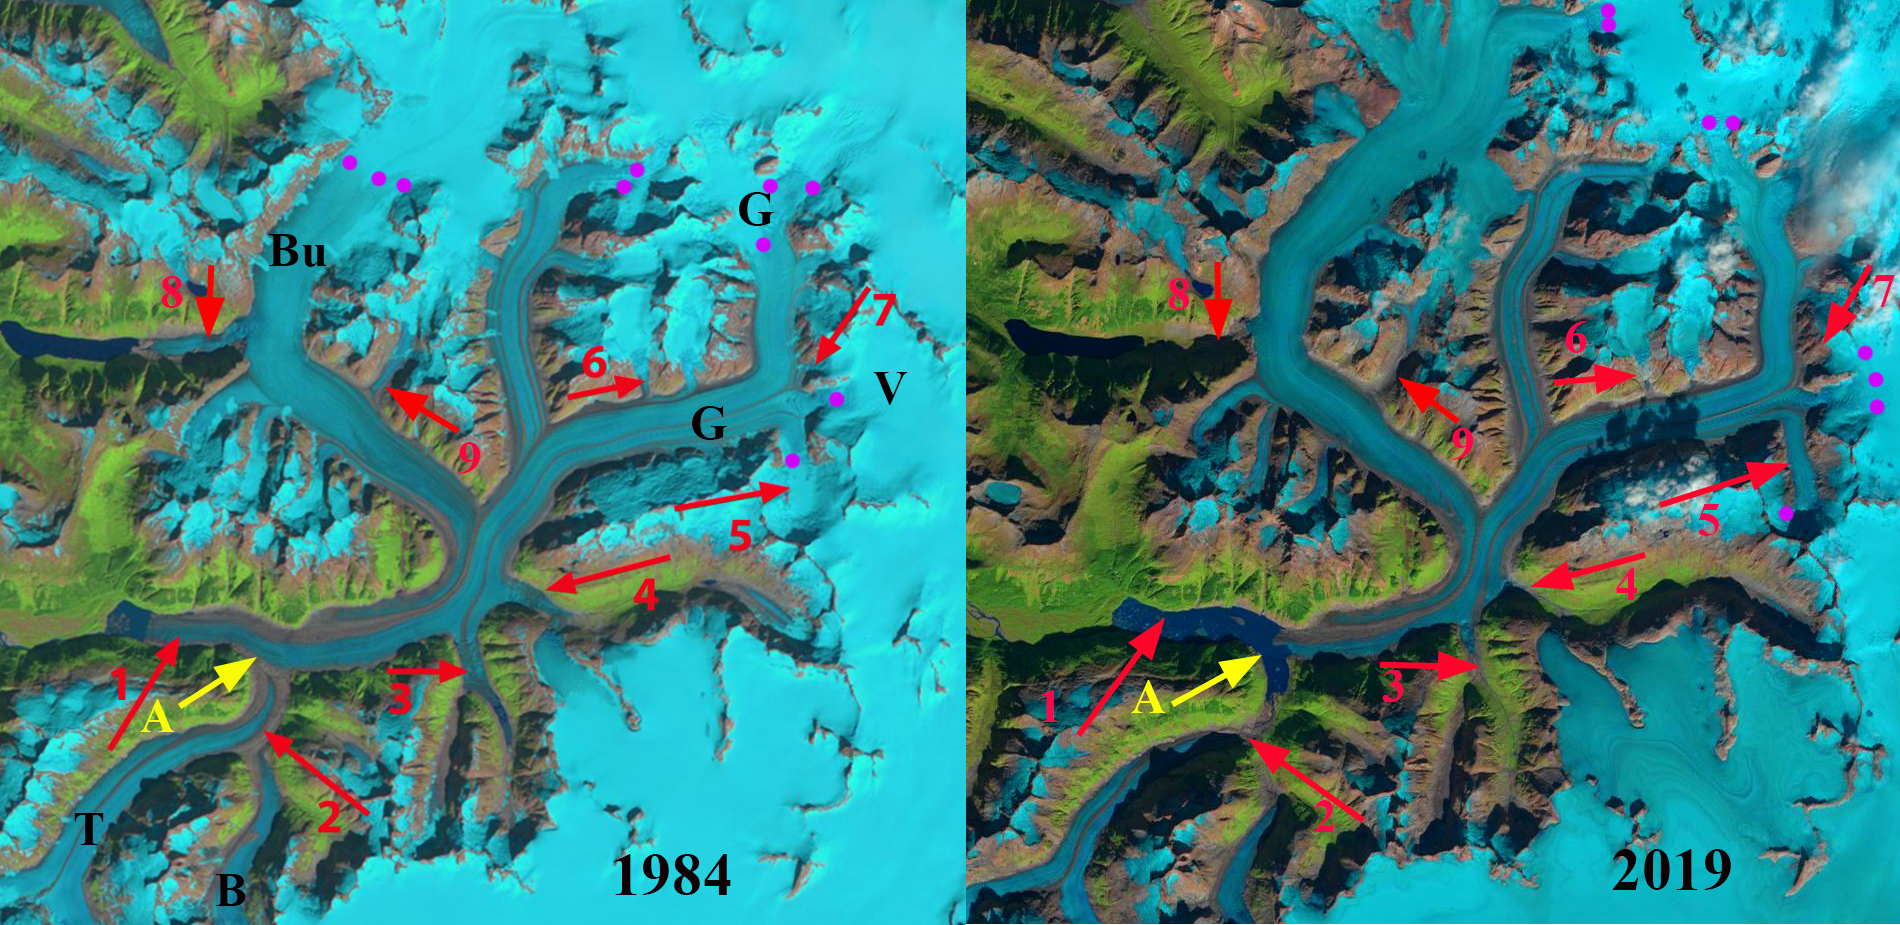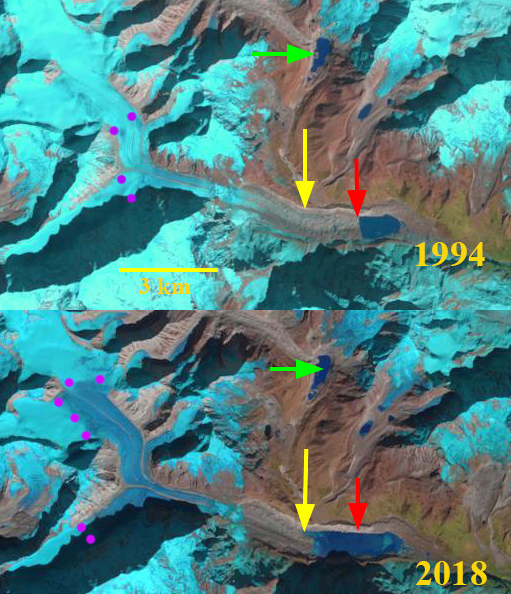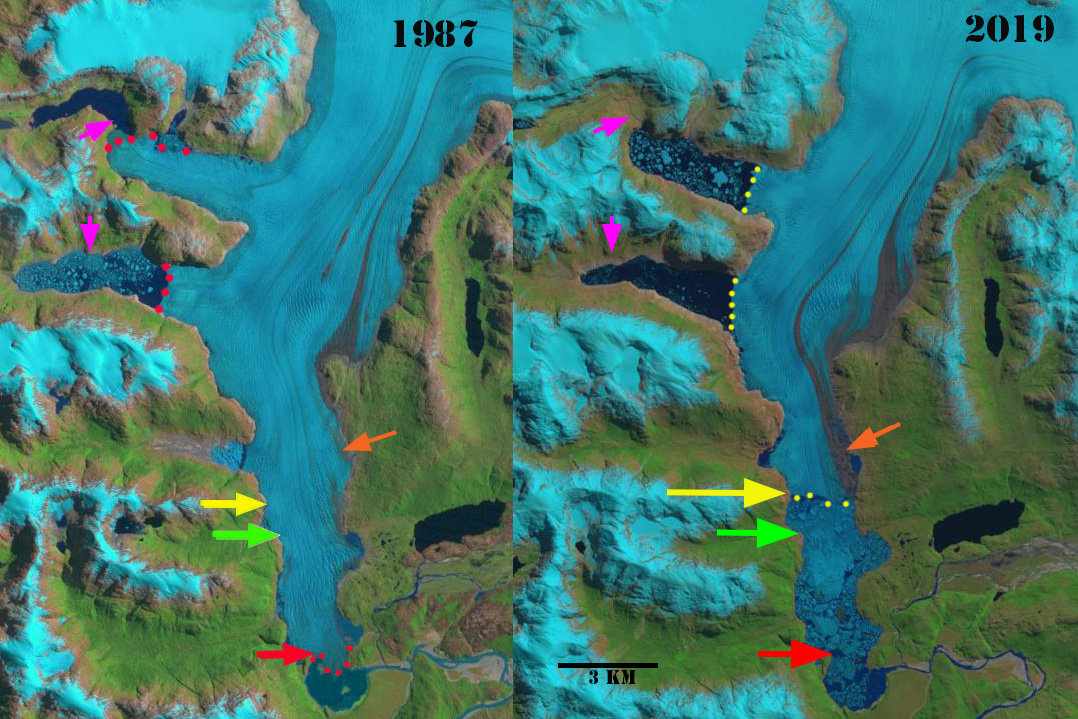
Steffen Glacier in 1987 and 2019 Landsat images. Red arrow is 1987 terminus location, green arrow 2015 terminus location, yellow arrow 2019 terminus location, orange arrow an area of expanding debris cover and the pink arrow locations indicating water level decline in proglacial lakes by the northwest and midwest secondary terminus. The terminus locations are also noted by red dots for 1987 and yellow dots for 2019.
Steffen Glacier is the south flowing glacier from the 4000 square kilometer Northern Patagonia Icefield (NPI). Several key research papers have reported on the spectacular retreat of this glacier in recent years. Here we update those results using Landsat imagery from 1987-2019 to fully illustrate the changes. Rivera et al (2007) reported that Glaciar Steffen lost 12 km2 and had an average thinning of 1.5 m in the ablation zone from 1979-2001. A JAXA EORC, 2011 report compared parts of the Glaciar Steffen terminus change from 1987 to 2010. They noted a retreat of approximately 2.1 km of the main stem and 870 m of a western terminus. Davies and Glasser (2012) in examining changes in Patagonian glaciers that the rate of area loss of the NPI increased dramatically after 2001, and has been 9.4 km2/year. Glasser et al (2016) report that NPI proglacial lake area expanded from 112 km2 to 198 km2 from 1987 to 2015, debris cover area expanded from 4.1% of the NPI to 7.9% during the same period. After 2003 the snowline was noted to have risen ~100 m. Dussaillant et al (2018) determined the annual mass loss of NPI at ~-1 m/year for the 2000-2012 period, with Steffen Glacier at -1.2-1.6 m/year.
In 1987 the lake at the terminus of the glacier was 1.3 km long from north to south. There are two substantial proglacial lakes with secondary termini on the west side of the glacier, the northwest extends 4 km west from the main trunk, the midwest tongue extends 1.7 km from the main trunk. In 1999 there is little retreat on the west side of the main terminus, but the east side has retreated 700 m. The northwest secondary terminus has changed little, but the glacier tongue is showing signs of rifting. The midwest tongue has retreated to within 0.5 km of the main trunk. In 2004 the west side of the main terminus has retreated 600 m from a peninsula that had buttressed the terminus. The entire last 3 km of the terminus tongue is in the proglacial lake with no buttressing by the shore, and is poised for breakup.
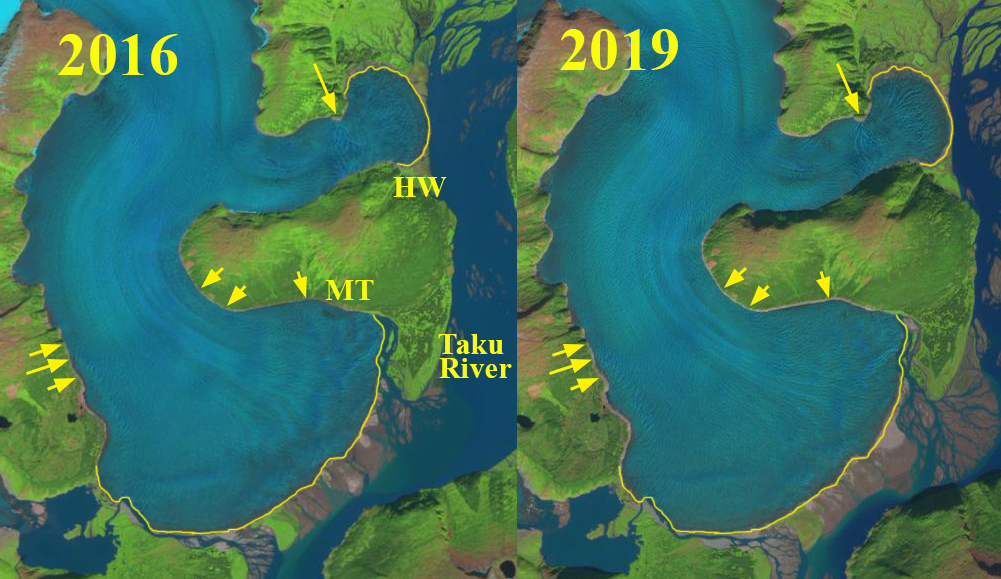
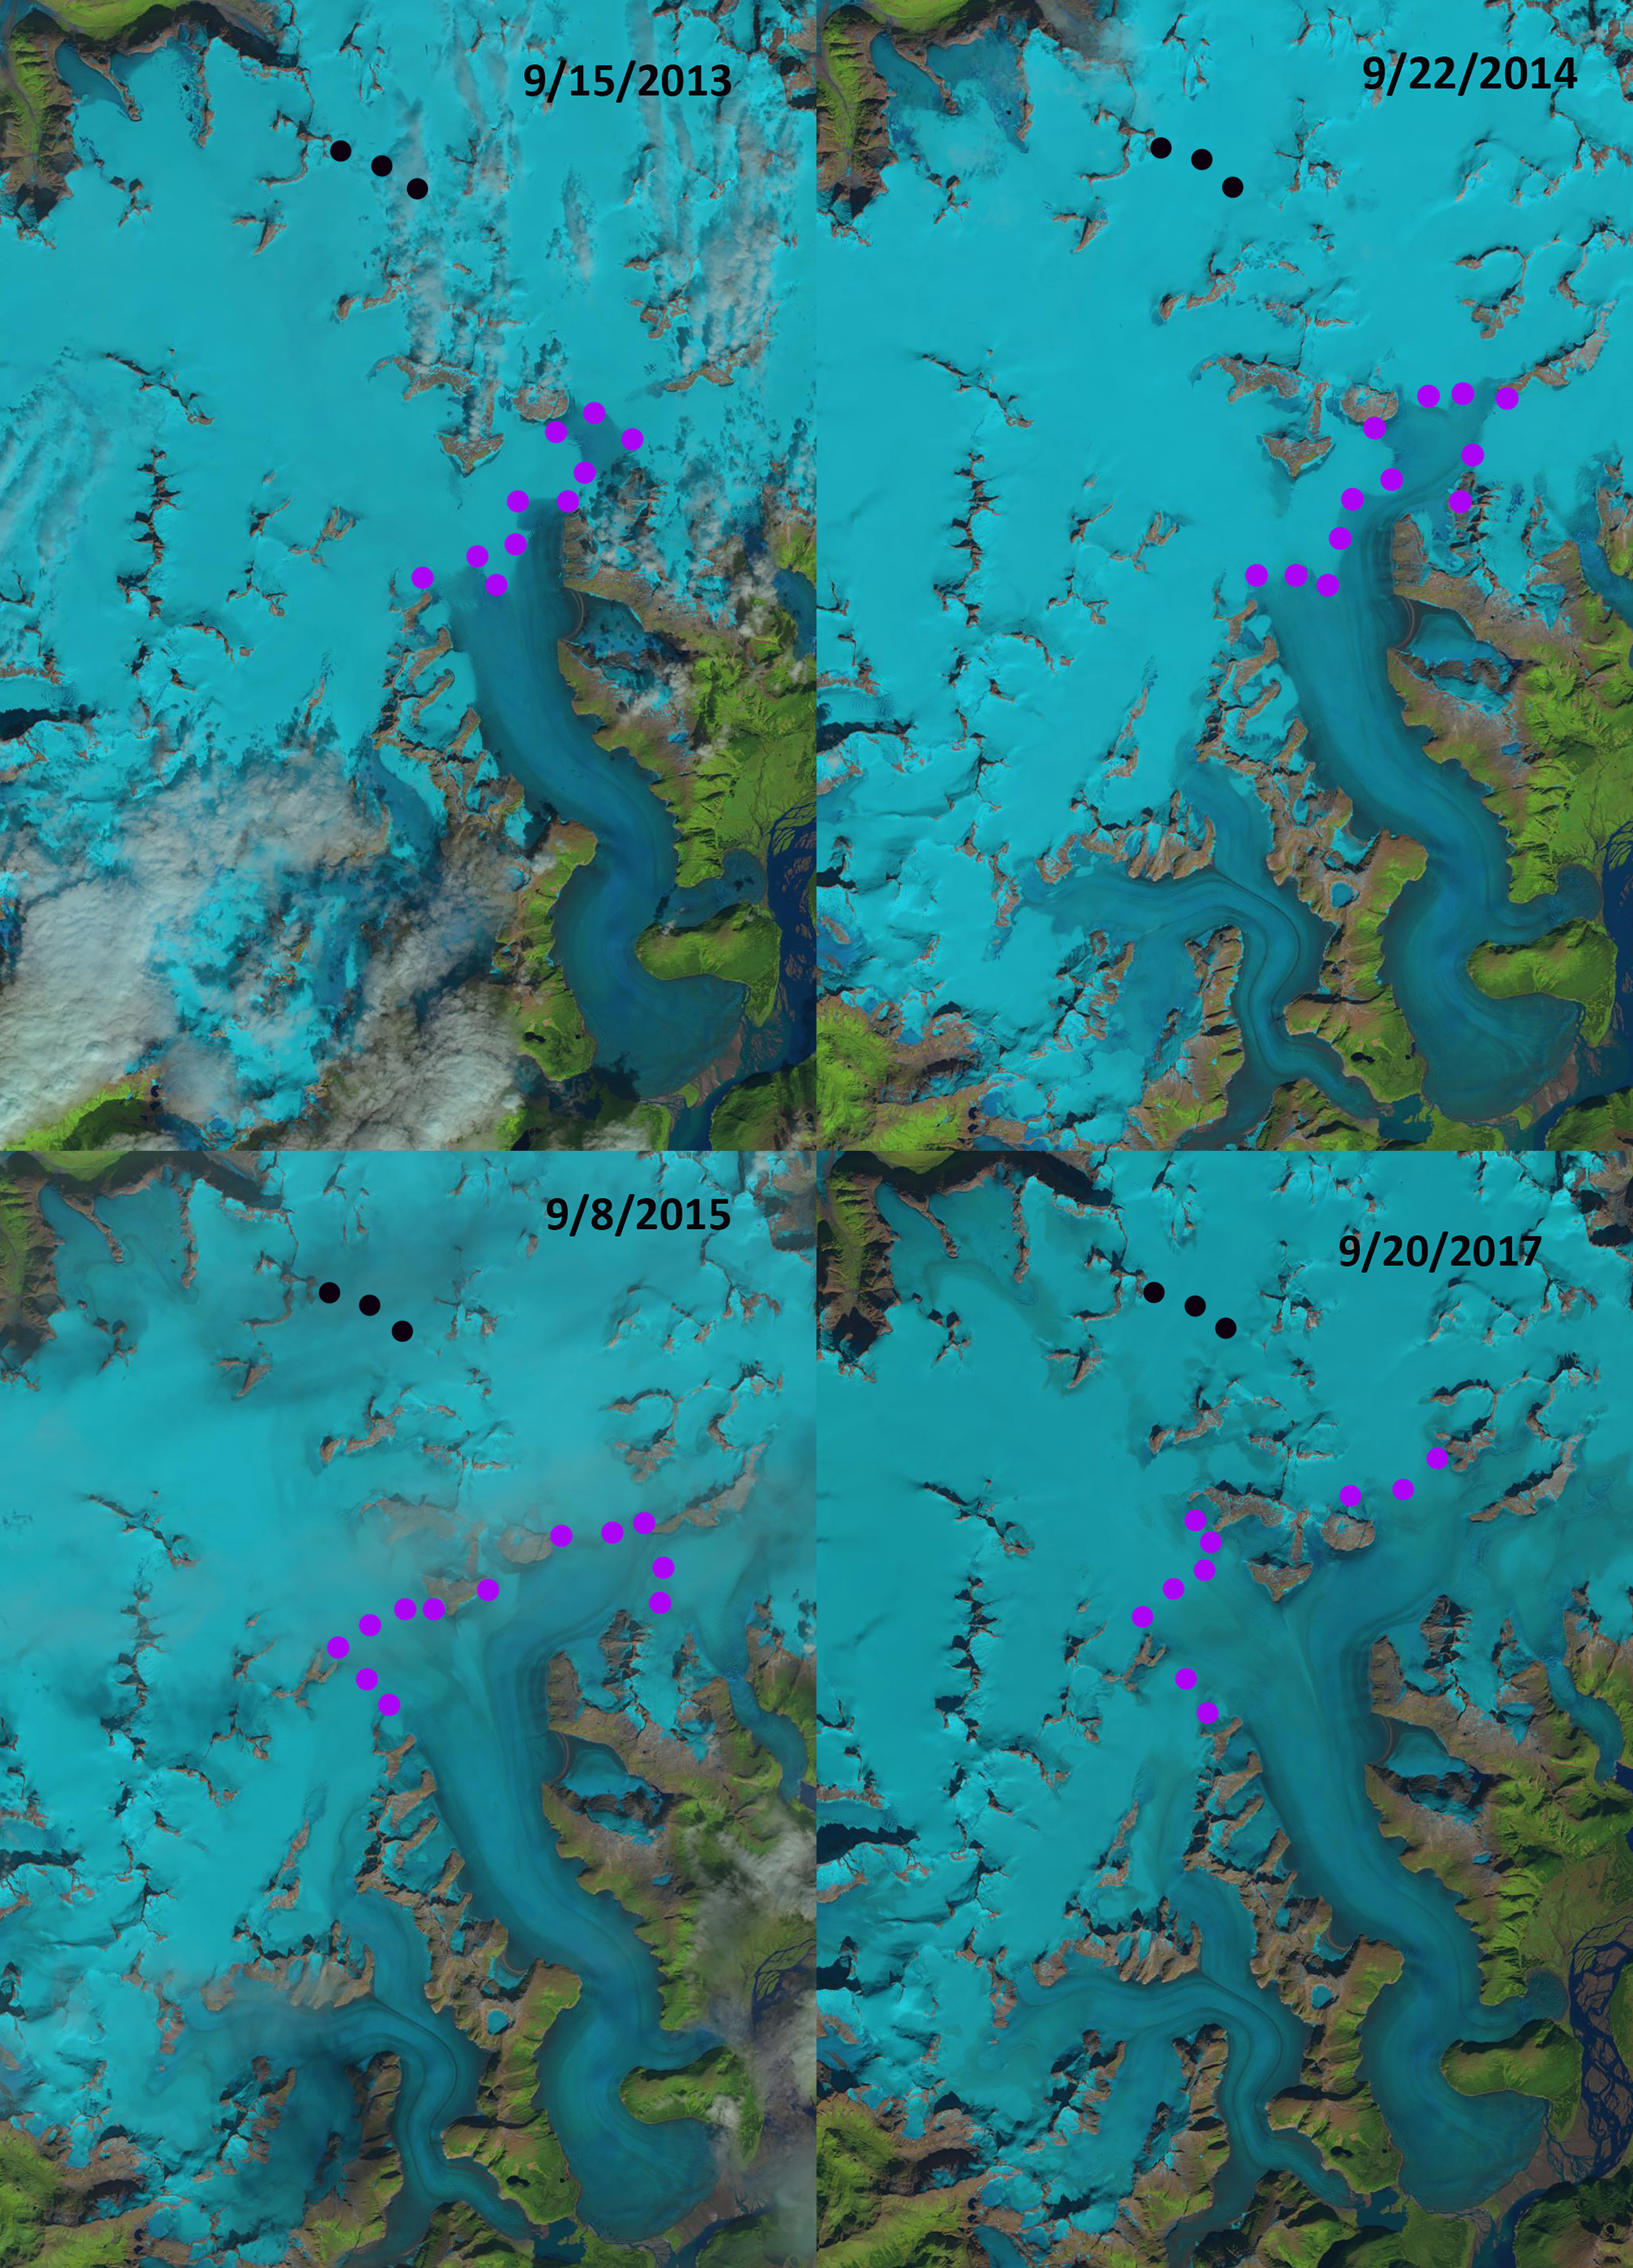
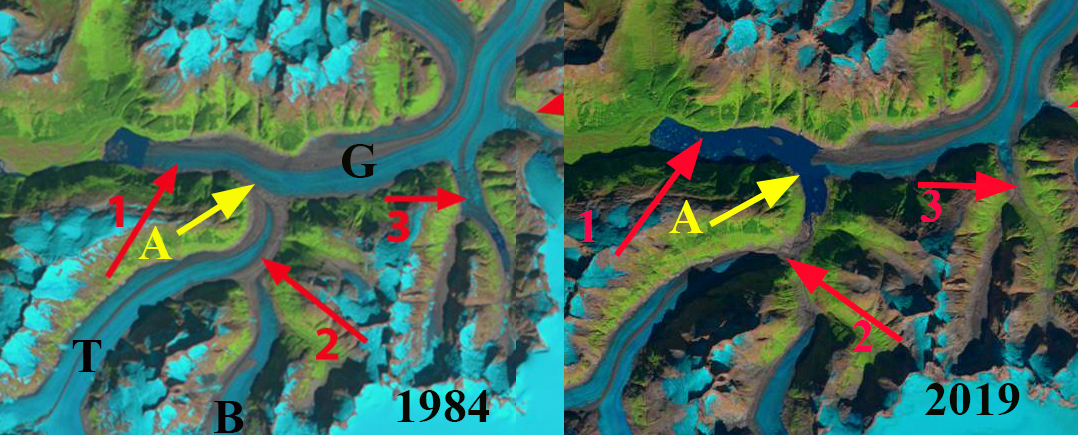
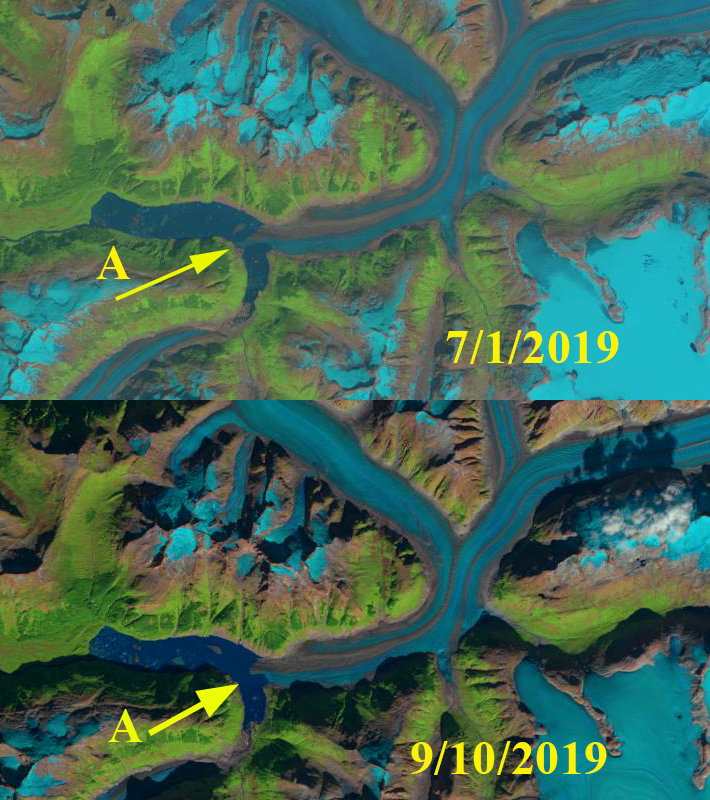
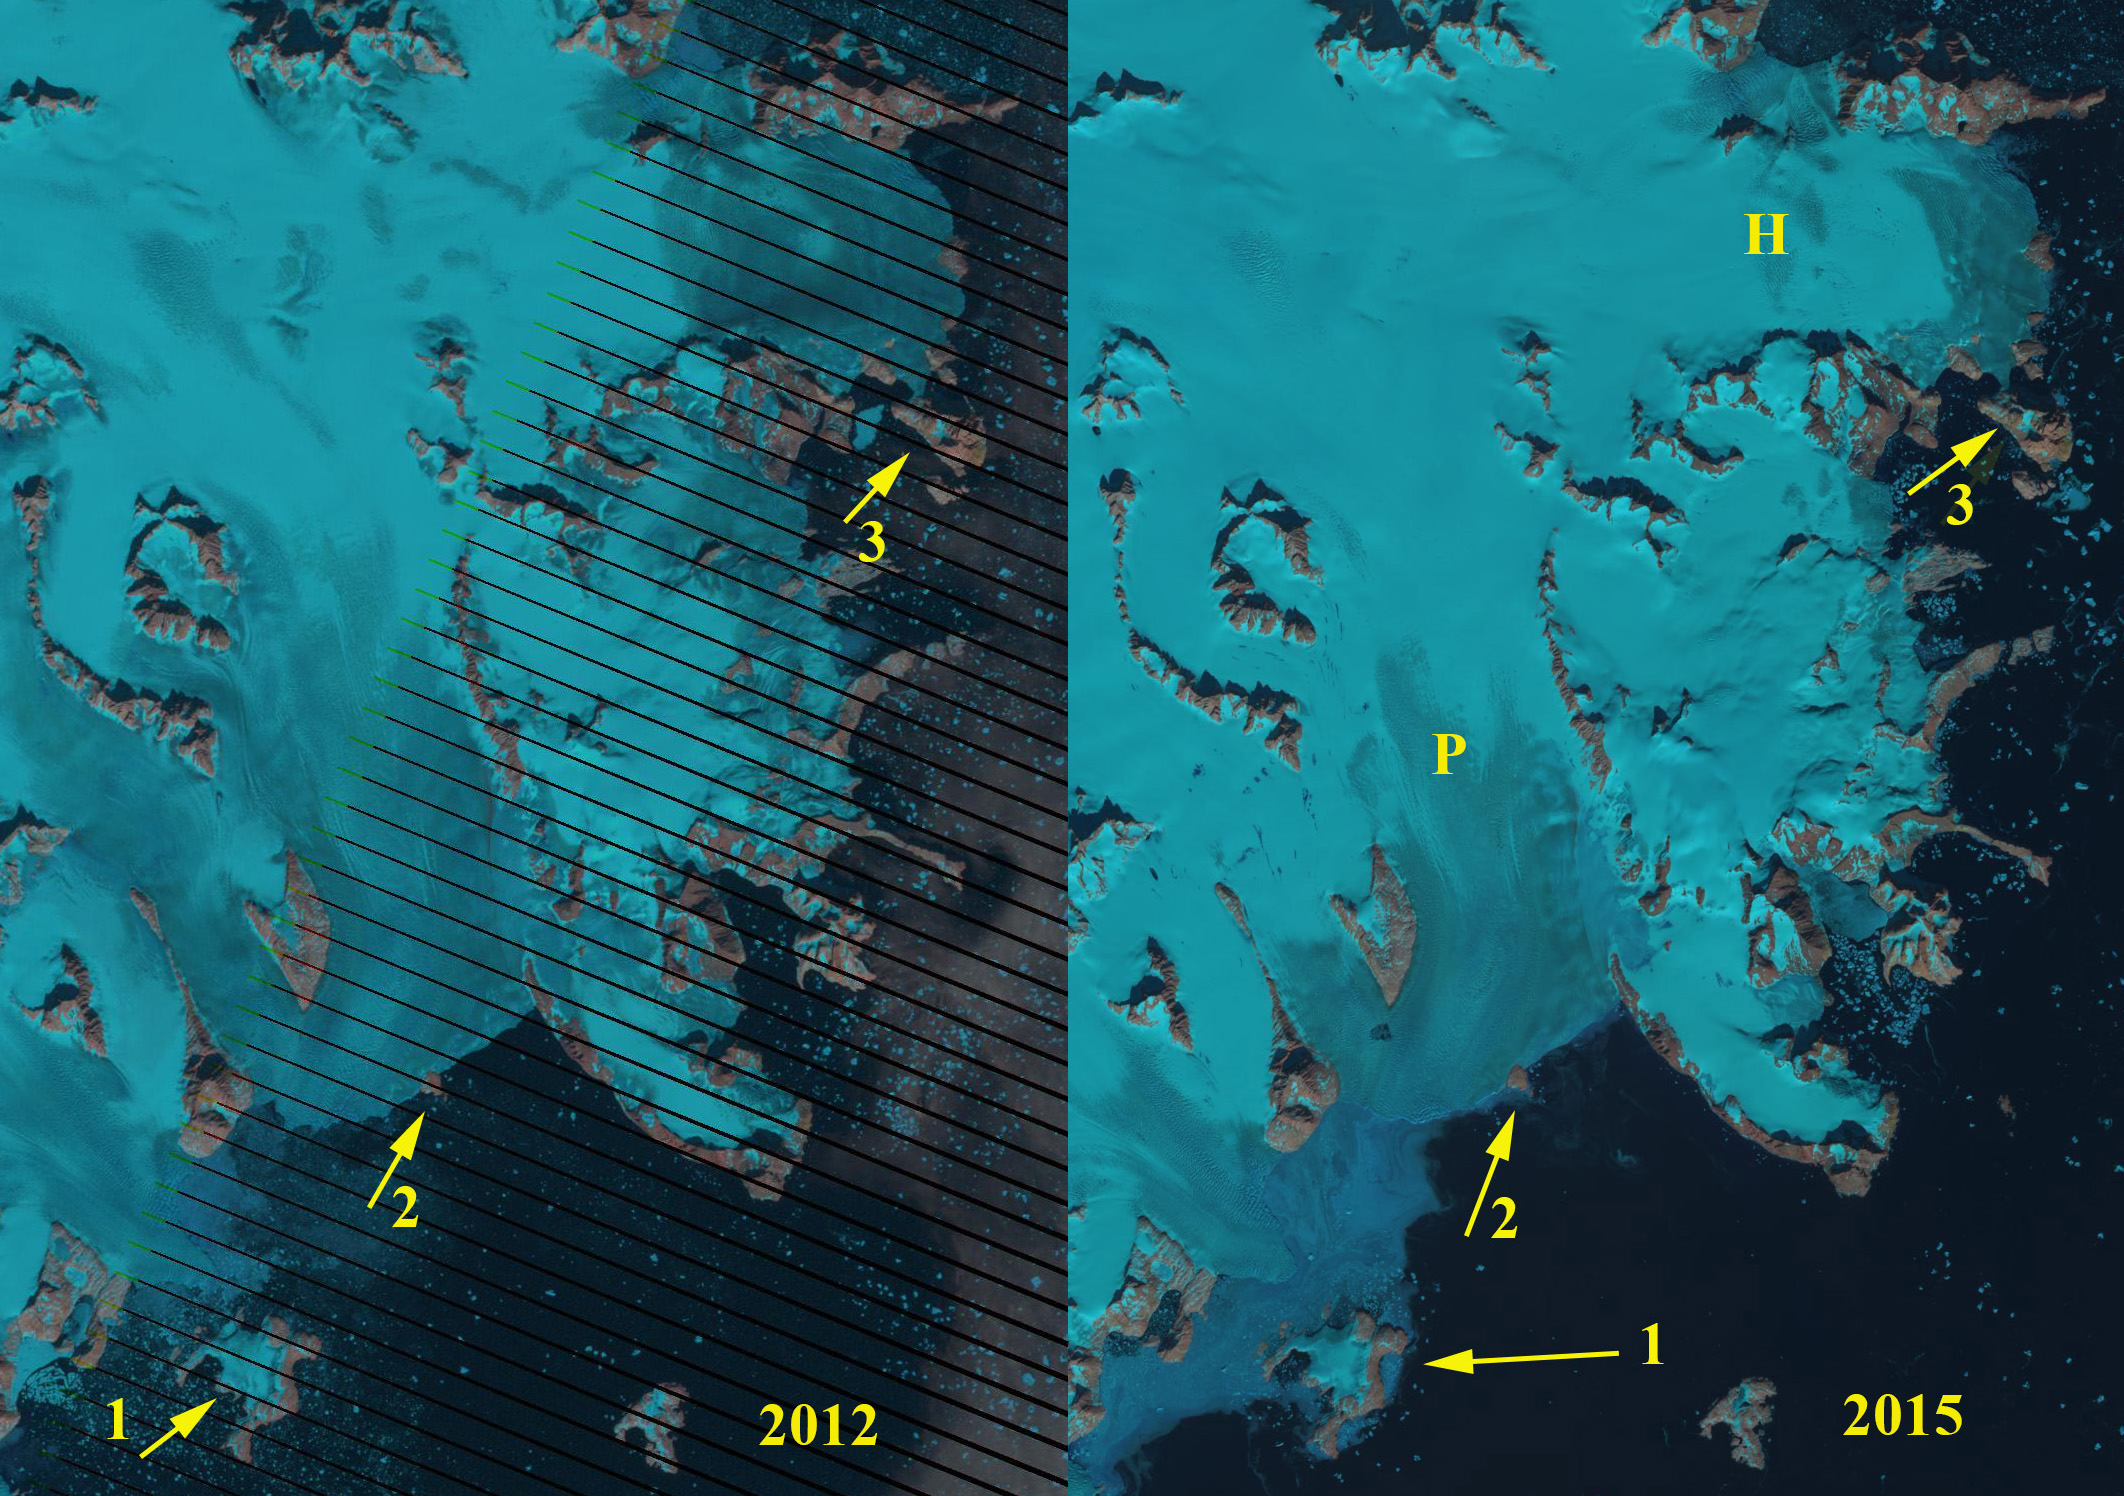
By 2015 the unbuttressed portion of the terminus had been lost with a 3.4 km retreat since 1987. The northwest tongue has collapsed a retreat of 3.8 km, while the midwest termini has retreated 1.3 km since 1987. There are four large icebergs more than 0.2 km2 in the proglacial lake. From 2015-2018 the terminus is relatively stable and extends across the entire lake and on the west side is buttressed by a small peninsula. In 2018 there are three large icebergs more than 0.2 km2 in the proglacial lake. In 2019 the terminus has retreated 1 km from the 2018 position with proglacial lake areas along the lowest 2 km on both the west and east margin. This suggests this section of the terminus is similar to the main terminus in 1987 and 1999 that was poised for further calving retreat. The 2019 image is from early in the melt season and the proglacial lake is filled with an extensive melange and one large iceberg. The retreat from 1987-2019 of 4.4 km, ~137 m/year, is driven by the 100 m rise in the snowline, resultant thinning, which then drives calving (Glasser et al 2016). Millan et al (2019) indicate the area of tributary glacier convergence near the northwest terminus and above the glacier is 700 m thick, and that the glacier has been retreating along an area where the glacier bed is below sea level, though the terminus now is close to sea level. Note the Digital Globe image below with the yellow arrows indicating the end of the main lake basin and potentially end of the lake, the eastern margin of the glacier is fringed by proglacial lake up to that point. Above this point there is another basin that may or may not connect to the current lake. The high snowline elevation in 2019 that is an indicator of increased melt area has led to an expansion of debris cover as well, note orange arrows for 1987 and 2019.
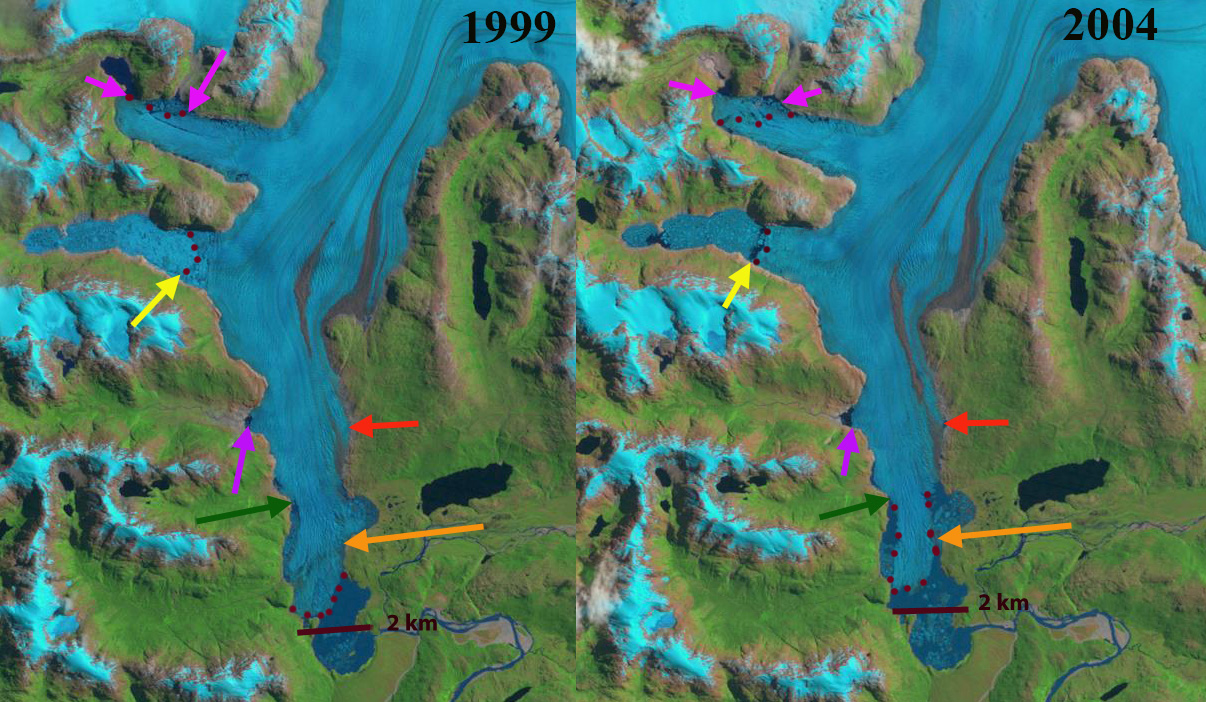
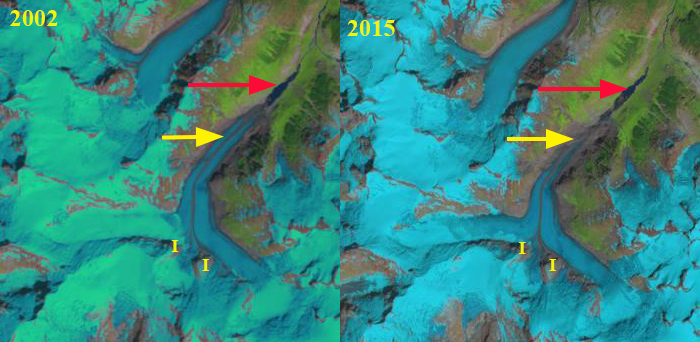
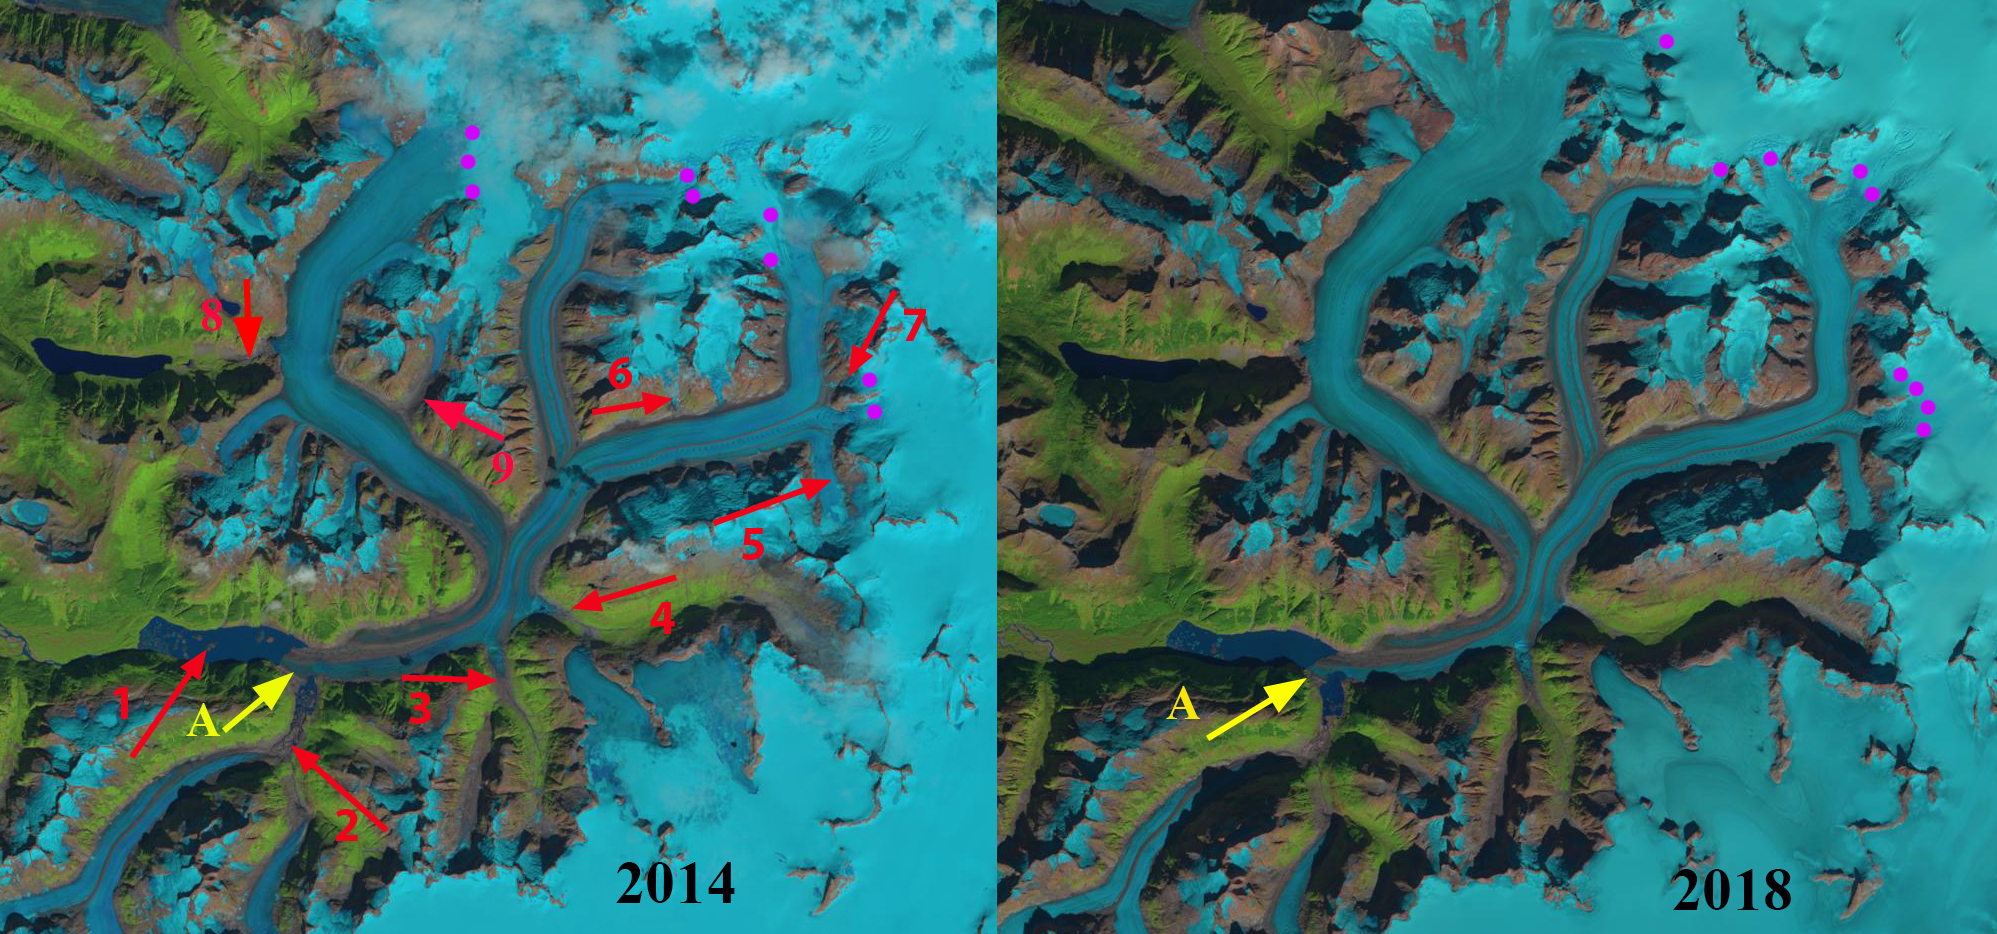
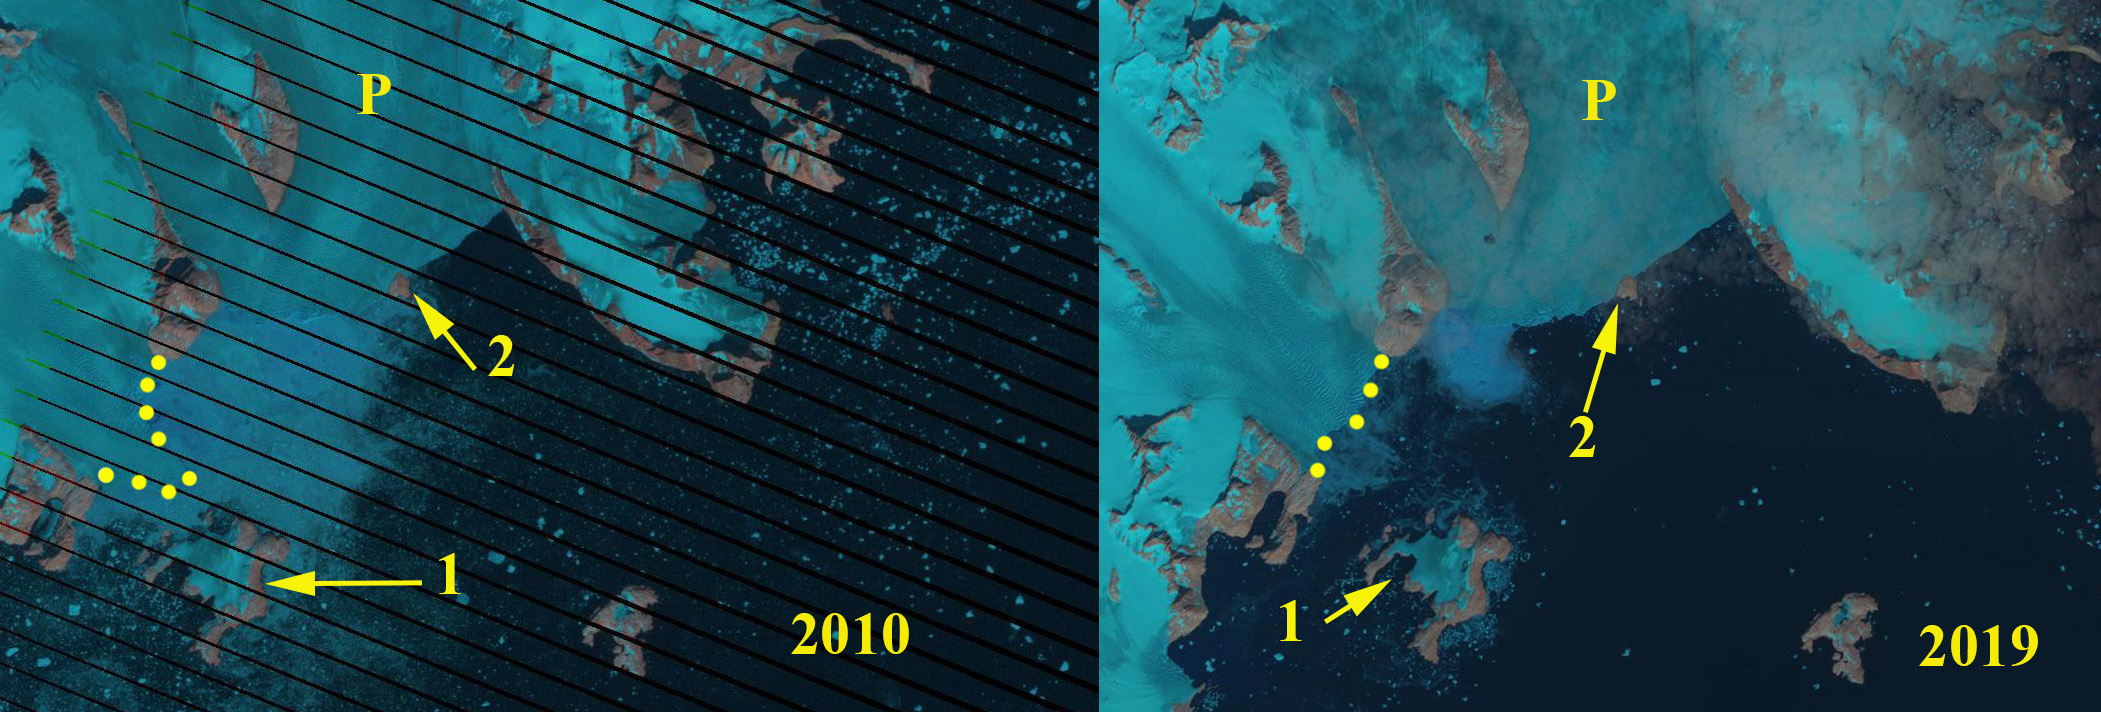
Steffen Glacier in 1999 and 2004 Landsat images. The red dots indicate terminus position, orange arrow where the terminus was buttressed on the eastern shore in 1999, green arrow where the glacier is buttressed on the western shore, the pink arrow indicates the northwest secondary terminus and yellow arrow the midwest secondary terminus.
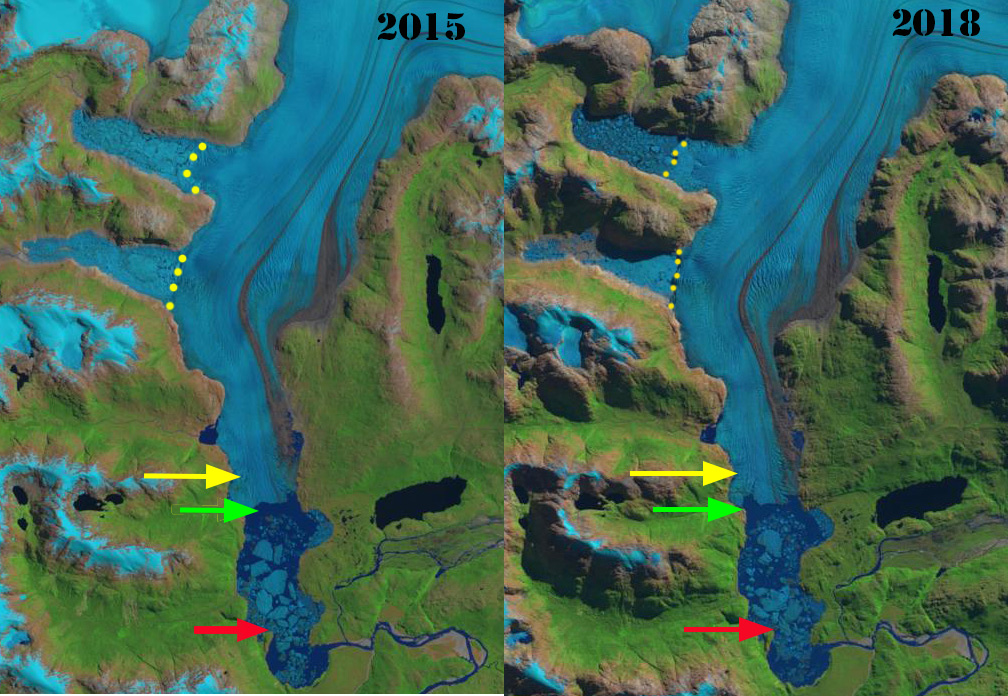
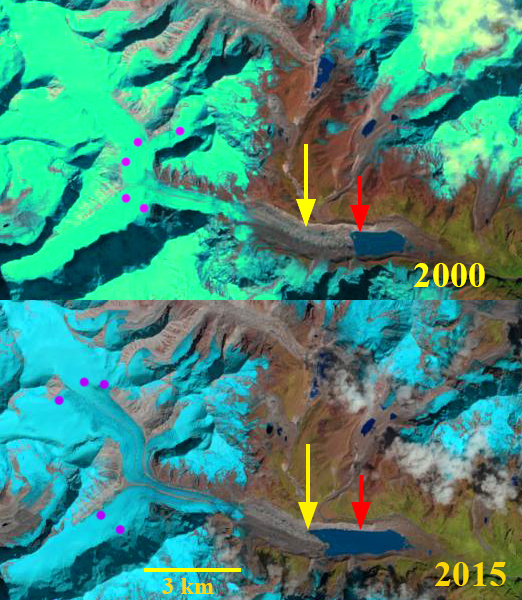
Steffen Glacier in 2015 and 2018 Landsat images. Red arrow is 1987 terminus location, green arrow 2015 terminus location, yellow arrow 2019 terminus location, orange arrow an area of expanding debris cover and the yellow dots the margin of the northwest and midwest secondary terminus.
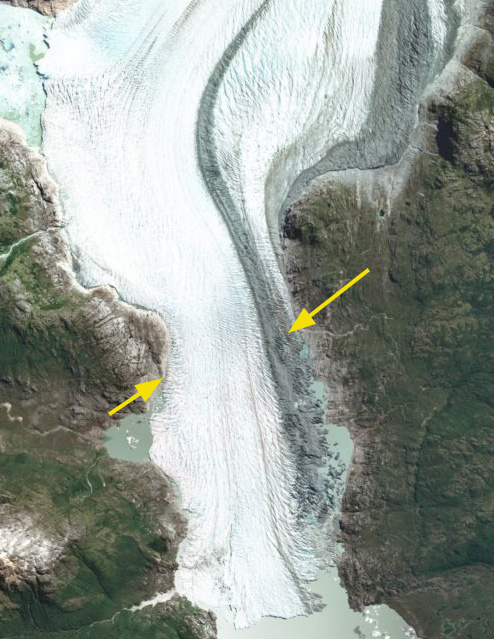
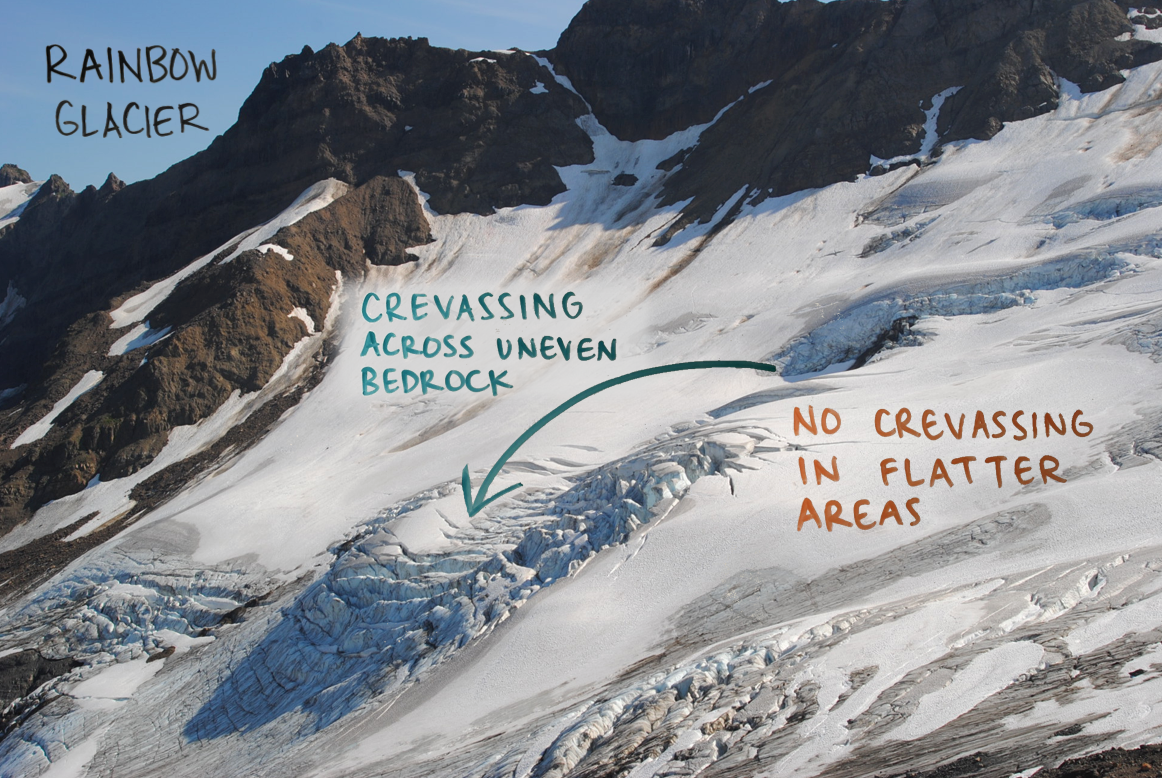
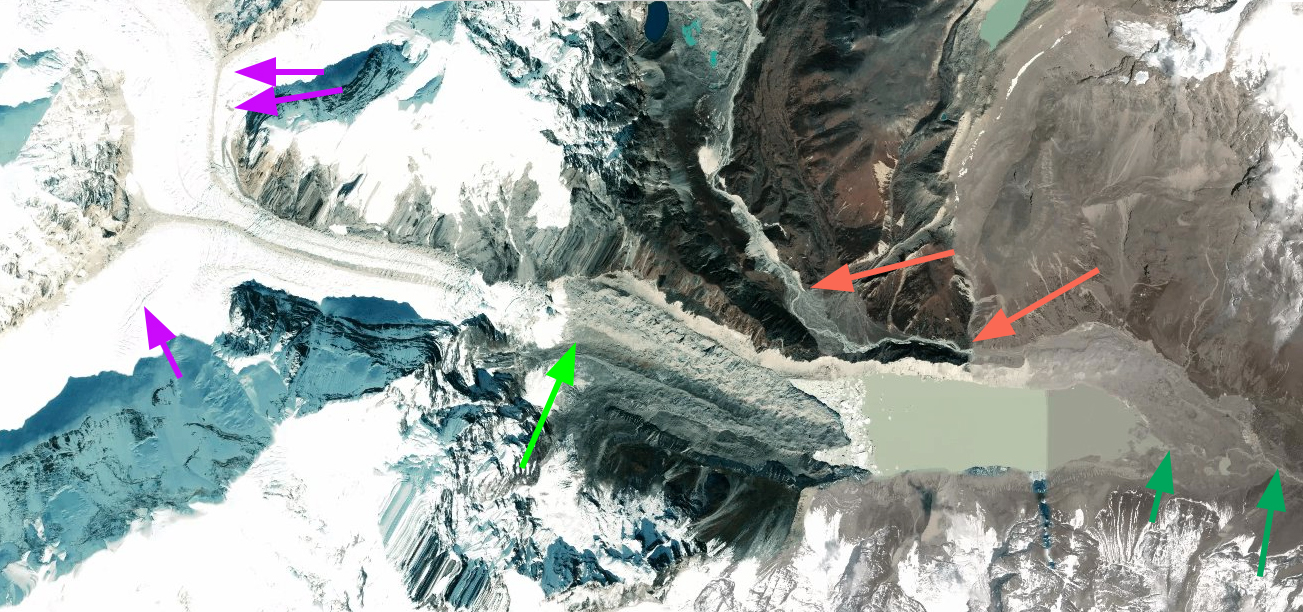
Digital Globe image of lower reach of Steffen Glacier. Yellow arrows indicate an area where the bed rises as indicated by the increased crevassing and steeper surface slope. Note the extent of detachment of the glacier along the eastern margin up to that point.