The summer of 2019 found the North Cascade Glacier Climate Project in the field for the 36th consecutive summer monitoring the response of North Cascade glaciers to climate change. This long term monitoring program was initiated partly in response to a challenge in 1983 from Stephen Schneider to begin monitoring glacier systems before and as climate change became a dominant variable in their behavior.
The field team was comprised of Clara Deck, Ann Hill, Abby Hudak, Jill Pelto and myself. All of us have worked on other glaciers. The bottom line for 2019 is the shocking loss of glacier volume. Ann Hill, UMaine grad student observed, that “Despite having experience studying glaciers in southeast Alaska and in Svalbard, I was shocked by the amount of thinning each glacier has endured through the last two and a half decades.” Glaciers are typically noted as powerful moving inexorably. Clara Deck, UMaine MS graduate, was struck by “the beauty and fragility of the alpine environment and glaciers.” Fragile indeed in the face of climate change. Abby Hudak, Washington State grad student, looked at both the glacier and biologic communities as under stress, but glaciers cannot migrate, adapt or alter there DNA.
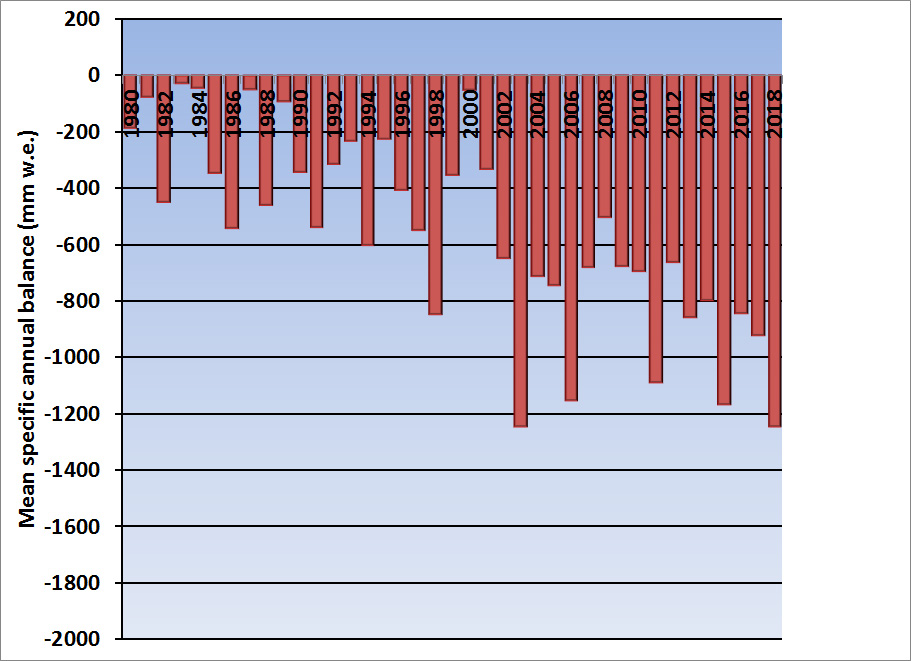
Over the span of 16 days in the field, every night spent in the backcountry adjacent to a glacier, we examined 10 glaciers in detail. All glaciers are accessed by backpacking. The measurements completed add to the now 36 year long data base, that indicate a ~30% volume loss of these glaciers during that period (Pelto, 2018). Here we review preliminary results from each glacier. Each glacier will have a mass balance loss of 1.5 -2.25 m, which drives continued retreat. Columbia and Rainbow Glacier are reference glaciers for the World Glacier Monitoring Service, with Easton Glacier joining the ranks later this year. Below and above is the visual summary. Specific mass balance and retreat data will be published here and with WGMS after October 1.
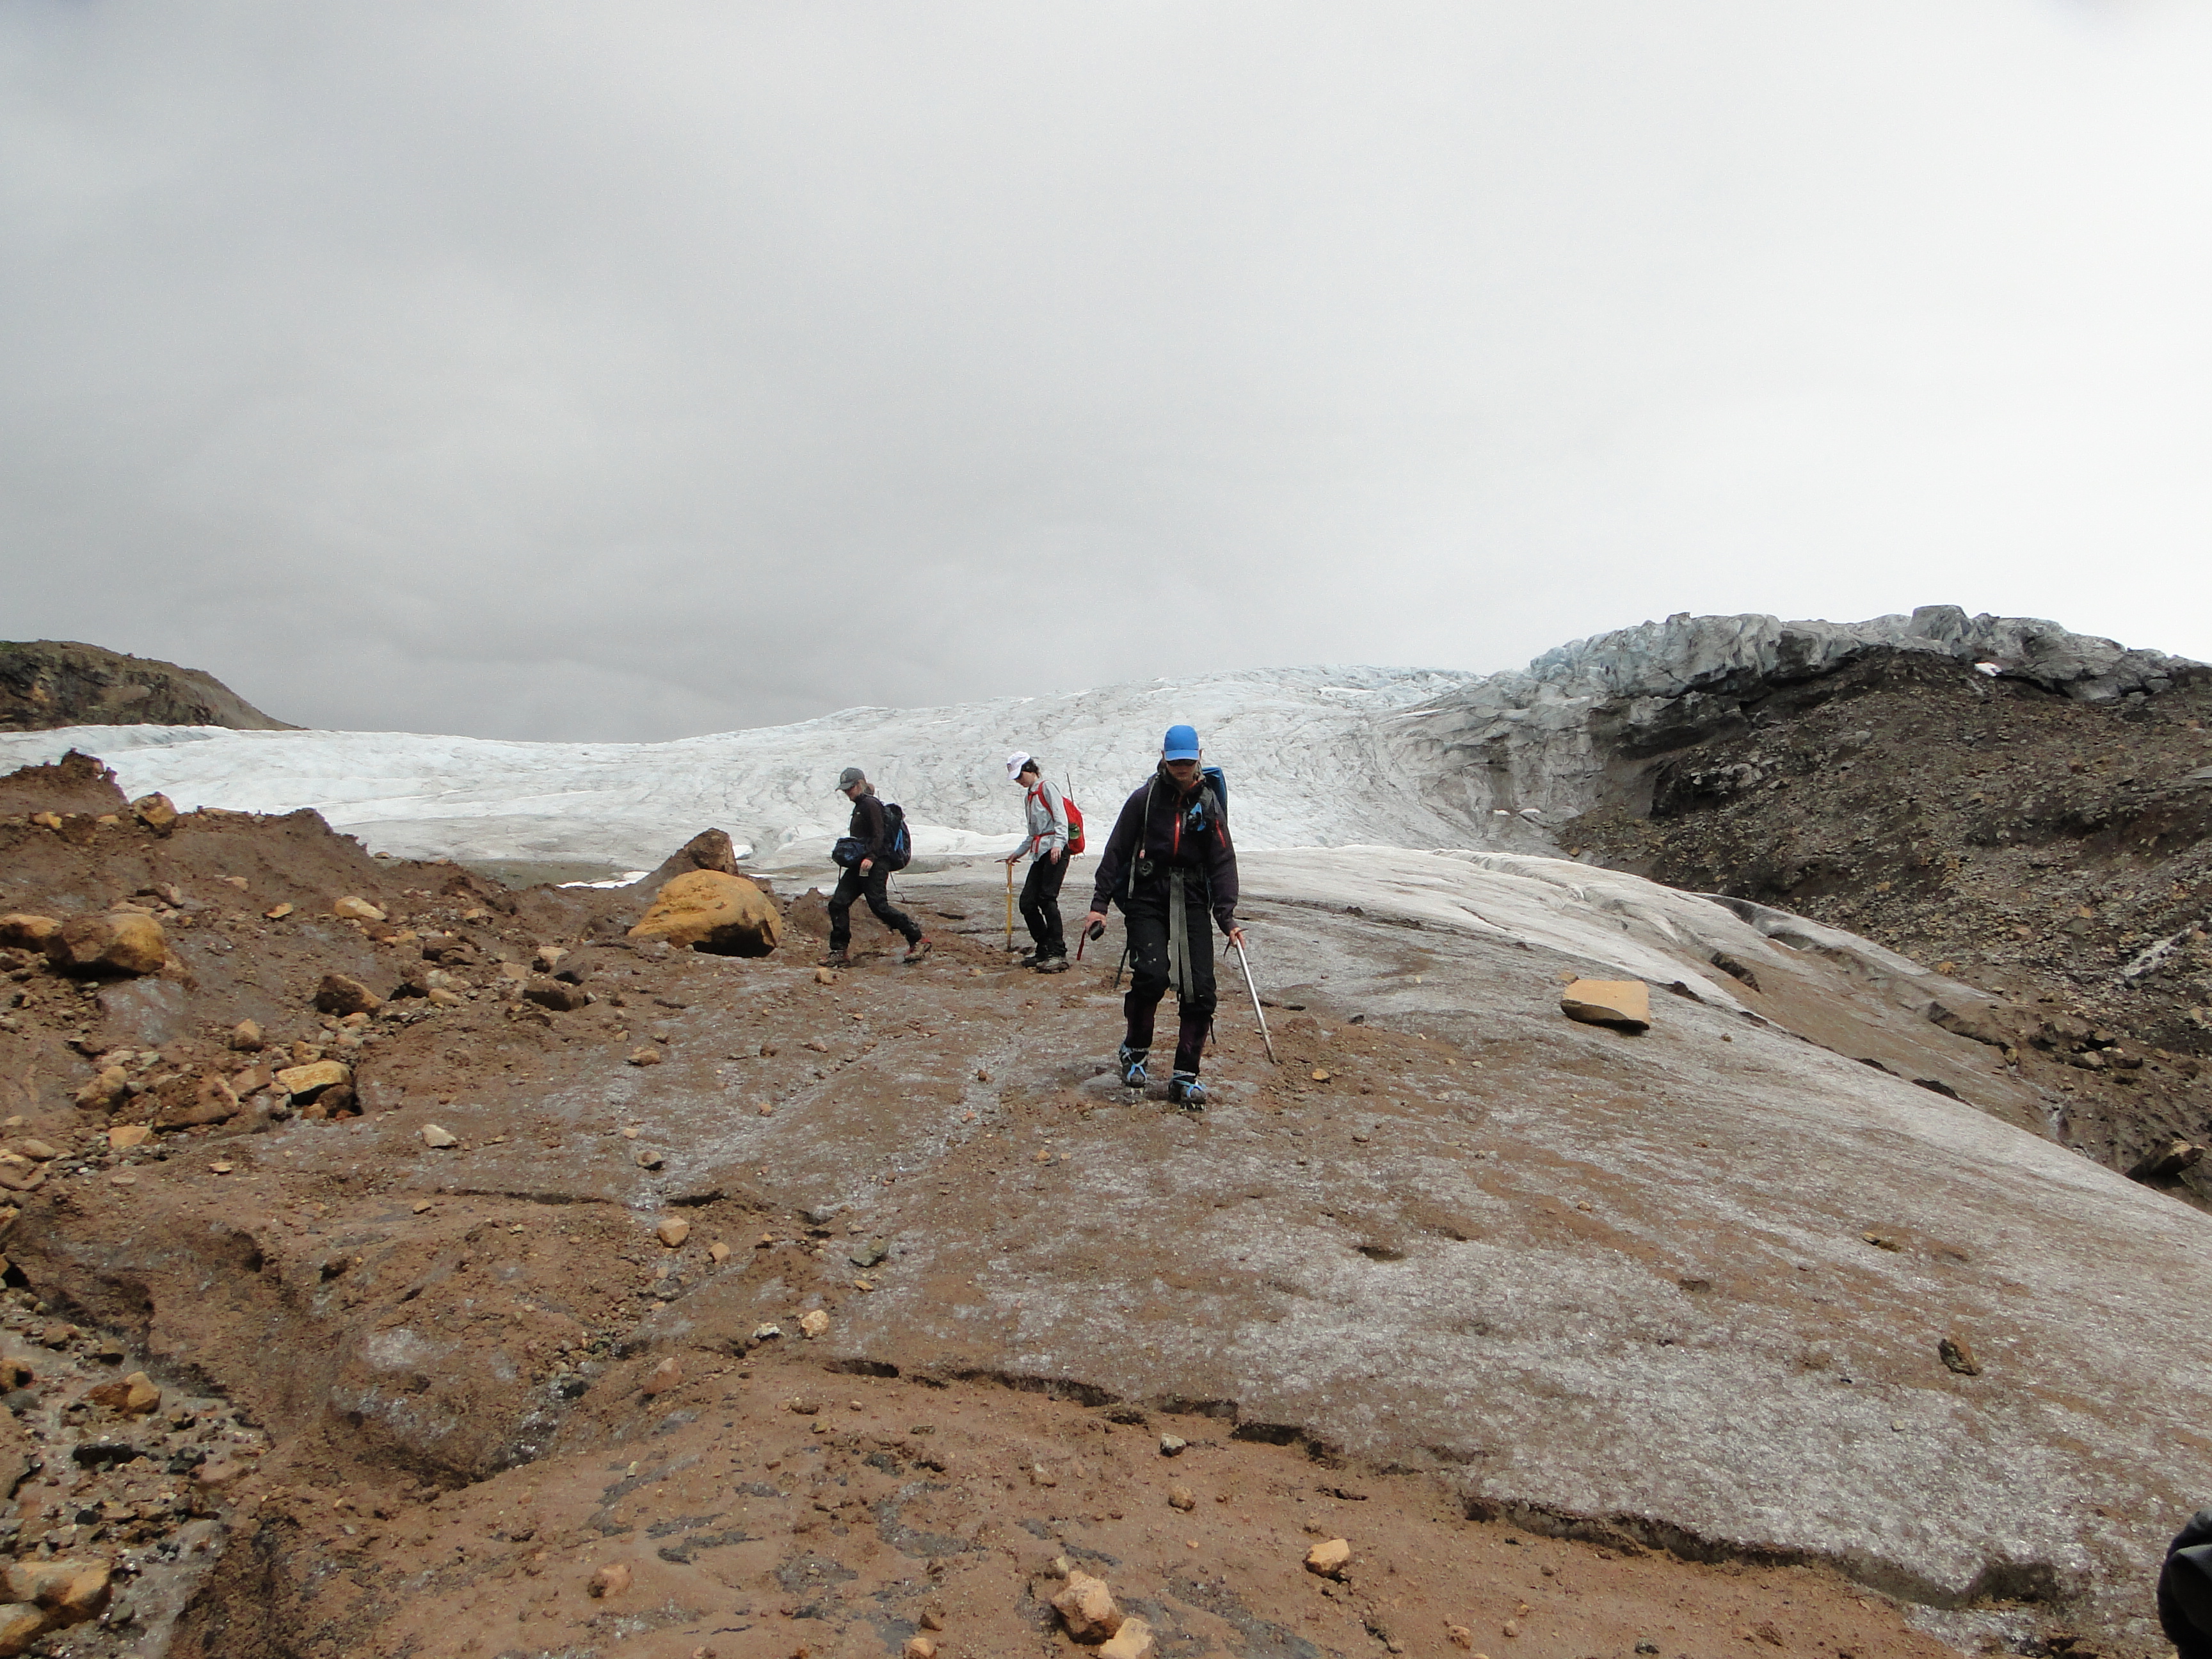
Easton Glacier, Mount Baker. Terminus has become thin and uncrevassed as a rapid retreat of 15 m per year continued, 405 m retreat since 1990.

Easton Glacier icefall at 2200 m typically has 1.8 m w.e. at the end of the summer, this year it will be 0 m. The overall mass balance will be ~2 m of loss.

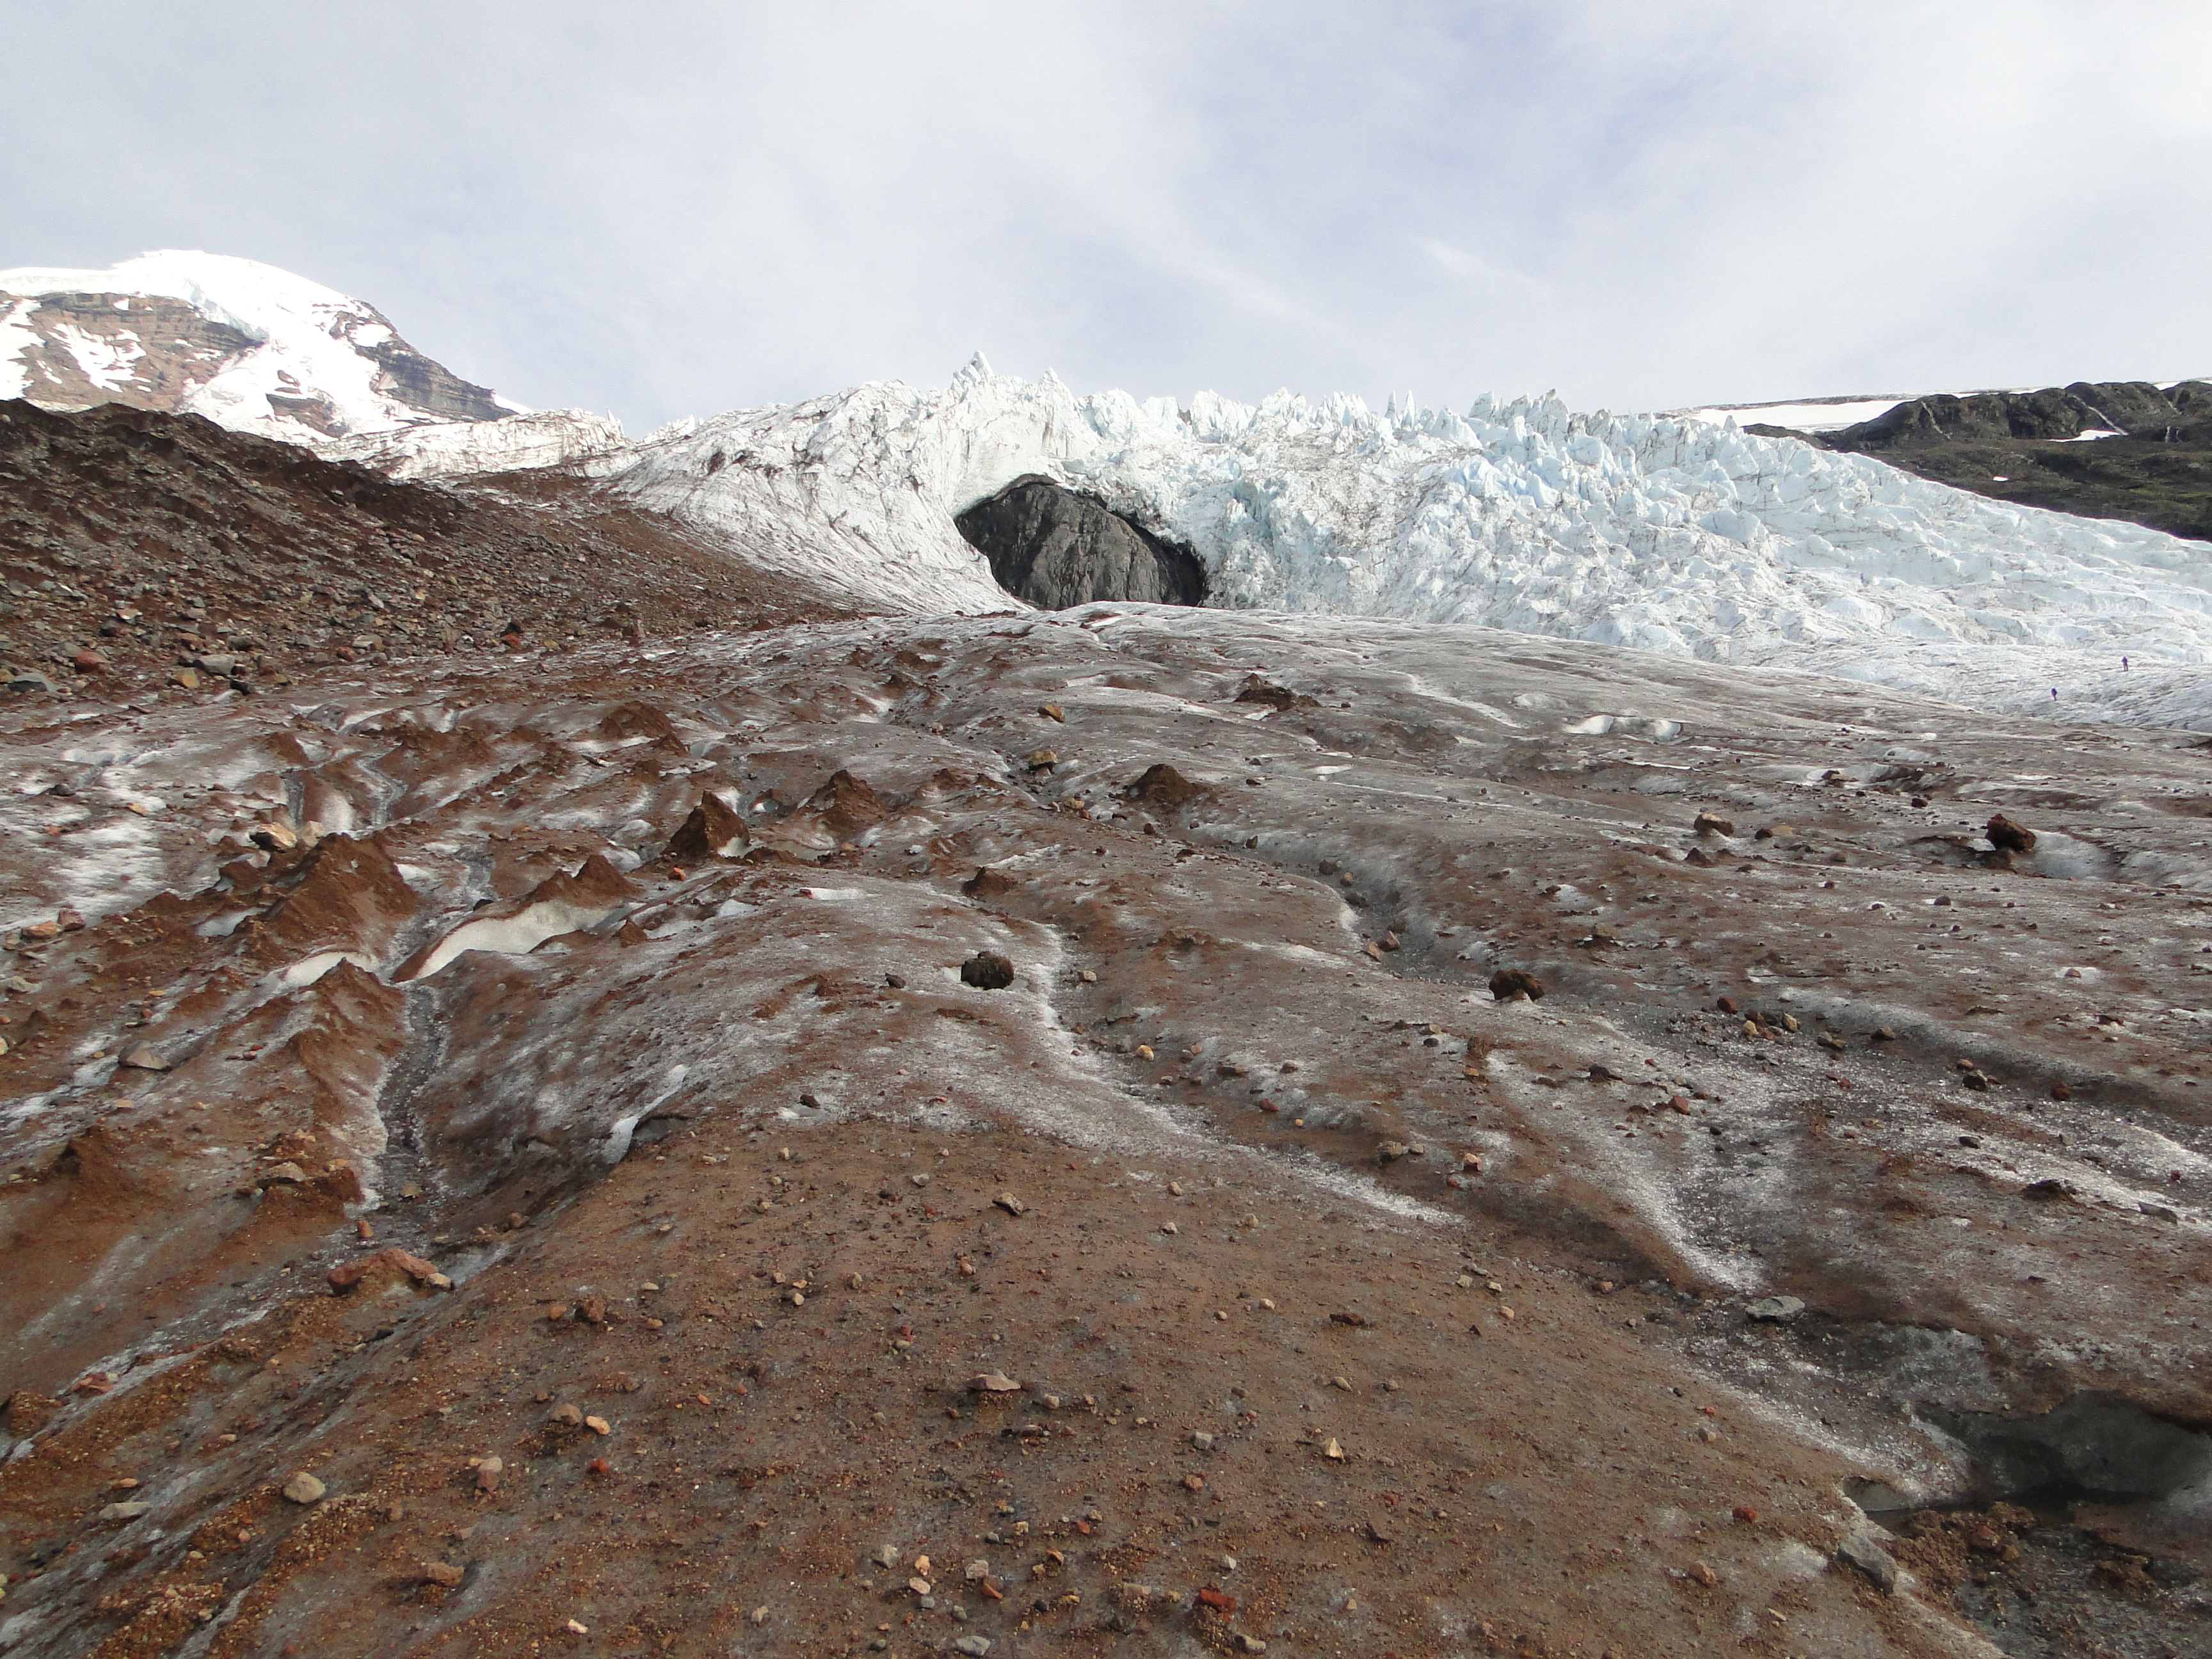
Deming Glacier, Mount Baker has now receded over 700 m since our first visit 35 years ago.

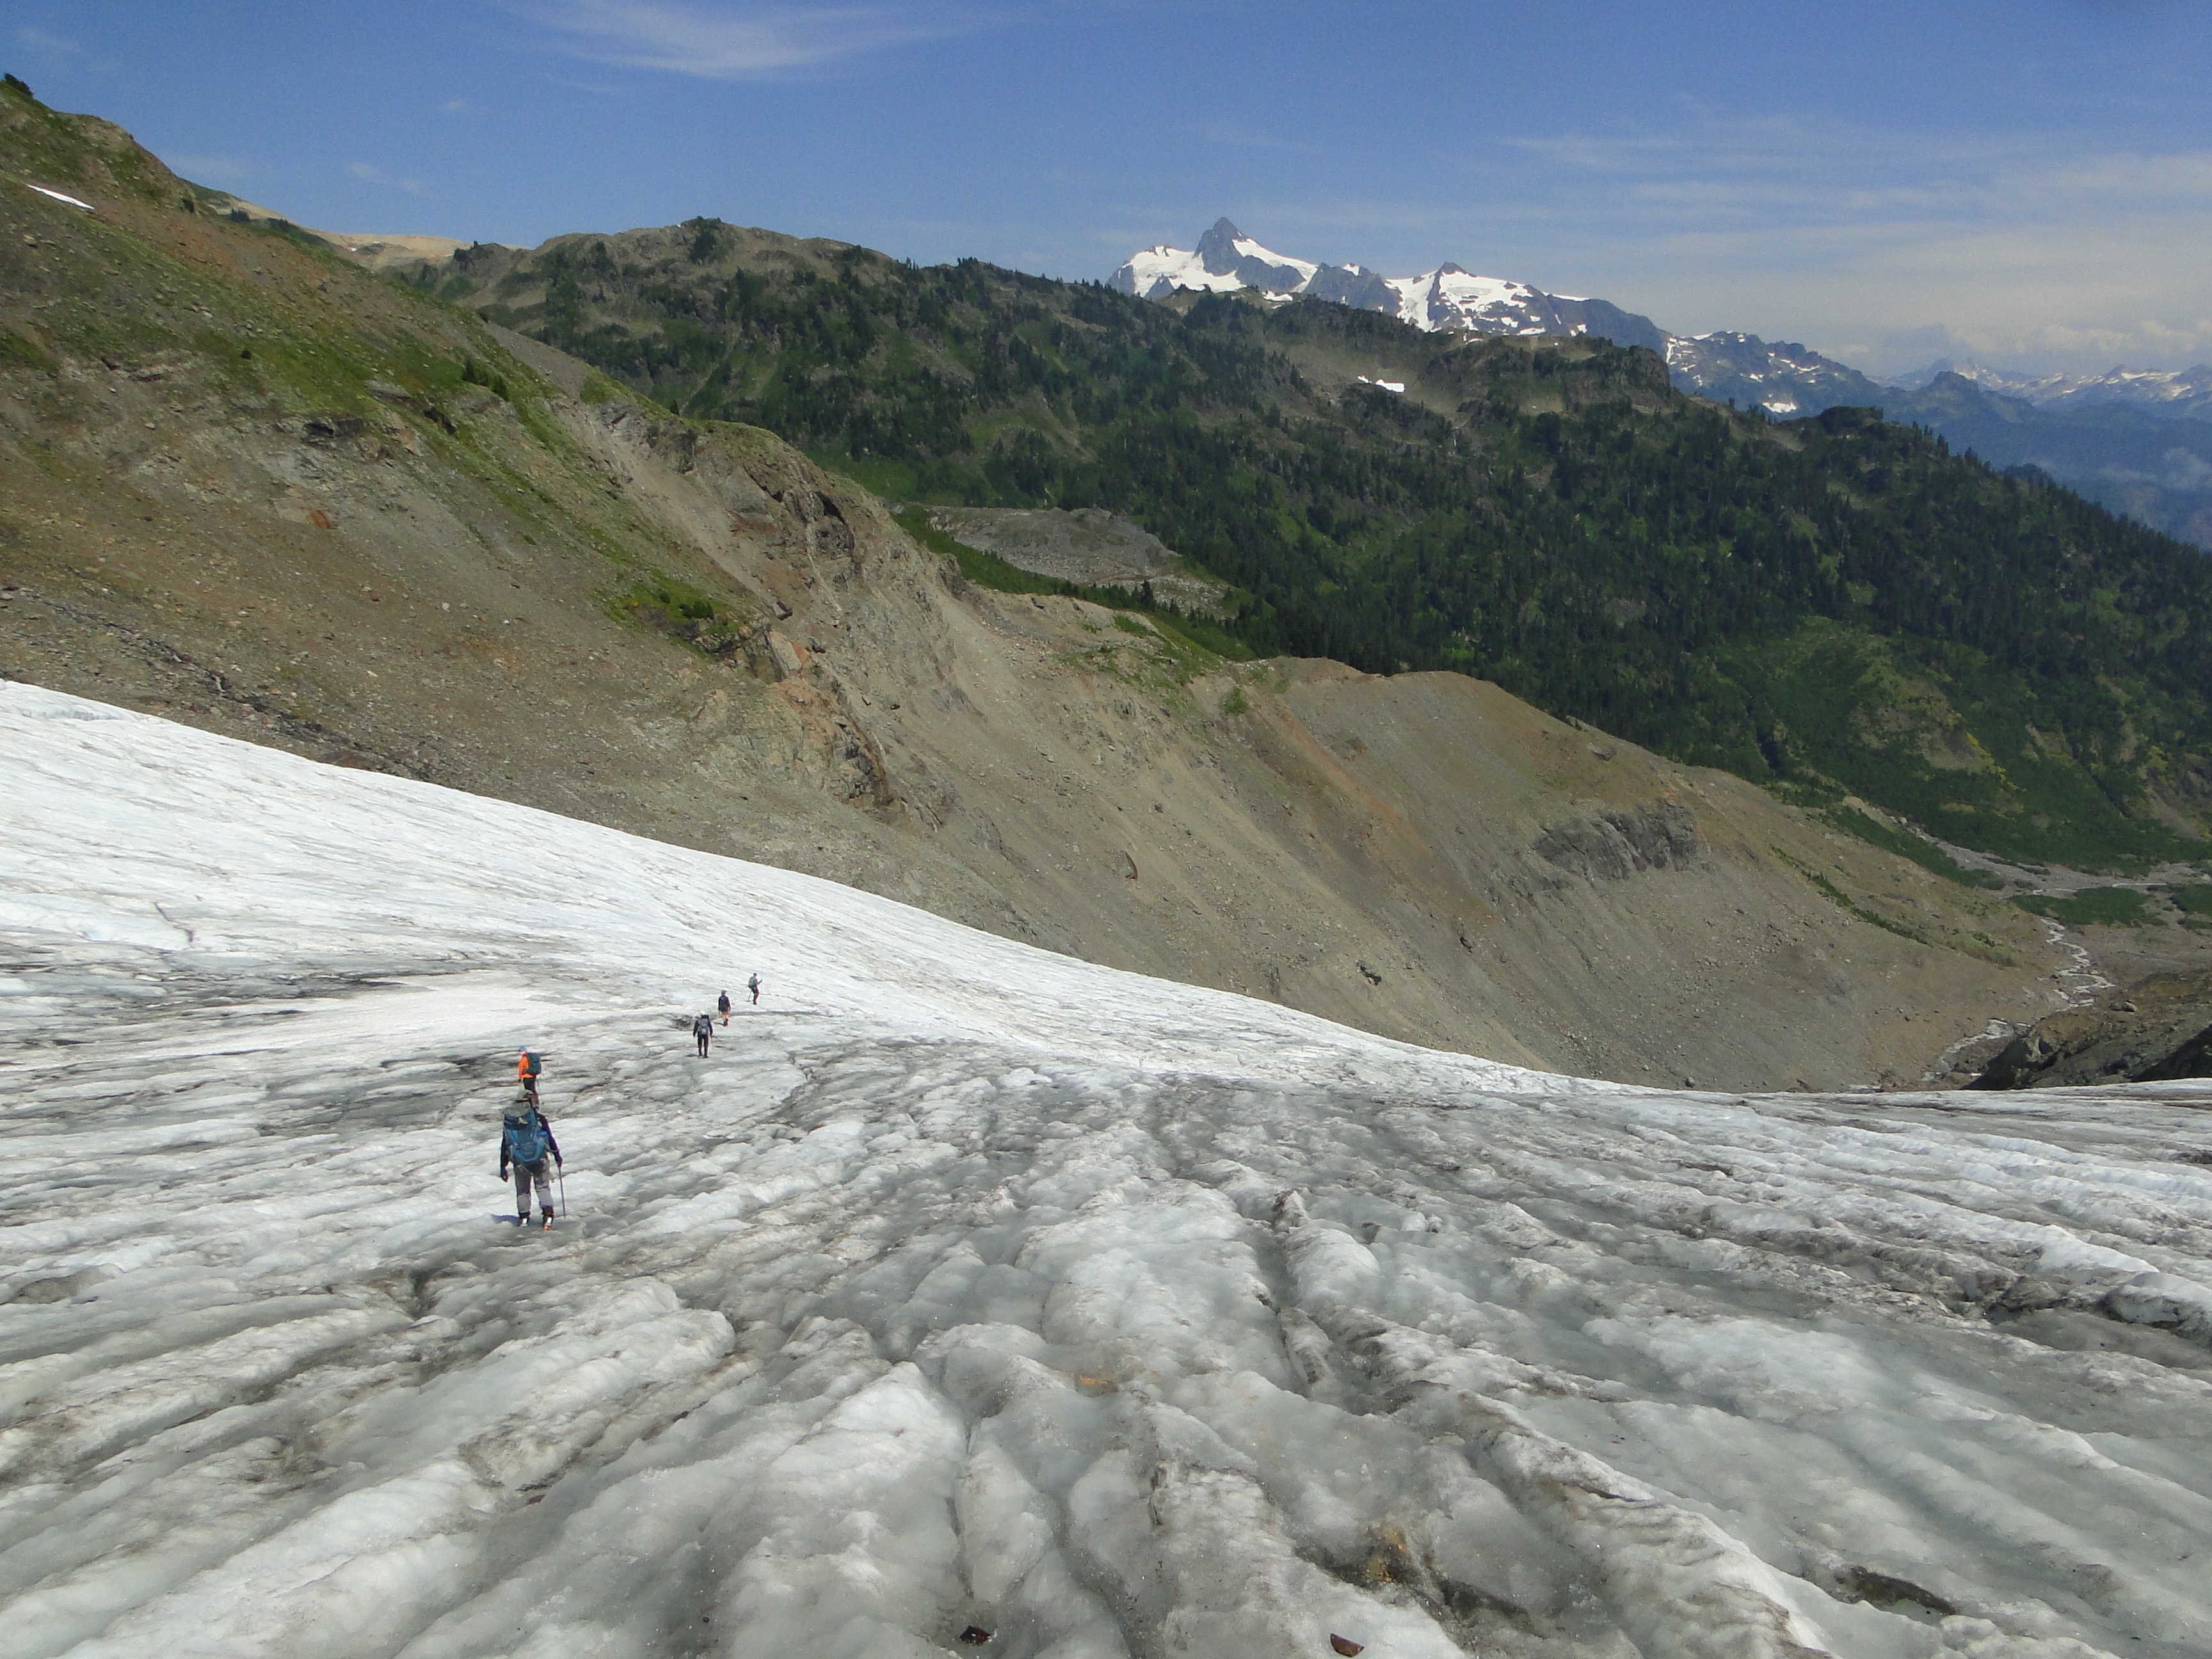
On Lower Curtis Glacier a key accumulation source the NE couloir now shows bedrock. Overall by summers end ~25% of the glacier will retain snowcover, far short of what is needed to maintain its volume.

The Lower Curtis Glacier terminus continues to retreat at 8 m/year, but thinning and slope reduction has been more notable.

In early August the majority of Sholes Glacier has lost its snowpack. The thin nature of the terminus indicates the glacier is poised for continued rapid retreat that has exceeded 15 m per year during the last 7 years.
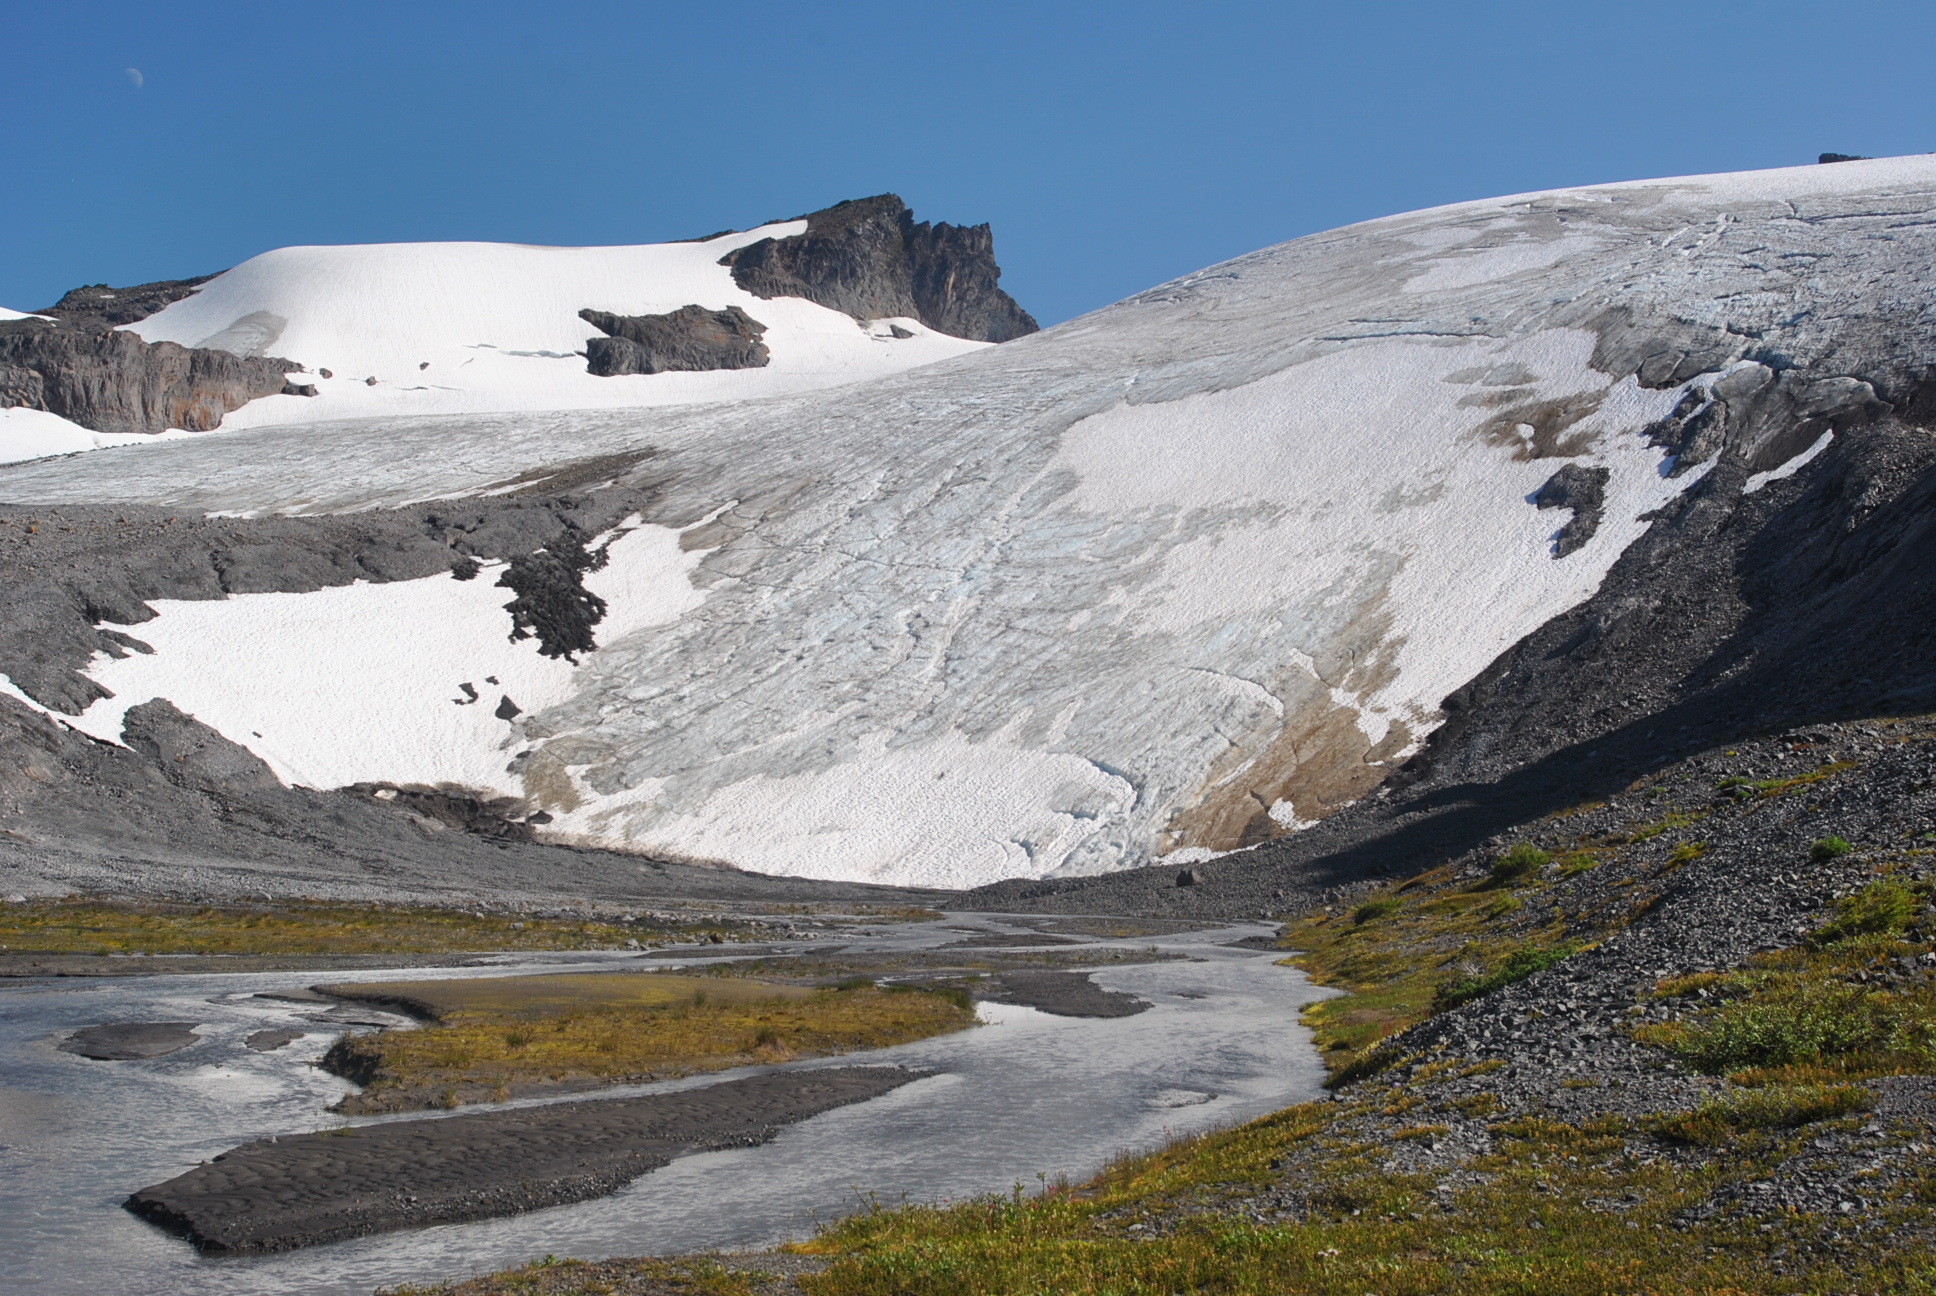
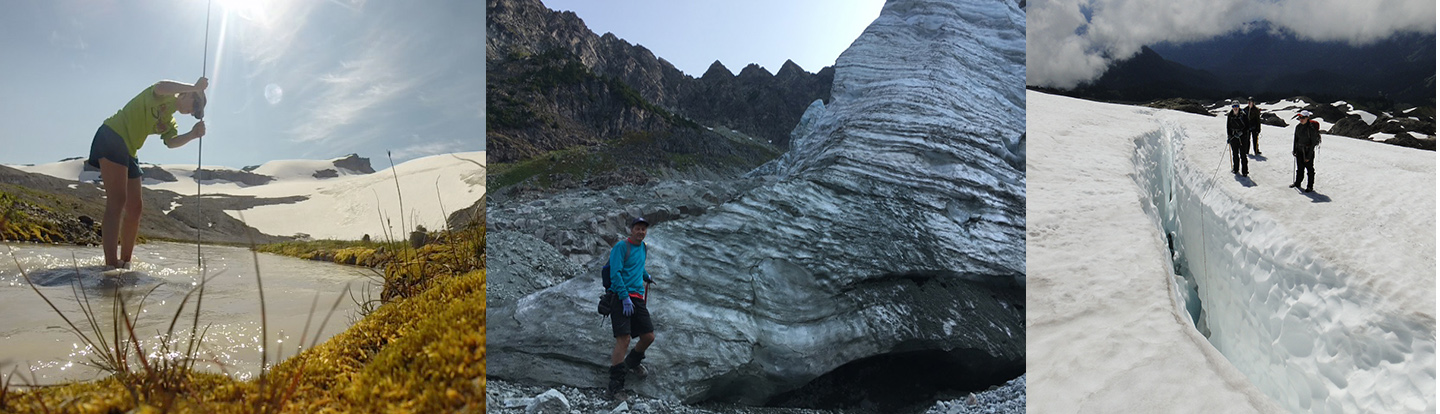
Runoff assessment confirmed ablation stake measurement of 11 cm of ablation/day from 8/6-8/8 on Sholes Glacier.
High on Rainbow Glacier there are still plenty of regions lacking snowcover, instead of a thick mantle of snowpack.
Rainbow Glacier was awash in meltwater streams, see video. This area should have 1 m of snowpack left. Rainbow Glacier has retreated 650 m since 1984.

Just getting to each glacier does involve overcoming various miseries.
A transect across lower Coleman Glacier, Mount Baker indicates 38 m of thinning since 1988.

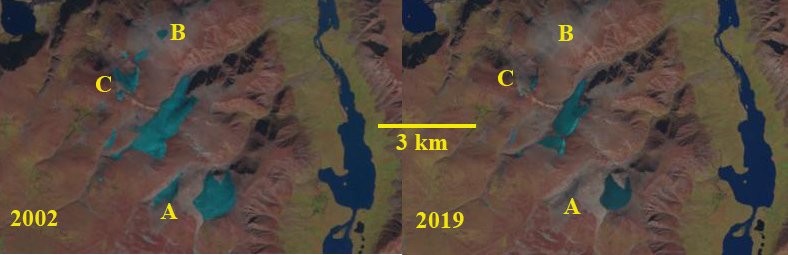
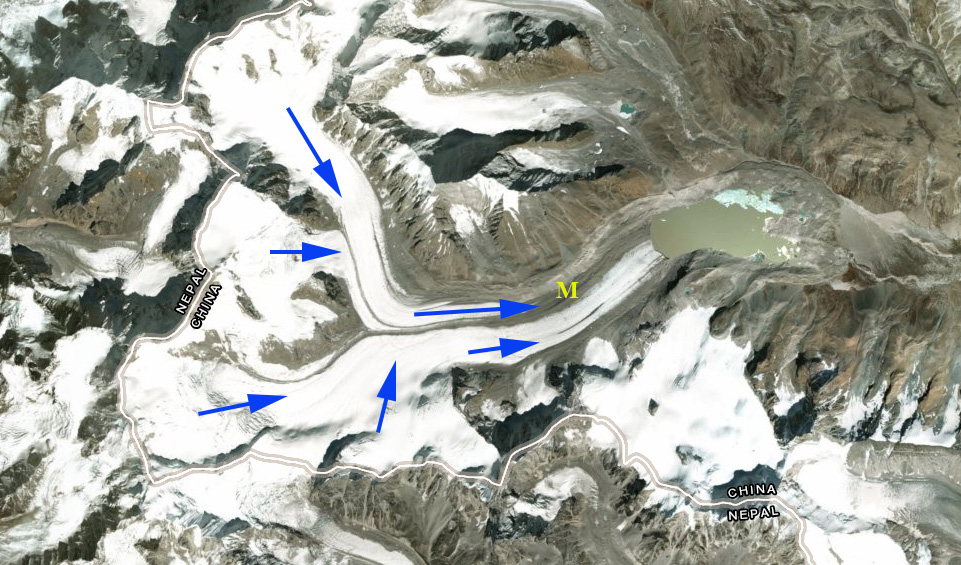
Limited snowpack remaining on Columbia Glacier, with six weeks of melt left. Lake in foreground expanded dramatically in last two years. Retreat ~45 m from 2017-2019 and 210 m from 1984-2019, more than 10% of its length.

Upper basin of Columbia Glacier mainly bare of retained snowpack.

Ice Worm Glacier terminates in expanding lake.

Ice Worm Glacier continues to retreat at the top and bottom of the glacier. Mass loss is leading to a more concave shape each year.

Daniels Glacier had a maximum snowpack of 1.75 m, instead of 4 m.

Foss Glacier measurements discontinued as it disintegrates, only 20% snowcover in mid-August.

Lynch Glacier less than 50% snowcovered with six weeks of melt left.

The team which completed over 1200 mass balance measurements, 40,000 vertical feet and 110 miles of travel across glacier clad mountains.