Kerguelen Island Glacier Retreat Expands Lake District

Eastern Outlet glaciers of Cook Ice Cap in a 2001 Landsat and 2019 Sentinel image indicating retreat from 2001 terminus positions (red arrows) to 2019 terminus location (yellow arrows).

The east side of the Cook Ice Cap on Kerguelen Island outlet glaciers have retreated expanding and forming a new group of lakes (Pelto, 2016).  Here we examine the changes from 2001-2019 along using Landsat and Sentinel imagery. Retreat of glacier in the region was examined by Berthier et al (2009) and is exemplified by the retreat of Ampere Glacier.  Verfaillie et al (2016) examined the surface mass balance using MODIS data, field data, and models.  The accelerating glacier wastage on Kerguelen Island was observed do be due to reduced net accumulation and resulting rise in the transient snowline since the 1970s, when a significant warming began.  This has led to nunatak expansion on the ice cap.

In 2001 the northern outlet glacier terminates in a wide portion of the proglacial lake #1.  The central outlet, #2, has two terminus locations the northern is in a proglacial lake that is 2.5 km long and the southern arm terminates on land.  The southern outlet terminates on land.  By 2011 the northern outlet has retreated into a narrow section of the proglacial lake. The center terminus has retreated with a new lake forming in front of its southern arm. The southern outlet has retreated revealing a new developing lake.  In 2014 the northern terminus has retreated from the primary proglacial lake. The central terminus is producing icebergs from both arms. The lake continues to expand at the southern outlet.  The 2019 image is from early in the melt season. The northern terminus has retreated 1100 m since 2001 and is no longer calving in a substantial lake. The central terminus has retreated with the northern and southern arm retreated 1500-1800 m, with a new lake forming in front of the southern arm.  The southern outlet glacier has retreated the most, 2100 m since 2001, leading to the formation of a new lake of the same length. Outlet glaciers of the ice cap that are not calving are also retreating indicating that the retreat has been driven by rising snowline and enhanced by calving. The central and southern outlets continue to calve and should continue retreat more rapidly than the northern outlet.

Eastern Outlet glaciers of Cook Ice Cap in a 2011 and 2014 Landsat images indicating retreat from 2001 terminus positions (red arrows) to 2019 terminus location (yellow arrows).

Digital Globe image of the Cook Ice Cap, with the main outlet, Ampere Glacier and the three glaciers examined here 1-3.


Stave River, BC Run of River Hydropower Changes with Glacier Retreat

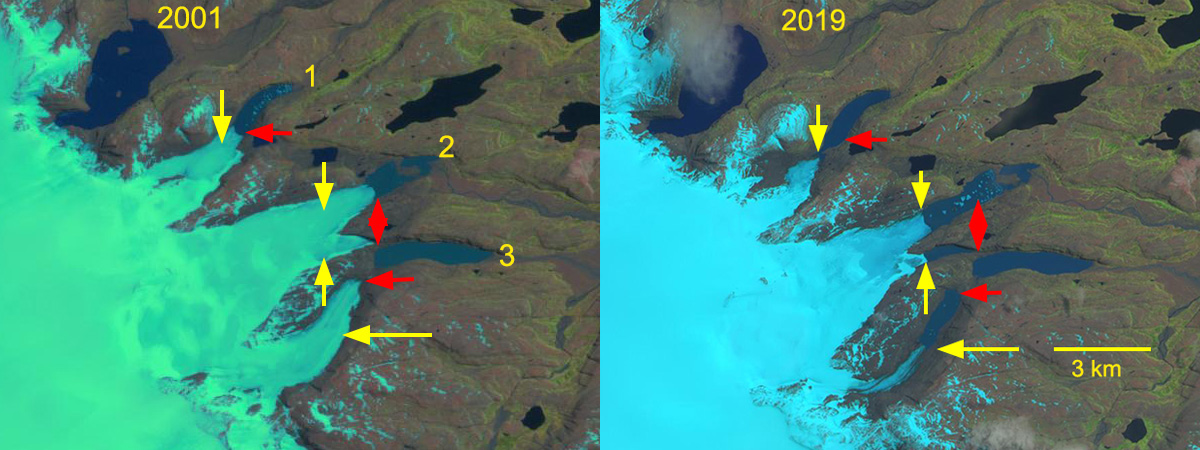
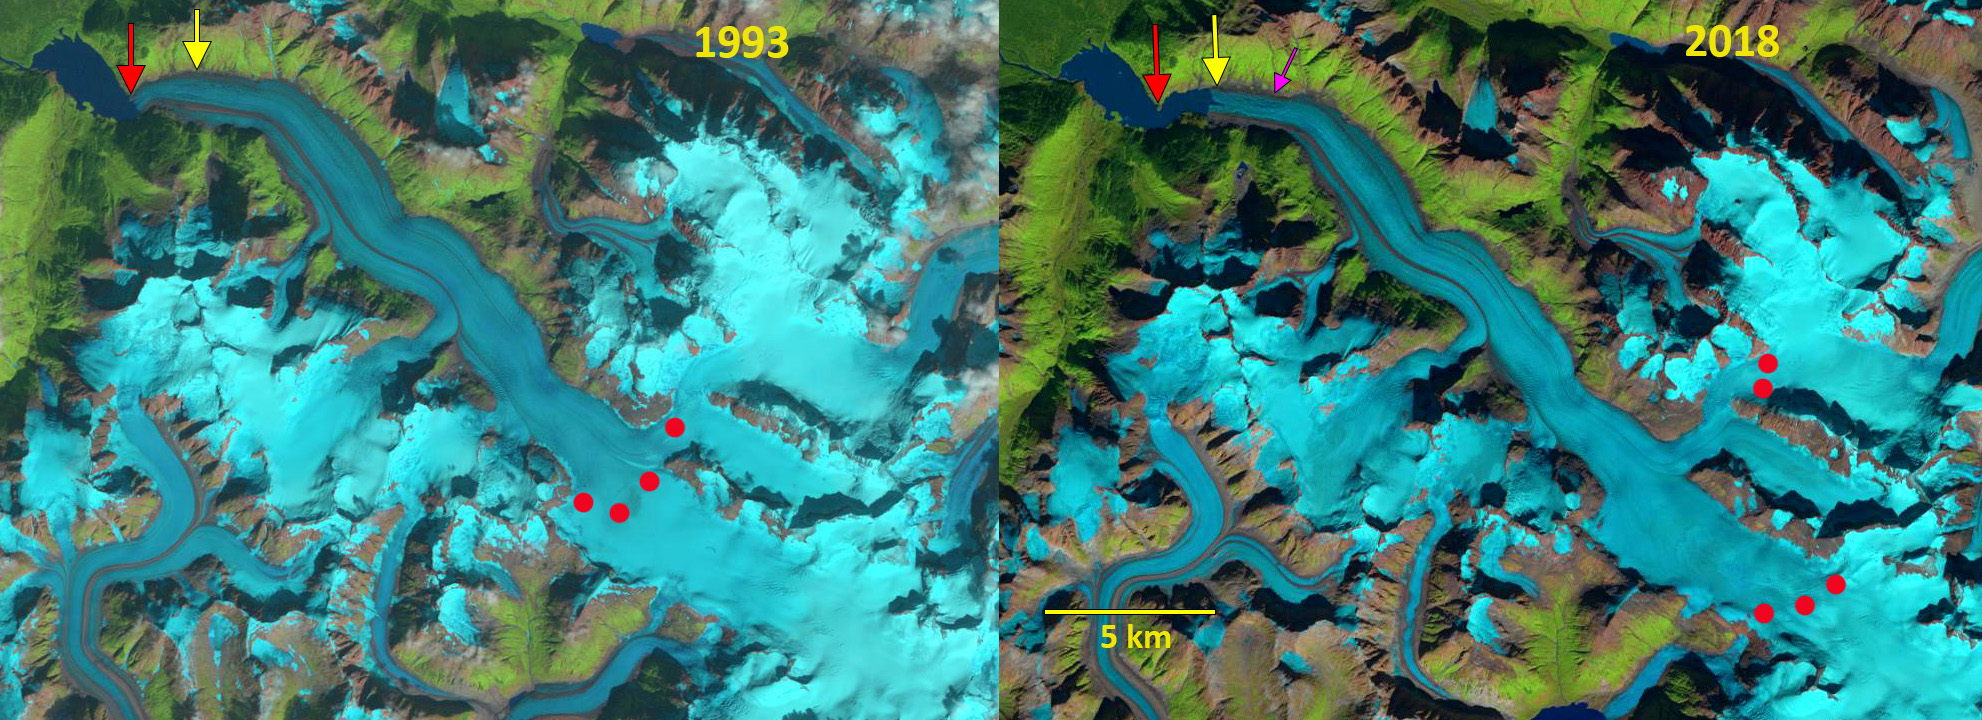
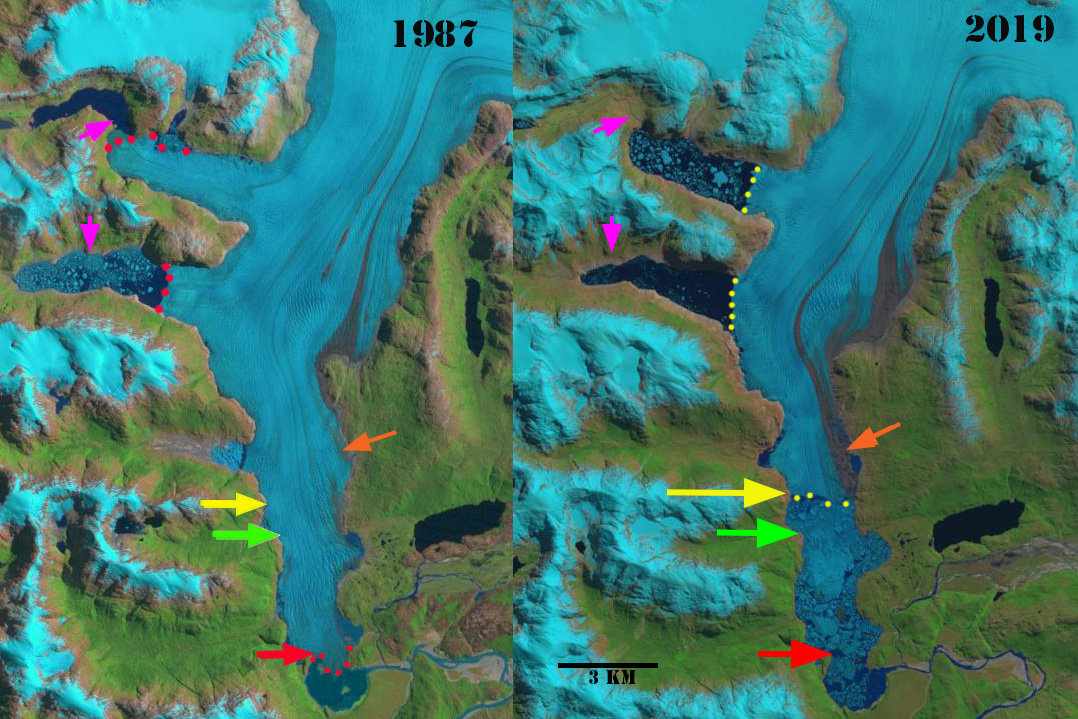
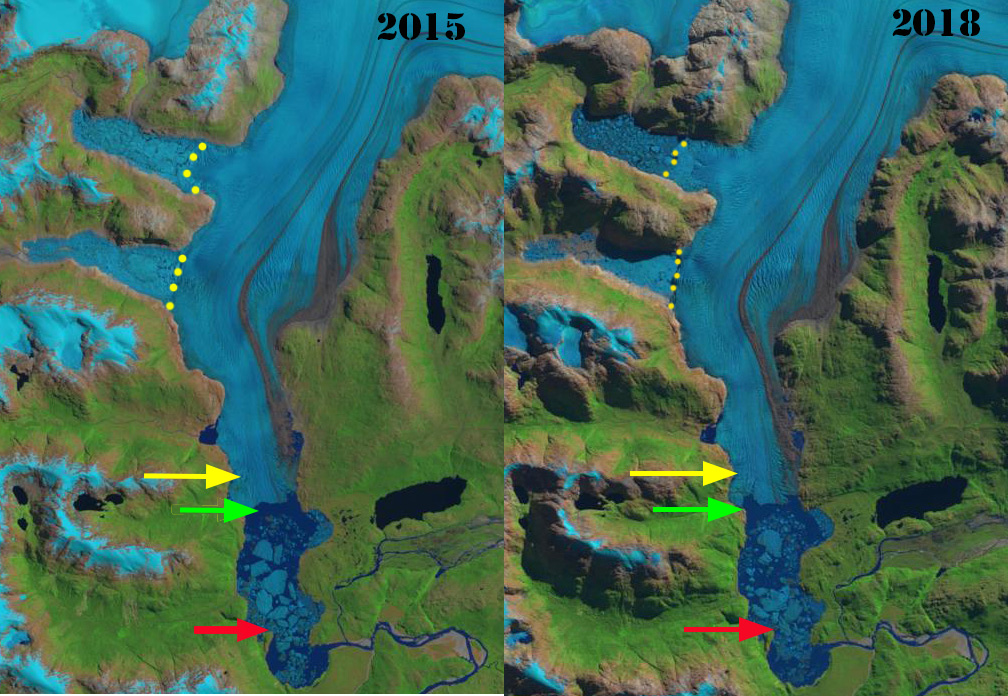
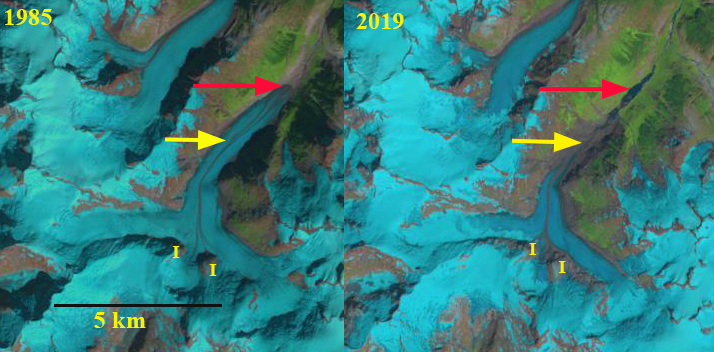
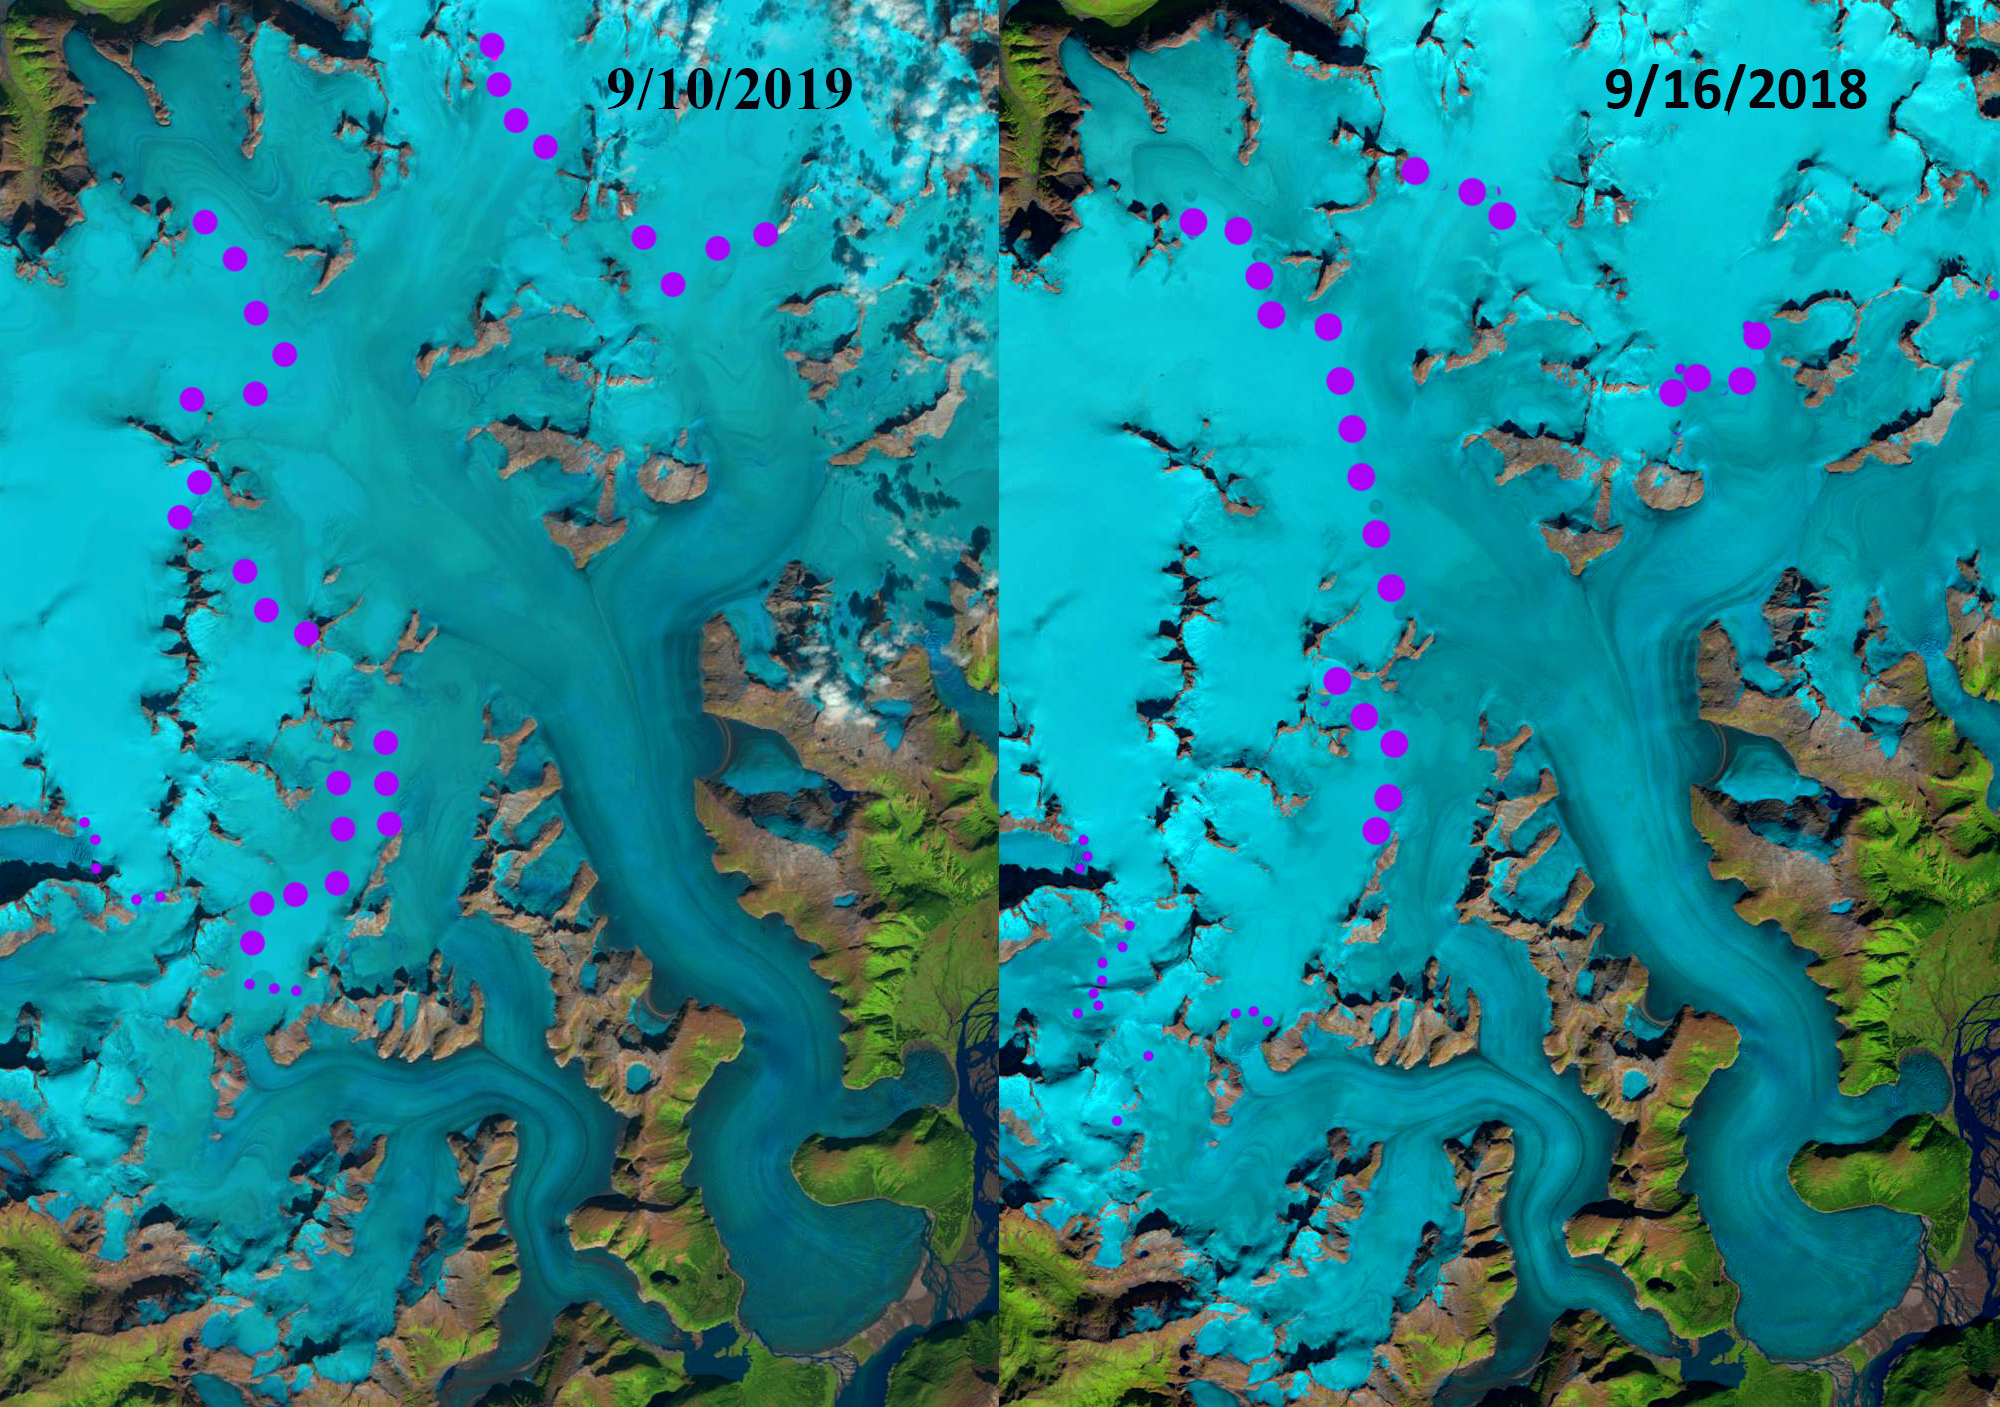
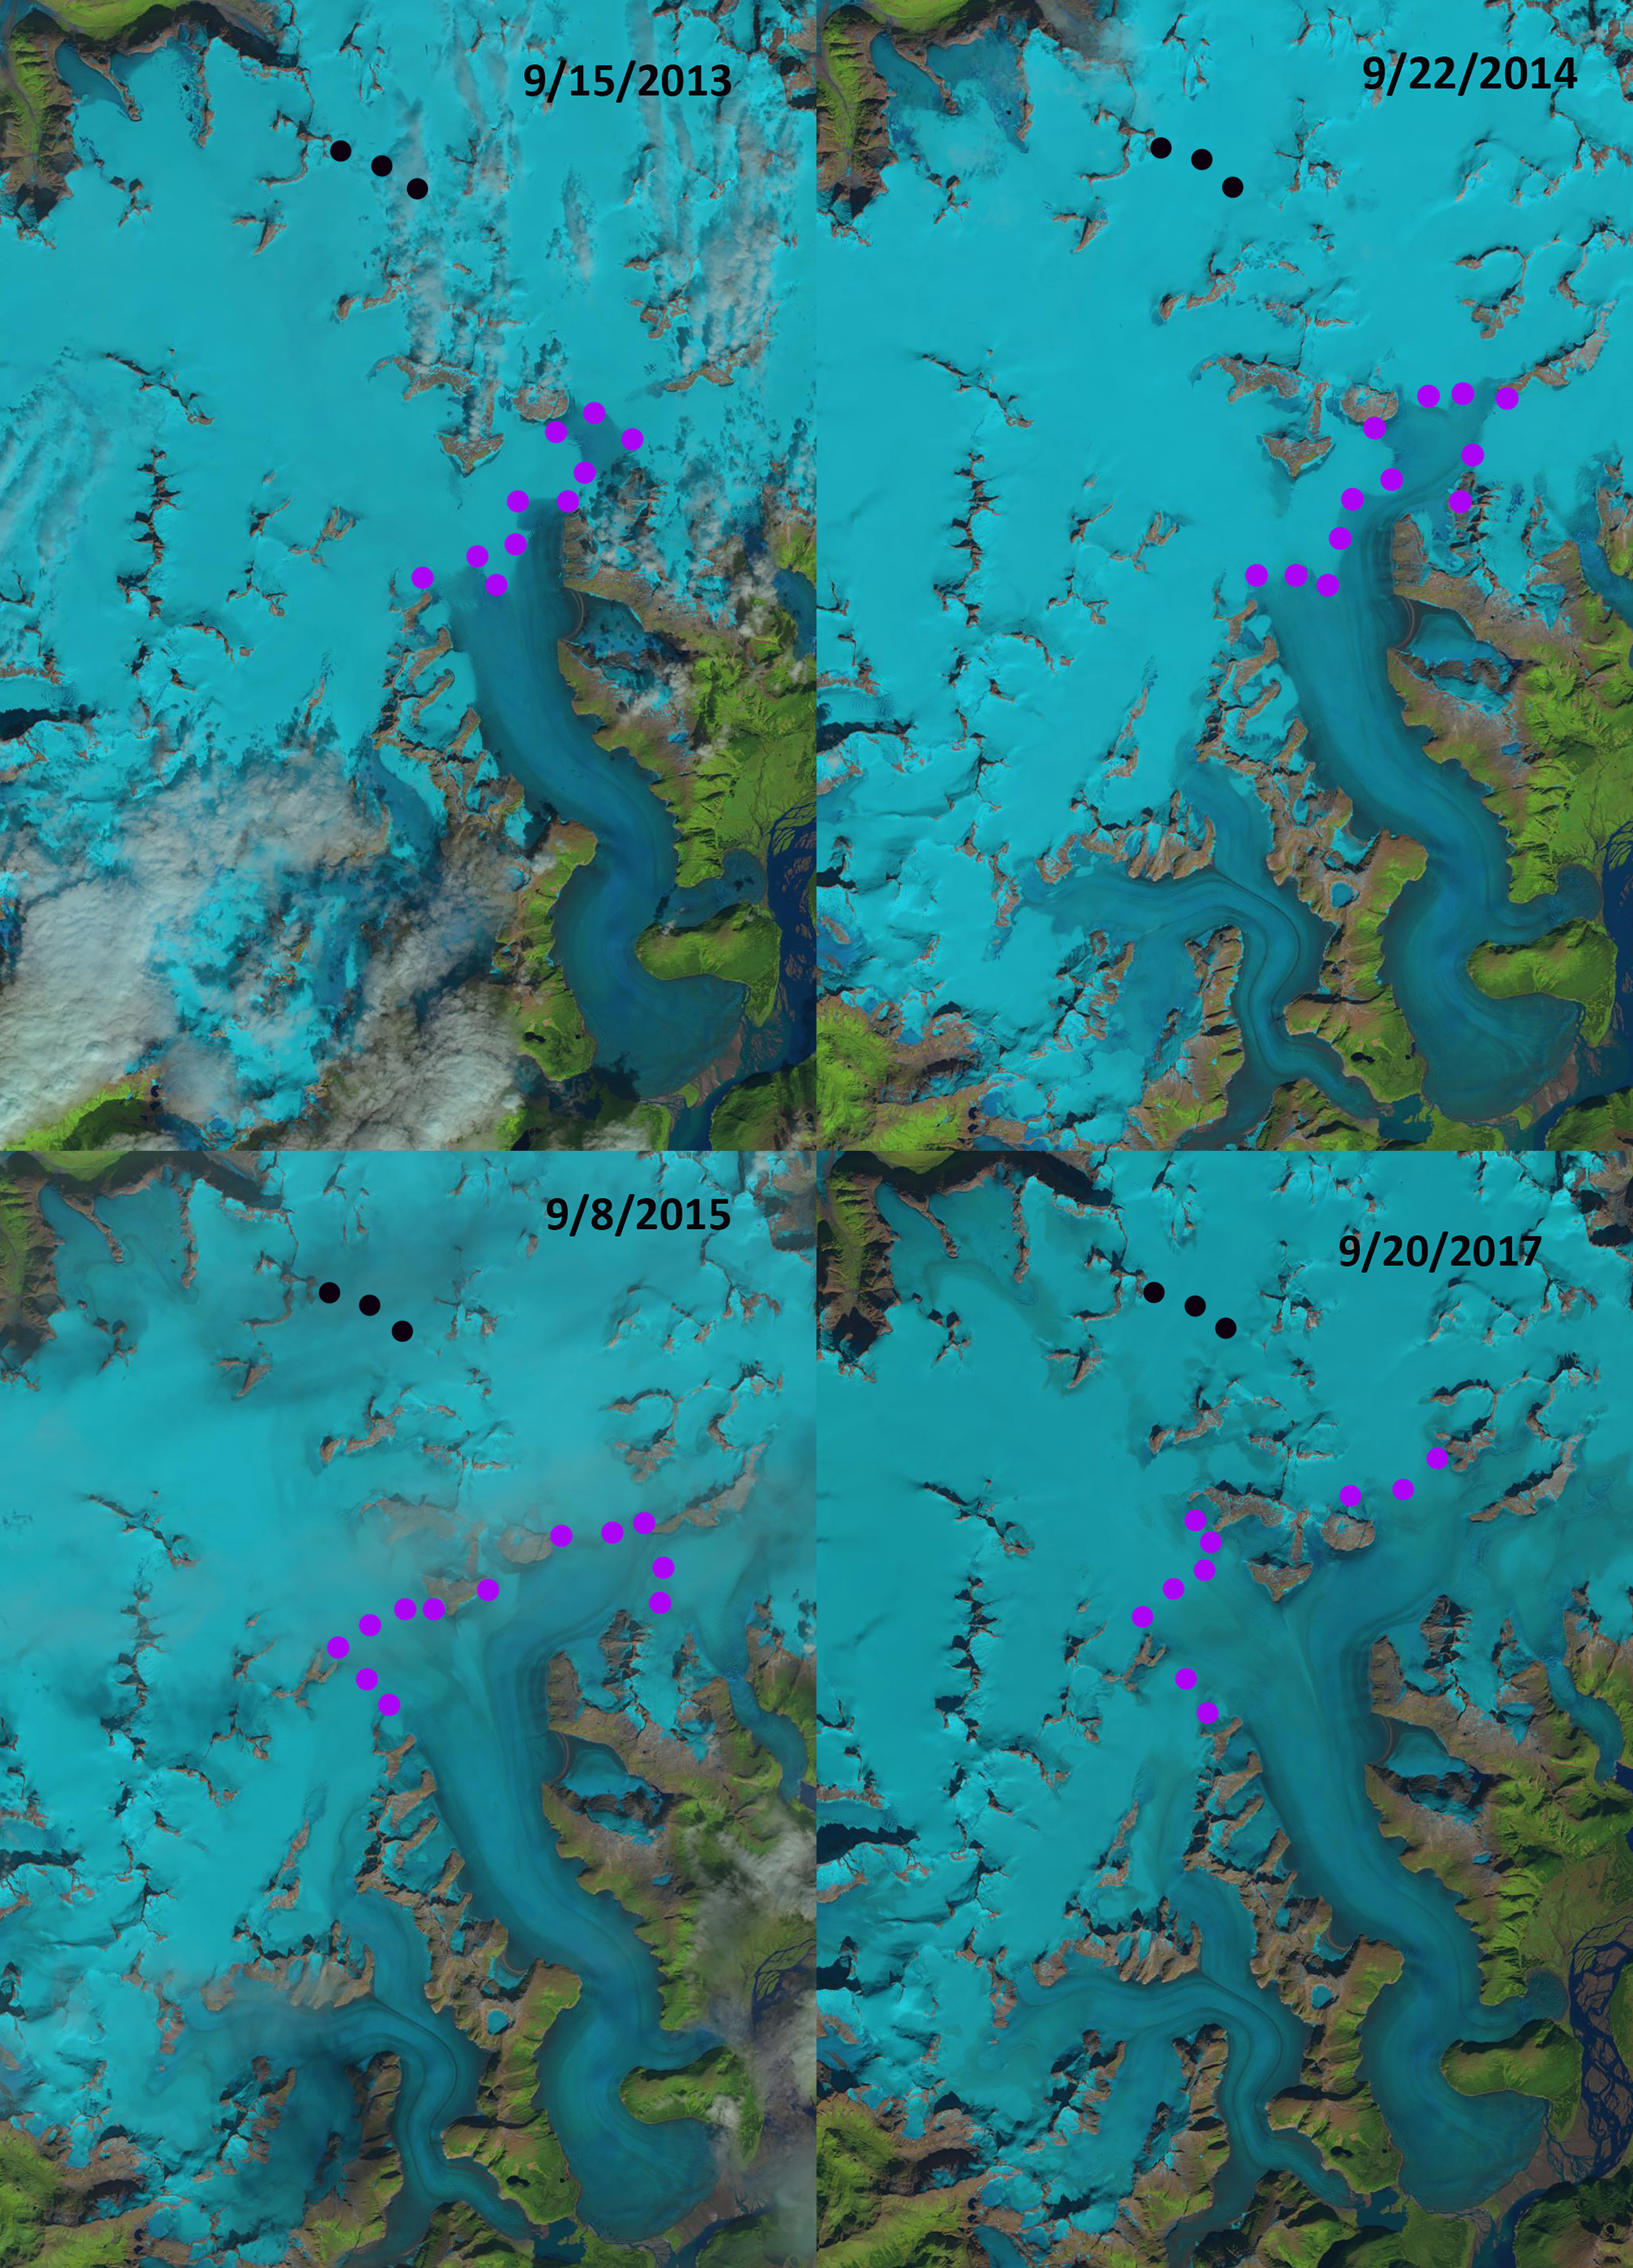
Stave Glacier area in 1992 and 2019 Landsat images illustrating the loss of glacier area.  Red arrows indicate 1992 terminus location, yellow arrow 2019 terminus location, Point 1-3 are proglacial lake that are evolving, P=Piluk Glacier and S=Stave Glacier.

Stave River drains into Stave Lake and has a 40 km length above the lake.  The basin has a glaciated area of 32 km2. The basin above Stave Lake has two Run of River Hydropower plants (RORH) .  The 17.5 MW RORH project on the Northwest Stave River was built by Innergex Resources and was opened in 2013. The facility is 18 km upstream of Stave Lake and has 1.9 km long diversion reach. The 33 MW RORH project on the Upper Stave River was built by Innergex Resources and was opened in 2011.  Stave River has a substantial fall run of Coho and Chum.  A decline in the salmon runs beginning in 2000 led to development of a Lower Stave river water use plan to reduce blockage at the Ruskin Dam hydropower site, which is not an RORH.  This has not led to a recovery of salmon, in fact the 2008-2012 population numbers are lower than prior [Ladell and Putt, 2015].  Stave River has a peak flow in June and mean July-September runoff is 37.4 m3s-1.

RORH lack significant reservoirs by definition and as a result cannot alter the discharge of a river or store water, including glacier runoff.  RORH divert a portion of a rivers discharge through the power system, reducing discharge for the diversion reach of the power system, before returning the water to the river. Mountainous nations with substantial hydropower potential and glaciers are expanding their use of RORH [Orlove, 2009].  The growth of RORH has been due to the lower cost of development and reduced environmental impact, which result from the absence of a large storage reservoir.

Peak streamflow in the alpine regions of the Pacific Northwest occur during the spring snow melt season. Glacier runoff peaks in the mid to late summer during the height of the ablation season, coincident with minimum streamflow of late summer and early fall.  The loss of glacier area from these watersheds thus reduces streamflow primarily during late summer minimum flow periods.  This has been observed in several Pacific Northwest basins where a decline of more than 20% in glacier area has led to a decrease in glacier runoff [Stahl and Moore, 2006; Pelto, 2011].  In such basins RORH will have a reduced seasonal production capacity.

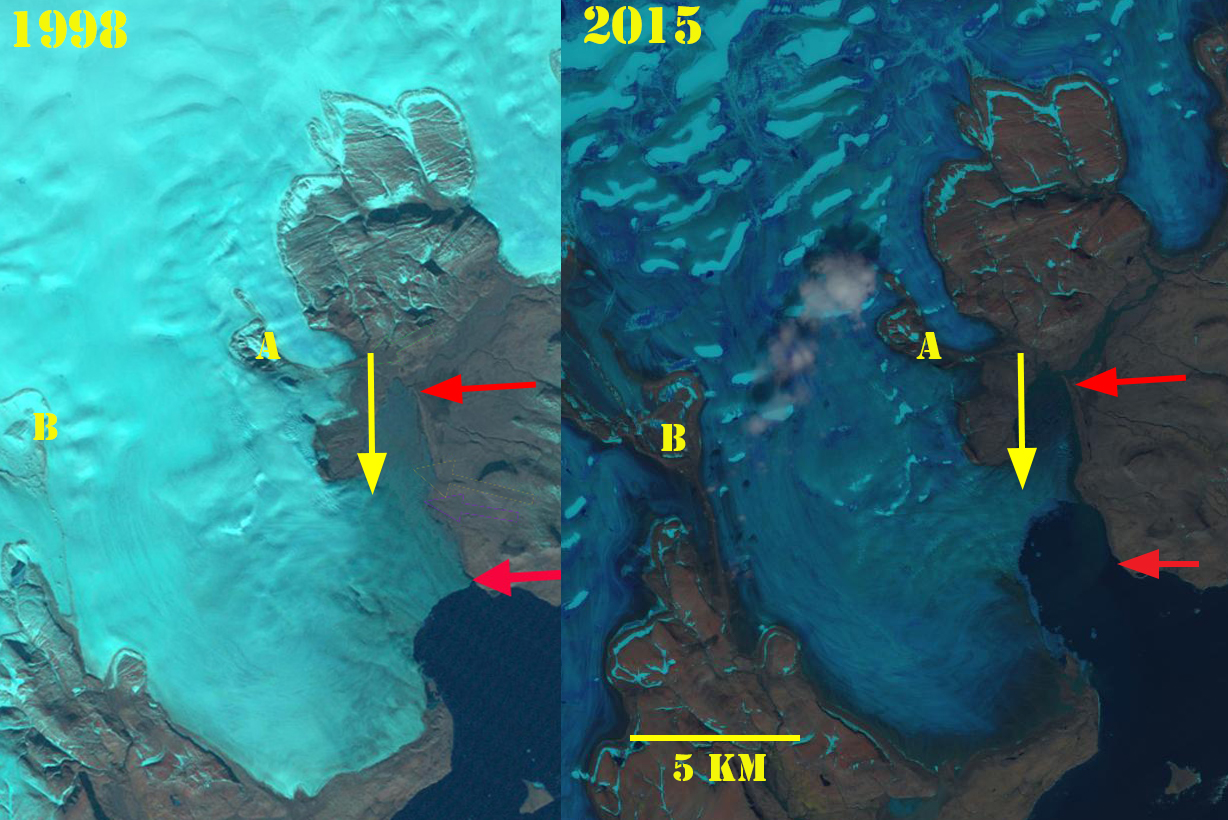
Stave Glacier, the largest glacier in the watershed, declined from 11.38 km2 in 1988 to 9.45 km2 in 2005 [Koch et al 2009] and 8.6 km2 in 2019. The terminus retreated 1900 m during the 1992-2019 period.  Piluk Glacier terminated in a proglacial lake in 1992.  By 1998 it had retreated from this lake and by 2015 a new proglacial lake was forming at Point 2. The glacier retreated 800 m from 1992 to 2019, and the area was reduced from 3.5 km2 to 2.0 km2 . The glacier lost all of its snowcover in 2015, and more than 90%in 2016 and 2019, indicating it cannot survive current climate. Point 1 indicates where a glacier terminates in a proglacial lake in 1992 at what is more of a pass than a valley.  This is still the case in 1998, but in 2015 the lake is no longer proglacial and only 20% of the 1992 glacier remains. Point 3 in 1992 is a glacier filled basin that is narrowly attached to an adjacent glacier. In 1998 the glacier still fills the basin but is no longer attached to the adjacent glacier. By 2015 the basin is mainly a proglacial lake.  In 2019 only a small section of glacier remains at the southwest edge of the lake.  There are two other glaciers between Stave Glacier and Piluk Glacier that are unnamed where red arrows indicate the 1992 terminus location.  The northern flowing of these glaciers has retreated 850 m, while the south flowing glacier retreated 400 m.  In both cases this represents more than 30% of the total glacier length.

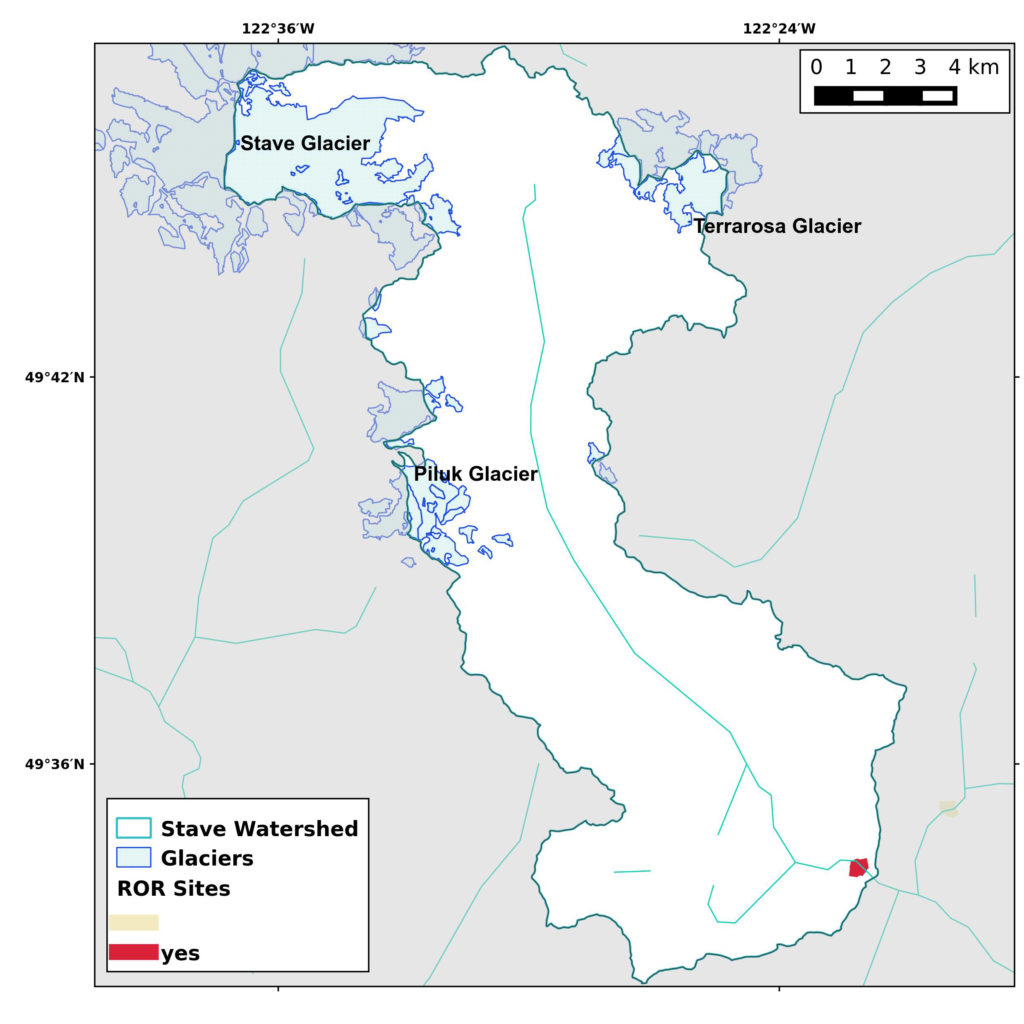
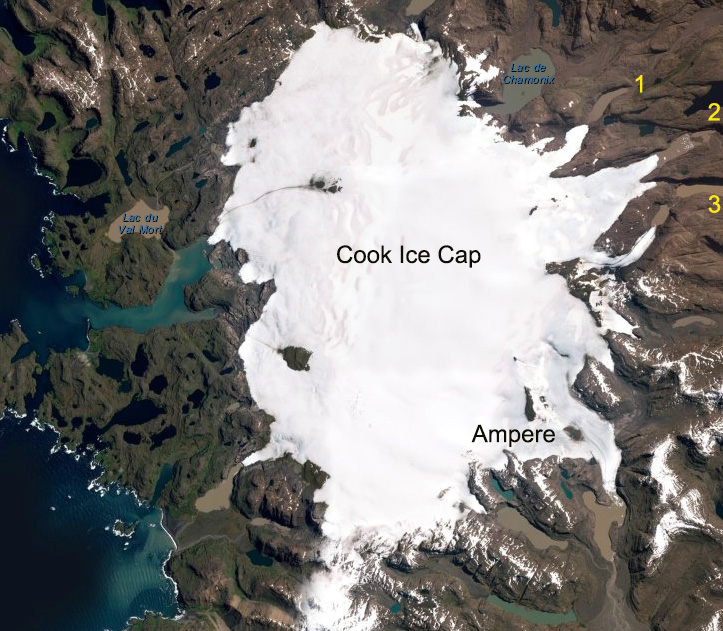
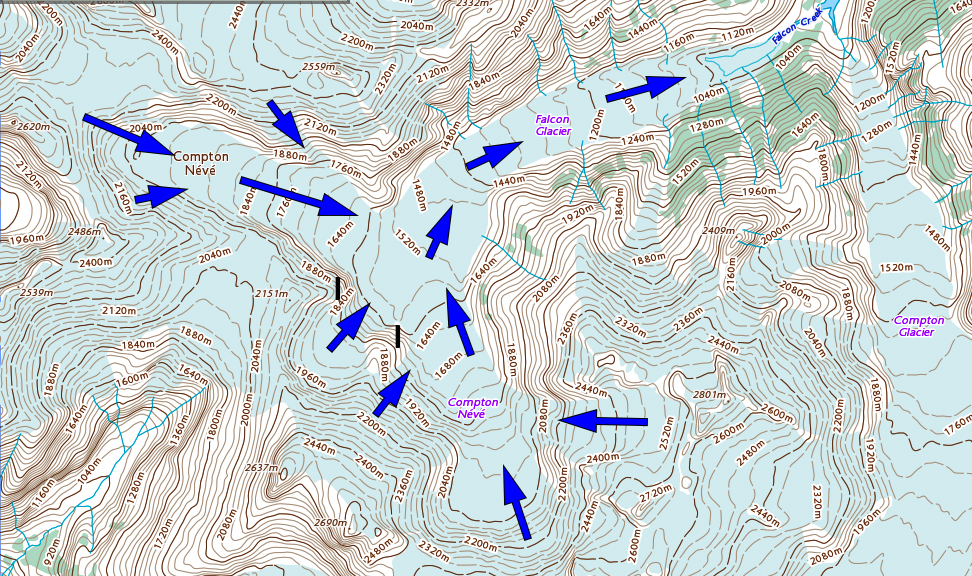
Stave River Basin, British Columbia indicating hydropower plants and glaciers in the basin (Map created by Ben Pelto)

Future Glacier Runoff and Hydropower Implications

Recent glacier runoff is determined from a mean observed regional summer balance of -2.9 m w.e.  Summer glacier runoff is 98.6 million m3, yielding a mean summer discharge of 7.5 m3s-1, which is 20 to 24% of total stream discharge.The rate of glacier area loss was 0.53%/year from 1985-2005 [Bolch et al 2010].  A continuation of this trend up to 2050 would yield a 24% area decline, with glacierized area in the basin of approximately 26 km2 in 2050.  Since 2005 the area loss has accelerated to ~1% /year.  This would lead to an area of  22.4 km2. A greater decline is likely however, as modeled warming of 2.2 ˚C by 2050 would lead to higher ablation rates [Clarke et al 2015].  Using the temperature index model and applying the increased temperature yields a mean summer balance of -3.5 m w.e., yielding 78.4 million m3.  This is equivalent to mean summer discharge of 5.9 m3s-1, a 20% decline from present glacier runoff. in 2050. The reduced glacier runoff will add to the earlier snowmelt runoff in the region through 2050 leading to significantly reduced late summer discharge and hydropower potential in the Stave River basin. Peak glacier runoff has passed and an ongoing decline will occur as is the case at many basins in the region including the Nooksack Basin in Washington (Pelto, 2015).

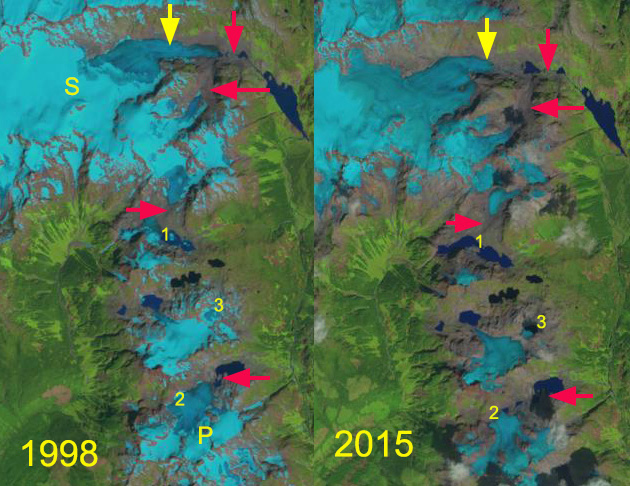
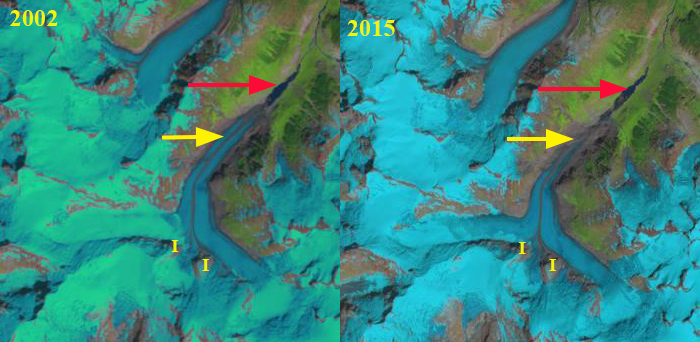
Stave Glacier area in 1998 and 2015 Landsat images illustrating the loss of glacier area.  Red arrows indicate 1992 terminus location, yellow arrow 2019 terminus location, Point 1-3 are proglacial lake that are evolving, P=Piluk Glacier and S=Stave Glacier.


Austre Torellbreen, Svalbard Retreat and Nunatak Expansion

Austre Torellbreen in 2000 and 2019 Landsat images.  Red arrow is the 2000 terminus location, yellow arrow the 2019 terminus location. Point 1,2 and 3 are nunatak areas that are expanding.

Austre Torellbreen is an outlet glacier on the southwest coast of Svalbard.  It is just west of calving glacier that are retreating such as Paierbreen and Samarinbreen and adjacent to the land terminating Nannbreen. Blaszczyk et al (2008) report the velocity of Austre Torellbreen near the calving front of 220-265 m/year. Nuth et al (2013) determined that the glacier area over the entire archipelago has decreased by an average of 80 km per year over the past 30 years, a 7% reduction.

In 2000 the calving front is 4.7 km wide and has a low slope at the terminus with the surface reaching 150 m 2.5 km from the calving front.  The calving front is at a point where the embayment widens upglacier and has outwash plains on either side of the margin. The snowline is at 300 m in 2000.  At Point 1 is an isolated nunatak and at Point 2 and 3 are limited ridges extending from nunataks. By 2014 the glaciers western margin has retreated into the widening embayment, with more limited retreat in the center and eastern margin of the glacier.  By 2019 the Austre Torellbreen western margin has retreated 2400 m, while the eastern margin has retreated 800 m. The terminus has narrowed to 4.2 km and is retreated from an area of low slope margins to a location between two peak Brattho and Raudfjellet. There is an area of extensive crevassing at the current calving front, suggesting that further calving retreat will occur. At Point 1 the nunatak has expanded in area and vertical relief. At Point 2 the ridge that was separated in two segments has joined into a single ridge.  At Point 3 the ridge has extended by 500 m and has a greater relief in 2019.  The nunataks and mountain ridges that are amidst and adjacent to Austre Torellbreen can be seen to emerge and expand from 2000 to 2019 as the glacier thins.  This thinning leads to the retreat that is enhanced by calving.


Austre Torellbreen in TopoSvalbard map from circa 2000 and in a visual image from 2014.

Austre Torllbreen in 2014 Landsat image. Red dots indicate the snowline at 350 m.

Wright Glacier, Alaska Snowline and Terminus Retreat

Wright Glacier in 1984 and 2019 Landsat images.  The red arrow indicates 1984 terminus location, yellow arrow 2019 terminus location, pink arrow where the surface slope steepens and red dots indicate the snowline. 

Wright Glacier is the largest glacier draining an icefield just south of the Taku River and the larger Juneau Icefield. The glacier accumulation zone is mainly in British Columbia.  The glacier filled a lake basin in 1948 as illustrated by the USGS map and  NSIDC collection,  though the terminus is beginning to break up.

In 1984 the glacier ended at a peninsula in the lake where the lake turns east.  This was my view of this glacier during the summers of 1981-1984 from the Juneau Icefield with the Juneau Icefield Research Program. Our bad weather came from that direction so keeping an eye on that region during intervals between weather events was the practice. Here we examine Landsat imagery from 1984-2019 to document the retreat of Wright Glacier and the rise in elevation of the snowline.

In 1984 the lake had a length of 3.1 km extending northwest from the glacier terminus. The snowline in mid-August with a month left in the melt season was at 1150 m at a main glacier junction.  By 1993 the glacier had retreated little on the north side of the lake and 200 m on the south side. The snowline in mid-September close to the end of the melt season was at 1150 m. By 2013 the glacier had retreated 900 m and was terminating in a narrower portion of the expanding lake, 30 m/year. The snowline was again at the main junction near 1150 m. In 2018 the snowline on September 16th was at 1450 m with less than 25% of the glacier in the accumulation zone.  In 2019 on Aug. 2 the snowline was at 1500 m, likely the highest snowline in the last 70 years, as was the case at nearby Taku Glacier. The high snowlines of recent years has driven an acceleration of the retreat of 1000 m since 2013, 150+ m/year. The glacier has a steeper surface slope 2 km beyond the current terminus front indicating the lake ends either near this point, pink arrow.  This could lead to a reduction in the retreat rate, though calving has not been a major factor in retreat of this glacier.

The glacier drains the same icefield as the retreating West Speel and Speel Glacier.

Wright Glacier in 1993 and 2018 Landsat images.  The red arrow indicates 1984 terminus location, yellow arrow 2019 terminus location, pink arrow where the surface slope steepens and red dots indicate the snowline.

Wright Glacier in 2013 Landsat images and USGS Topo imagery.  The red arrow indicates 1984 terminus location, yellow arrow 2019 terminus location, pink arrow where the surface slope steepens and red dots indicate the snowline.

Kropotkina, Novaya Zemlya Retreat Opens 12 km2 Embayment 1988-2019

Kropotkina Glacier, Novaya Zemlya in 1988 and 2019 Landsat images. Red arrow marks the 1988 terminus location and yellow arrow the 2019 terminus location.  Point A and B mark nunataks in 1988.

Kropotkina Glacier is a tidewater glacier on the southeast coast of Novaya Zemlya that drain into Vlaseva Bay.  The glaciers terminate in the Kara Sea and has been retreating like all tidewater glaciers in Novaya Zemlya LEGOS, 2006 .  The map shown below from this project indicates the lack of an embayment in 1952, red dashed line and limited retreat from 1952-1988. Carr et al (2014) identified an average retreat rate of 52 meters/year for tidewater glaciers on Novaya Zemlya from 1992 to 2010 and 5 meters/year for land terminating glaciers.  Carr et al (2017) found that between 2000 and 2013, retreat rates were significantly higher on marine-terminating outlet glaciers than during the previous 27 years. Here we examine Landsat imagery from 1988 to 2019 to identify changes in Kropotkina Glacier.

In 1988 the southern terminus is at the red arrow indicating a peninsula on the east side of the terminus, while the northern terminus is at the margin of a proglacial lake. Point A and B are nunataks. In 1998 the southern terminus has not changed significantly.  The northern terminus has not retreated significantly, but the proglacial lake has drained. By 2015 the terminus tongue in the embayment has largely collapsed, though a tongue of ice reaches across this embayment. An area of more 7 km2 has gone from glacier ice to embayment since 1998. Point A is no longer a nunatak as marginal retreat has reached this point.  The snowline in 2015 is also higher than is typically observed extending beyond the image area and is above 800 m.

By 2019 the main embayment is free of ice, having expanded by 12 km2, as the result of terminus retreat. The terminus is now oriented north-south with a 6 km long calving front. The 2019 snowline is at 750 m.Point B remains a nunatak, but not for long with the continued high snowlines seen in 2015, 2018 and 2019. The retreat has mainly been via calving, and with an expanding calving front and reduced pinning points along the margin, the rapid retreat and area loss is not over.  How deep the water is at the calving front will determine how limited calving will be going forward.  The retreat of this glacier is substantial as has been the norm for tidewater glaciers such as Inostrantseva Glacier, Vera Glacier,  Mack and Velkena Glacier or Chernysheva Glacier, with the formation of new islands and glacier separation common place Pelto (2017)  and GlacierHub.

Kropotkina Glacier, Novaya Zemlya in 1998 and 2015 Landsat images. Red arrow marks the 1988 terminus location and yellow arrow the 2019 terminus location.  Point A and B mark nunataks in 1988.

kropots map

Map of the region from  LEGOS, 2006 with elevations indicated.

Steffen Glacier, Chile Calving Retreat Acceleration 2019

Steffen Glacier in 1987 and 2019 Landsat images.  Red arrow is 1987 terminus location, green arrow 2015 terminus location, yellow arrow 2019 terminus location, orange arrow an area of expanding debris cover and the pink arrow locations indicating water level decline in proglacial lakes by the northwest and midwest secondary terminus. The terminus locations are also noted by red dots for 1987 and yellow dots for 2019.

Steffen Glacier is the south flowing glacier from the 4000 square kilometer Northern Patagonia Icefield (NPI). Several key research papers have reported on the spectacular retreat of this glacier in recent years. Here we update those results using Landsat imagery from 1987-2019 to fully illustrate the changes. Rivera et al (2007) reported that Glaciar Steffen lost 12 km2 and had an average thinning of 1.5 m in the ablation zone from 1979-2001. A JAXA EORC, 2011 report compared parts of the Glaciar Steffen terminus change from 1987 to 2010. They noted a retreat of approximately 2.1 km of the main stem and 870 m of a western terminus.  Davies and Glasser (2012) in examining changes in Patagonian glaciers that the rate of area loss of the NPI increased dramatically after 2001, and has been 9.4 km2/year.  Glasser et al (2016) report that NPI proglacial lake area expanded from 112 km2 to 198 km2 from 1987 to 2015, debris cover area expanded from 4.1% of the NPI to 7.9% during the same period. After 2003 the snowline was noted to have risen ~100 m.  Dussaillant et al (2018) determined the annual mass loss of NPI at ~-1 m/year for the 2000-2012 period, with Steffen Glacier at -1.2-1.6 m/year.

In 1987 the lake at the terminus of the glacier was 1.3 km long from north to south. There are two substantial proglacial lakes with secondary termini on the west side of the glacier, the northwest extends 4 km west from the main trunk, the midwest tongue extends 1.7 km from the main trunk. In  1999 there is little retreat on the west side of the main terminus, but the east side has retreated 700 m.  The northwest secondary terminus has changed little, but the glacier tongue is showing signs of rifting.  The midwest tongue has retreated to within 0.5 km of the main trunk.  In 2004 the west side of the main terminus has retreated 600 m from a peninsula that had buttressed the terminus.  The entire last 3 km of the terminus tongue is in the proglacial lake with no buttressing by the shore, and is poised for breakup.

By 2015 the unbuttressed portion of the terminus had been lost with a 3.4 km retreat since 1987.  The northwest tongue has collapsed a retreat of 3.8 km, while the midwest termini has retreated 1.3 km since 1987. There are four large icebergs more than 0.2 km2 in the proglacial lake. From 2015-2018 the terminus is relatively stable and extends across the entire lake and on the west side is buttressed by a small peninsula.  In 2018 there are three large icebergs more than 0.2 km2 in the proglacial lake.  In 2019 the terminus has retreated 1 km from the 2018 position with  proglacial lake areas along the lowest 2 km on both the west and east margin.  This suggests this section of the terminus is similar to the main terminus in 1987 and 1999 that was poised for further calving retreat.  The 2019 image is from early in the melt season and the proglacial lake is filled with an extensive melange and one large iceberg. The retreat from 1987-2019 of 4.4 km, ~137 m/year, is driven by the 100 m rise in the snowline, resultant thinning, which then drives calving (Glasser et al 2016). Millan et al (2019) indicate the area of tributary glacier convergence near the northwest terminus and above the glacier is 700 m thick, and that the glacier has been retreating along an area where the glacier bed is below sea level, though the terminus now is close to sea level.  Note the Digital Globe image below with the yellow arrows indicating the end of the main lake basin and potentially end of the lake, the eastern margin of the glacier is fringed by proglacial lake up to that point.  Above this point there is another basin that may or may not connect to the current lake. The high snowline elevation in 2019 that is an indicator of increased melt area has led to an expansion of debris cover as well, note orange arrows for 1987 and 2019.

Steffen Glacier in 1999 and 2004 Landsat images. The red dots indicate terminus position, orange arrow where the terminus was buttressed on the eastern shore in 1999, green arrow where the glacier is buttressed on the western shore, the pink arrow indicates the northwest secondary terminus and yellow arrow the midwest secondary terminus.

Steffen Glacier in 2015 and 2018 Landsat images.  Red arrow is 1987 terminus location, green arrow 2015 terminus location, yellow arrow 2019 terminus location, orange arrow an area of expanding debris cover and the yellow dots the margin of the northwest and midwest secondary terminus.

Digital Globe image of lower reach of Steffen Glacier. Yellow arrows indicate an area where the bed rises as indicated by the increased crevassing and steeper surface slope. Note the extent of detachment of the glacier along the eastern margin up to that point.

Shie Glacier, Bhutan-China Retreat Reduces Lake Contact

Shie Glacier Bhutan-China in Landsat images from 1996 and 2019.  Red arrow is the southern terminus location in 1996, yellow arrow the 2019 terminus location and red dots the margin of the eastern terminus in contact with the lake in 1996.

Shie Glacier terminates in a lake on the northern flank of the Bhutan Himalaya draining north from Kangphu Kang, in a region that is claimed by both China and Bhutan.  Here we examine 1996-2019 Landsat imagery to identify glacier change. Bajracharya et al (2014) reported a 23% loss in glacier area from 1980-2010.  This retreat led to a 20% increase in the number of glacier lakes in the region  (Che et al, 2014)

In 1996 the glacier had two prominent termini ending the lake. The eastern terminus had a 1300 m wide front in the lake and the southern terminus a 400 m wide front.  The southern are terminated 800 m up a narrow inlet.  In 2000 there was a minor retreat of less than 100 m of both terminus locations since 1996.   in 2011 both glaciers had an active calving front in the lake, with the eastern terminus, between Point A and B, reduced to 800 m of front in contact with the lake. The southern terminus between Point C and D has retreated 350-400 m since 1996.

By 2018 the southern terminus had retreated 600 m further up the inlet. In 2018 the eastern glacier front reached the lake on a front less than 100 m wide. In 2019 the eastern terminus does not reach the lake on a measurable front.  The eastern terminus has retreated 400 m on the northern margin, 350 m in the glacier center and 800 m on the southern margin. The southern terminus has retreated 700-800 m since 1996.  The reduced connection of the glacier to this lake will alter the nutrient flux to the lake.  The lake has had a consistent water level during the entire period and the terminal moraine that helps impound the lake is deeply incised.  The combination along with reduced frontal suggests the GLOF threat is low

High snowlines in recent years will continue to drive retreat here and on adjacent Theri Kang and Lugge Glacier.

2011 Digital Globe image of Shie Glacier terminus, eastern terminus between Point A and B, southern terminus between Point C and D.

Shie Glacier Bhutan-China in Landsat images from 2000 and 2018.  Red arrow is the southern terminus location in 1996, yellow arrow the 2019 terminus location and red dots the margin of the eastern terminus in contact with the lake in 1996.

Ongoing Evolution of Fleming Glacier, Antarctica

Fleming Glacier in 2000 and 2019 Landsat images. The 2000 glacier front is marked by red arrows on the north and south margin and red dots along the front. The 2019 glacier front is marked by yellow arrows and yellow dots.

During the 1980’s the glaciologic community was focused on increasing our baseline information and monitoring of Antarctic ice shelves. An understanding that  ice shelves had  a critical role along with a recognition that their specific role was not well understood, resulted in planning for and then having the instrumentation in place to observe the loss of several ice shelves in the next couple of decades. The following is the story of the continuing changes of Fleming Glacier that formerly fed the Wordie Ice Shelf.

Doake and Vaughan (1991) of the British Antarctic Survey reported on the disintegration of the Wordie Ice Shelf resulting from surface crevasses or rifts extending to the bottom of the ice shelf.  The ice shelf disintegrated from an area of 1900 km2  in 1970 and to an area of 100 km2 in 2009. They observed that rift formation that led to retreat of the ice front were enhanced by  a warming trend recorded in mean annual air temperatures in Marguerite Bay.  A few years later Vaughan and Doake (1996) analyzed a 50-year meteorological record that identified significant atmospheric warming on the Antarctic Peninsula and compared that to time-series observations of areal extent of nine ice shelves on the Peninsula.  At that time the five northerly ice shelves had retreated dramatically in the past fifty years, and further south there was no clear trend.

Fleming Glacier on the Antarctic Peninsula which had fed the Wordie Ice Shelf  was observed to be thinning rapidly from 2004-2008 leading to a velocity increase (Wendt et al, 2010). This led to the production of numerous tabular icebergs from the glacier front as seen in Landsat images from 2000-2019.  Freidl et al (2018)   updated this research identifying that acceleration coincided with strong upwelling events of warm circumpolar deep water into Wordie Bay.  They observed a grounding line retreat of ∼ 6–9 km between 1996 and 2011, resulting in flotation of an additional ∼ 56 km2 of the glacier tongue.  This has been driven by thinning of ~3 m/year from 2011-2014.  A greater area of flotation will reduce buttressing and friction, which likely led to the observed speedup of ∼ 1.3 m/day between 2008 and 2011 along the glacier centerline (Freidl et al 2018) .

In 1989, image below, the Wordie Ice Shelf is still tenuously connecting several different outlet glaciers.  The tabular icebergs are elongated perpendicular to ice front. In 2000 the calving front was near the mouth of an embayment.  There is a wide zone of rifted floating ice, with the actual ice front to the south hard to define based on which rift represents full separation. There are two main feeding arms, one between Point A and B, the main Fleming Glacier and the other north of Point A, the Seller Glacier and Airy Glacier.  By 2008 the glacier had lost most of the rifted area of the floating tongue seen in 2000.  In the 2017 Landsat image the northern arm has retreated towards a series of ice rumples indicating the glacier bed is resting on bedrock rises beneath the glacier. The main Fleming Glacier lacks evident rumples suggesting a deeper bed less interrupted by bedrock rises. There remains a series of tabular icebergs beyond the ice front and a single rift inland of the glacier front.  In 2019 there are two rifts near the ice front in February indicating two substantial tabular icebergs will soon be released.  The Fleming Glacier ice front has retreated 9.5 km from 2000 to 2019, o.5 km/year. The retreat of the calving front of Airy and Seller Glacier, north of Point A, is less.  The area extent loss at the front of the three glaciers from 2000-2019 has been ~125 km2.

Freidl et al (2018)  observe that the tongue of Fleming Glacier in 2016 was grounded  between ∼ −400 and −500 m below sea level and that  3–4 km upglacier of the grounding line the bed deepens to over 1000 m below sea level 10 km upglacier of the 2016 grounding line. This would suggest the breakup of Fleming Glacier is poised to increase.  The speedup of glaciers that had fed and been buttressed by the Wordie Ice Shelf continue to experience acceleration two decades after the major part of the ice shelf disintegrated.  This is similar to the pattern seen at Larsen A and Larsen B (Scambos et al 2004). The glaciologic community has more tools and more scientists than 35 years ago to focus on ice shelves.  Our increased understanding also allows a look back at events in the past where thanks to the foresight sufficient data/imagery was gathered, for example the recent work of  Robel and Banwell (2019) .  The ongoing dynamic changes illustrate the glaciologic community was focused on the right place beginning sustained examination of these ice shelves more than 30 years ago.

Fleming Glacier and Wordie Ice Shelf in 1989 Landsat image.  Pink dots mark the approximate ice shelf front in 1989, certainly there are disintegrating tongues.  Red arrows indicate 2000 glacier front location.  Point A and B are same location as in other images. 

Fleming Glacier in a Dec. 2017 Landsat image viewed using the Antarctic REMA . Black dots indicate the approximate calving front and black arrows rifts behind the calving front.

Fleming Glacier in a Dec. 2017 Landsat image viewed using the  Antarctic REMA . Black dots indicate the approximate calving front and black arrows rifts behind the calving front.


Falcon Glacier, British Columbia Wings Clipped by Climate Change

Falcon Glacier in 1985 and 2019 Landsat images indicating the 2000 m retreat.  Red arrow is 1985 terminus location, yellow arrow the 2019 terminus location. I=icefall locations joining the glacier.

Falcon Glacier in southwest British Columbia drains east from the Compton Neve into the Bishop River, which then joins the Southgate River. The Southgate River is one of three major watersheds emptying into the head of Bute Inlet. The Southgate River is known for the large runs of Chum Salmon. The area was the focus of a proposed Bute Inlet hydropower, that at present is no longer being pursued.  The region has experienced large negative mass balances 2000-2018 (Menounos et al 2018), that is driven retreat of many glaciers in the immediate area such as Bishop Glacier and Klippi Glacier.  Here we examined Landsat images from 1985 to 2019 to determine the response to climate change of Falcon Glacier.

In 1985 Falcon Glacier terminated at 980 m and was over 10 km long (red arrow).  There were two icefalls (I) feeding the glacier along with the two principal tributaries.  By 2002 the glacier had retreated 800 m, with narrow ponding in front of the terminus.  The two icefalls were still active and the medial moraine extending to the terminus had increased prominence. By 2015 the glacier had retreated another 800 m and the two icefalls are barely connected to the main glacier.  The snowline is higher in 2015 at 1850 m.  By 2019 Falcon Glacier had retreated 2000 m, losing 20% of its length since 1985.  The eastern icefall no longer rejoins the main glacier.  The western icefall is barely connected.  The snowline in early August 2019 is already at 1850 m indicating a limited accumulation area again. The high snowlines and continued expansion of bedrock areas even at 2000 m indicates the glacier will continue its rapid retreat.

Falcon Glacier in 2002 and 2015 Landsat images indicating the 2000 m retreat.  Red arrow is 1985 terminus location, yellow arrow the 2019 terminus location. I=icefall locations joining the glacier.

Map of Falcon Glacier indicating flow direction and icefalls (I). 

Nordenskjold Glacier, South Georgia Retreat Accelerates

Nordenskjold Glacier in 1993 and 2019 Landsat images.  Red arrow is the 1989 terminus location, yellow arrows the 2019 terminus location. Purple arrow is a tributary that has separated. Point #1 and #3 is expanding bedrock ribs.  Point #2 is an impounded glacial lake.

Nordenskjold Glacier is a tidewater glacier flowing into Cumberland East Bay on the east coast of South Georgia, Island.  Cook et al (2010) and Gordon et al (2008) noted a pattern island wide with many calving glaciers having the fastest retreat.  Gordon et al., (2008) observed that larger tidewater glaciers remained in relatively advanced positions from the 1950’s until the 1980’s, followed by significant recession,  this retreat was delayed on Nordenskjold Glacier until 2000. The map below from the British Antarctic Survey indicates the slow retreat from 1957-1998 and a more rapid retreat since. Here we use Landsat imagery from 1989-2019 to identify changes.

In 1989 the glacier terminated at approximately the same location as in 1957. Vegetation extended quite close to the terminus with a minimal trimline or recently deglacated zone evident. At Point #1 and #3 are bedrock ridges that generate medial moraines. At Point #2 is a glacial lake impounded by a secondary terminus. At the purple arrow is a tributary glacier joining the main glacier. By 1993 there has been a limited retreat exposing some newly deglaciated unvegetated terrain adjacent to the shoreline and glacier terminus. There was limited additional retreat up to 2000. This is unusual as the neighboring glaciers had all retreated substantially by 2000. By 2016 the glacier had retreated substantially, ~900 m. The tributary at the purple arrow no longer reaches the main glacier. At Point #2 the impounded lake has expanded slightly and is open water. The snowline is also at 500 m above Point #1 and #3.  In 2019 the snowline is again above 500 m. The area of bedrock at Point #1 and #3 has expanded significantly indicating glacier thinning, and greater ablation at this elevation. The terminus has retreated an average of 1250 m from 1989-2019. There is a significant trimline and recently deglacited terrain on the western shore of the bay.

The retreat is much less than on Neumayer, Twitcher or Hindle Glacier. The upglacier thinning suggests this process will continue, with a 3.2 km wide calving front in water of unknown depth calving will continue to be a key driver of retreat.

Nordenskjold Glacier in 1989 and 2016 Landsat images.  Red arrow is the 1989 terminus location, yellow arrows the 2019 terminus location. Purple arrow is a tributary that has separated. Point #1 and #3 is expanding bedrock ribs.  Point #2 is an impounded glacial lake.

Map of terminus change from the British Antarctic Survey map platform

Taku Glacier, Alaska Retreat Begins: A Two Century Long Advance Reversed by Climate Change

Taku Glacier in 2016 and 2019 Sentinel 2 images.  The Hole in the Wall Tributary  (HW) is upper right, Taku Glacier main terminus (MT). Yellow line is the 2016 terminus location.  The arrows denote locations where thinning is apparent as the area of bare recently exposed bedrock has expanded. A closeup is below.  Pink and brown areas between blue ice and yellow line in 2019 indicates retreat.

The Taku Glacier is the largest outlet glacier of the Juneau Icefield in Alaska.  Taku Glacier began to advance in the mid-19th century and this continued throughout the 20th century. At first observation in the 19th century the glacier was calving in deep water in a fjord.   It advanced 5.3 km between 1890 and 1948 moving out of the fjord into the Taku River valley, see maps below (Pelto and Miller, 1990).  At this time calving ceased resulting in positive mass balance without the calving losses.  The glacier continued to advance 2.0 km from 1948-2013 (Pelto, 2017). The advance was paralleled by its distributary terminus, Hole in the Wall Glacier.  This advance is part of the tidewater glacier cycle (Post and Motyka, 1995), updated model by Brinkerhoff et al (2017)  .  At the minimum extent after a period of retreat the calving front typically ends at a point of constriction in fjord width and or depth that limits calving.  With time sedimentation in front of the glacier reduces water depth and calving rate, allowing the glacier to begin to advance. In the case of the Taku Glacier after a century of advance the glacier had developed a substantial proglacial outwash and moraine complex that had filled in the fjord and the glacier was no longer calving, images below from 1961 and 1981 illustrate this.  This allowed the advance to continue through the rest of the 20th century and into the 21st century.  The slowing of the advance in the latter half of the 20th century has been attributed to the impedance of the terminus outwash plain shoal (Post and Motyka, 1995; Pelto and Miller, 1990). There is a concave feature near the terminus with an increase in crevassing where the push impacts flow dynamics as seen at black arrow in 1975 and 1998 images below. In 1980’s the Taku Glacier’s accumulation area ratio was still strong enough for Pelto and Miller (1990) to conclude that the Taku Glacier would continue to advance for the remaining decade of the 20th century, which it did.

Beginning in 1946 the Juneau Icefield Research Program began annual mass balance measurements that is the longest in North America. In conjunction with JIRP and its first director Maynard Miller we compiled and published an annual mass balance record in 1990.  From 1990 to the present in conjunction with JIRP and Chris McNeil we have continued to compile and publish this annual mass balance record (Pelto et al 2013).  This mass balance record has been updated as of April 2020 (McNeil et al 2020). Much of the remarkable data record of JIRP has this month been made accessible to the public, particularly through the efforts of Seth Campbell, JIRP director, Scott McGee, survey team director and Chris McNeil, mass balance liaison with USGS.

The ELA in 2018 and 2019 in Landsat images, purple dots indicate the record high snowlines for the 1946-2019 period that occurred both in 2018 and again 2019, Pelto (2019)  

Taku Glacier is one of the thickest known alpine temperate glacier, it has a maximum measured depth of 1480 m and its base is below sea level for 40-45 km above the terminus (Nolan et al 1995).   Moytka et al (2006) found that the glacier base was more than 50 m below sea level within 1 km of the terminus, and had deepened substantially since 1984. This suggests a very long calving retreat could occur. The glacier had a dominantly positive mass balance of +0.42 m/year from 1946-1988 and a dominantly negative balance since 1989 of  -0.34 m/year (Pelto et al 2013). . This has resulted in the cessation of the long term thickening of the glacier.  On Taku Glacier, the annual ELA (end of summer snowline altitude) has risen 85 m from the 1946-1988 period to the 1989-2019 period.  During the 70+ year annual record the ELA had never exceeded 1225 m until 2018, when it reached 1425 m ( Pelto (2019) ).  In 2019 the ELA again has reached a new maximum of 1450 m (see above images). Contrast the amount of the glacier above the snowline in 2018 and 2019 to other recent years that had more ordinary negative balances (see Landsat images below).

In 2008 and 2012 JIRP was at the terminus, creating the map below.  There was no change at the east and west side of the margin since 2008 and 55 to 115 m of advance closer to the center. The glacier did not advance significantly after 2013, and did not retreat appreciably until 2018. The Taku Glacier cannot escape the result of three decades of mass losses, with the two most negative years of the record being 2018 and 2019. The result of the run of negative mass balances is the end of a 150+ year advance and the beginning of retreat. Sentinel images from 2016 and 2019 of the two main termini Hole in the Wall Glacier right and Taku Glacier left. The yellow arrows indicate thinning and the expansion of a bare rock trimline along the margin of the glacier. The Hole in the Wall terminus has retreated more significantly with an average retreat of ~100 m.  The Taku main terminus has retreated more than 30 m along most of the front.  A terminus change record has been published as of April 2020 (McNeil et al 2020).

The retreat is driven by negative balances, mainly by increased surface melt.  The equilibrium flow of the Taku Glacier near the long term ELA for the 1950-2005 period was noted by Pelto et al (2008). This occurred during a period of glacier thickening, average profile velocity was 0.5 md-1  (Pelto et al 2008). Since 1988 the glacier has not been thickening near the snowline as mass balance has declined slightly (Pelto et al 2013). The remarkable velocity consistency measured by JIRP surveyors led by Scott McGee each year at profile 4 has continued.  It is below this profile that surface ablation has reduced the volume of ice headed to the terminus.

All other outlet glaciers of the Juneau Icefield have been retreating, and are thus consistent with the dominantly negative alpine glacier mass balance that has been observed globally (Pelto 2017).  Now Taku Glacier joins the group unable to withstand the continued warming temperatures.  Of the 250 glaciers I have personally worked on it is the last one to retreat. That makes the score climate change 250, alpine glaciers 0.

1890 United States Coast Guard Map indicating deep water in the fjord in front of Taku Glacier. 


Map of terminus change from Lawrence (1950).


Taku Glacier aerial photograph from US Navy in 1948.  Still minor calving on right (east side).


Taku Glacier in 1961 photograph indicating calving had ended. 


Taku Glacier in 1981 photograph with the well developed outwash plain (Pelto).


Map of Terminus Change from Miller and Pelto (1990)


Maynard Miller image of Taku Glacier and Norris Glacier in 1975, not concave flexure point at black arrow.


Photograph of Taku Glacier and Norris Glacier in 1998, not concave flexure point at black arrow (Pelto)


JIRP terminus survey map of 2008 and 2012 surveys. 


Equilibrium line altitude (ELA) from 1946-2019.


ELA in 2013, 2014, 2015 and 2017 in Landsat images.


This is a view across the glacier accumulation area that until 2018 had always been snowcovered at the end of summer (Pelto).


Ofhidro Glacier, Chile Retreat 1986-2019

Ofhidro Glacier glacier terminus change an accumulation zone changes from 1986-2019 in Landsat images.  Red arrow=1986 terminus, yellow arrow=2019 terminus change, orange arrows expanding bedrock areas and purple dots snowline. 

Ofhidro Glacier is an outlet glacier on the northwest corner of the Southern Patagonia Icefield (SPI), that has a northern and southern arm terminating in a proglacial lake. Sakakibara and Sugiyama (2014)a examine the terminus change and velocity of SPI glaciers the northern arm retreating 50 m per year from 1985-2011 and the southern arm 100 m/year 1985-2011.  They also noted a decline in velocity Here we examine Landsat imagery from 1986-2019 to identify the change.

In 1986 the southern arm extended across the proglacial lake to the shallows of the western shore. The northern arm had been retreating in a narrower valley with a comparatively consistent width.   In 1998 the southern arm in the broader lake reach had collapsed, a retreat of 1800 m.  The northern arm had a retreat of 200 m.  The snowline was at m.  In 2015 the southern arm has retreated into a narrower valley, and the northern arm has retreated to a turn to the south in the valley.  The orange arrows indicate the expansion of bedrock as the glacier thins.  By 2019 the southern arm has retreated 2800 m (88 m/year) and the northern arm has retreated 1800 m (56 m/year).   Jaber et al (2019)  noted a thinning of 0.5 m/year from 2000-2012 increasing to 1.2 m/year from 2012-2016.  Most of the thinning being in the valley tongues of each arm. There is an area of continuous exposed bedrock more than 3 km long.  This fits the observations of  Willis et al (2012) who observed that between February 2000 and March 2012 that SPI was rapidly losing volume and that thinning extends even to high elevations.   The retreat of this glacier is similar to that of Lucia Glacier and Gabriel Quiroz Glacier to the east.

Ofhidro Glacier glacier terminus change an accumulation zone changes from 1998-2015 in Landsat images.  Red arrow=1986 terminus, yellow arrow=2019 terminus change, orange arrows expanding bedrock areas and purple dots snowline.

Ofhidro Glacier image from 2015. Notice the trimlines and narrowing of both terminus tongues.  Orange arrow indicates new bedrock knob.