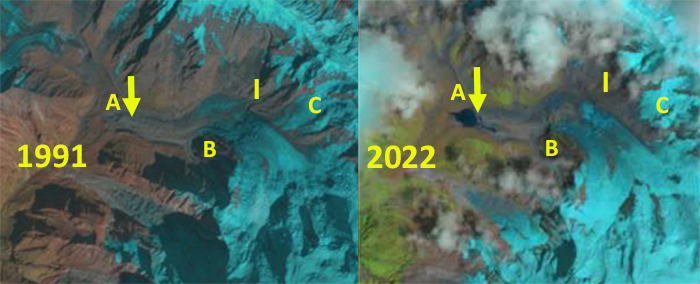
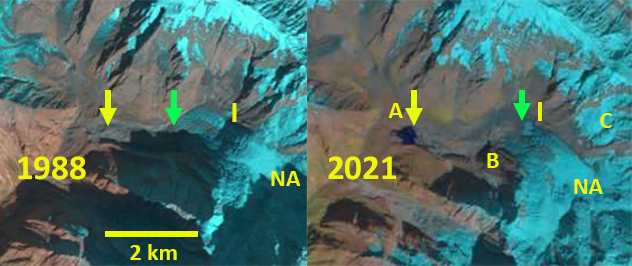
Marconi Glacier in Landsat images from 1986 and 2022. Red arrows=1986 terminus locations, yellow arrow=2022 terminus location. Tributaries labelled 1-6, bedrock divides A-D and LE=Lago Electrico. In 1986 Lago del Marconi does not exist, by 2022 it is apparent at red arrow.
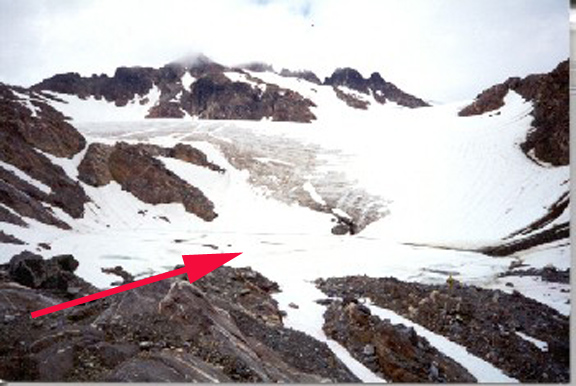
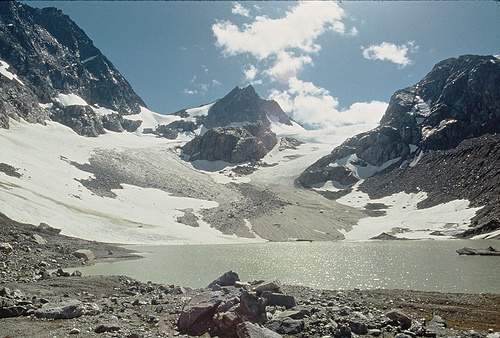
Marconi Glacier, Argentina is one of the more common routes onto the Southern Patagonia Ice Cap (SPI) via Marconi Pass. The glacier is no longer fed by the ice cap itself. The glacier drains into Electrico Lake and Rio Electrico. The good news is despite the name Rio Electrico will not be developed, since it is in Parque Nacional Los Glaciares, Argentina. A decade ago I wrote about the retreat of this glacier, noting an overall retreat from 1986 to 2012 of 800-850 m. Here we update the changes in the glacier observed in Landsat imagery from 1986 to 2022. This encompasses nearly the entire history of nearby Argenitne trekking captial El Chalten, created in 1985, with routes to Lago Electrico.
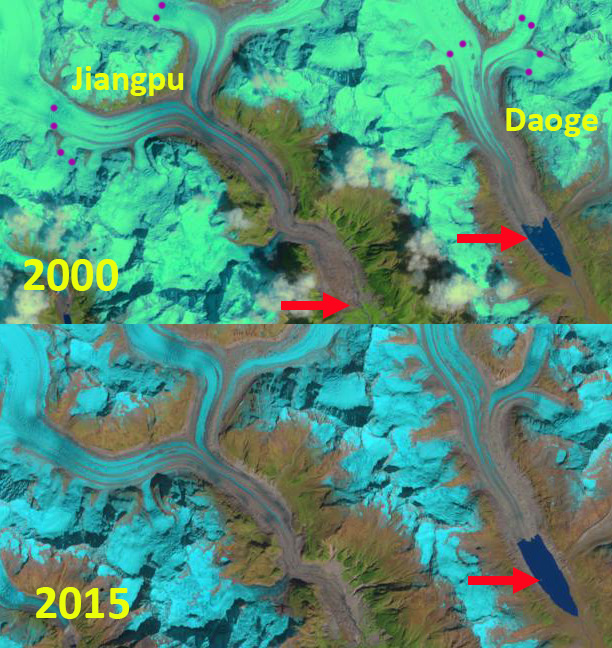
In 1986 the glacier ends in the valley bottom, without a proglacial lake km from Electrico Lake, red arrow. The glacier has one connection to the SPI with Tributary 2 at Point D. The glacier has already separated from Tributary 1. Tributary 4 and 5 are not separated at this time. In 2002 the glacier retreat has exposed a new developing proglacial lake, Lago del Marconi and a lateral moraine is developing at Point B. By 2012 the glacier has retreated from the Lago del Marconi it ended in. In 2015 there is exposed bedrock at Point B, Tributary 6 is still only separated by a lateral moraine from Tributary 5. In 2022 the glacier is no longer connected to the SPI. The bedorck areas at Point A-C have significantly expanded further separating Tributaries 3-6. Tributary 6 has fragmented no longer connecting to the main glacier. From 1986-2022 Marconi Glacier has separated from two key tributaries, this fragmentation a common result of signficiant retreat and glacier thinning. Retreat from 1986-2022 of Marconi Glacier is 1200 m, and for Tributary 1 is 1000 m.
Average thinning of this glacier from 2000-2015 was reported as 1.5 m/year by Malz et al (2018). From 2011-2017 Forestra et al (2018) found a similar rate of thinning. The rising snowlines, drive thinning and then retreat similar to other SPI glaciers such as San Lorenzo Sur Glacier , Oriental Glacier and Lucia Glacier.

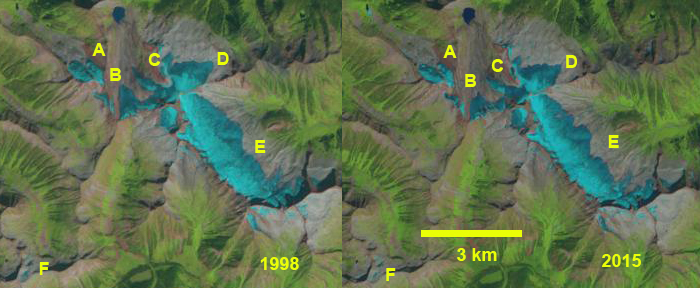
Marconi Glacier in Landsat images from 2002 and 2015. Red arrows=1986 terminus locations. Tributaries labelled 1-6, bedrock divides A-D and LE=Lago Electrico.

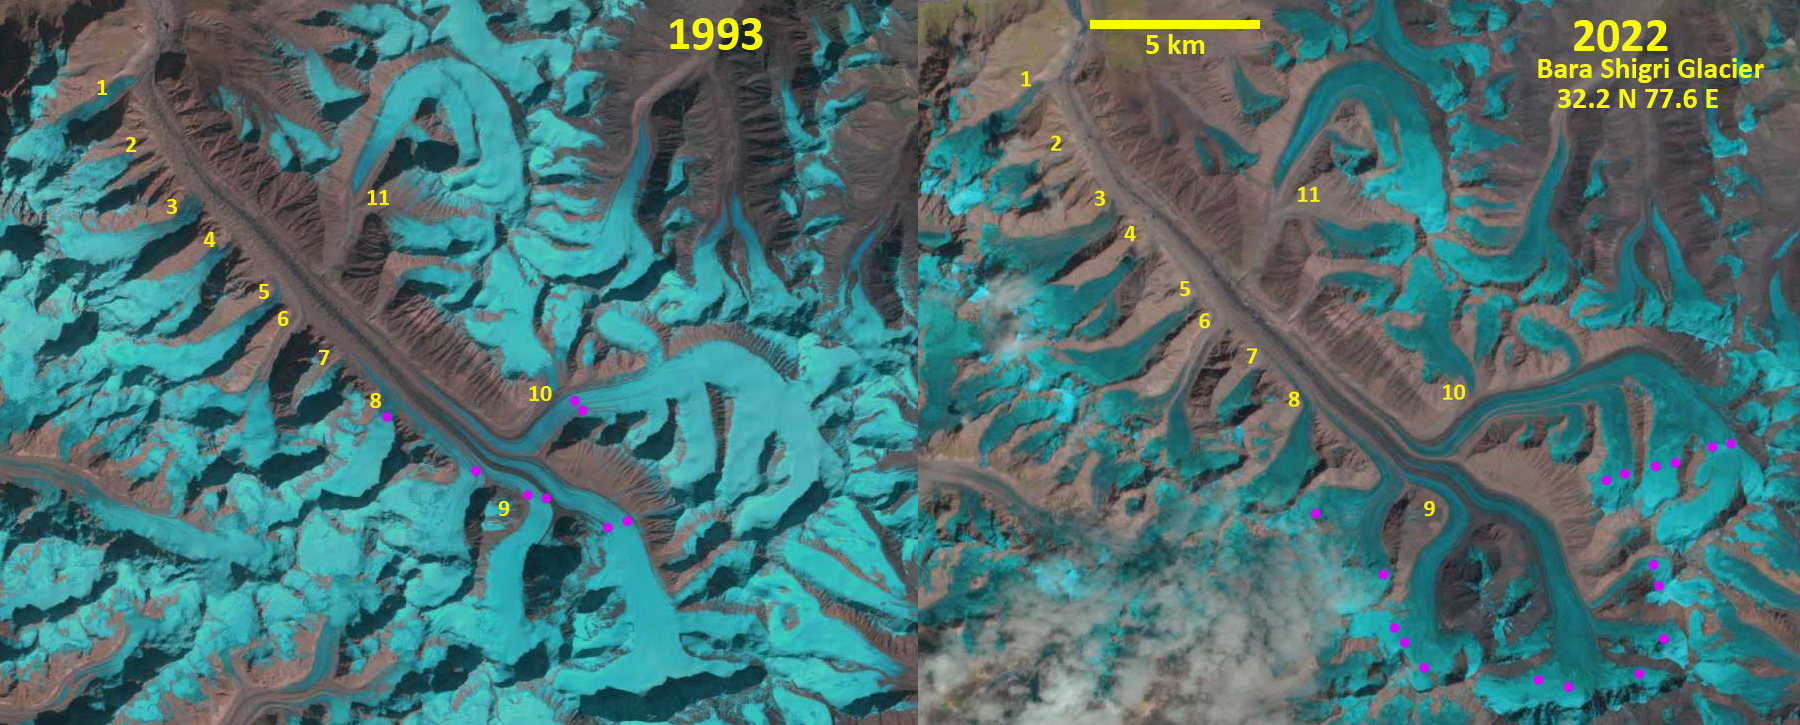
Marconi Glacier in Sentinel image from 2-24-2022. Tributaries labelled 1-6, bedrock divides A-D and LE=Lago Electrico.