North Cascade Glacier Climate Project 2026 Results

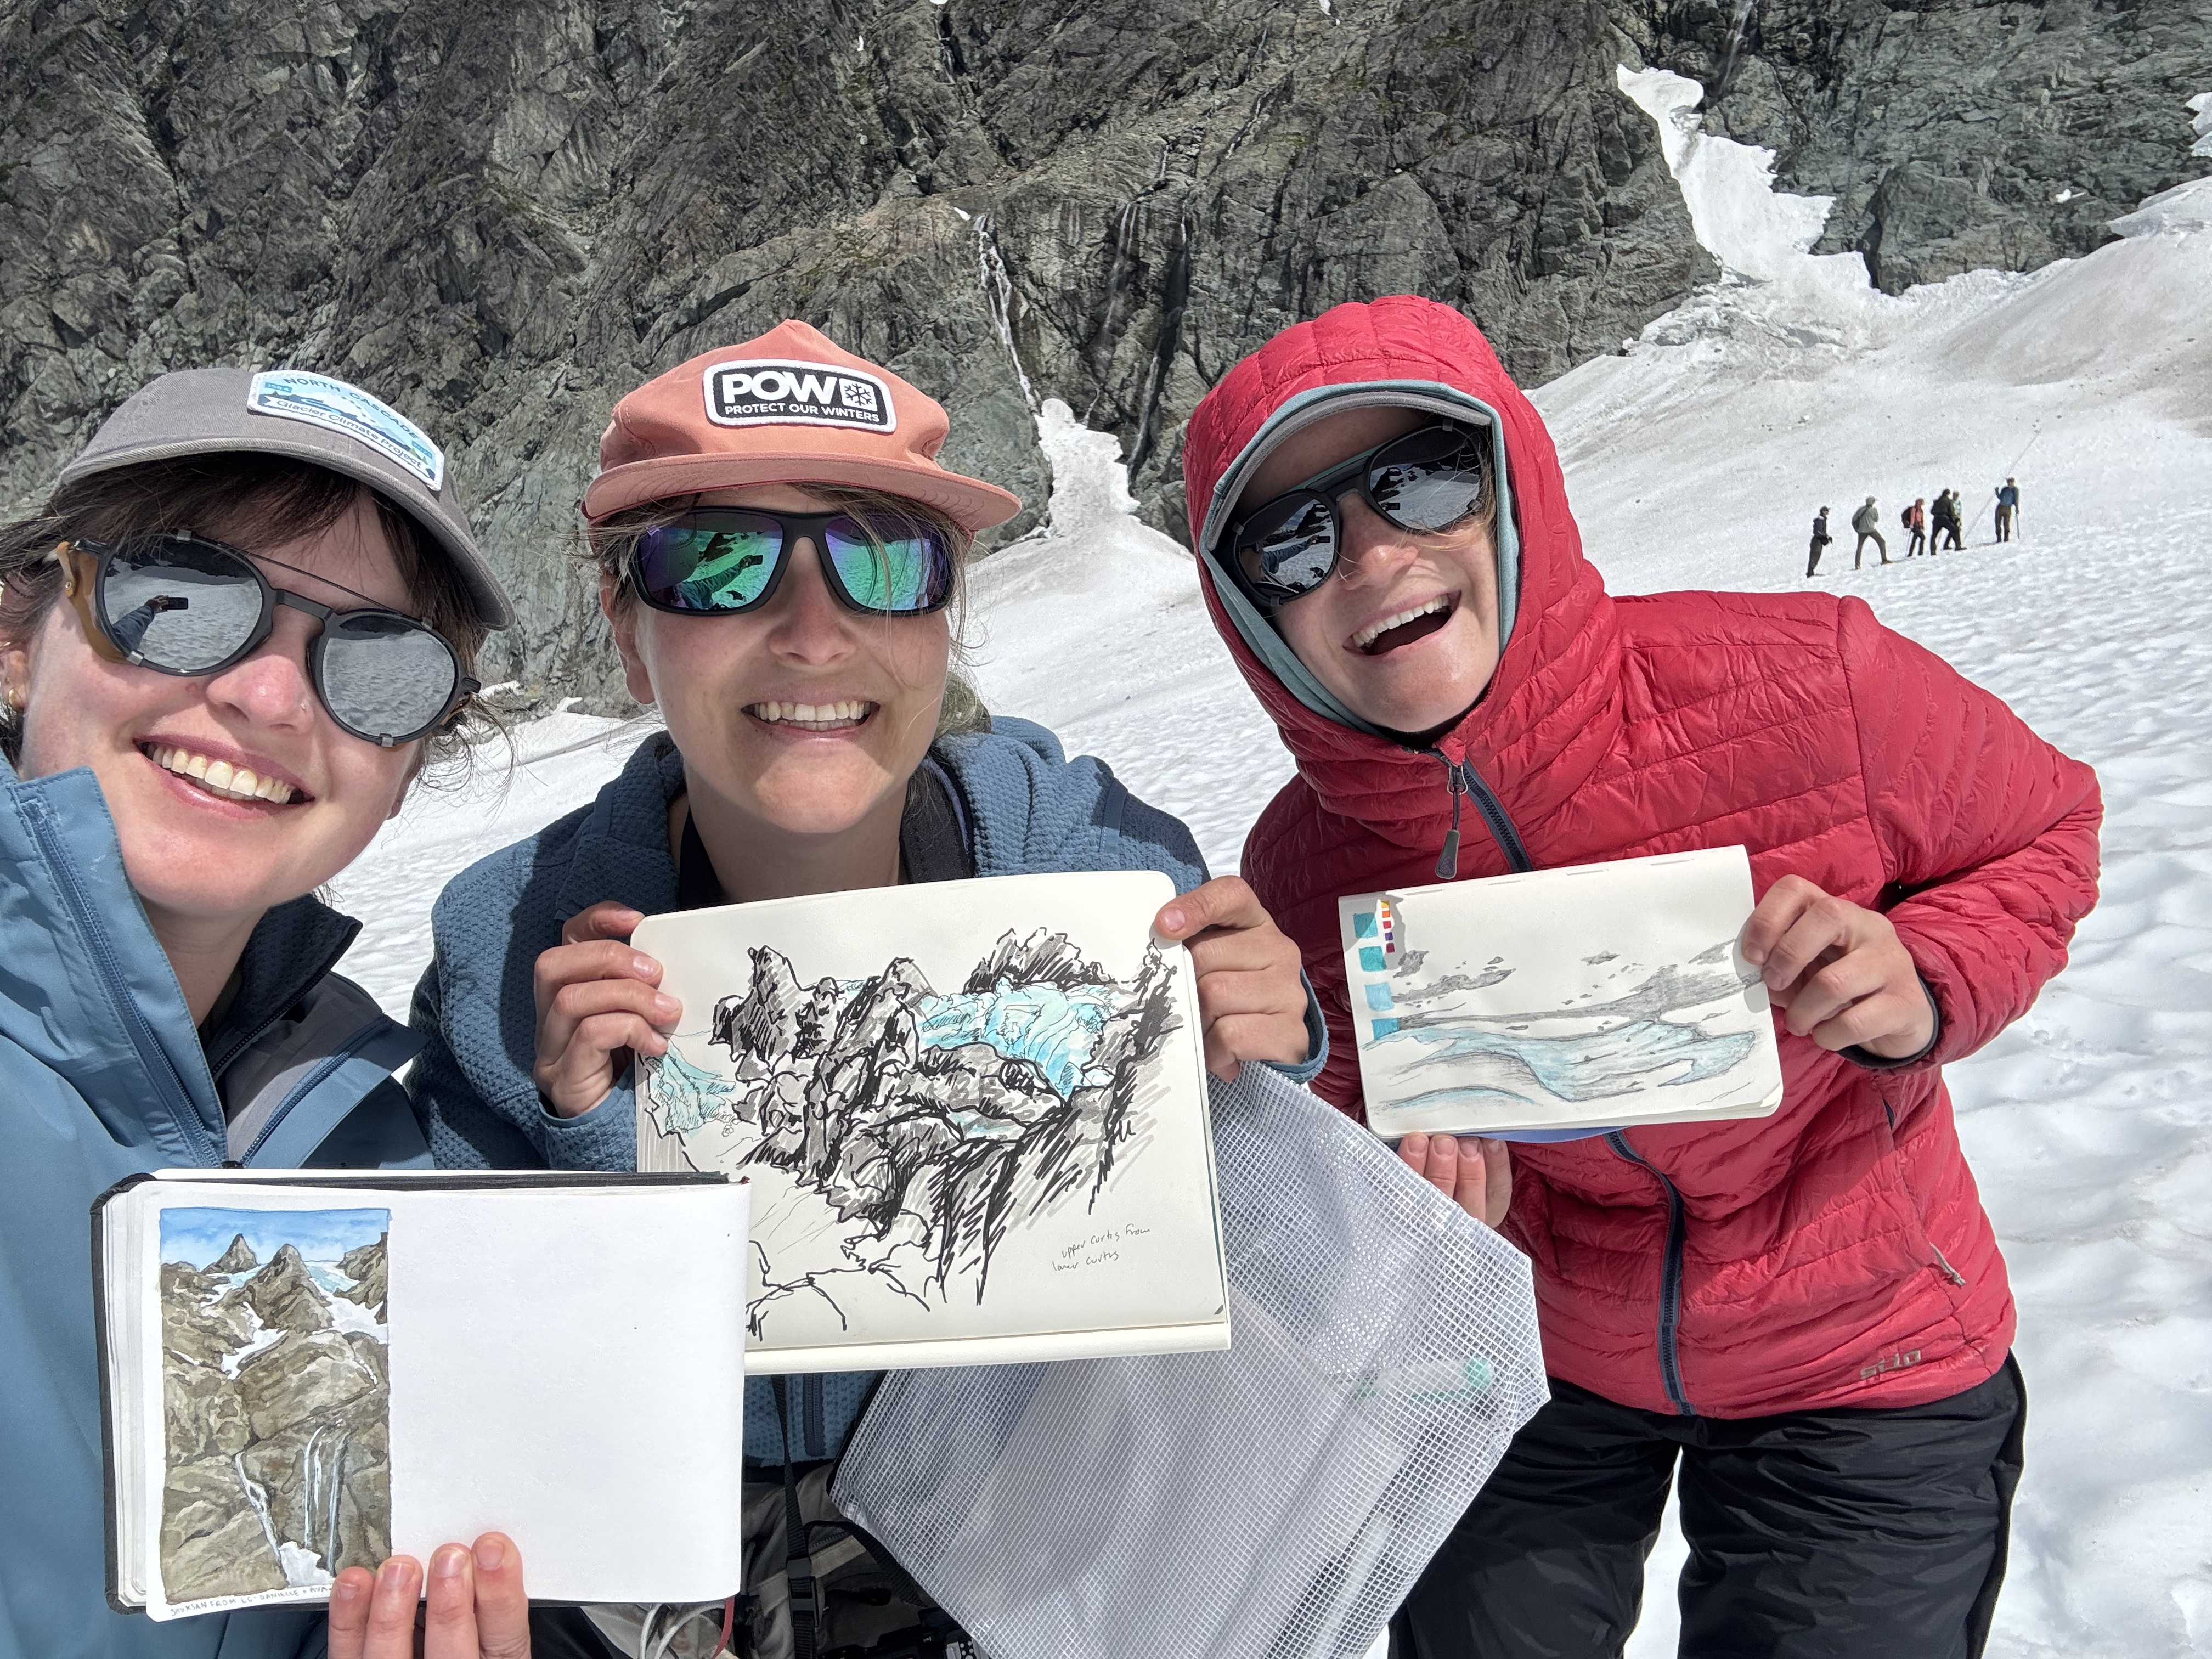
Lower Curtis Glacier Sketches.

We completed our 43rd annual observation of North Cascade glaciers in the field. Three of the glaciers we monitor are global reference glaciers for the World Glacier Monitoring Service (WGMS); Columbia Easton and Rainbow Glacier. The field team was Abby Connor, Shaina Dotson, Rikki Held, Jill Pelto, Mauri Pelto and Ava Reynolds. Ben Pelto, Hannah Conteras, Nina Adjanin and Danielle Schlunegger-Warner
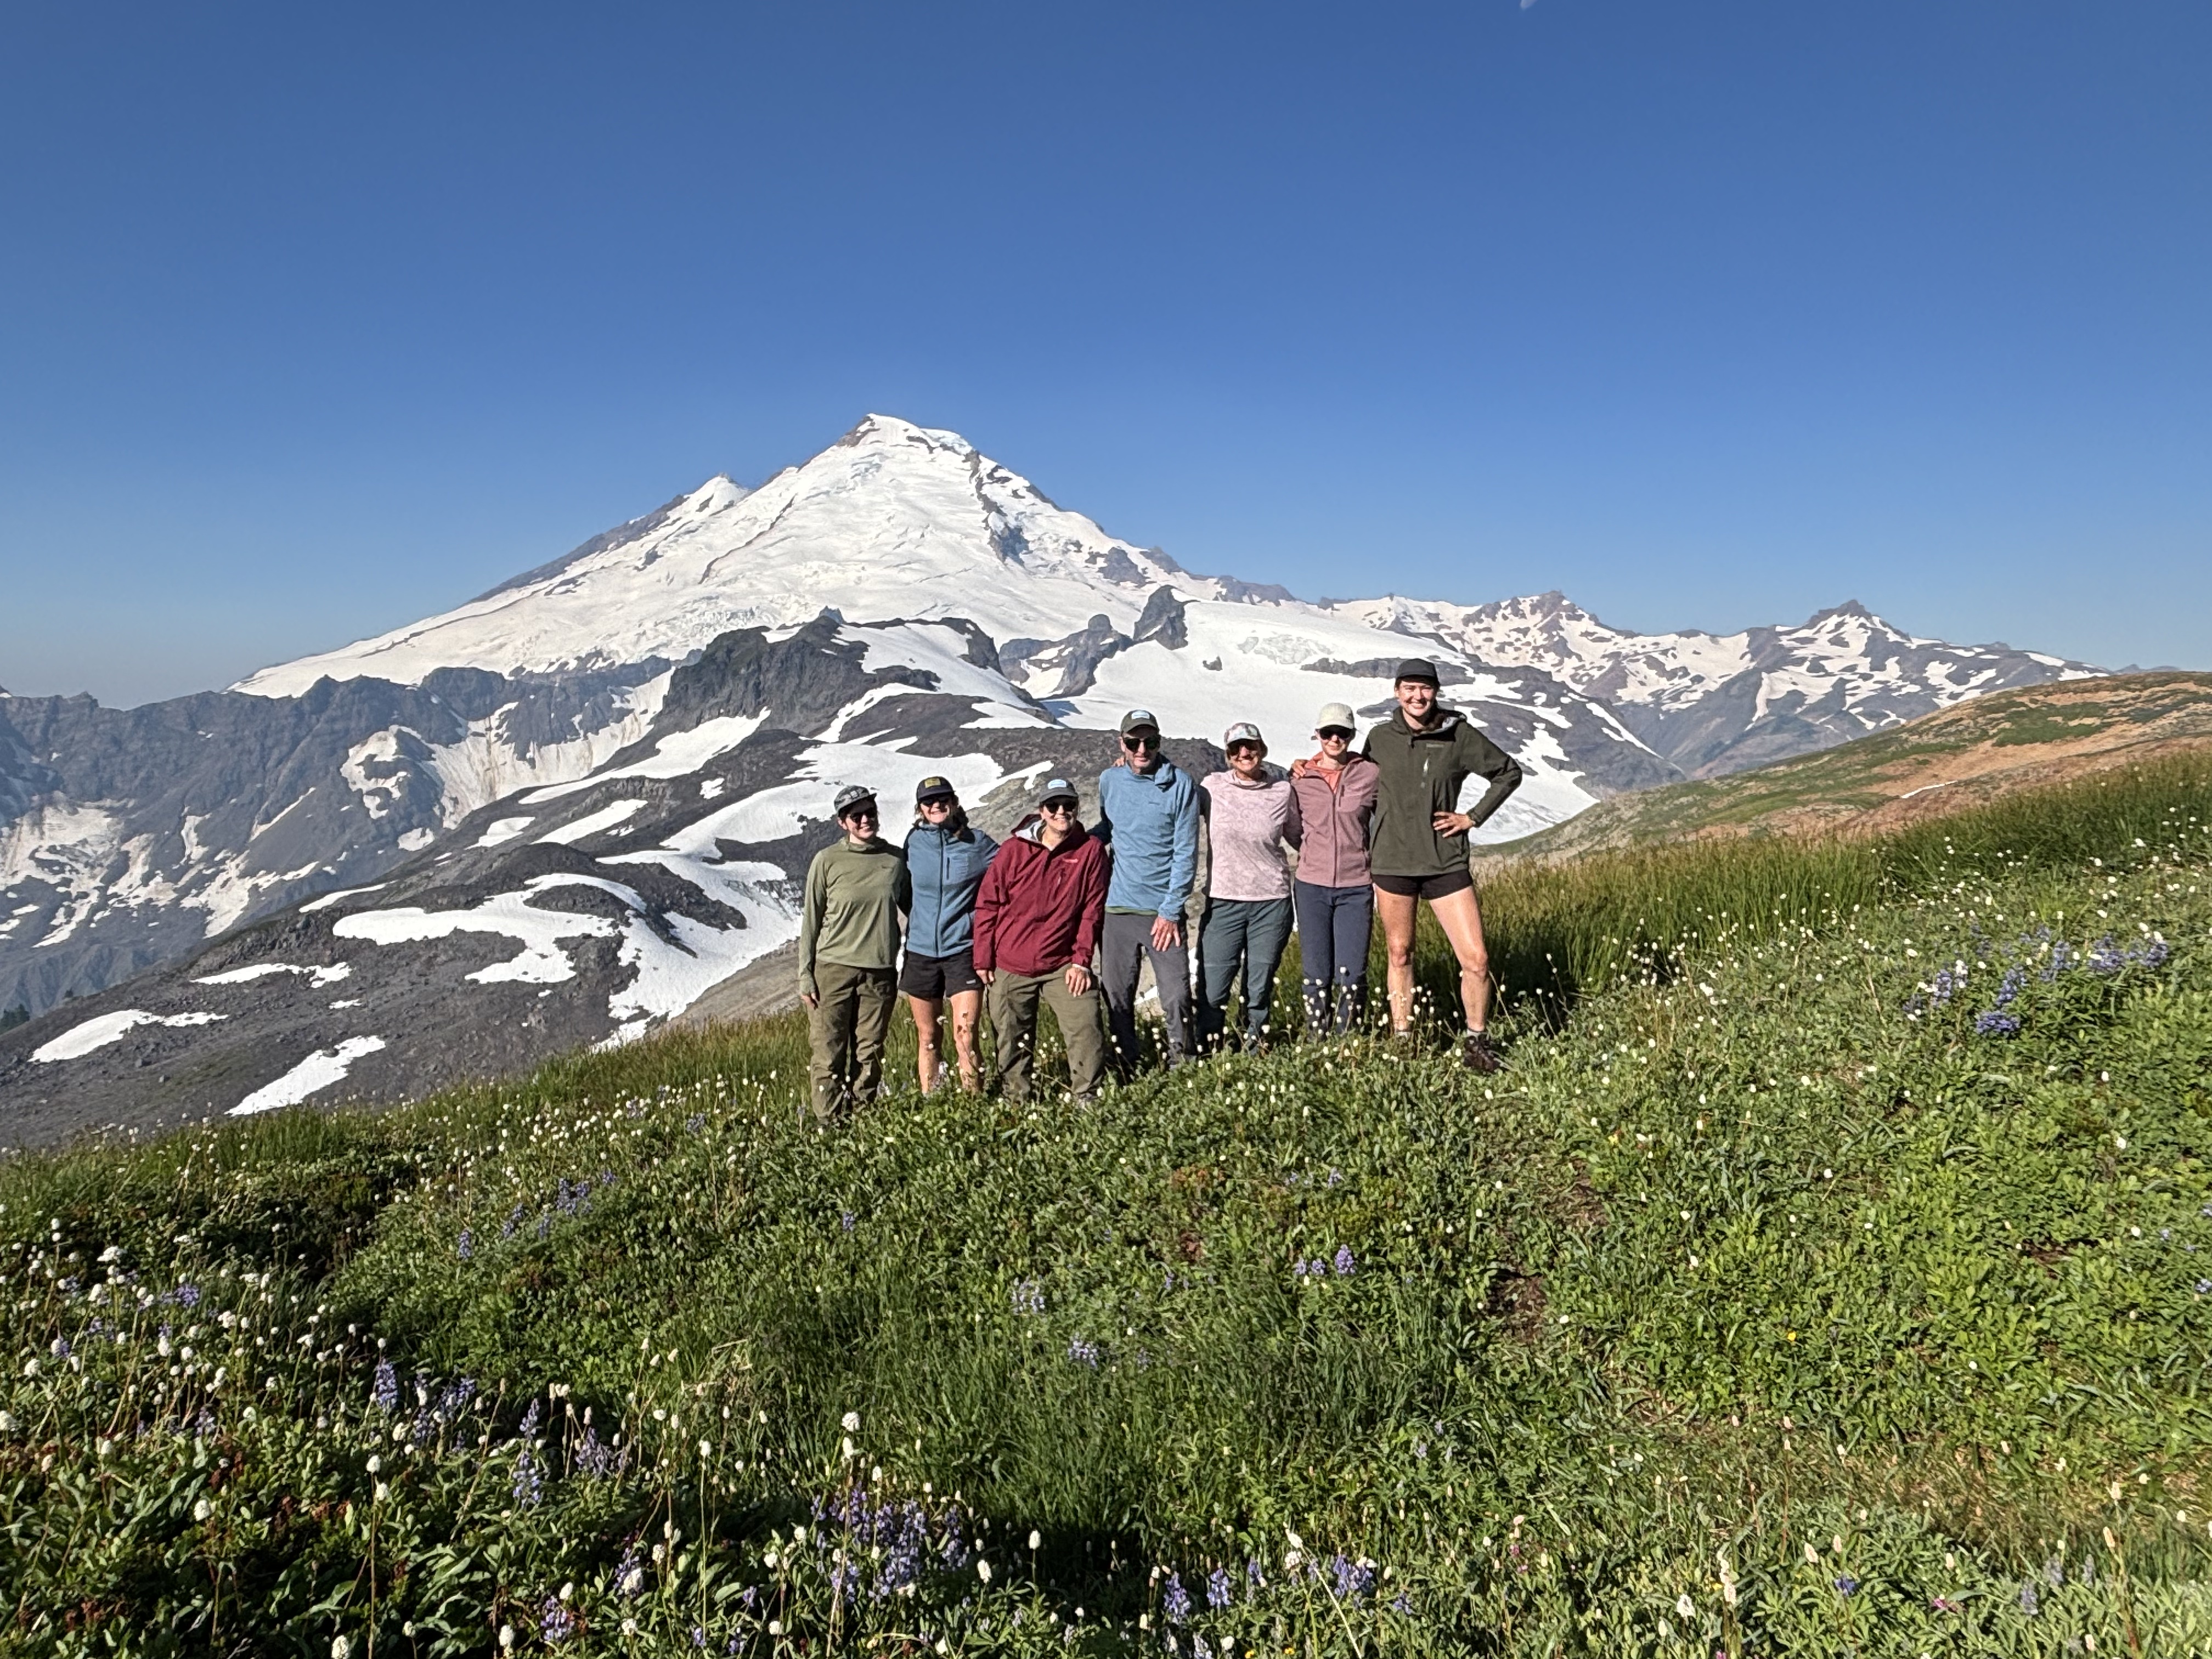
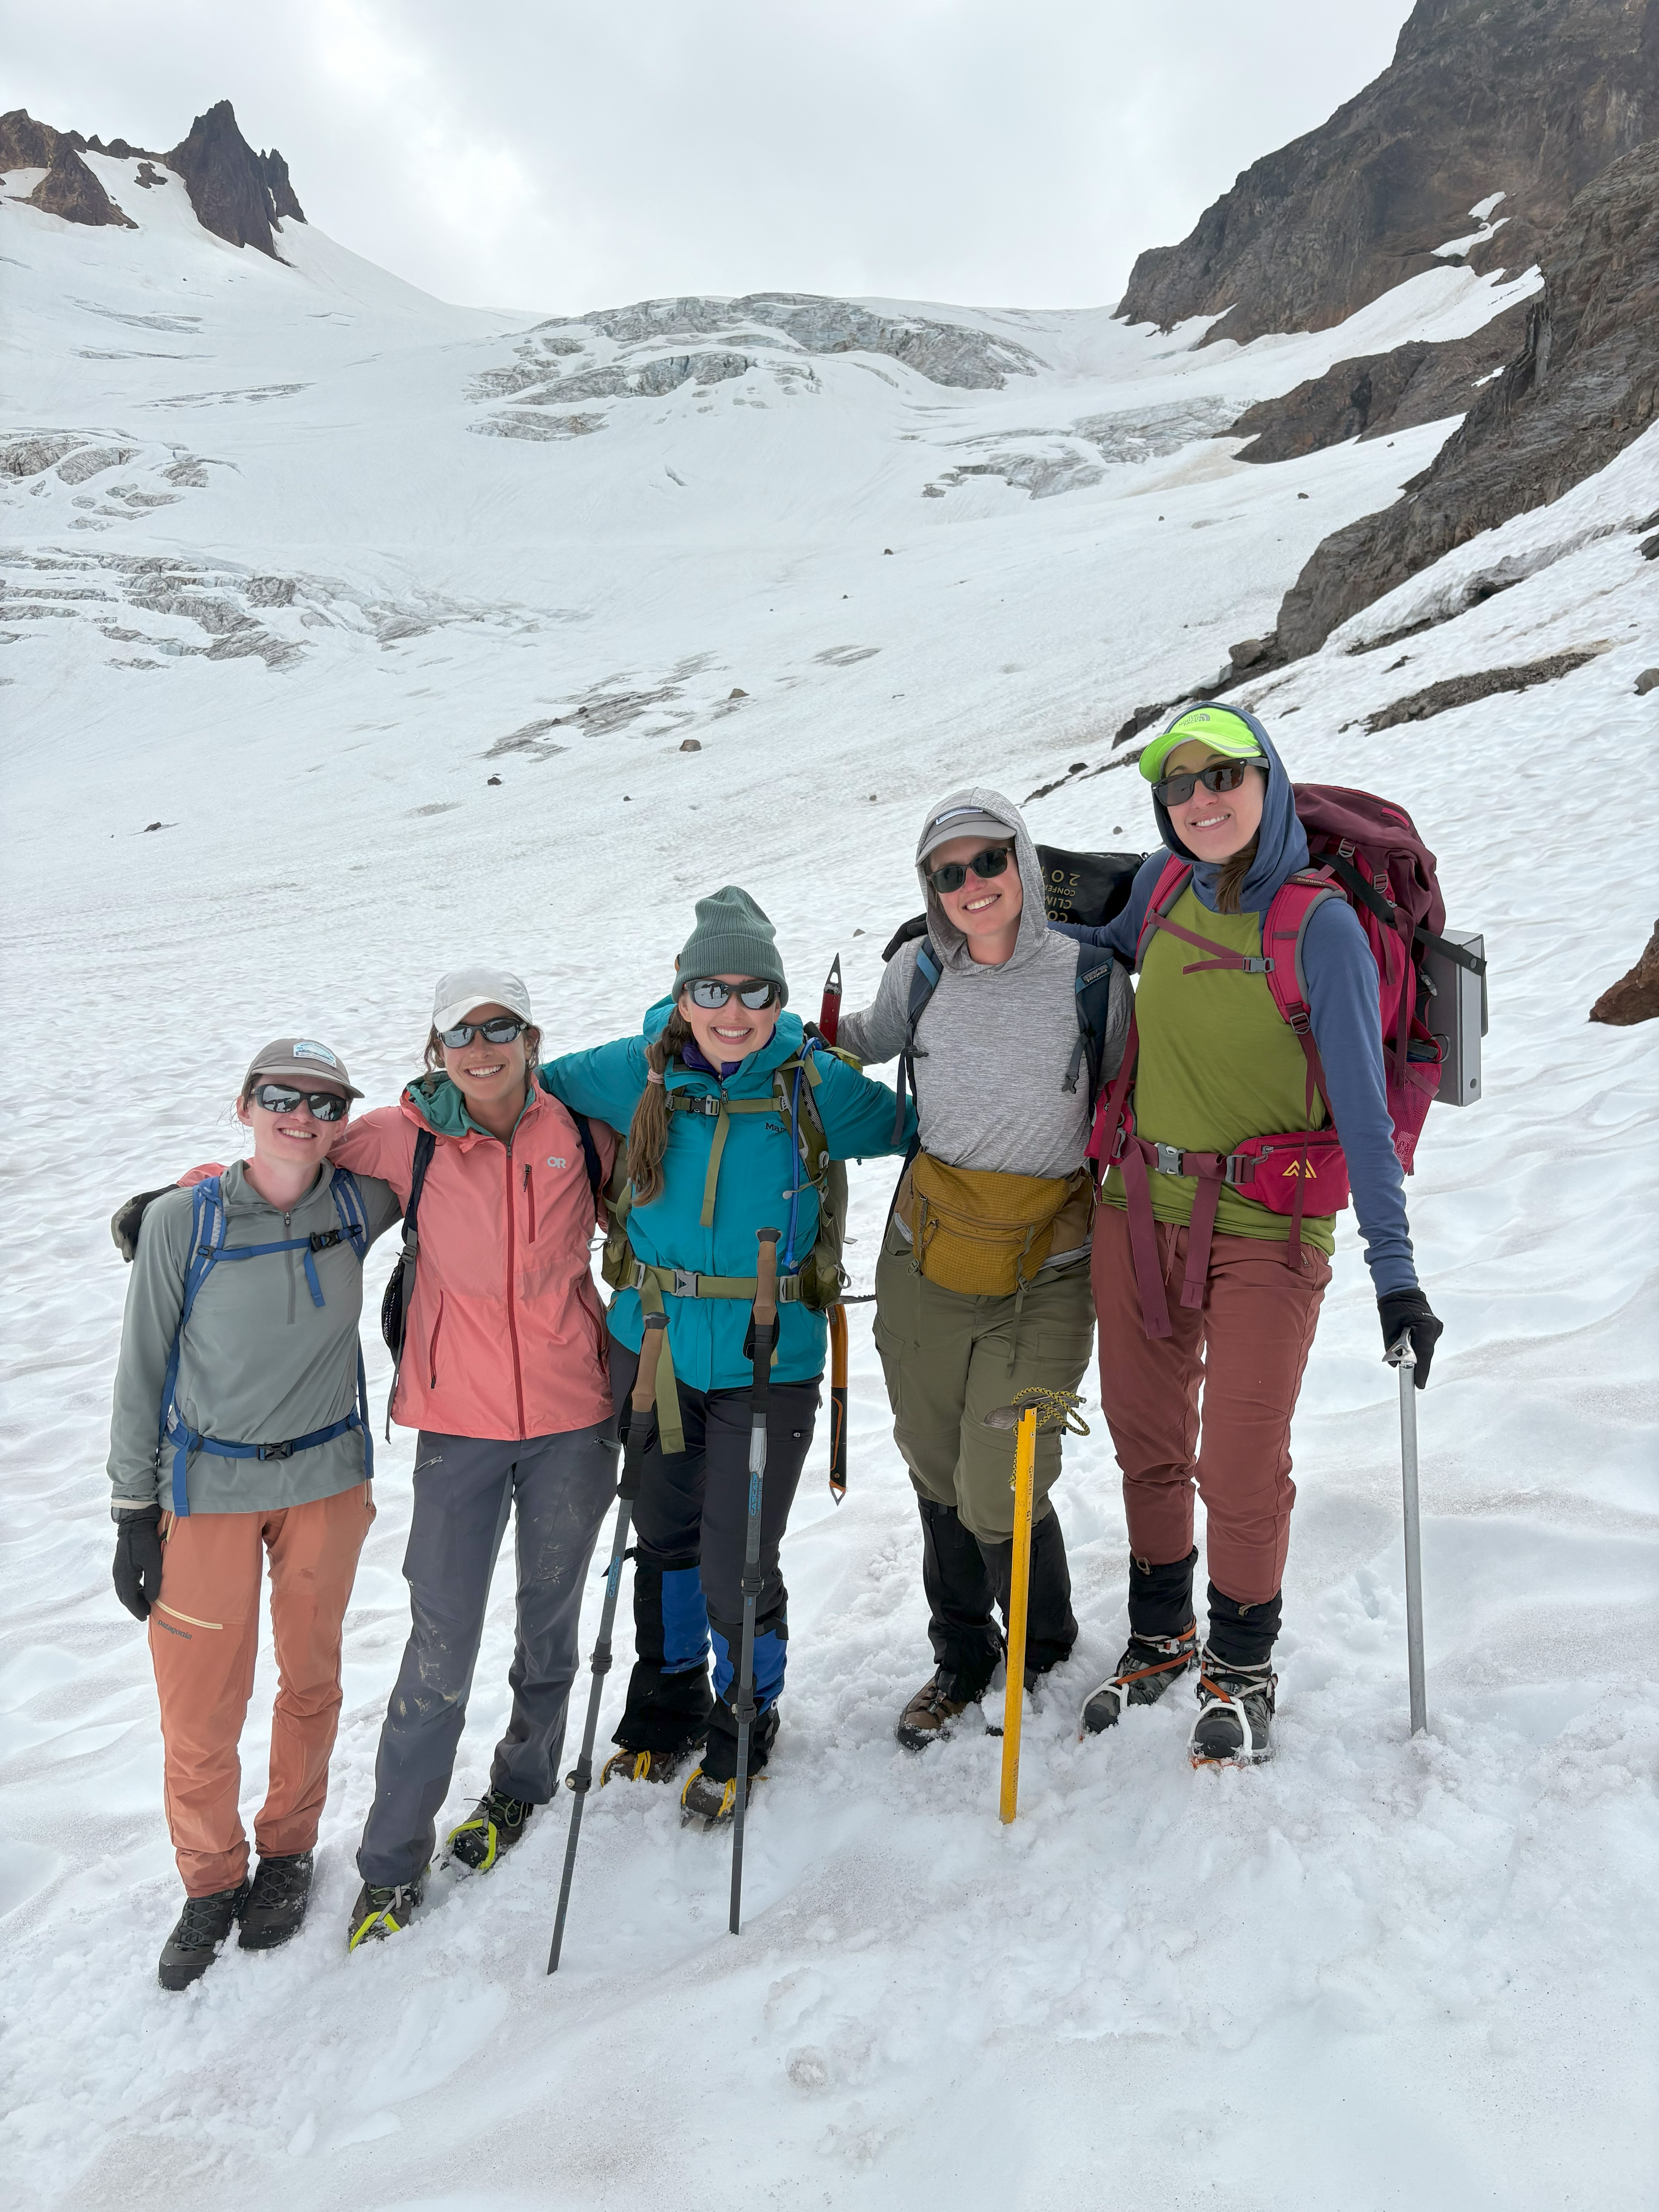
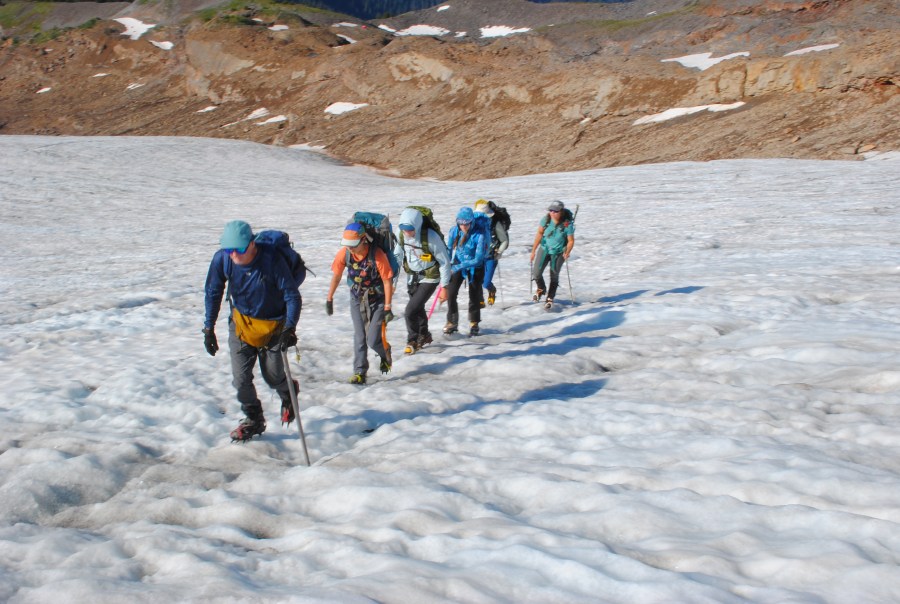
Team at Ptarmigan Camp in our Marmot gear.

The 2026 field season follows similar patterns to the 2021-2025 seasons. All of these featured either historic heat waves and/or periods of extended warm weather. Sustained high temperatures led to a greater exposure of bare ice on glaciers with a higher albedo and greater density. The observed melt rates during warm weather events on the surface of the glacier are 7-9 cm/day (water equivalent) for ice surfaces , vs. 4-6 cm/day for snow surfaces. This led to substantial mass losses on North Cascade glaciers across the five years of a combined ~8m. The contribution of new snow this winter was poor, with April 1 snowpack at the six long-term North Cascade stations at 68% of the 1984-2026 mean. April 15th represented the maximum snowpack for elevations at 1500 m and above. The snowpack was less than 50% of normal below 1800 m.

Above 2000 m, warm wet winter events did deliver snowfall that was rain below. This helped many locations at higher elevation sustain more snowpack later into the summer. Working with Snowgoat Skimo as they prepared for the annual Kulshan Randonée, we noted snowpack of over 6 m above the 2000 m level. This was due in part to a historic atmospheric river event occurred in late December, leading to record stream levels, flooding and road washouts in many Cascade locations. This led to reduced snow depths below 2000 m across the region, and potentially higher snow depths above this elevation.

Each month from May to August, temperatures were above normal across the Cascades and precipitation below normal (WSCO, 2026). By the end of May, snowpack was 20% of normal across the region. The temperature anomaly was highest in June and July leading to rapid snow melt off, particularly in non-glacier areas. By early August glacier snow lines were rising rapidly to typical end of summer levels. Alternatively, September was cooler and wetter than average, limiting glacier ablation at the end of the melt season.
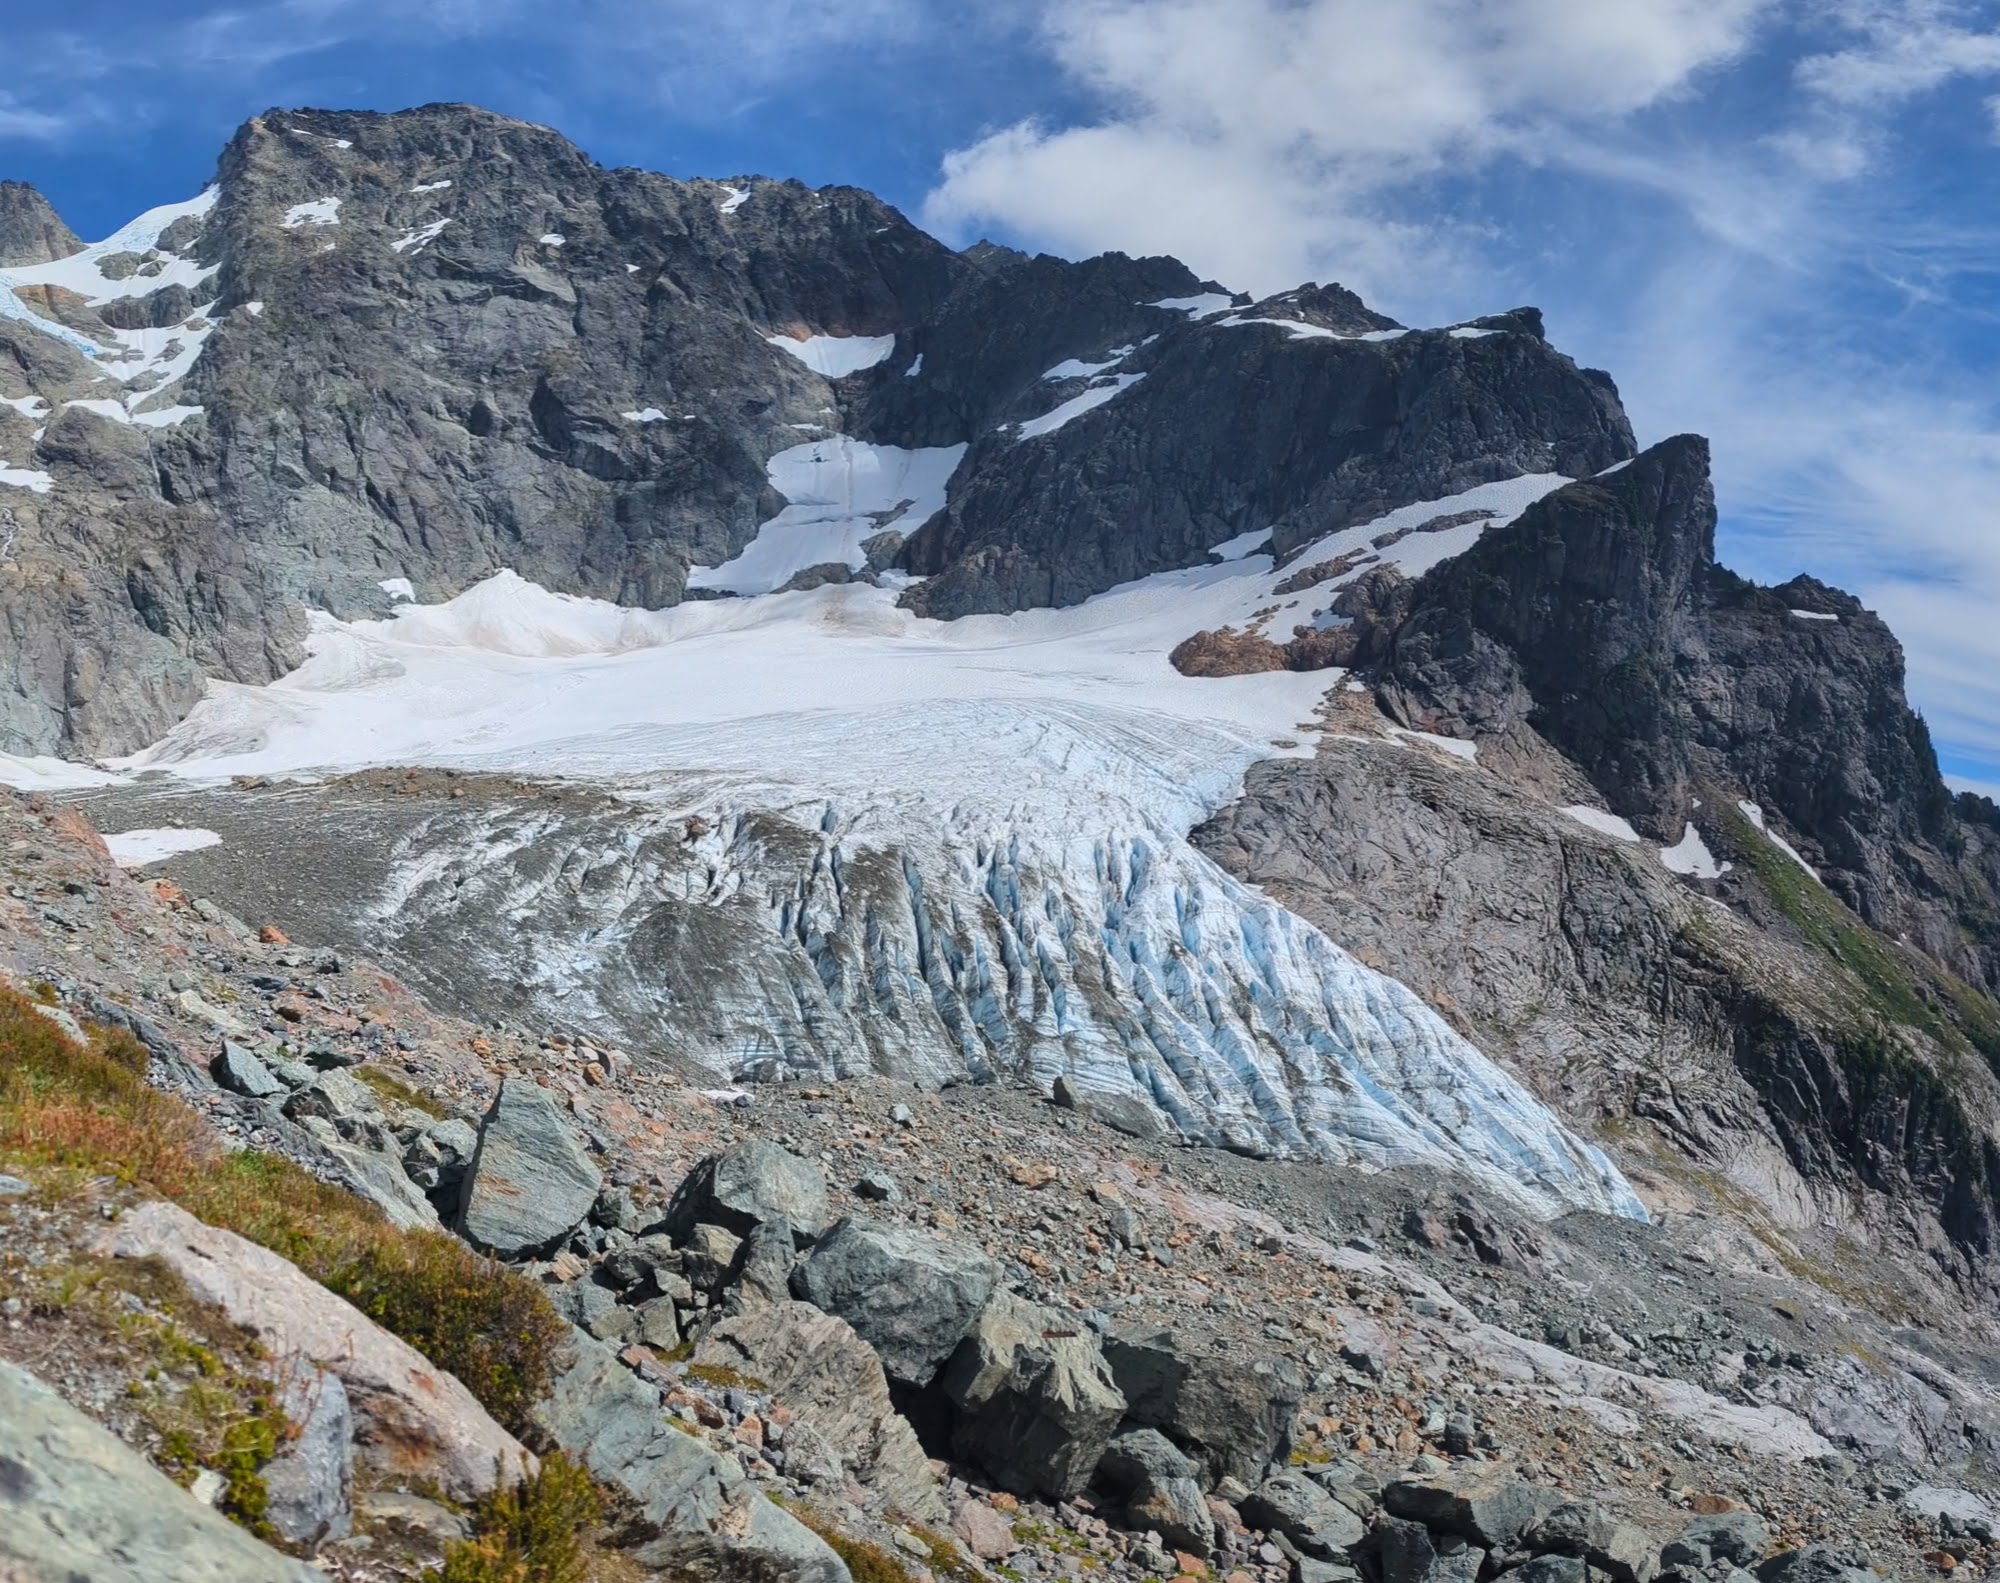
Lower Curtis Glacier on July 30th, 2026 with snowcover limited to the northeast side of the glacier below the couloir.

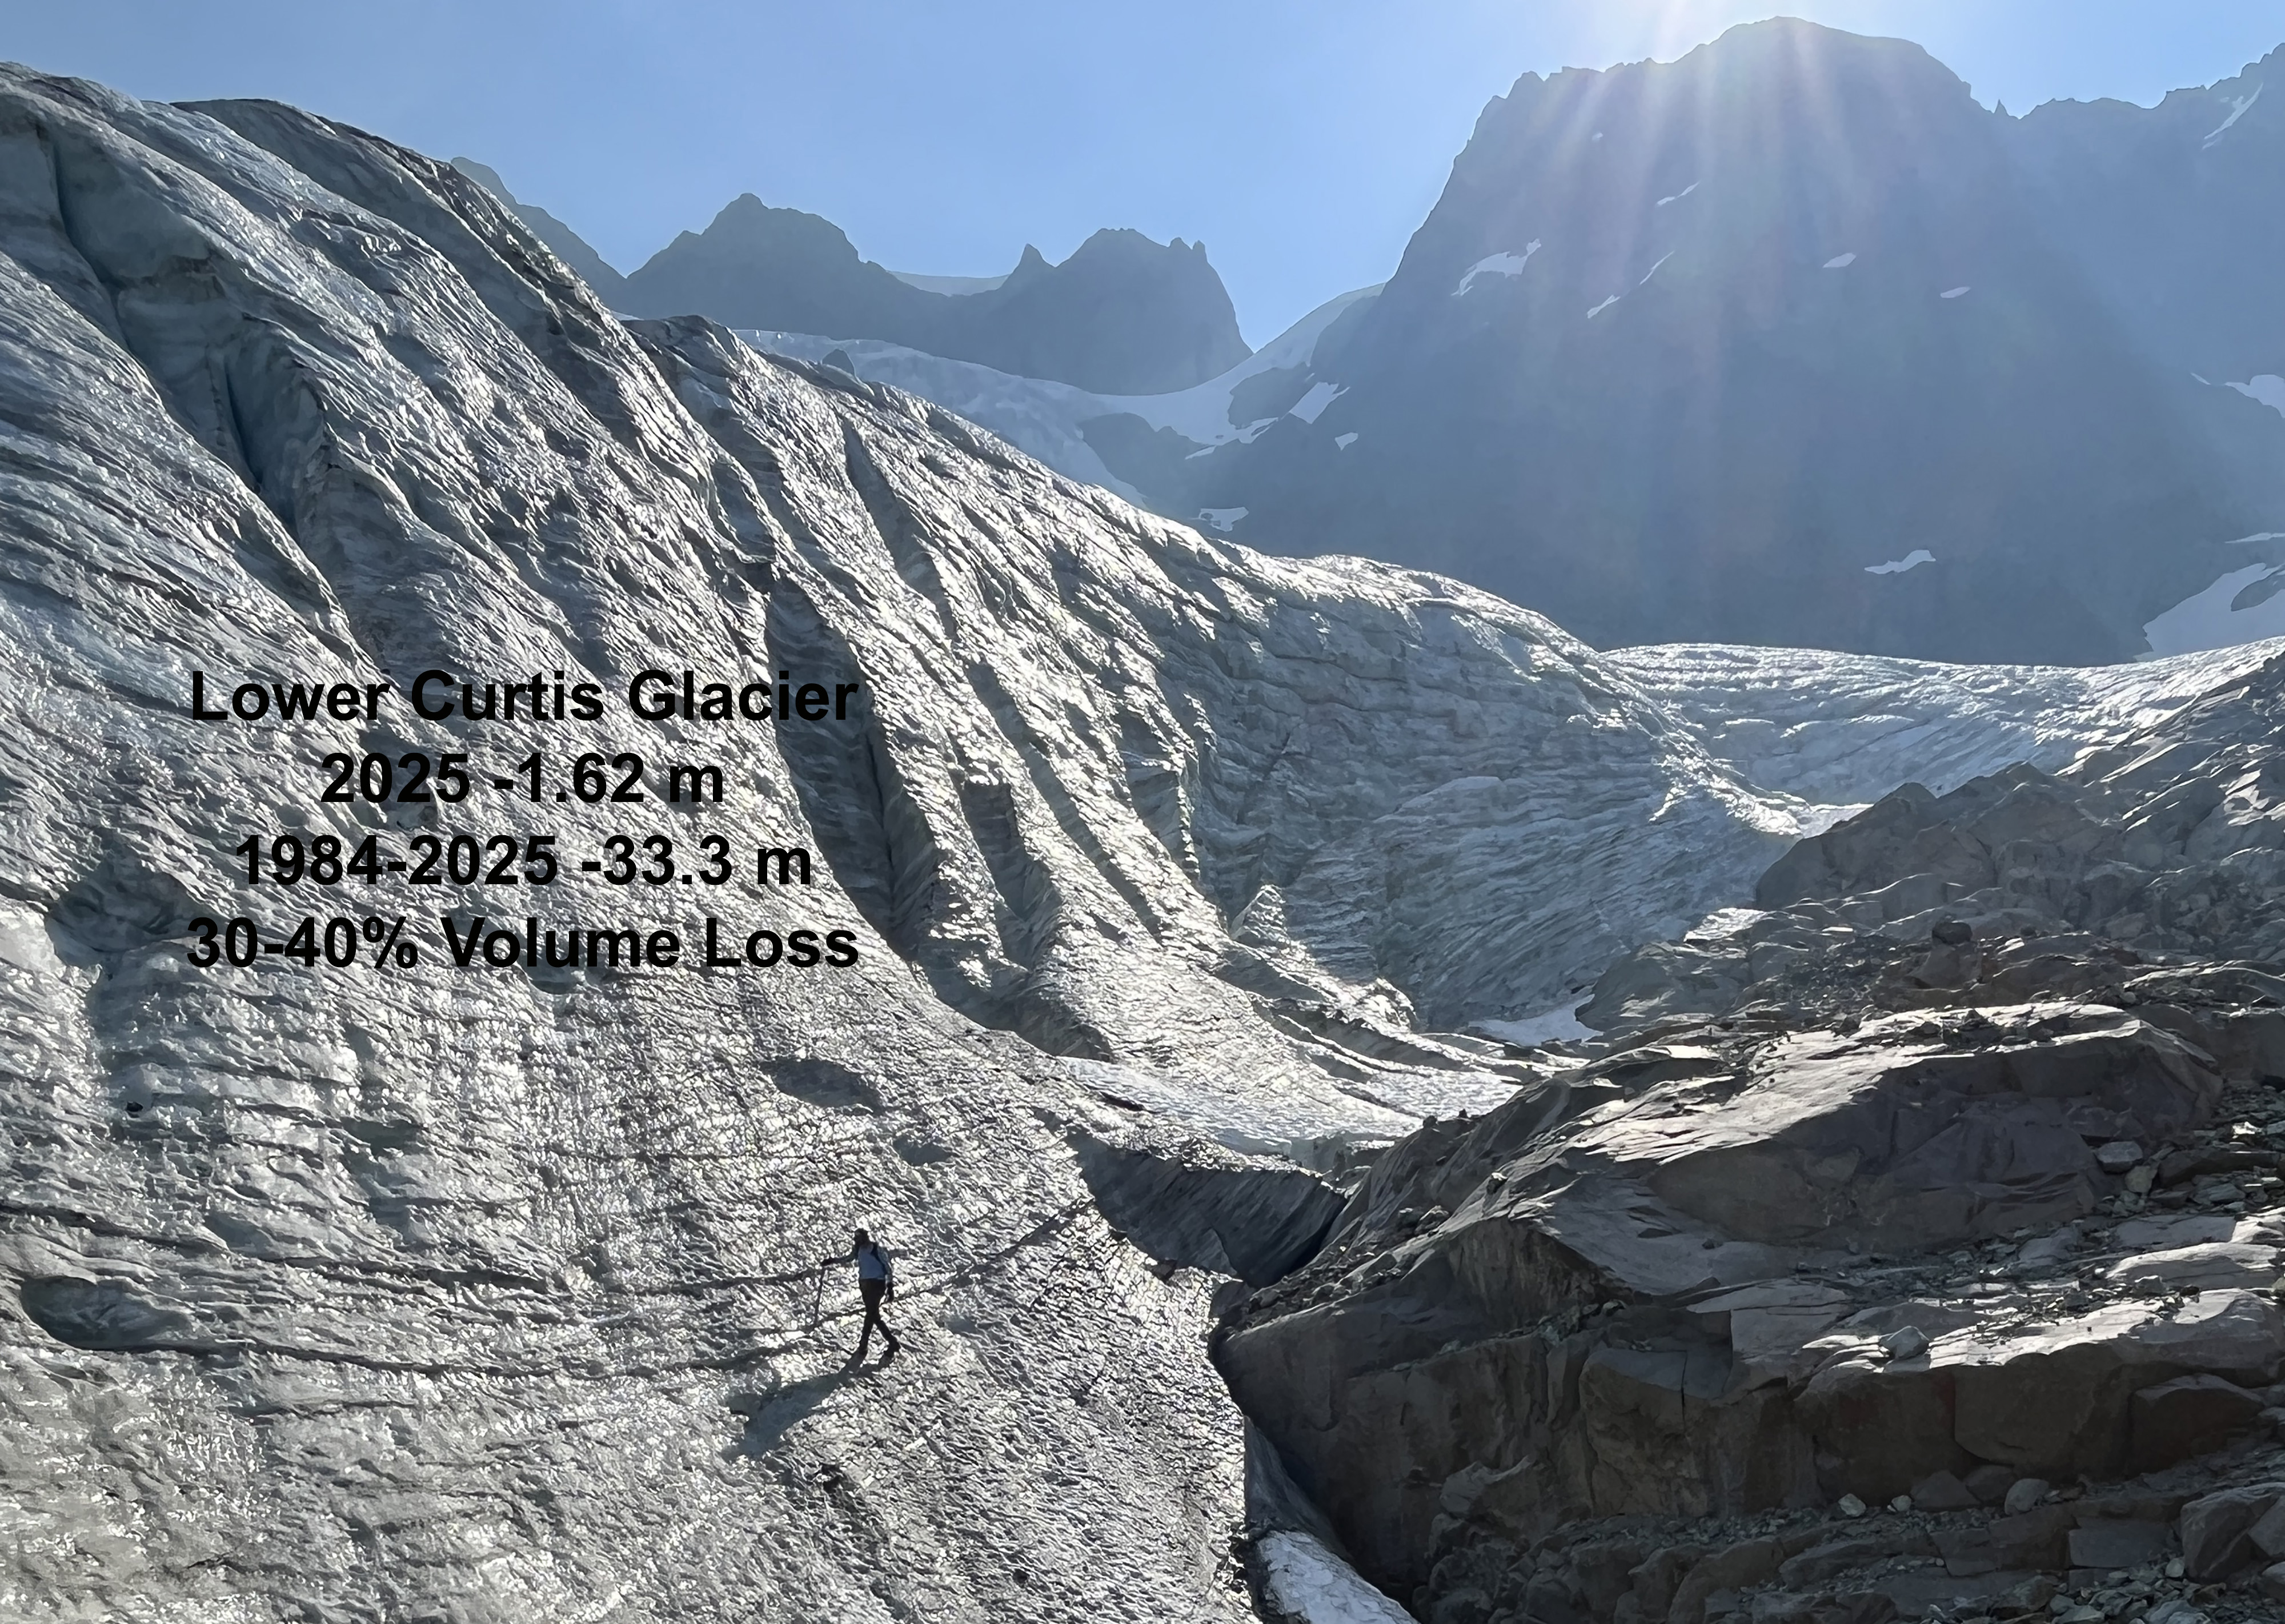
Lower Curtis Glacier on Mount Shuksan is a cirque glacier at 1700-2000 m and is fed by avalanching mainly in the 1900-2200 m elevation range. Snowpack across most of the glacier was lost by the end of July, including all avalanche fans except for the northeast couloir fan, where snow depths averaged over 3 m. The terminus front has thinned by 20 m in the last five years, while retreat continues at 5-10 m per year. The annual mass balance was -2.12 m, with an accumulation area ratio of 24%.
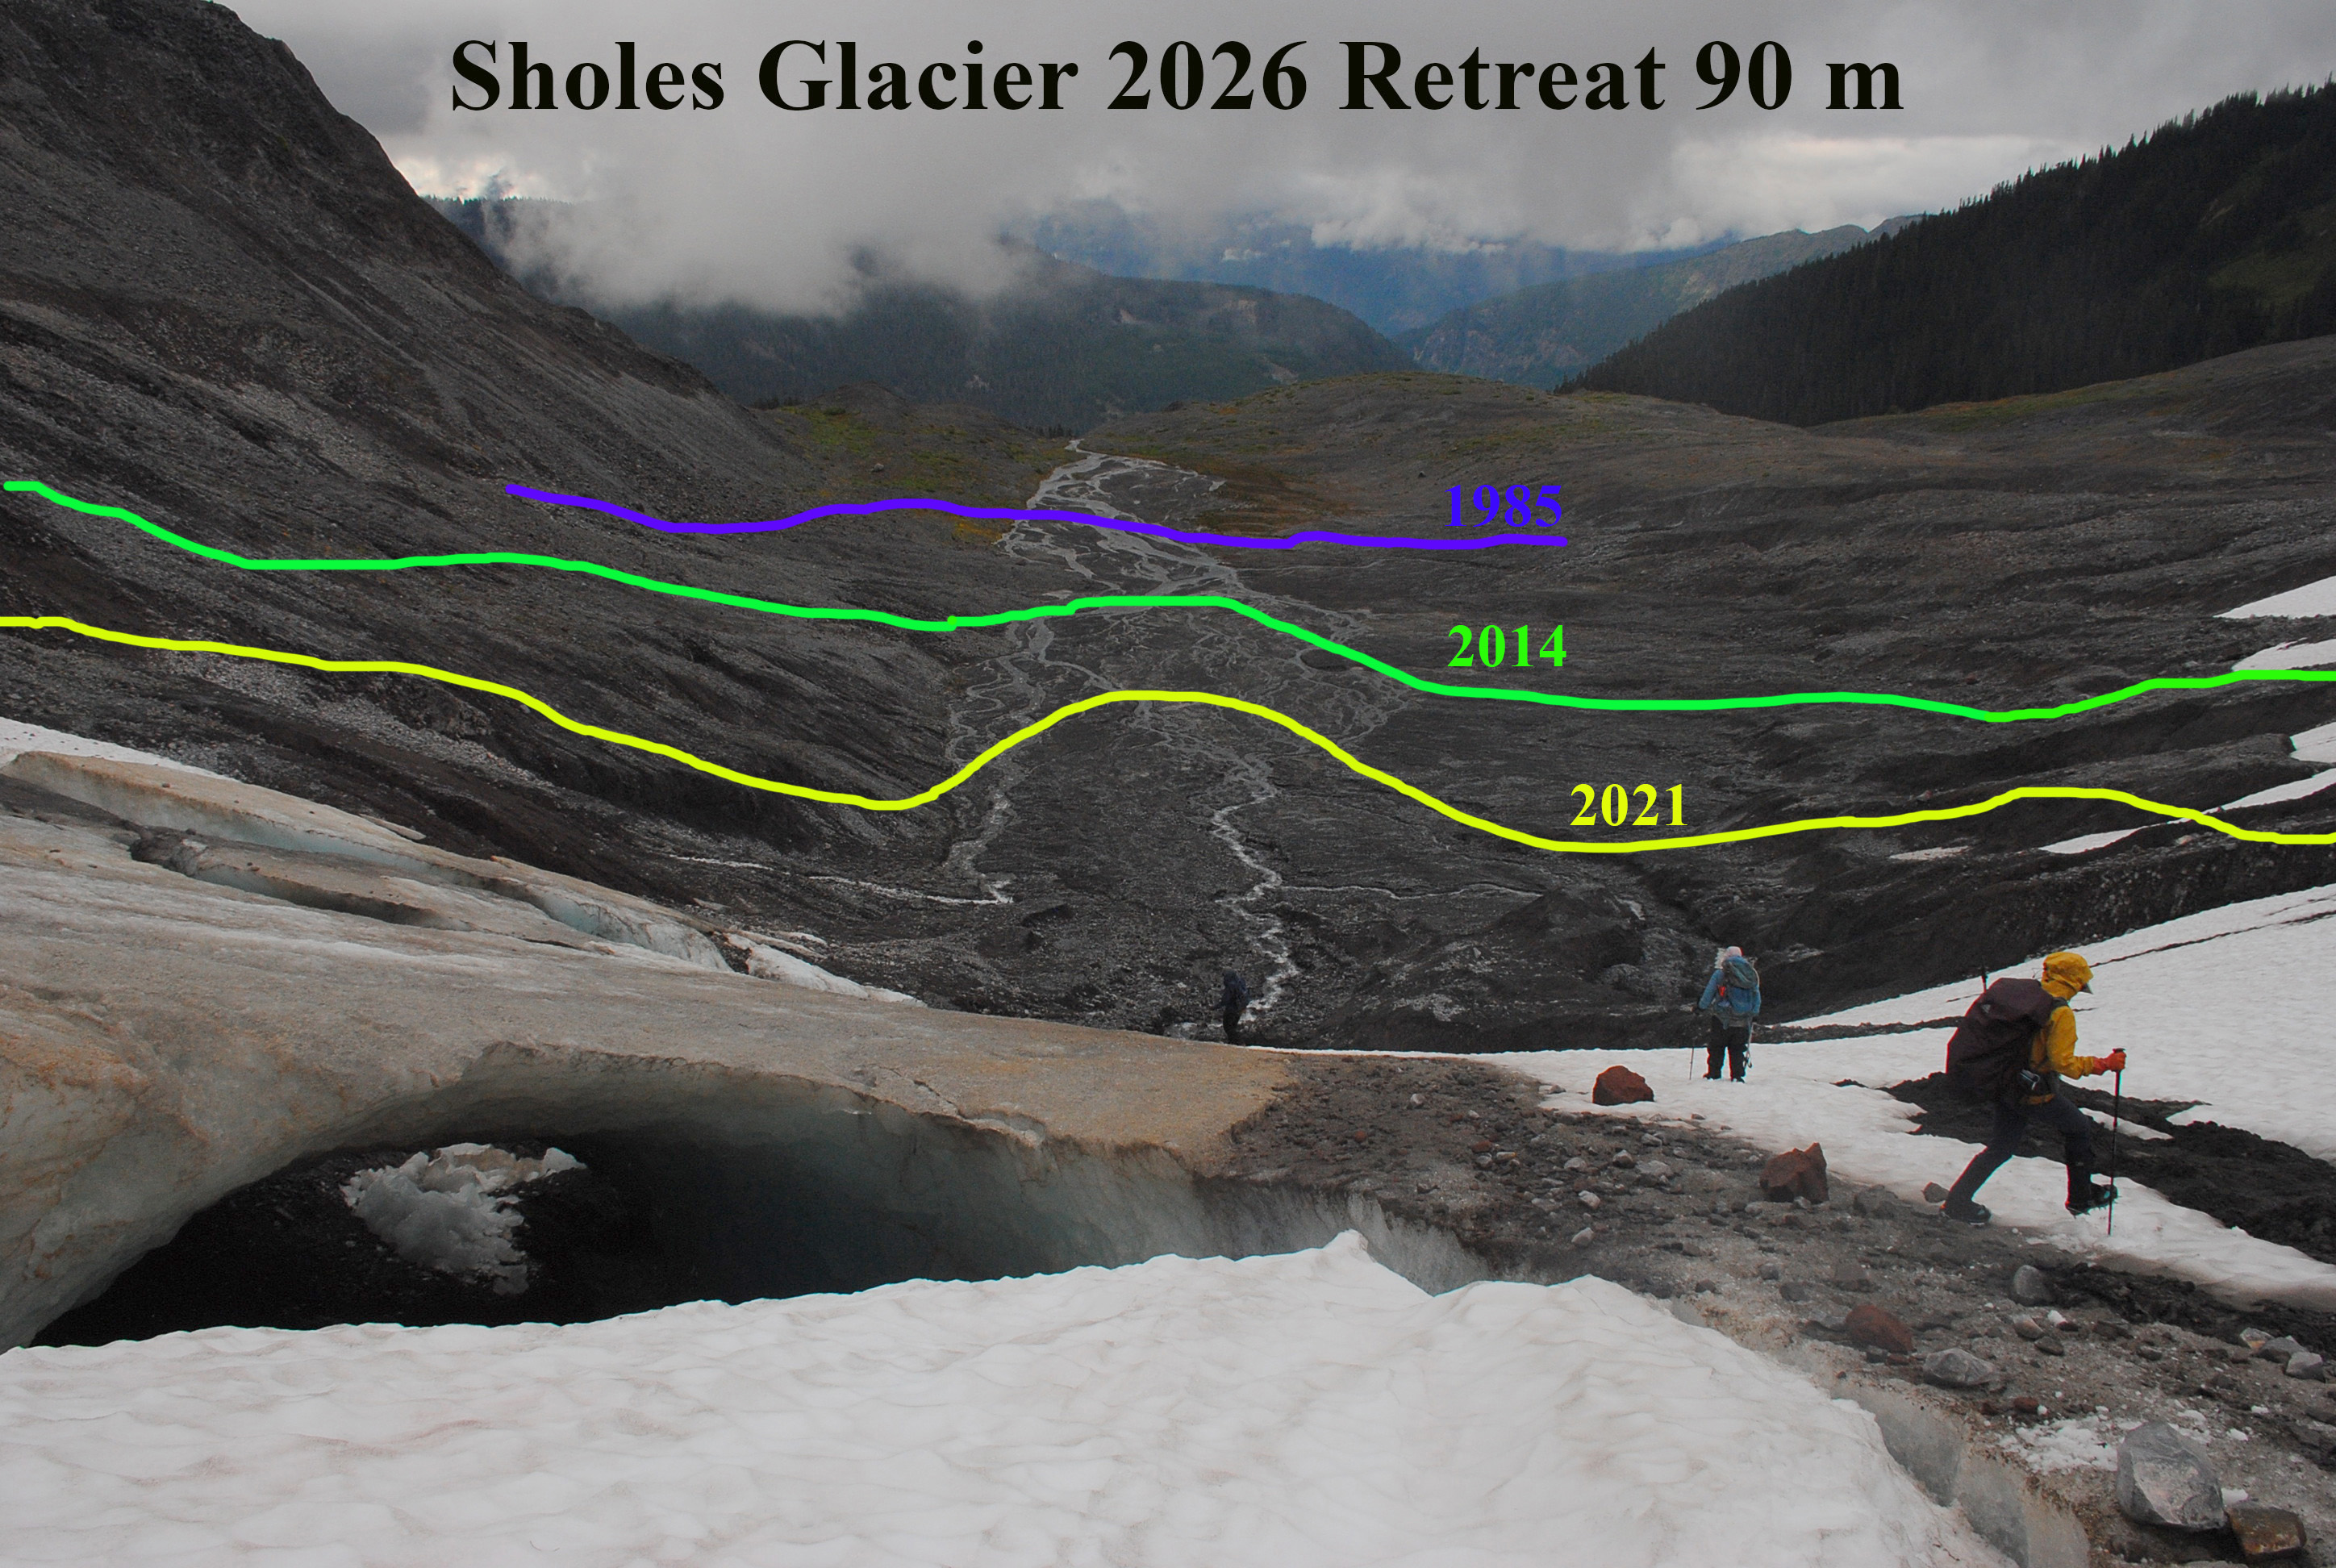
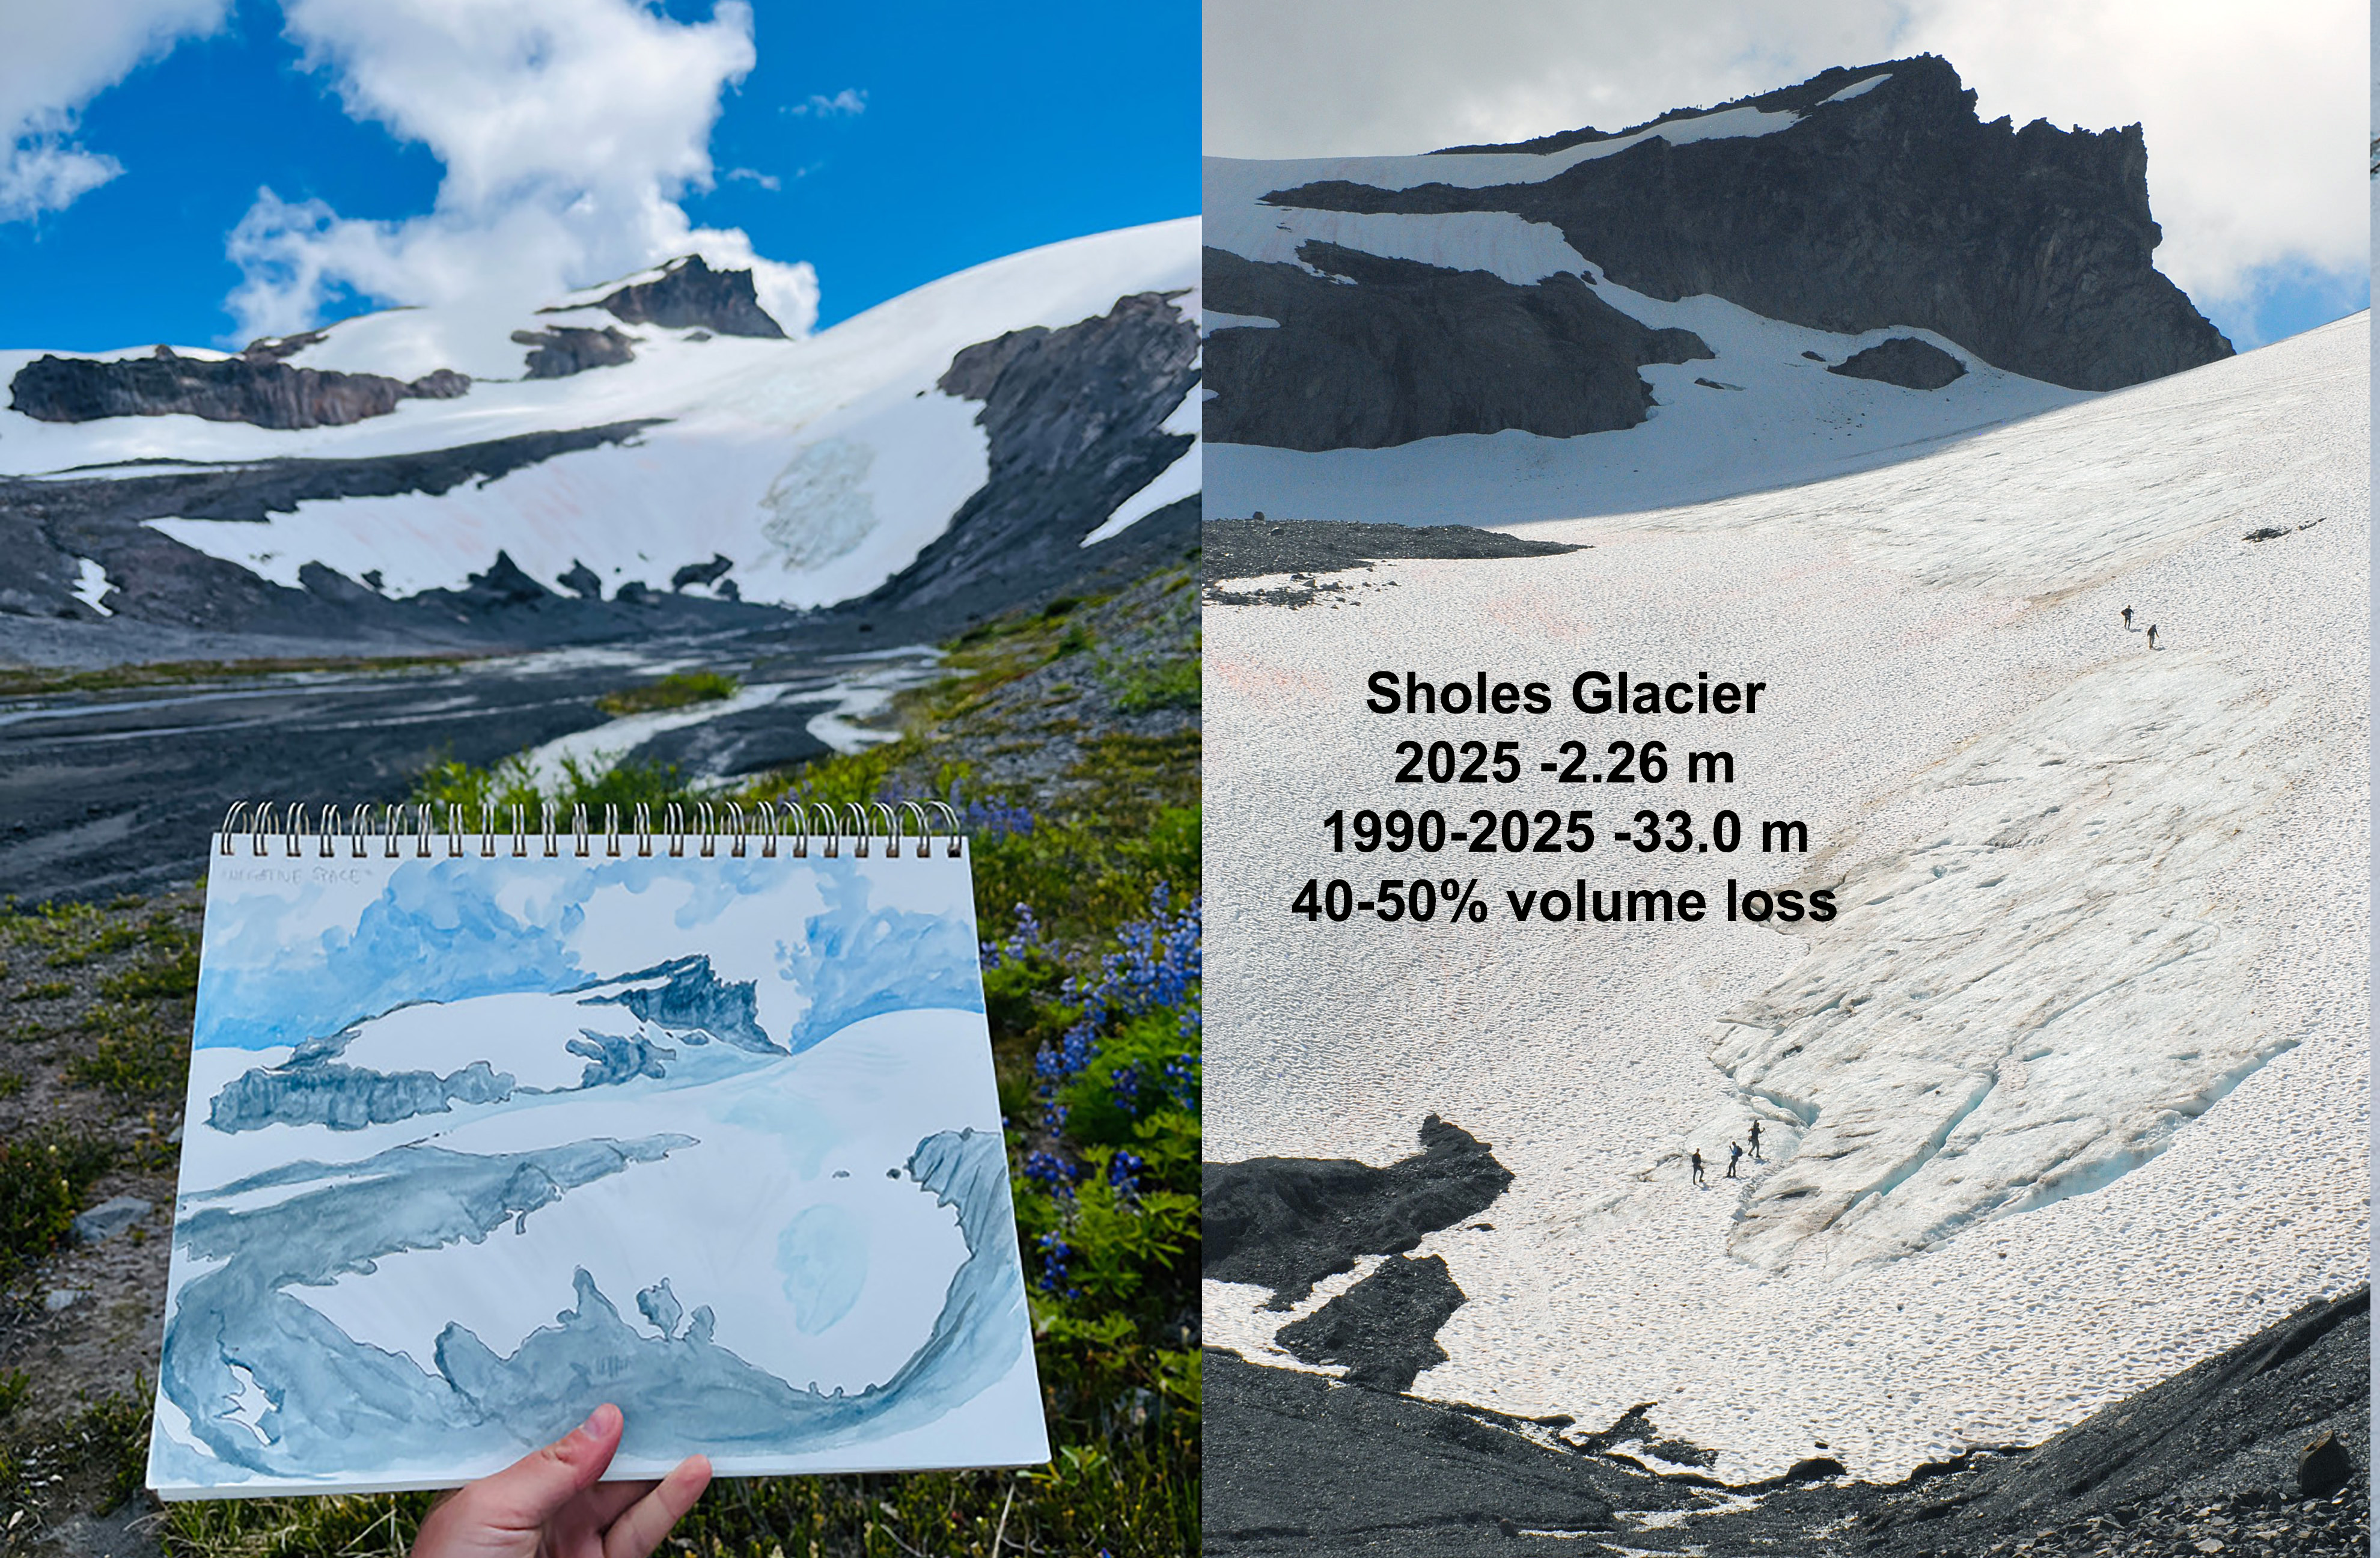
Sholes Glacier terminus and ice cave with former terminus margins noted.

Sholes Glacier on Mount Baker had another spectacular terminus ice cave, that collapsed during the summer leading to further rapid terminus retreat of 90 m. The lower glacier margin continues to rapidly move upslope indicating how thin the lower portion of the glacier is. We observed daily melt through August on this glacier, which averaged 0.065 m/day w.e. The annual balance was -2.24 m on Sholes Glacier.
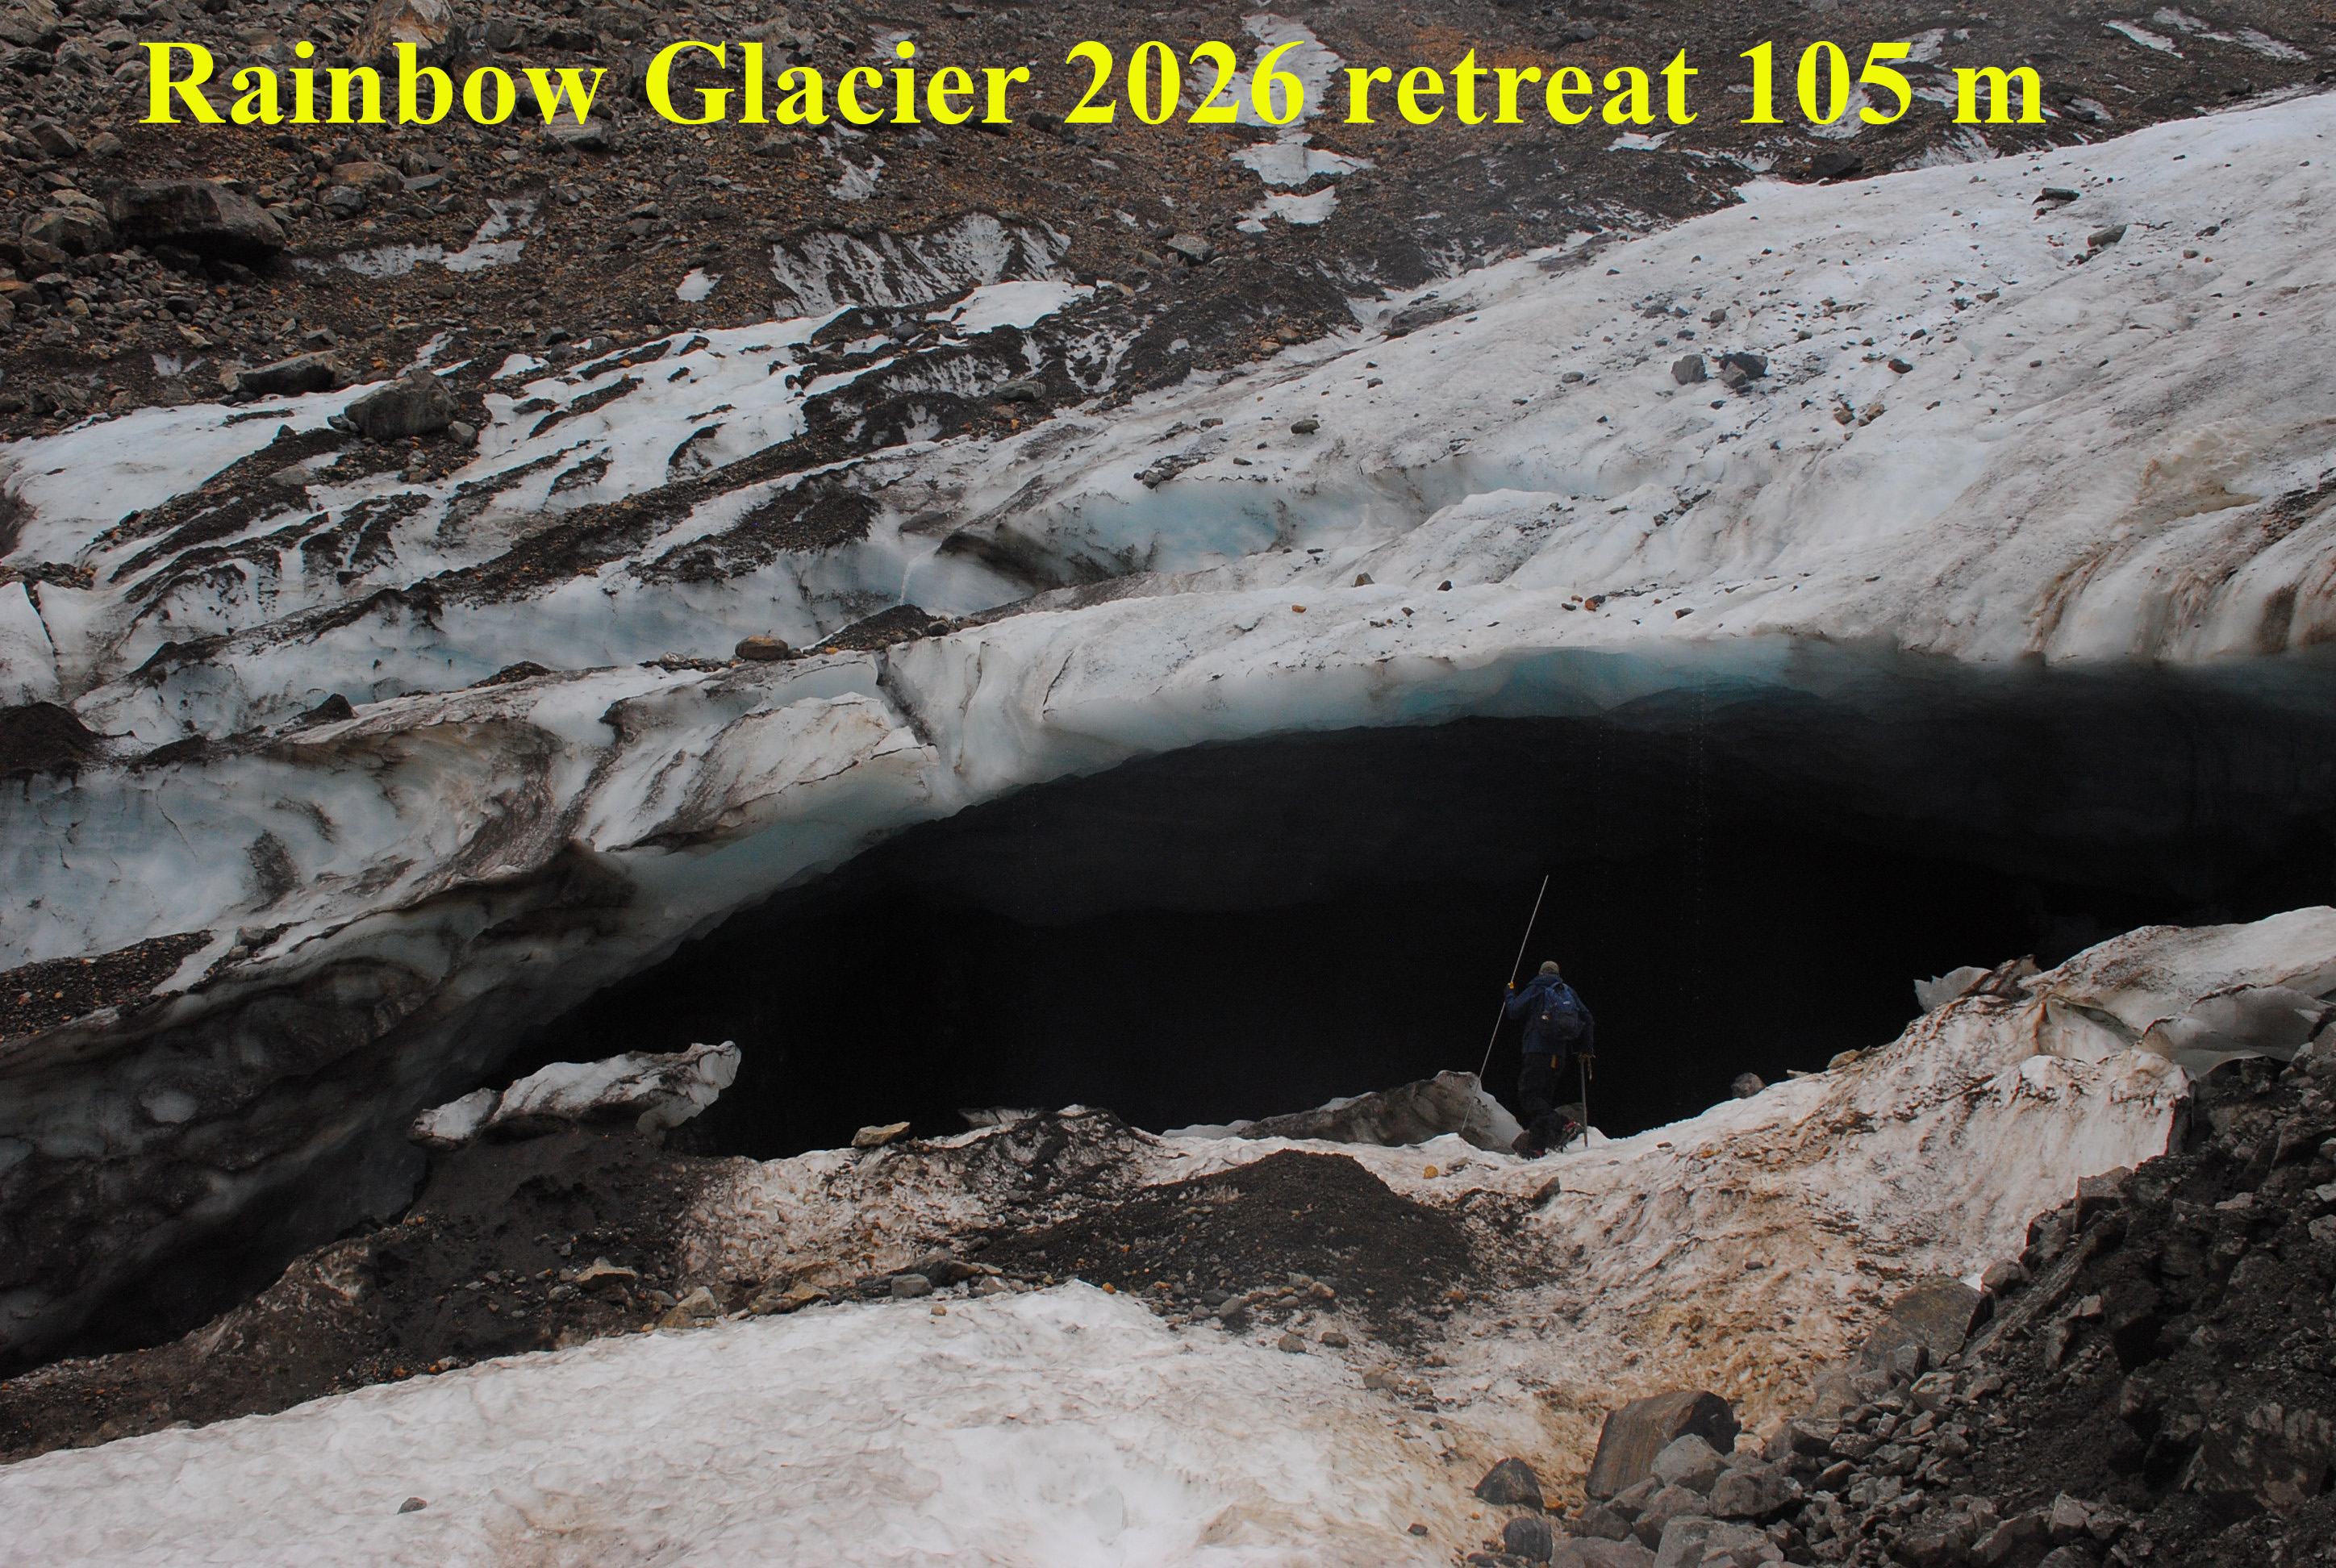
Rainbow Glacier Cave in early August. This cave represents an extension of a collapsed portion.

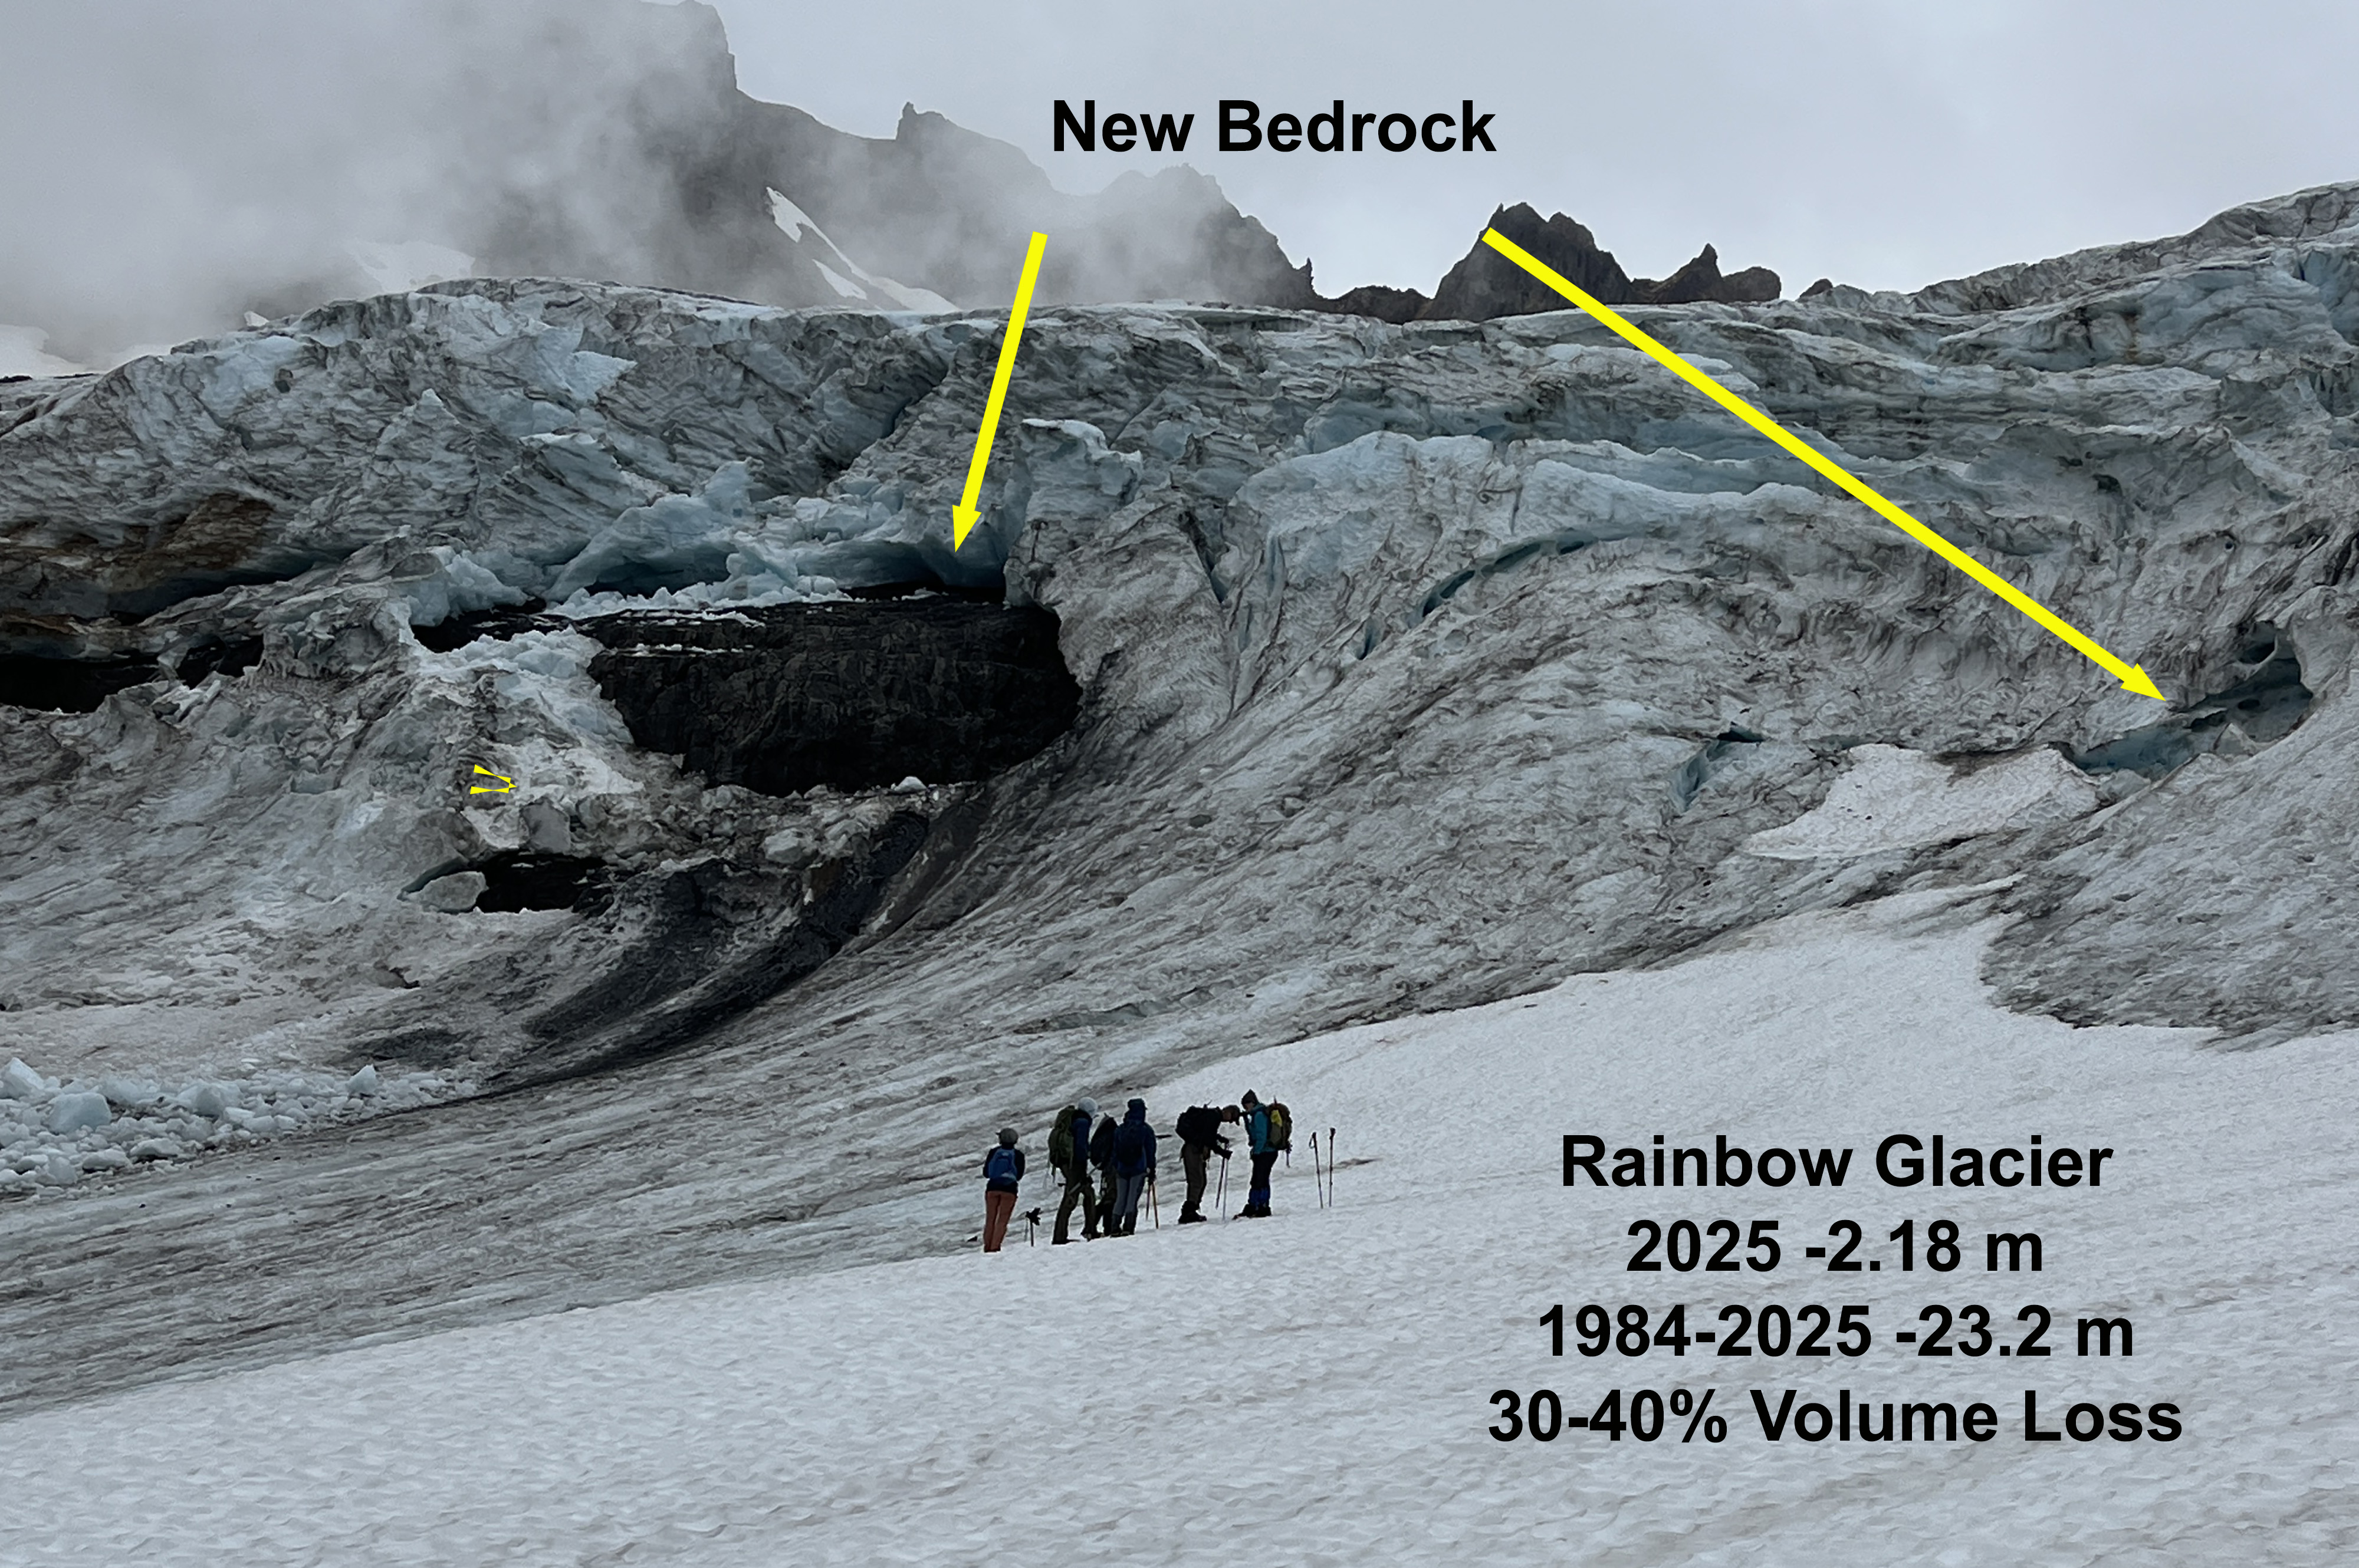
Rainbow Glacier on Mount Baker had a more exposed terminus and lower glacier than we had seen since 2015. This was an indication of the poor winter snowpack. The snowline on this glacier was at 1850 m at the start of August, rose to 1950 m by early September, then rose no further. The snowpack on the saddle between 2050-2150 m was above average indicative of the freezing level during the December atmospheric river event. The terminus retreated 105 m, and the annual balance was -1.46 m.
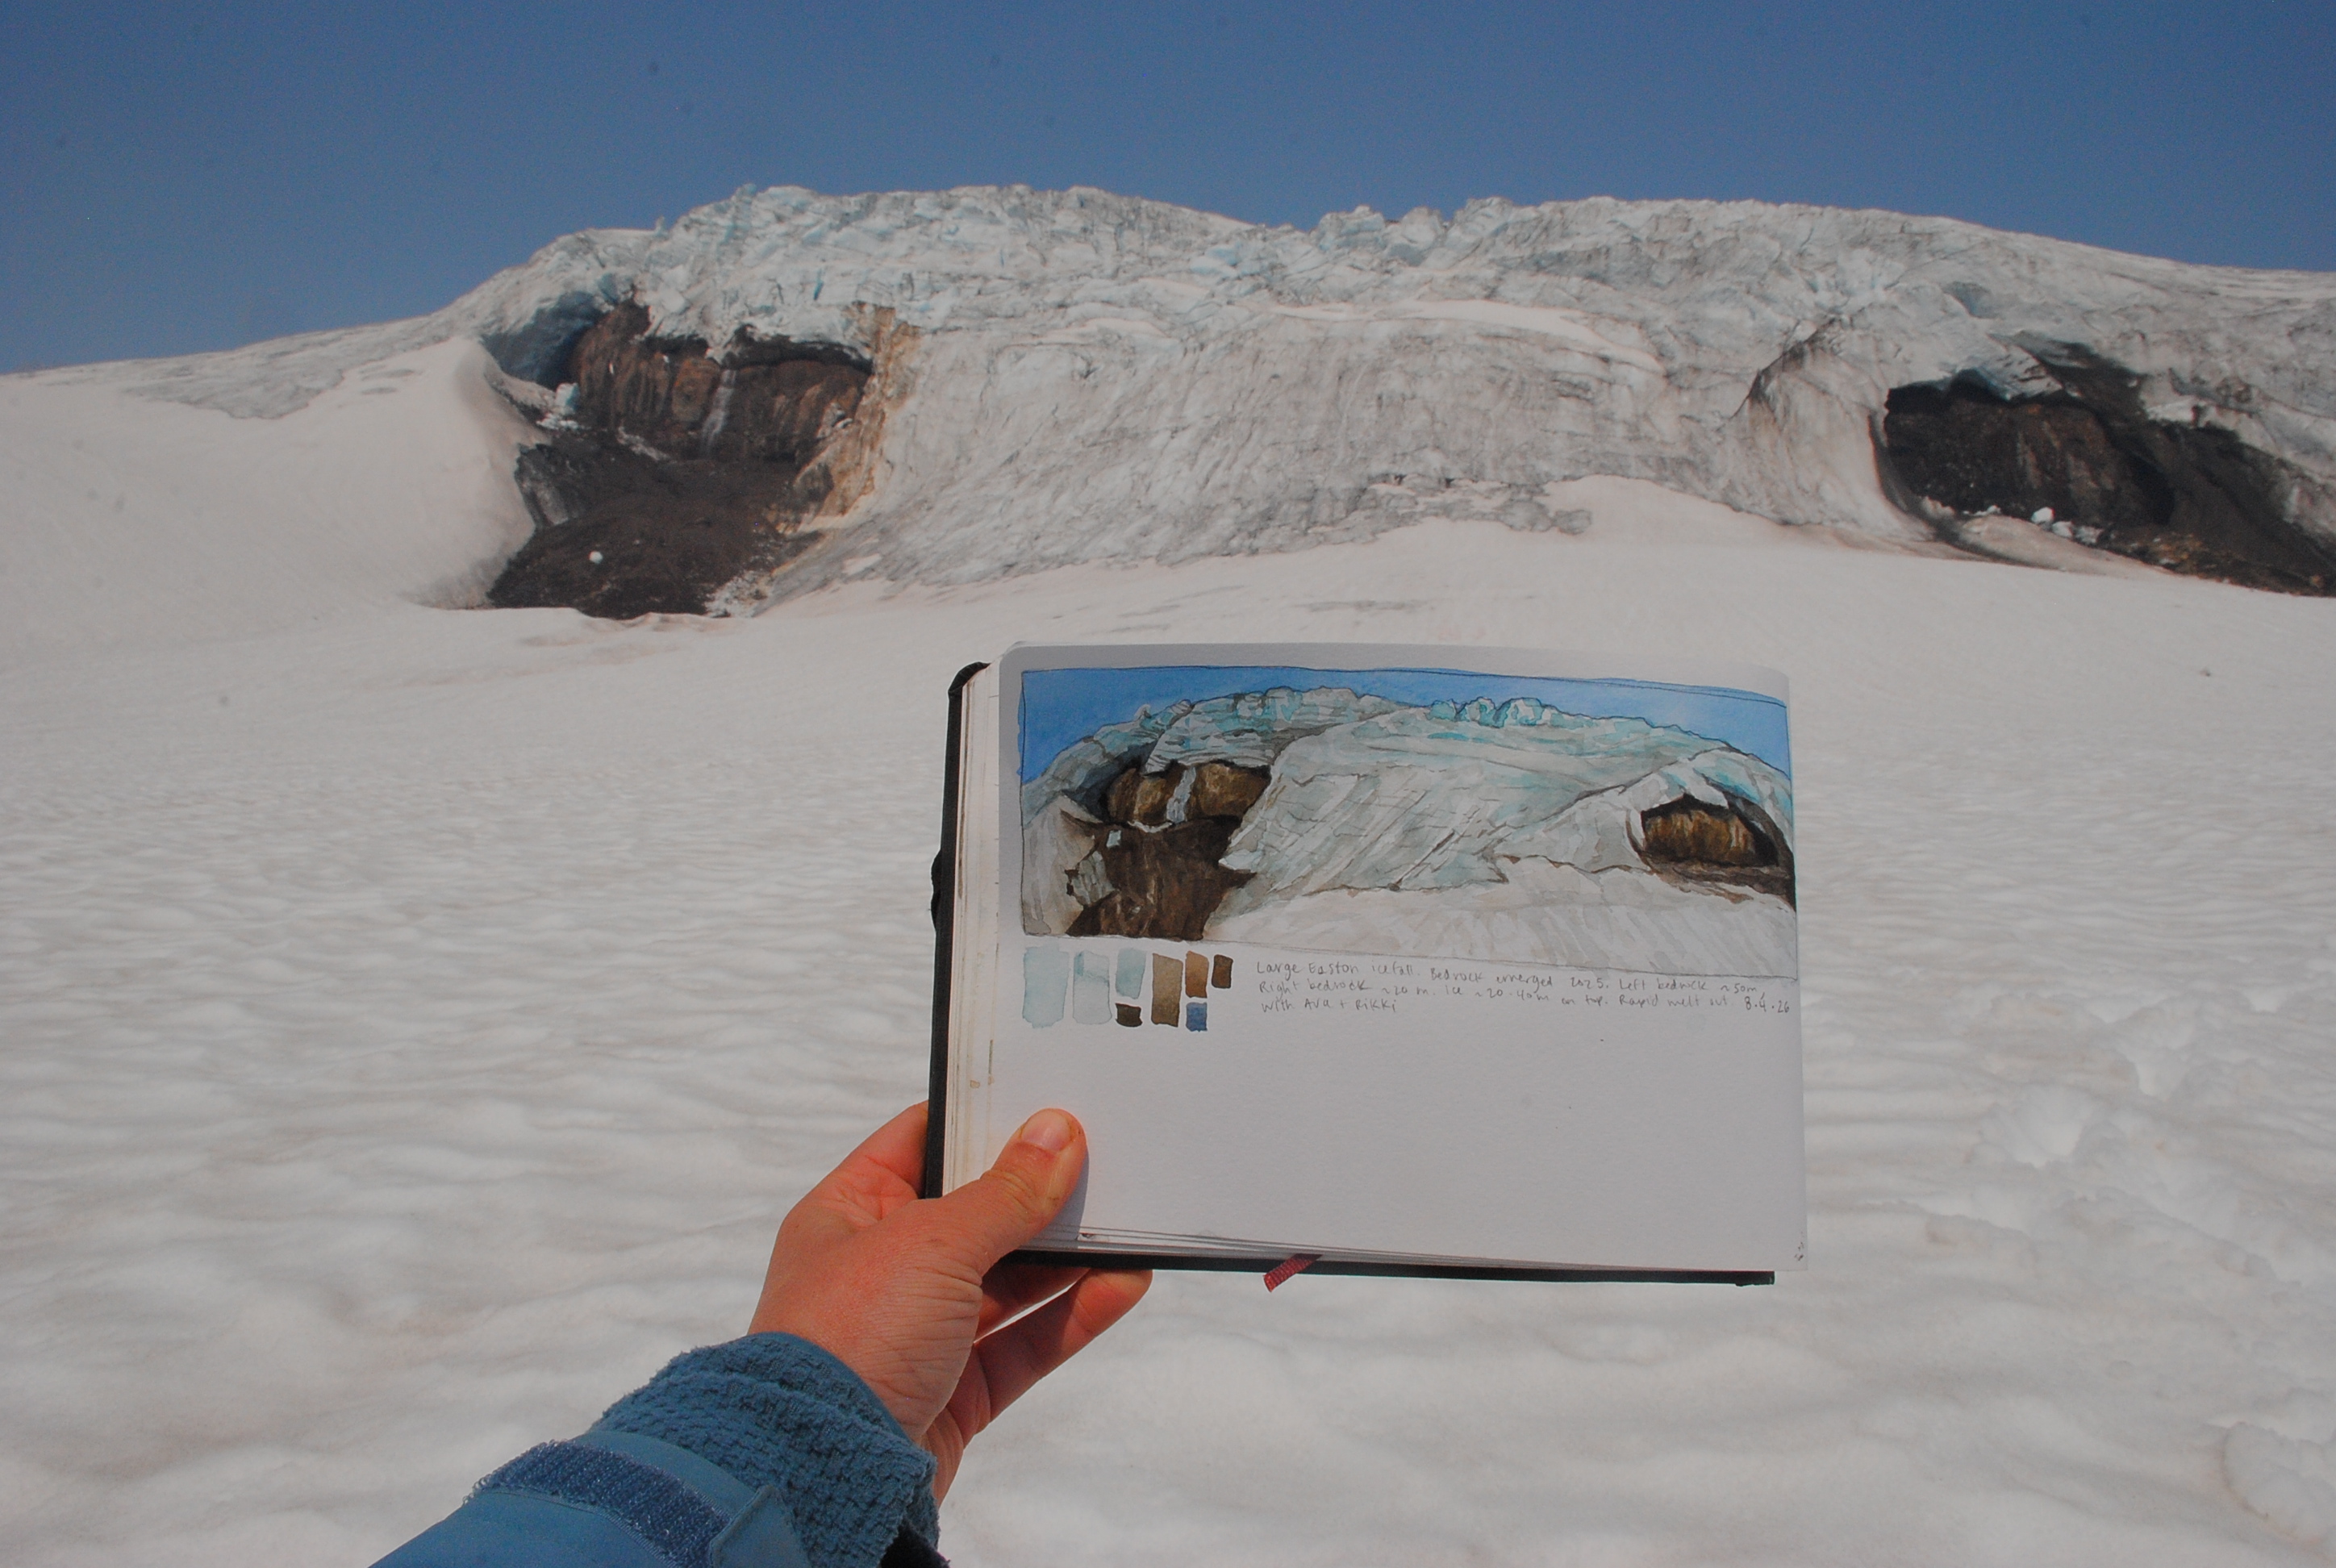
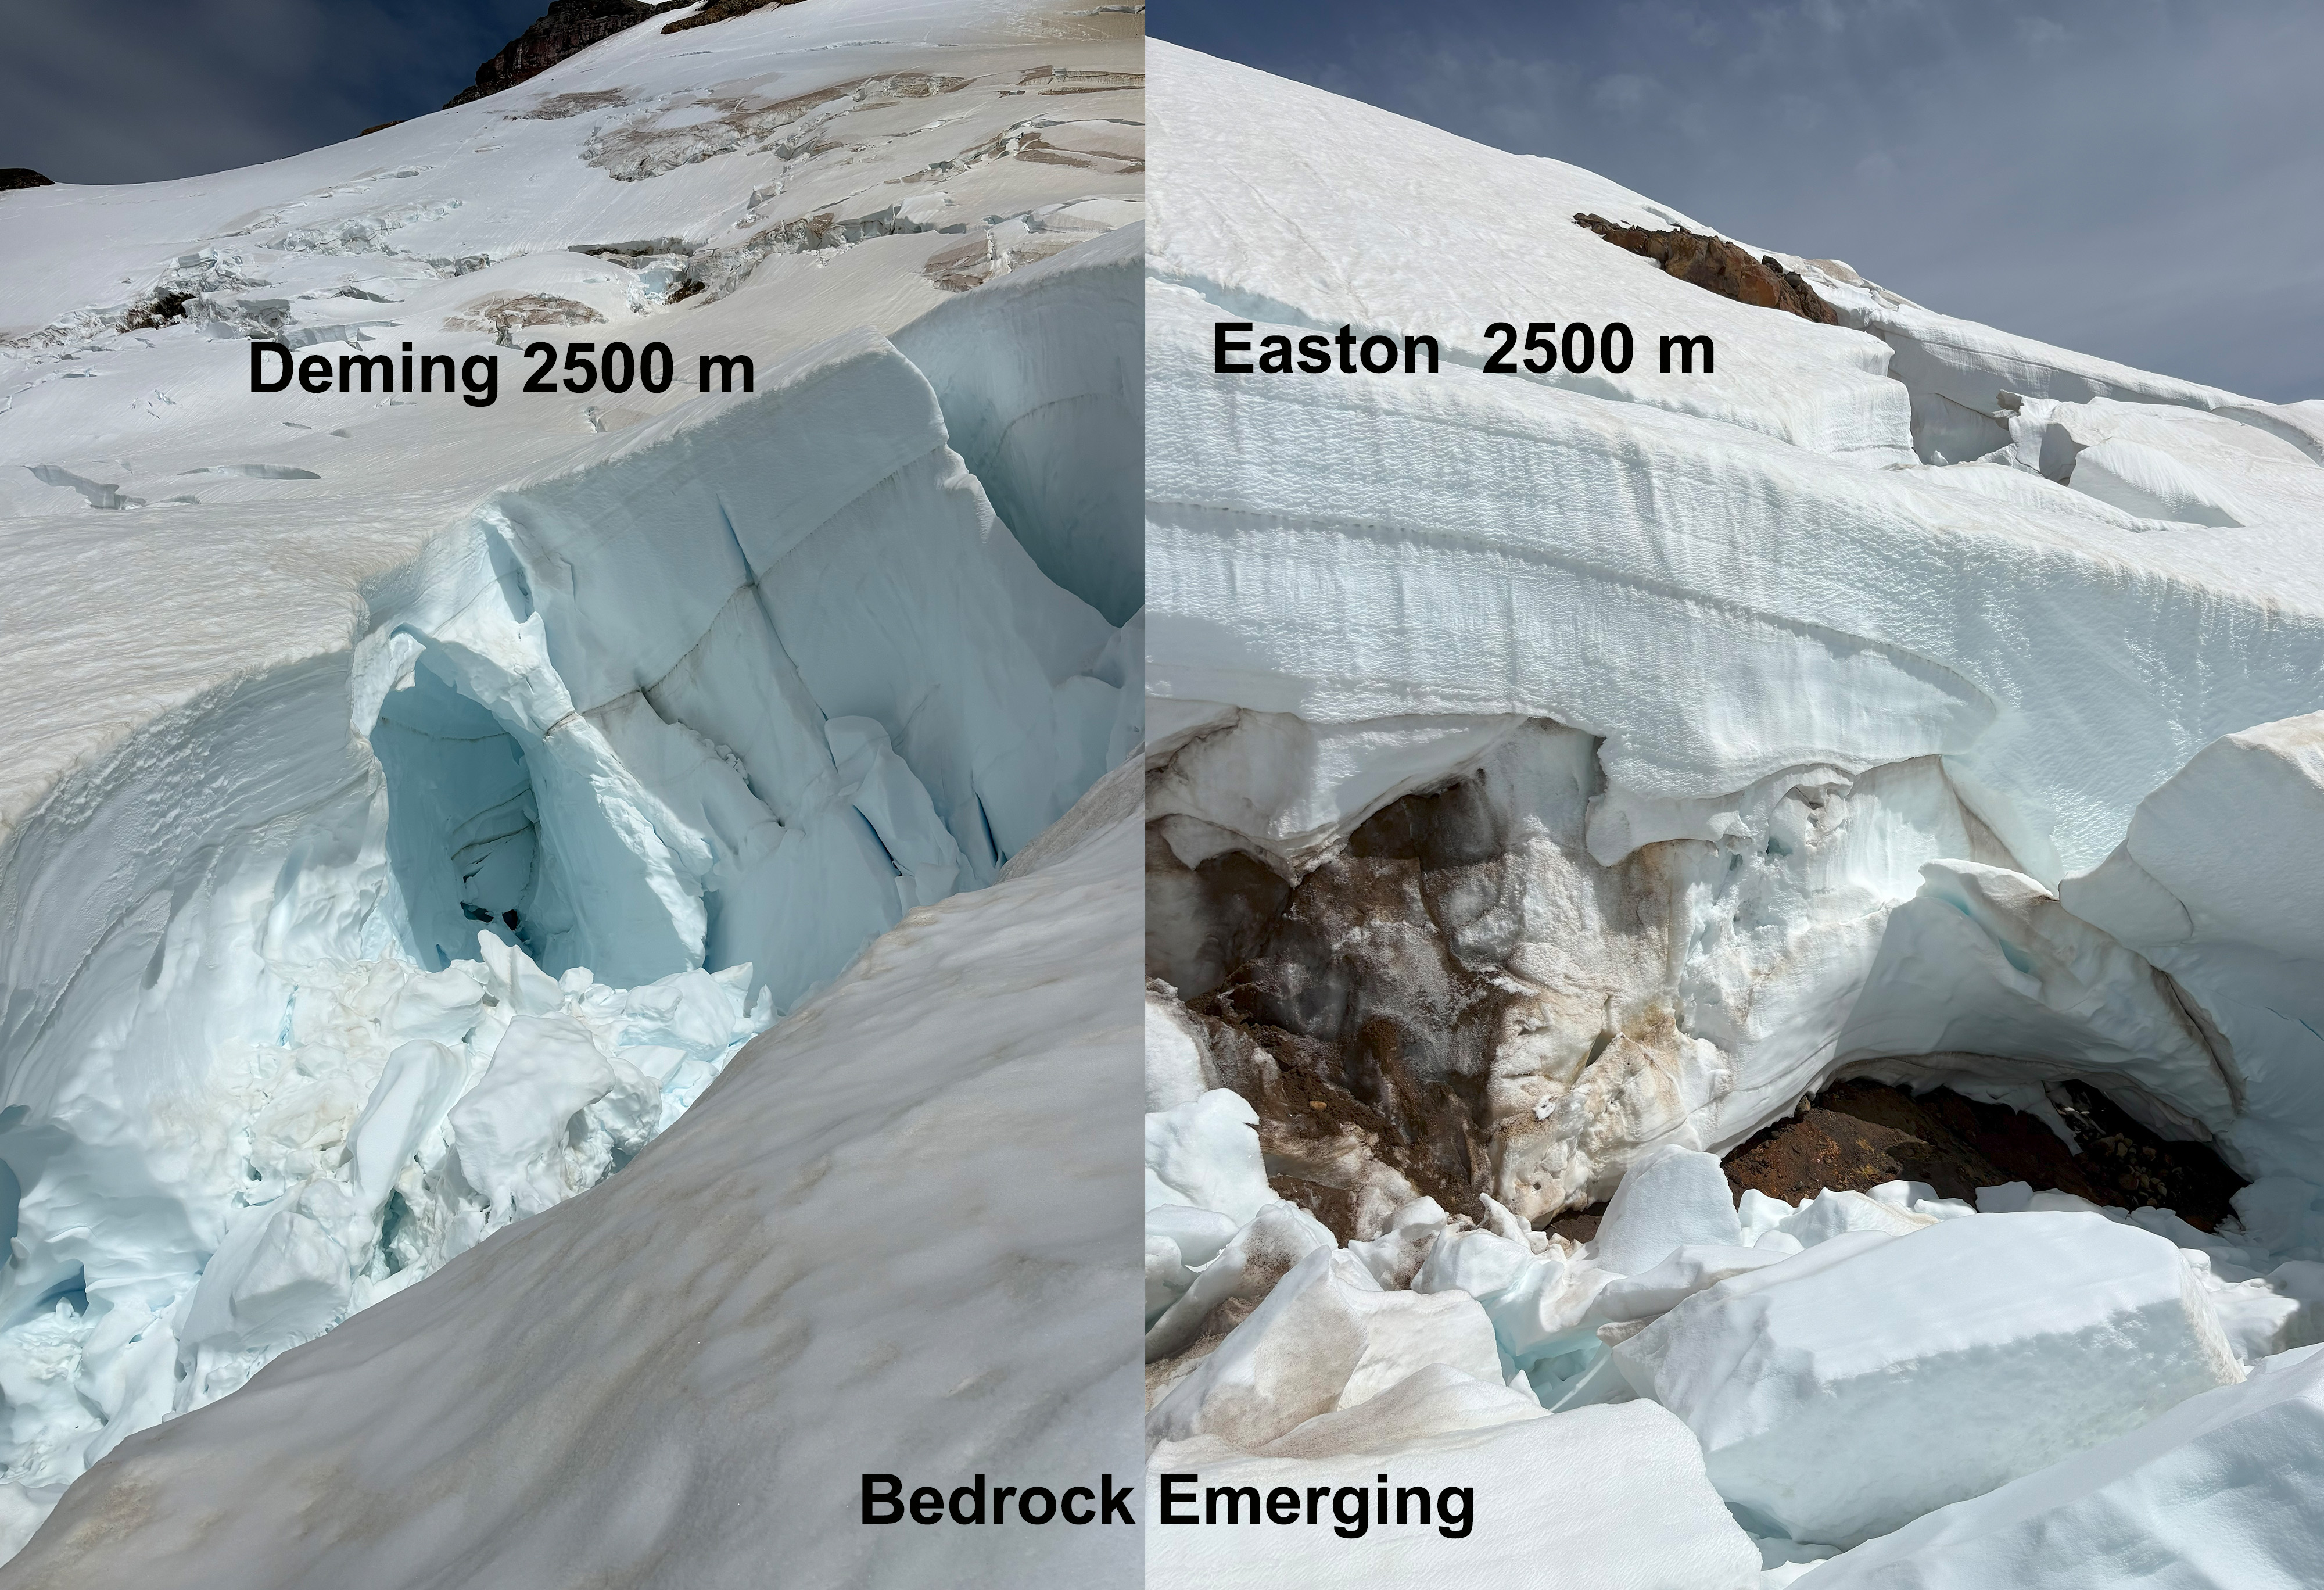
Easton Glacier’s main icefall developed two large bedrock areas, that had not been present in 2024, and were emerging but stil in caves in 2025. This illustrates significant annual thinning at 2100 m, well above the terminus area at ~1700 m. Field Painting by Jill Pelto.

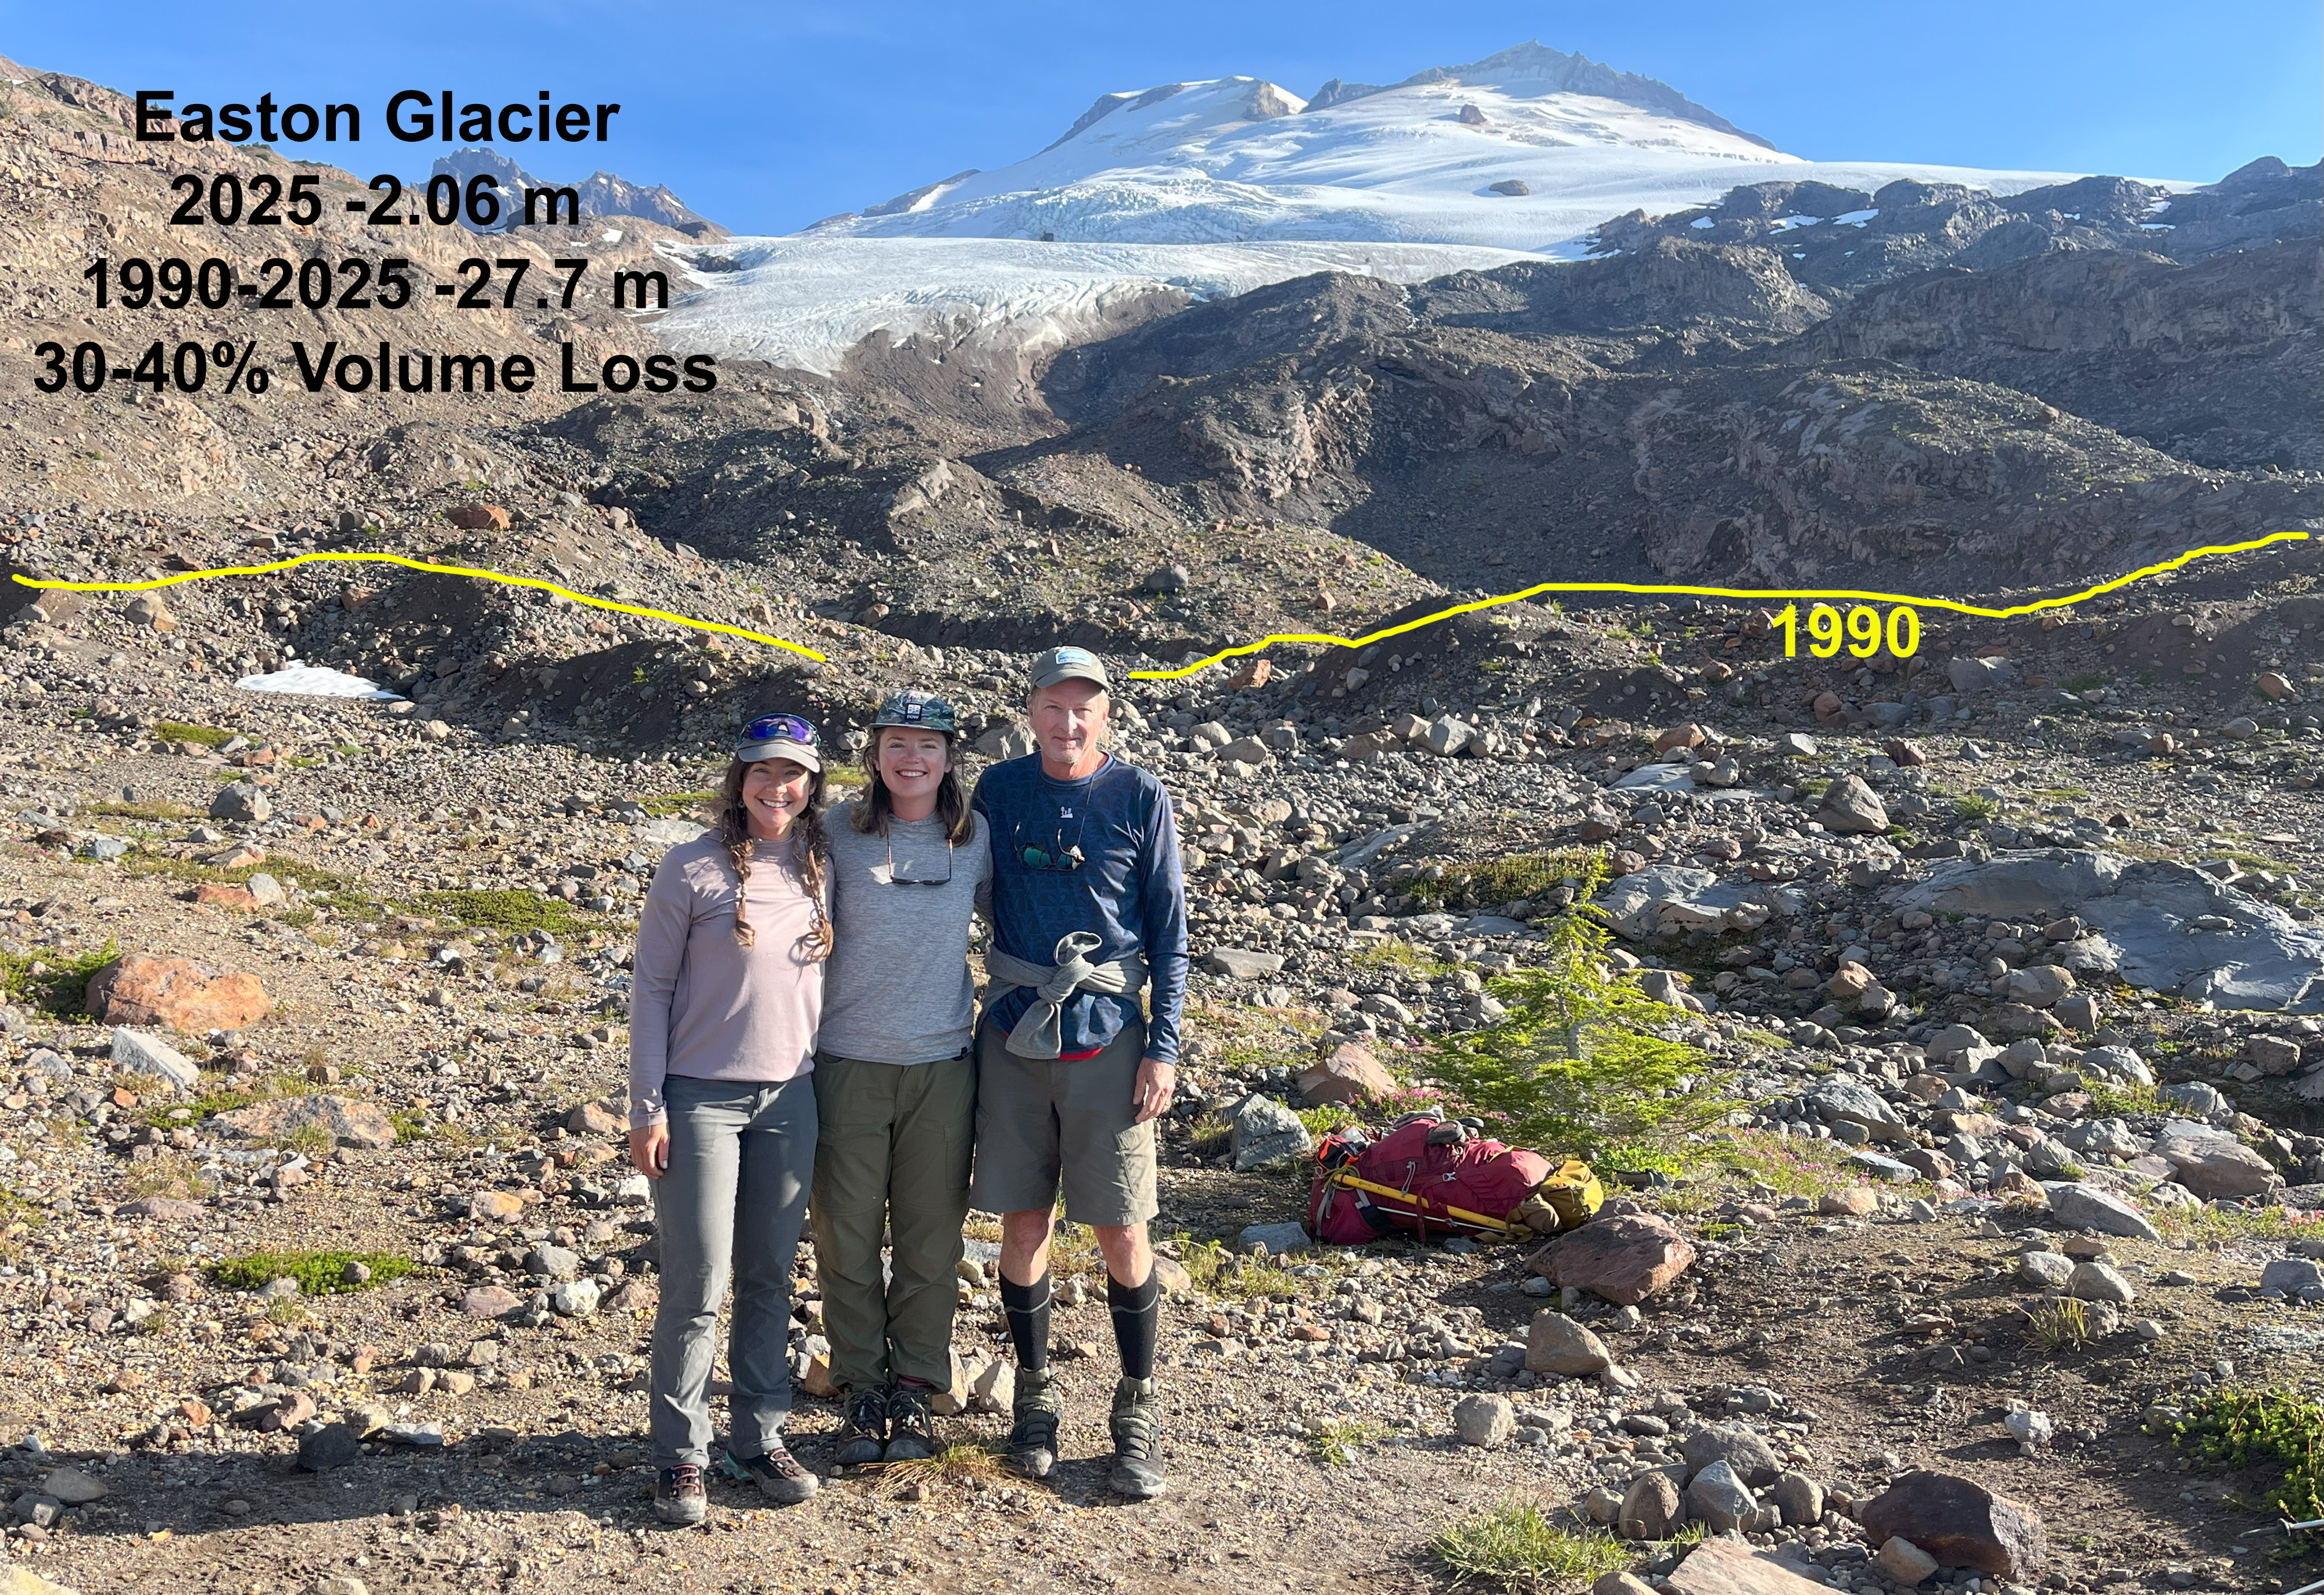
Easton Glacier below 2200 m lost all snow cover by mid-August and thinned rapidly, leading to continued rapid retreat of 45 m. The thinning exposed new bedrock areas as high as 2800 m on the glacier. The snow depth rose rapidly above 2400 m, indicating the freezing level during the December AR event. Annual balance of -1.17 was less negative due to better high elevation snowpack.
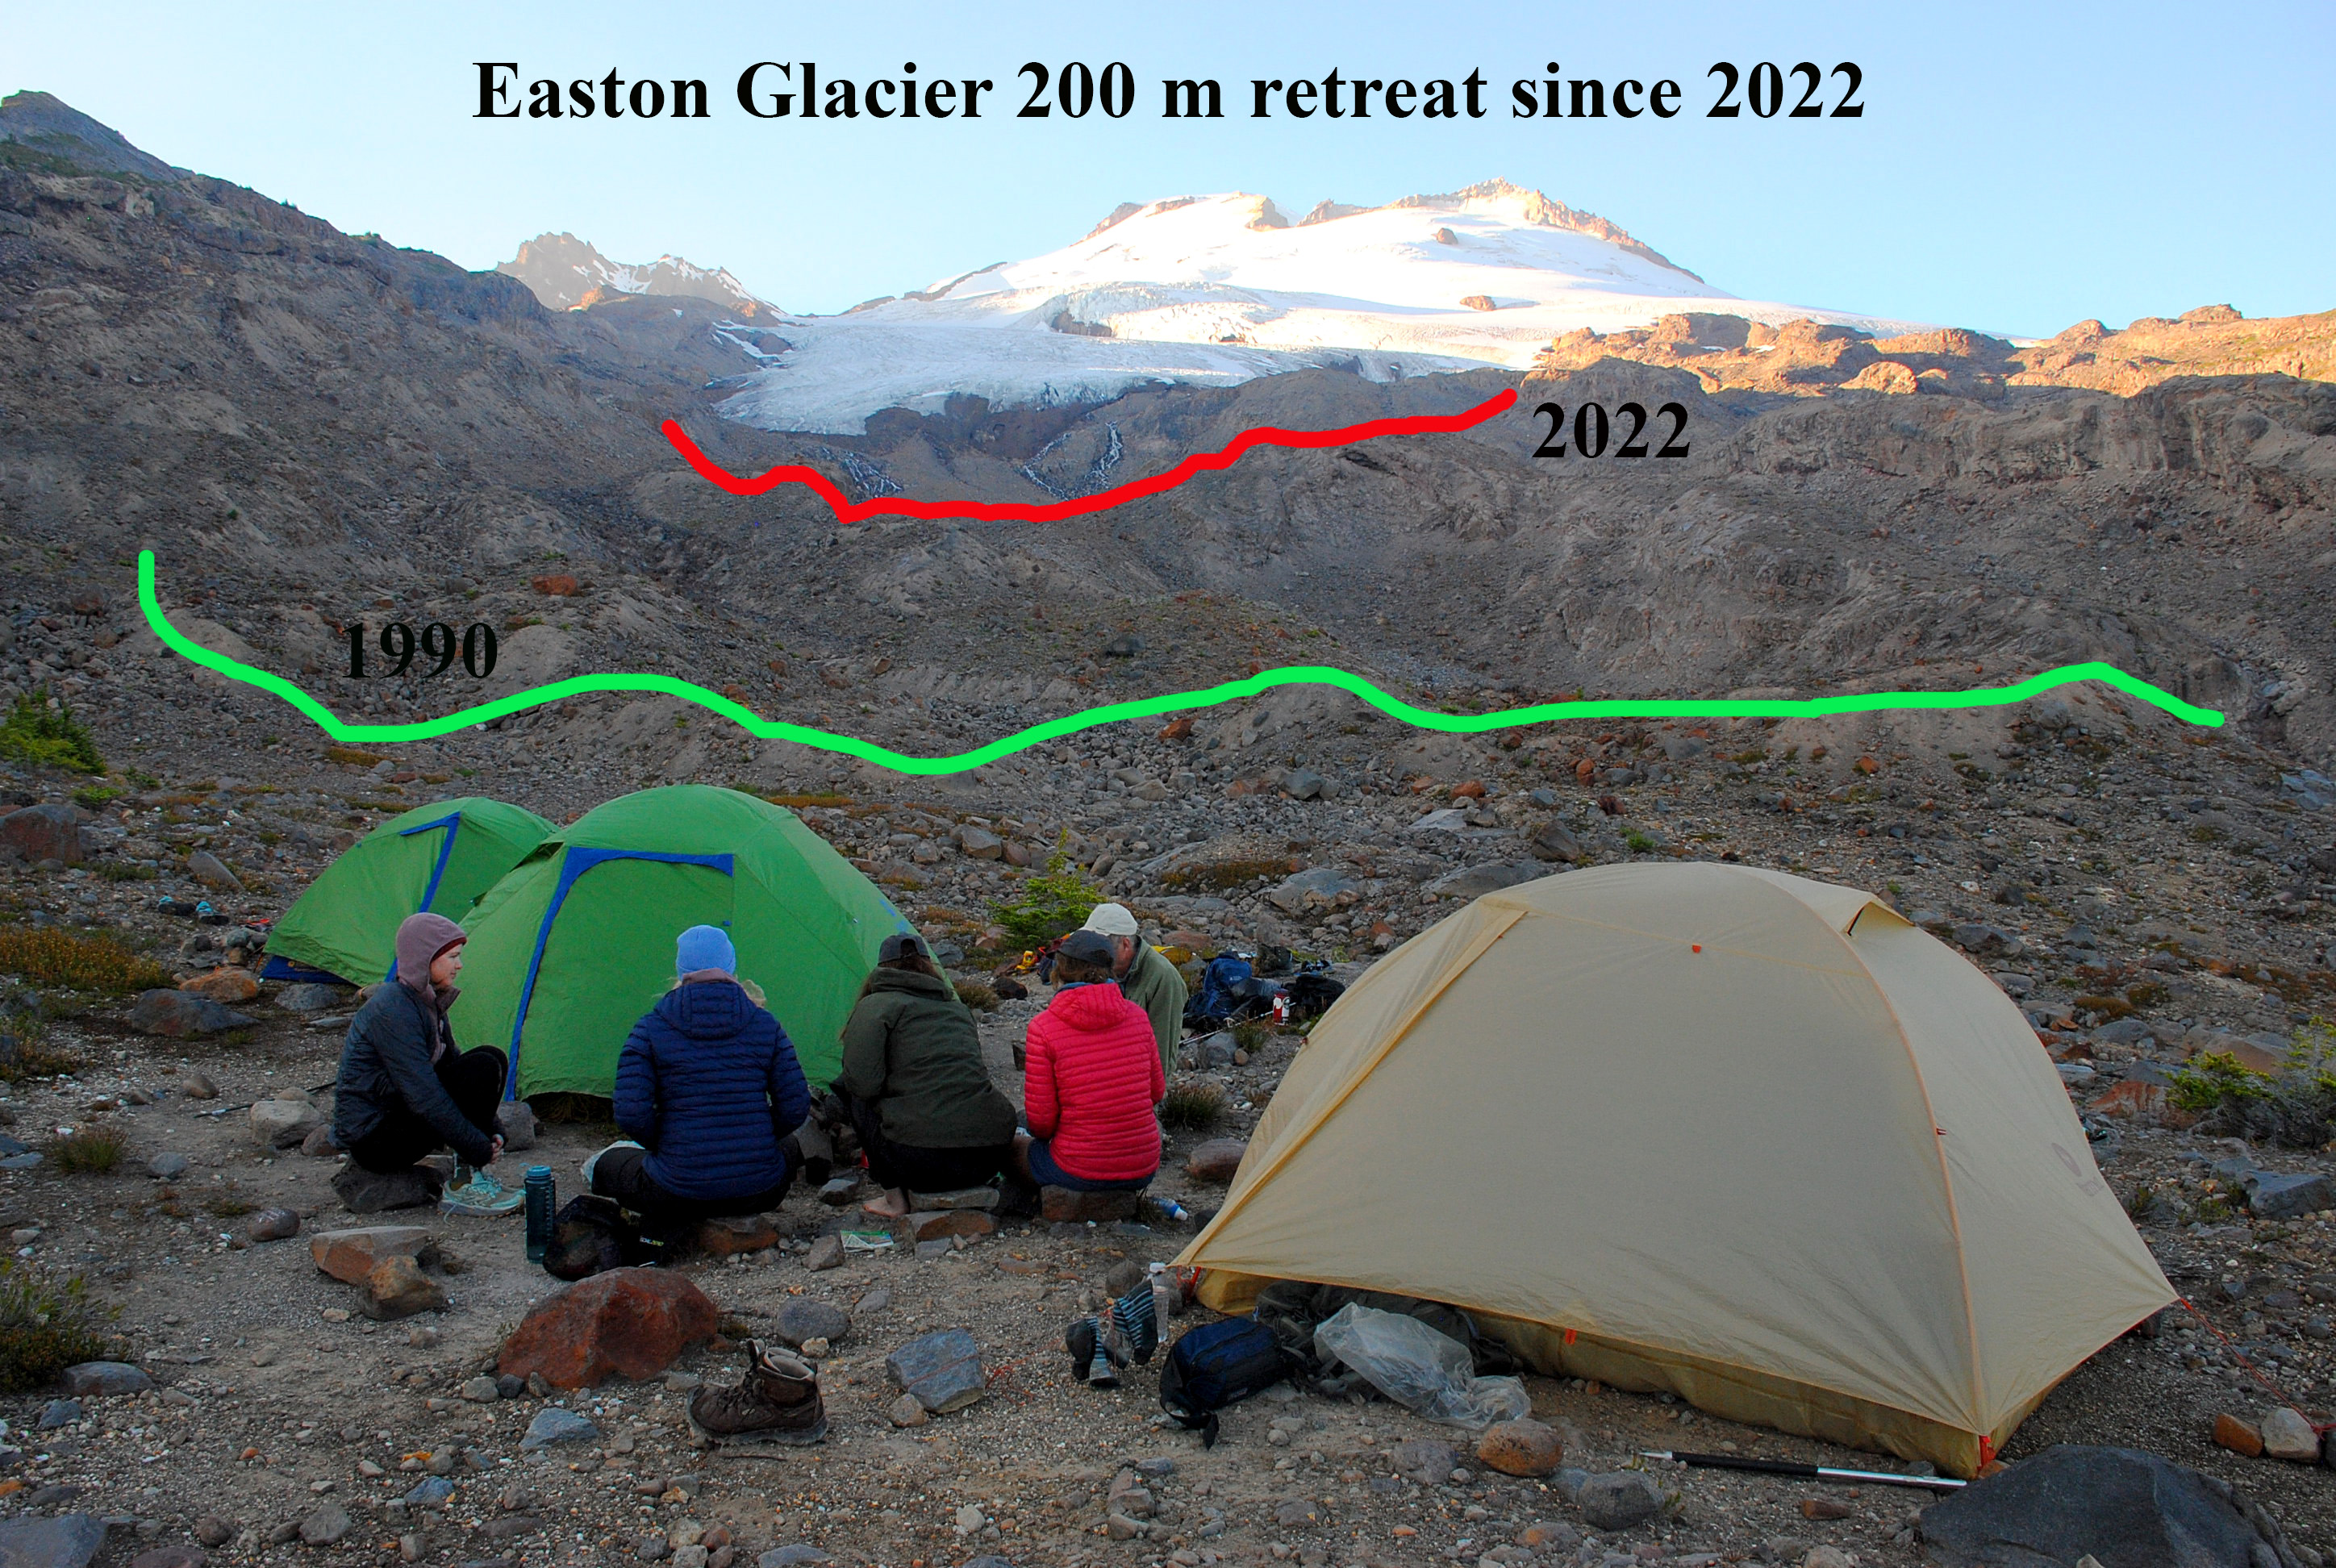
Easton Glacier in 2026 from our base camp.

We observed terminus retreat and accumulation area ratio and 2300 m snow depths on Deming, Squak and Talum Glacier. Deming Glacier retreated rapidly, losing 110 m in 2026 due to a cave collapse and formation of a small lake. Squak’s steep terminus lacks crevassing indicating limited motion despite the 30 degree slope. This illustrates how thin the ice is, which will lead to continued rapid retreat, which was 40 m in 2026.

Columbia Glacier and its expanding proglacial lake in mid-August 2026. notice only snowcover in avalanche fans on west side.

In 2026 the approach to Columbia Glacier via the Blanca Lake trailhead was lengthened by bridge and road washouts from the December atmospheric river event. The lack of avalanche snowpack in the basin and on the glacier indicates the warm winter conditions that prevented buildup of snowpack in the 1600-2000 m range that feeds this glacier. By early August the only snow cover on the glacier was in two avalanche fans on the west side. By the end of summer only 10% of the glacier had snowcover, and the annual balance was -2.56 m. The lake at the terminus expanded due to continued rapid retreat, 50 m in 2026.
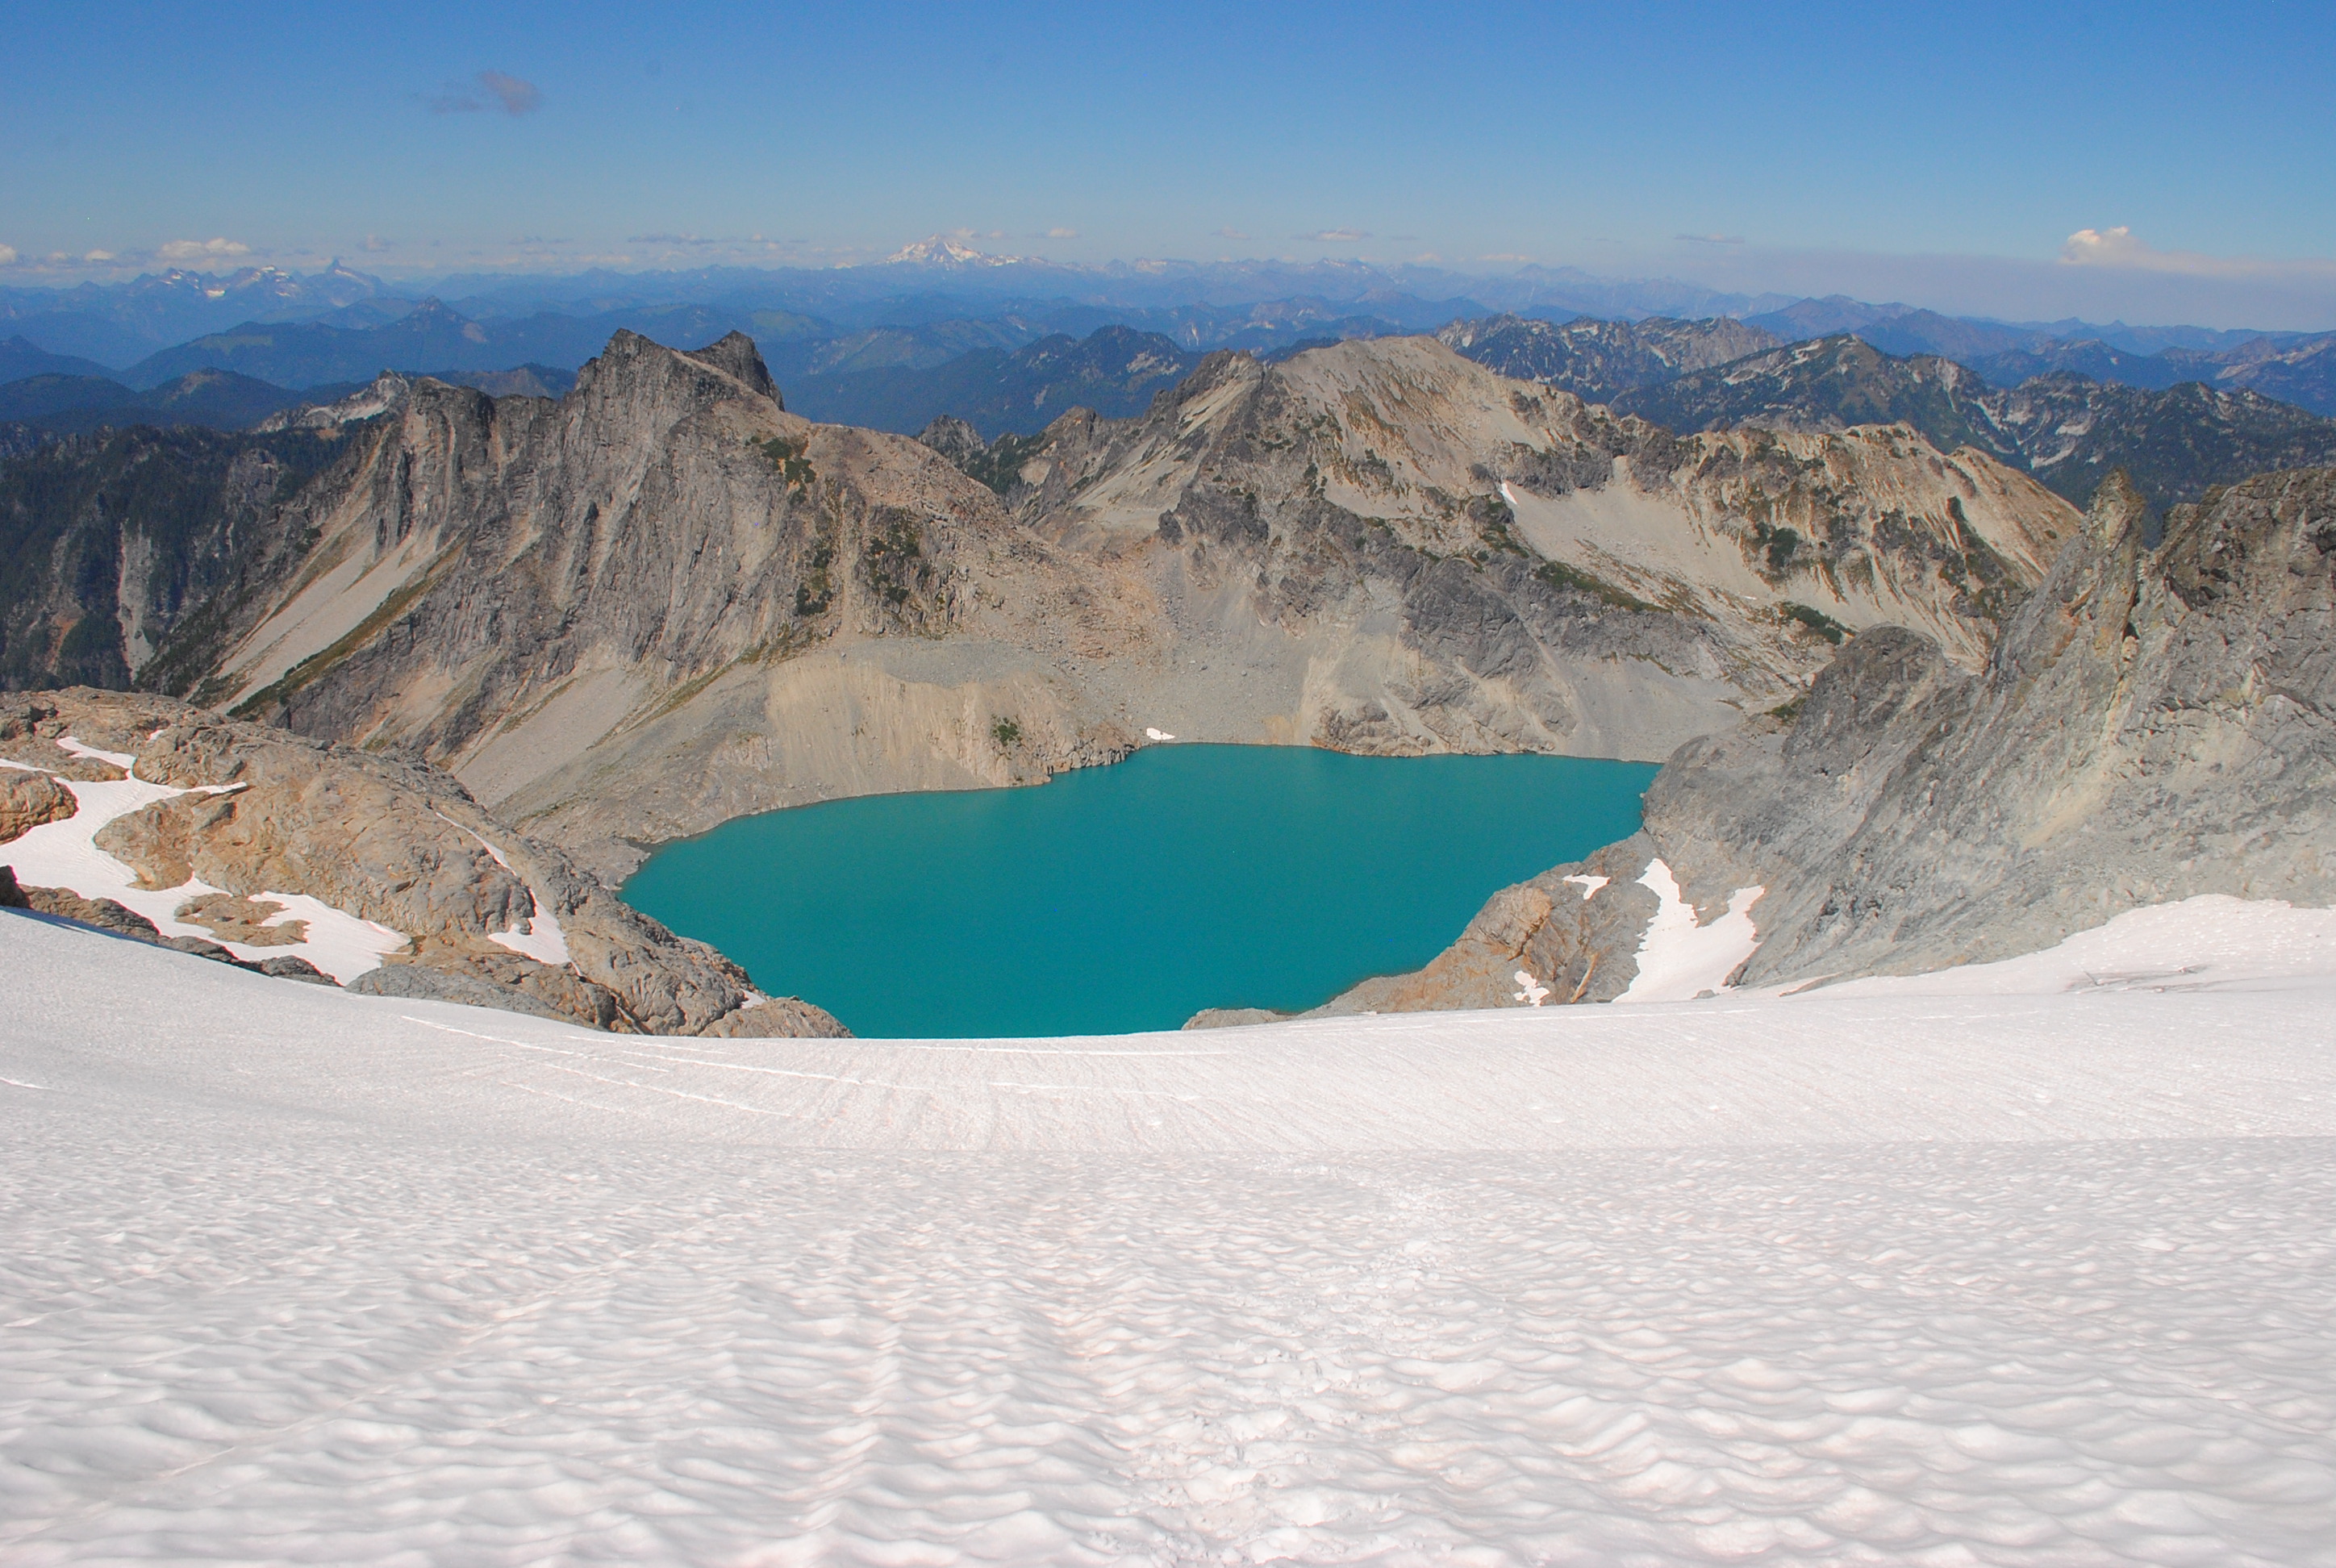
Lynch Glacier’s upper accumulation basin. Notice lack of snowpack around Pea Soup Lake in the 2000 m range, while good snowpack existed at 2300 m.

Lynch Glacier had substantial snowpack remaining in its upper basin above 2300 m. This indicated that the December atmospheric river event deposited snow not rain on the upper Lynch. This was partly due to the embedded cold air east of the divide that Lynch Glacier sits on. Our approach and exit from Mount Daniel and Lynch Glacier was impacted by smoke from the Three Queens fire, the area was evacuated as we completed work on these glaciers. The glacier had its highest accumulation area ratio, 30% since 2020 leading to an annual balance of -1.28 m.
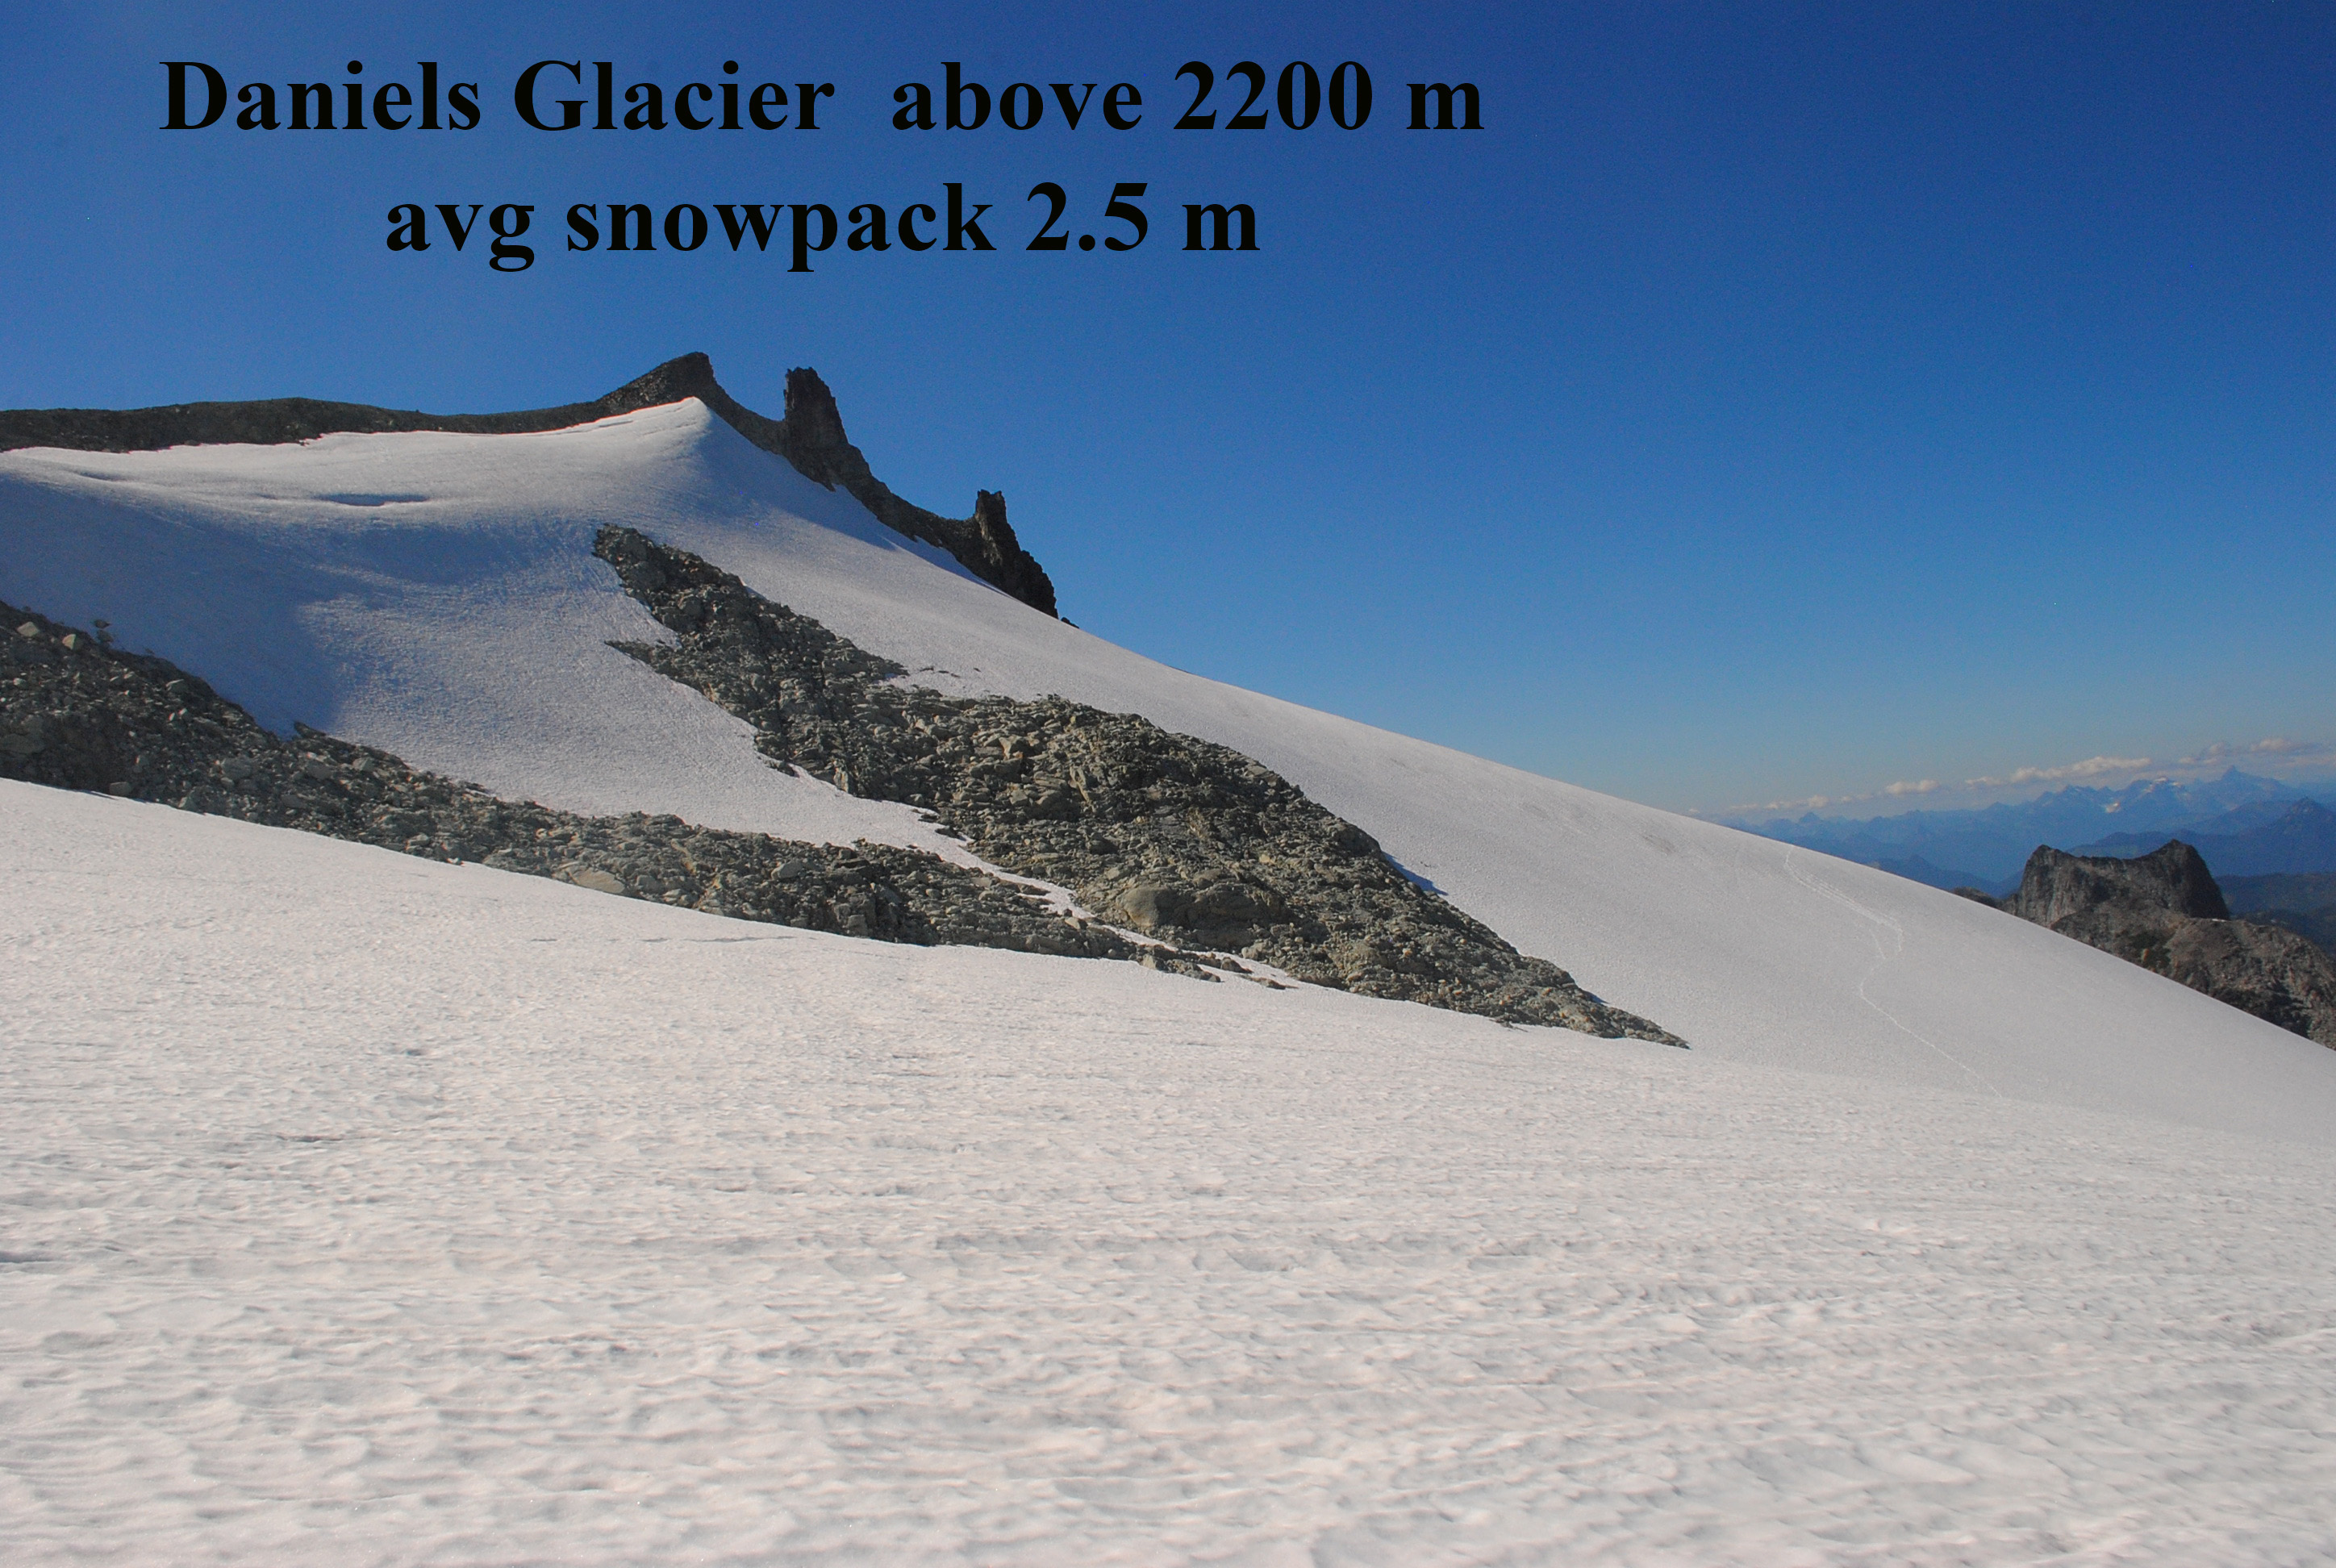
Daniels Glacier in mid-August with good snow cover.

Daniels Glacier was the clear winner in 2026! Rapid recession has eliminated the lower section below 2150 m, which was 40% of its area. In early August the glacier was still fully snow covered. By early September the glacier was still 80% snow covered. This remaining snowpack was thin, but did keep glacier ice from being exposed. By October 3, the glacier was down to 32% snowcover The results was a positive mass balance of -0.96 m. This is in sharp contrast to the 2021-2025 mean balance of -2.4 m/year.

On September 25th, the melt season ended with a two day snow storm blanketing the glaciers. Jill had been on Mount Shuksan the previous day. The lack of melt in September resulted in reduced mass losses from the previous three years at -1.5 m, vs over 2 m the in 2023-2025.
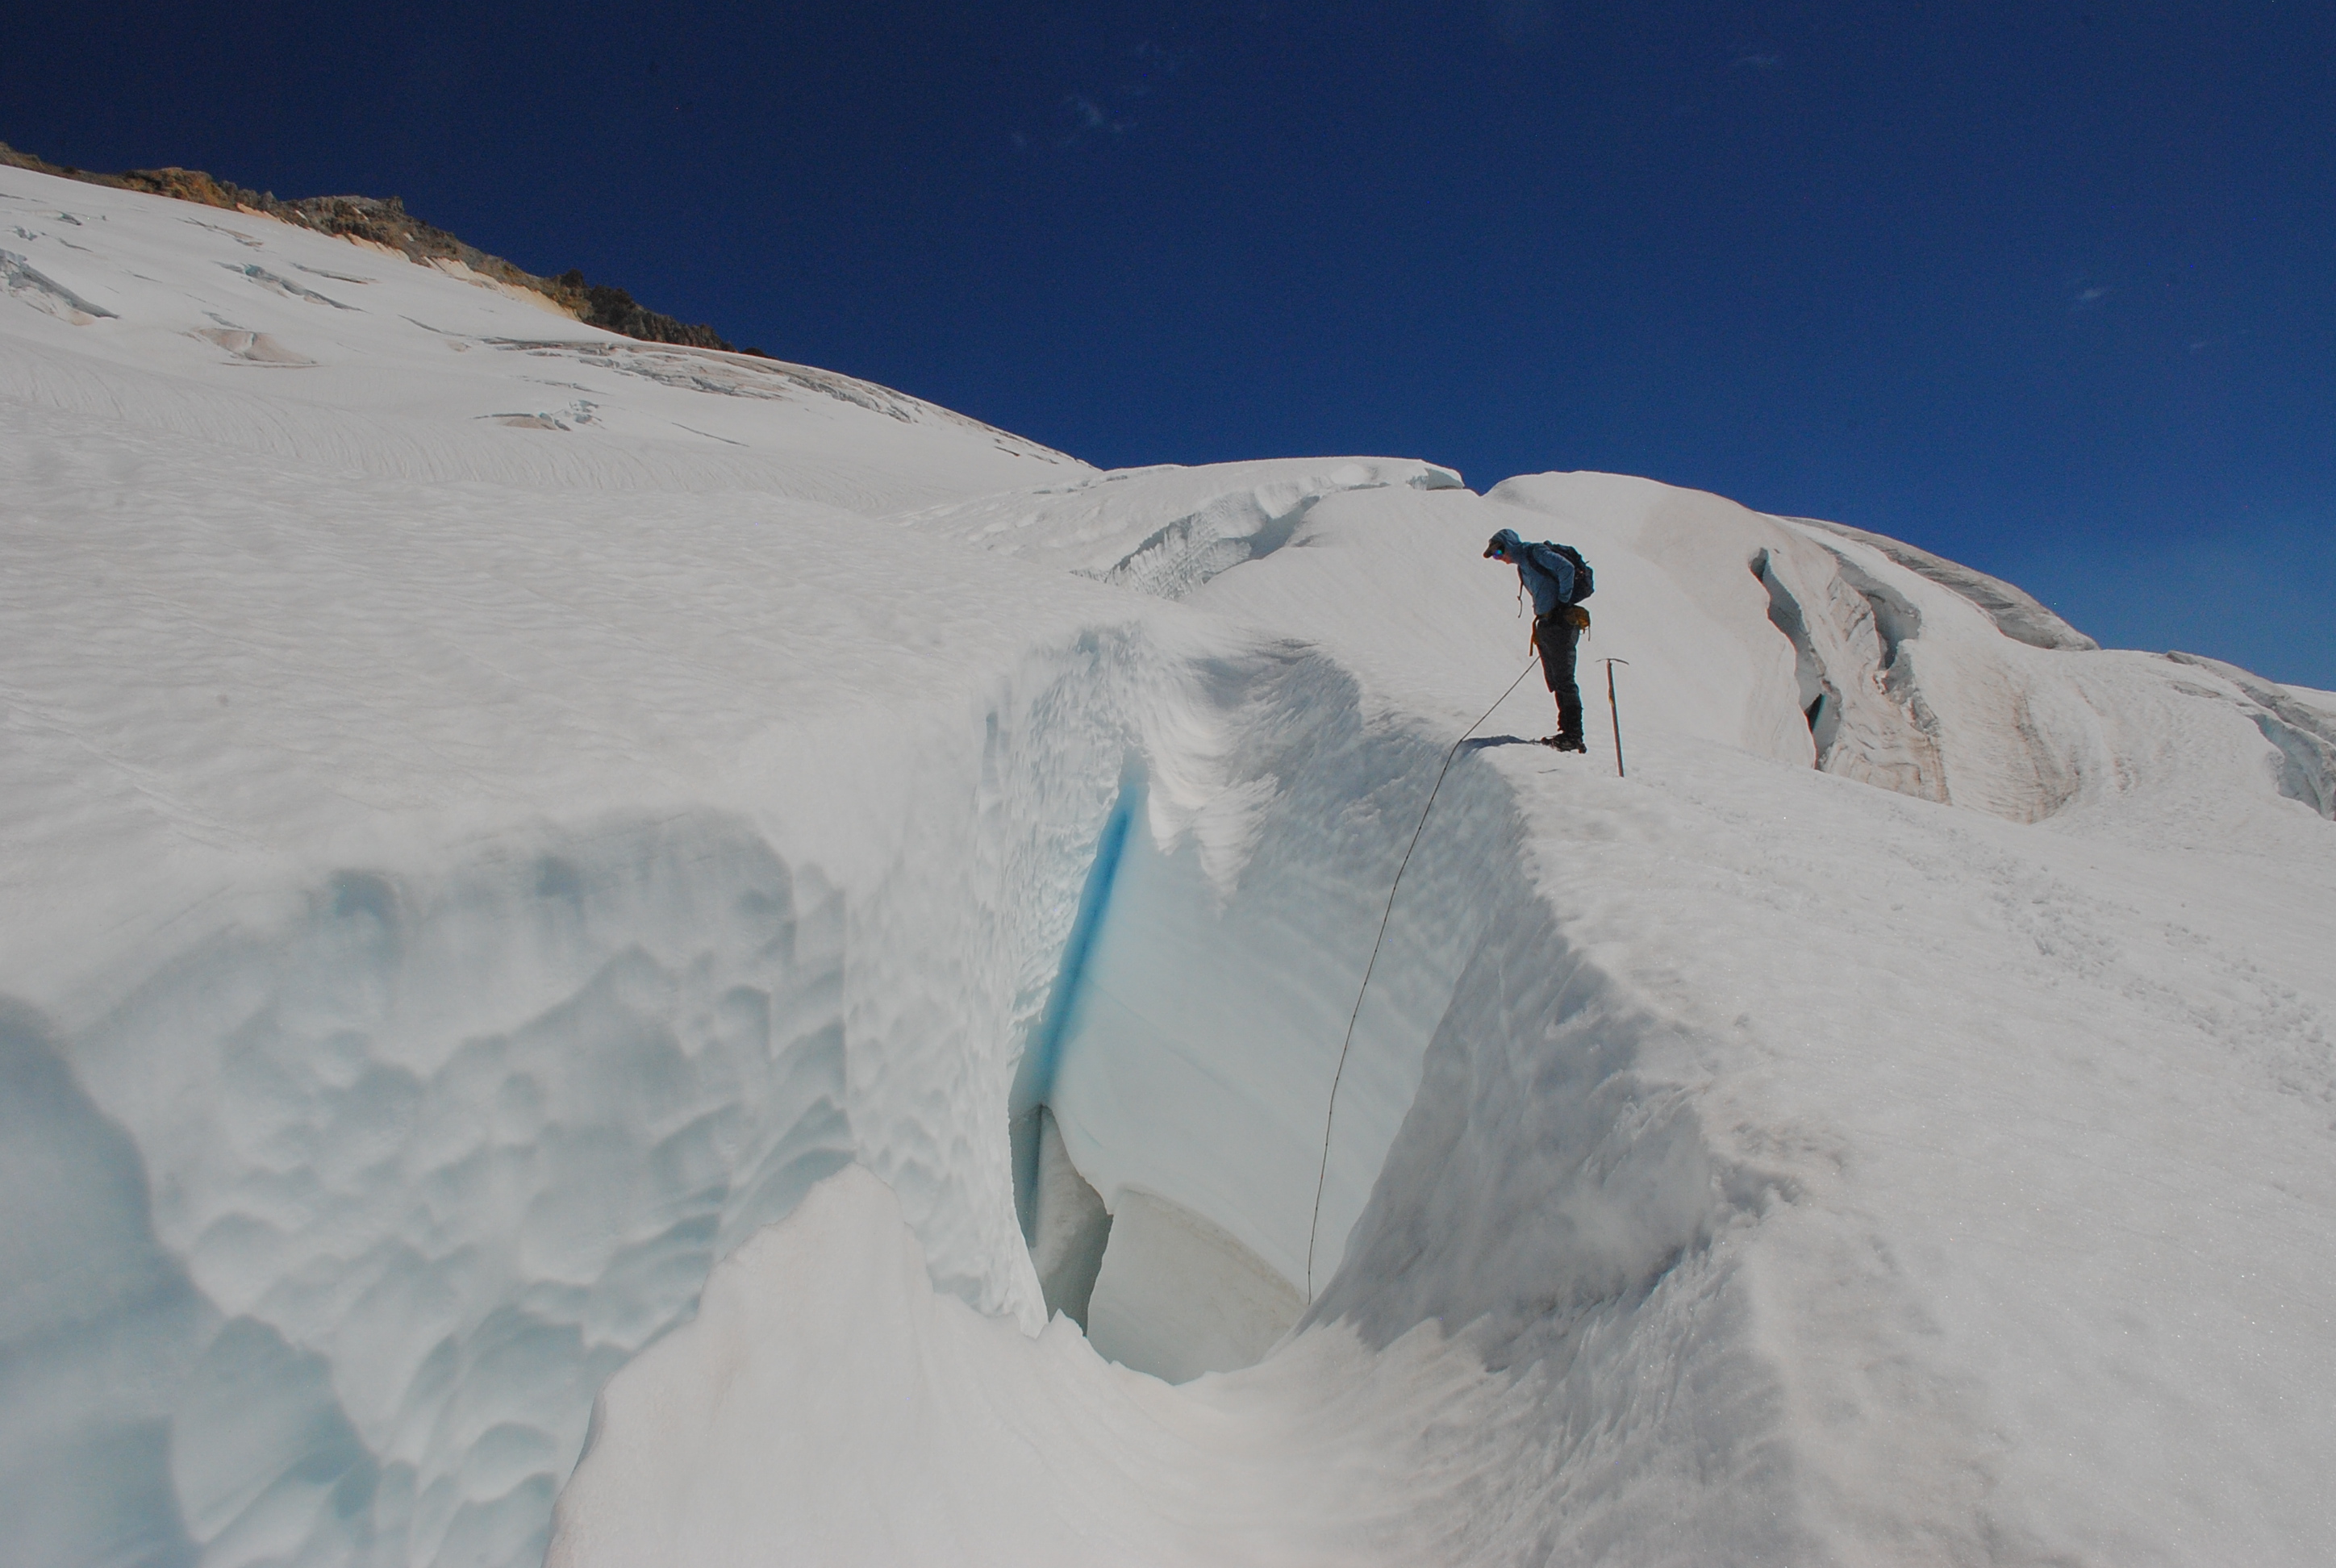
Snowpack depth of 3.75 m at 2600 m on Easton Glacier.

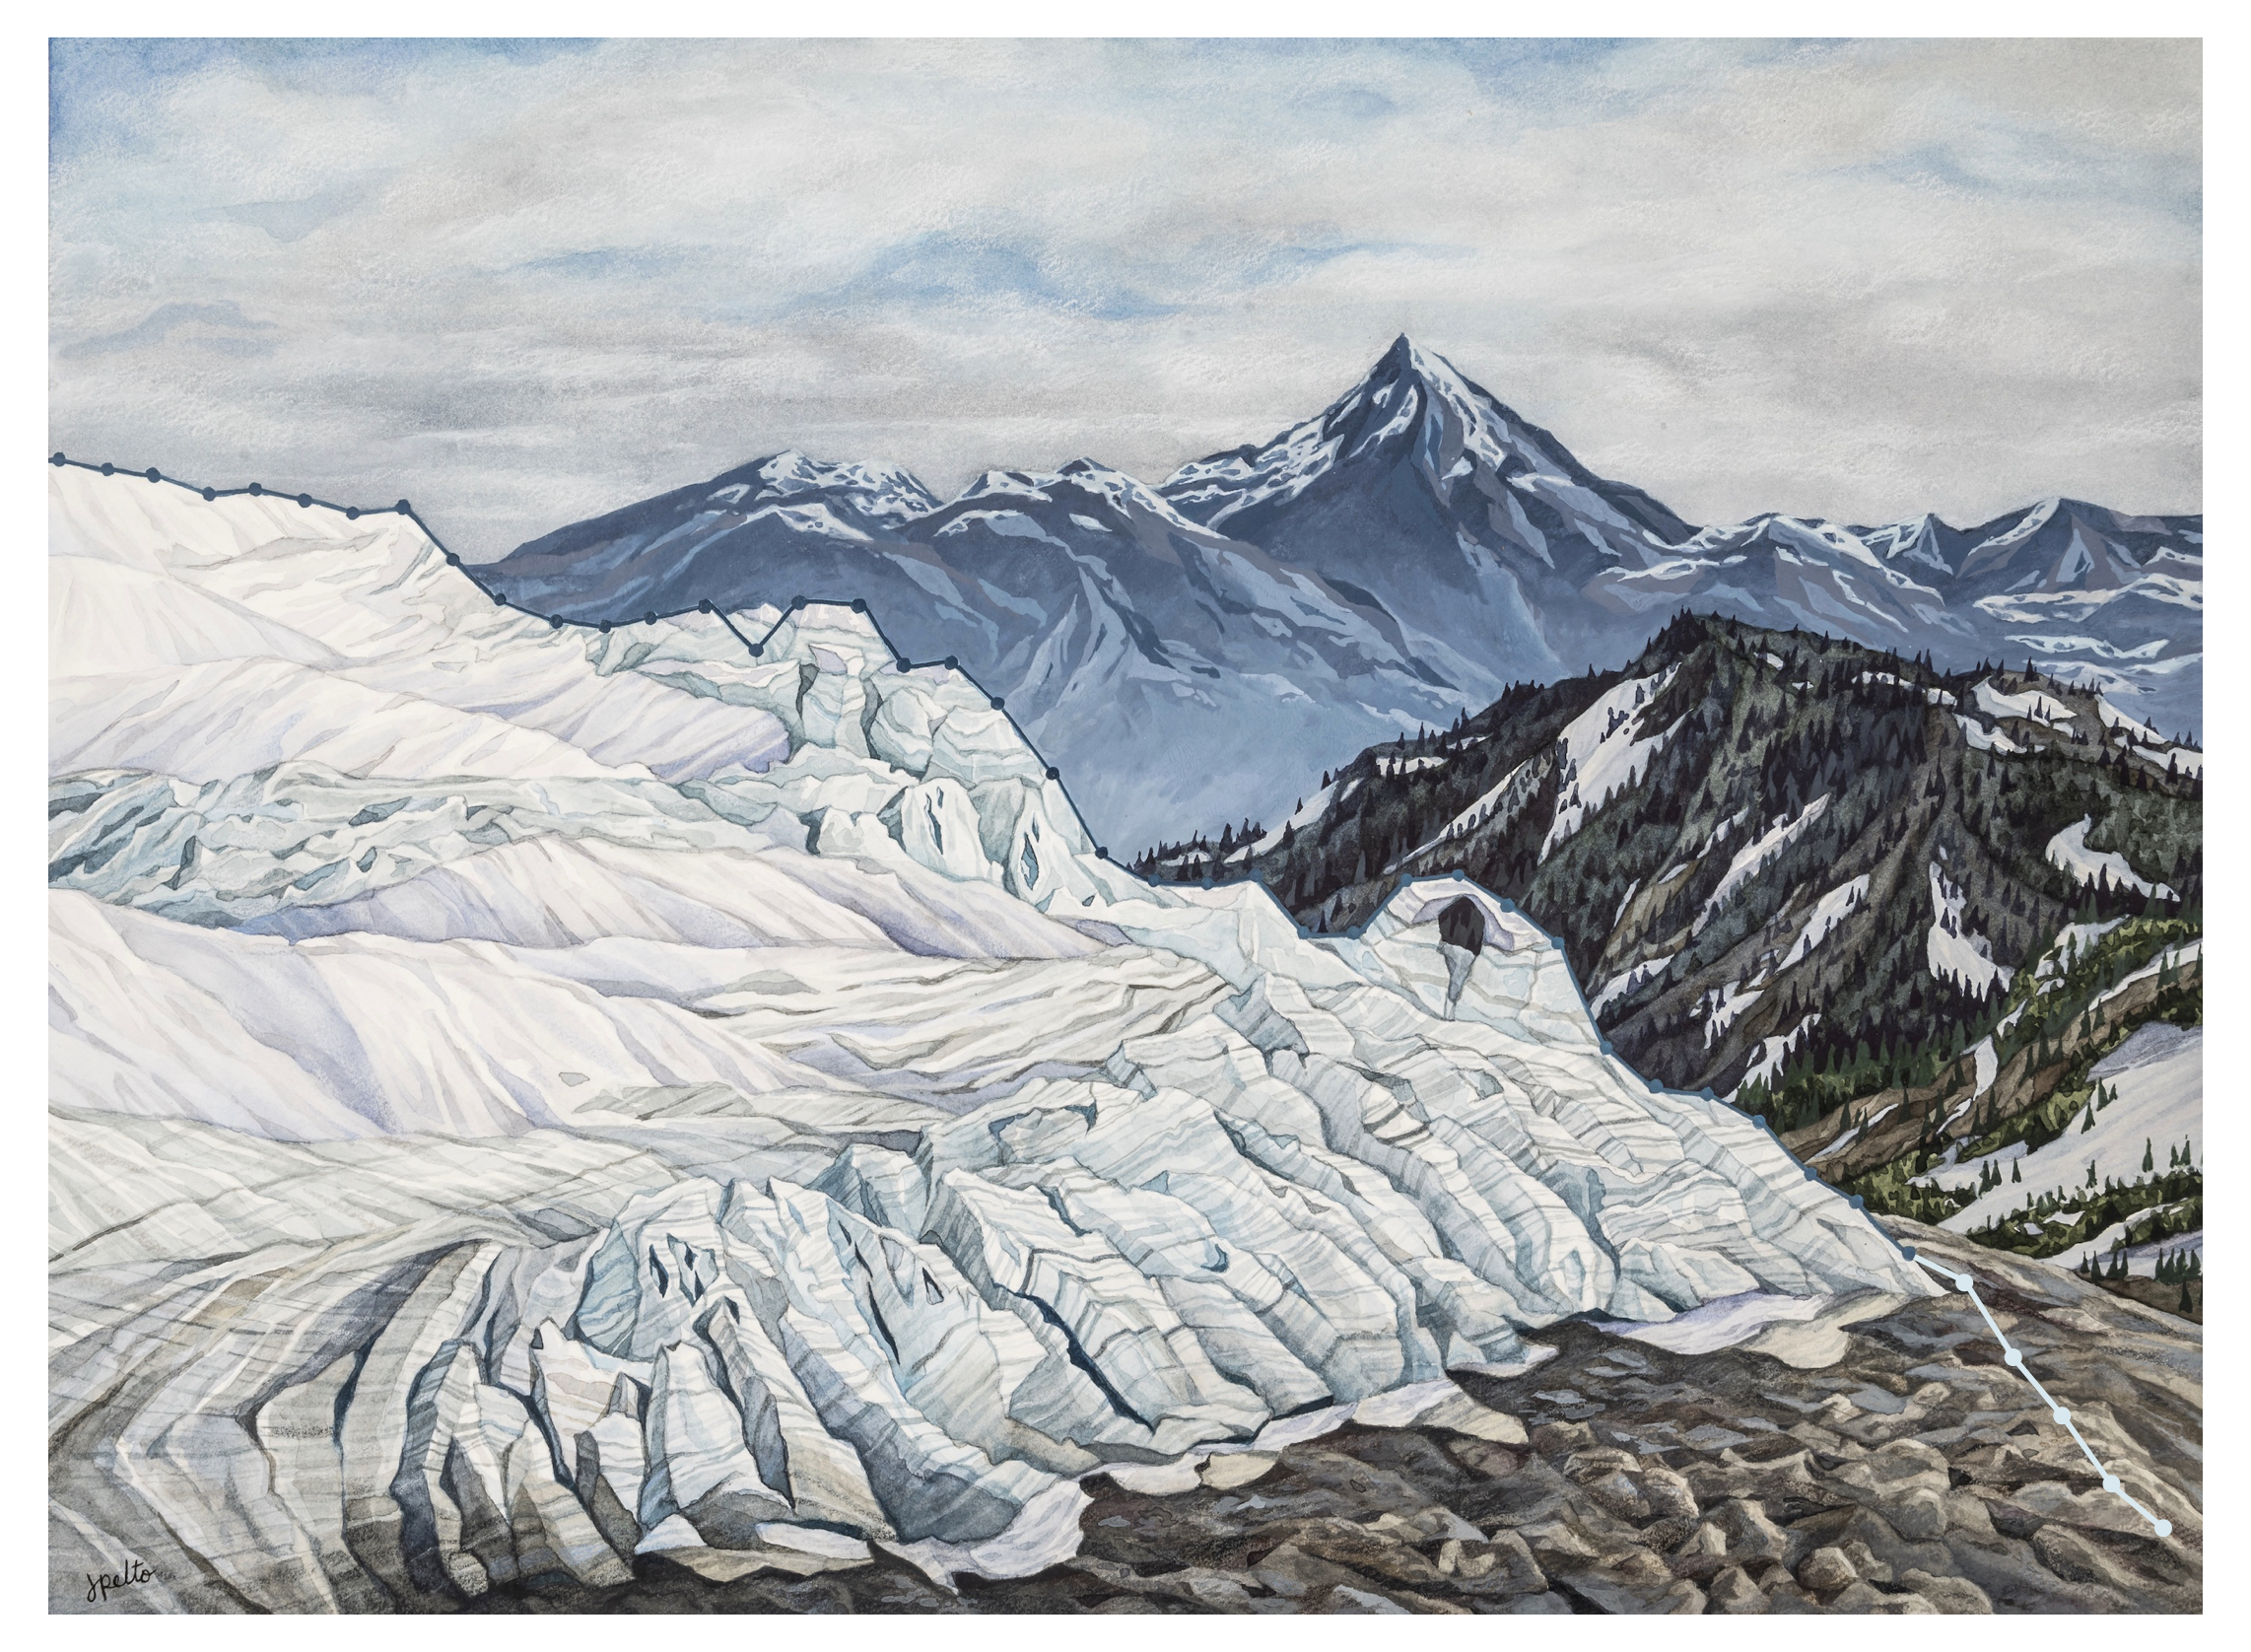
40 Years in the North Cascades by Jill Pelto. This piece captures the Mass Balance data of the North Cascade glaciers as whole as collected by our project from 1984-2022. Jill digitally updated the graph line in her painting to include 2023-2026, as seen by the pale line that extends beyond the ice.
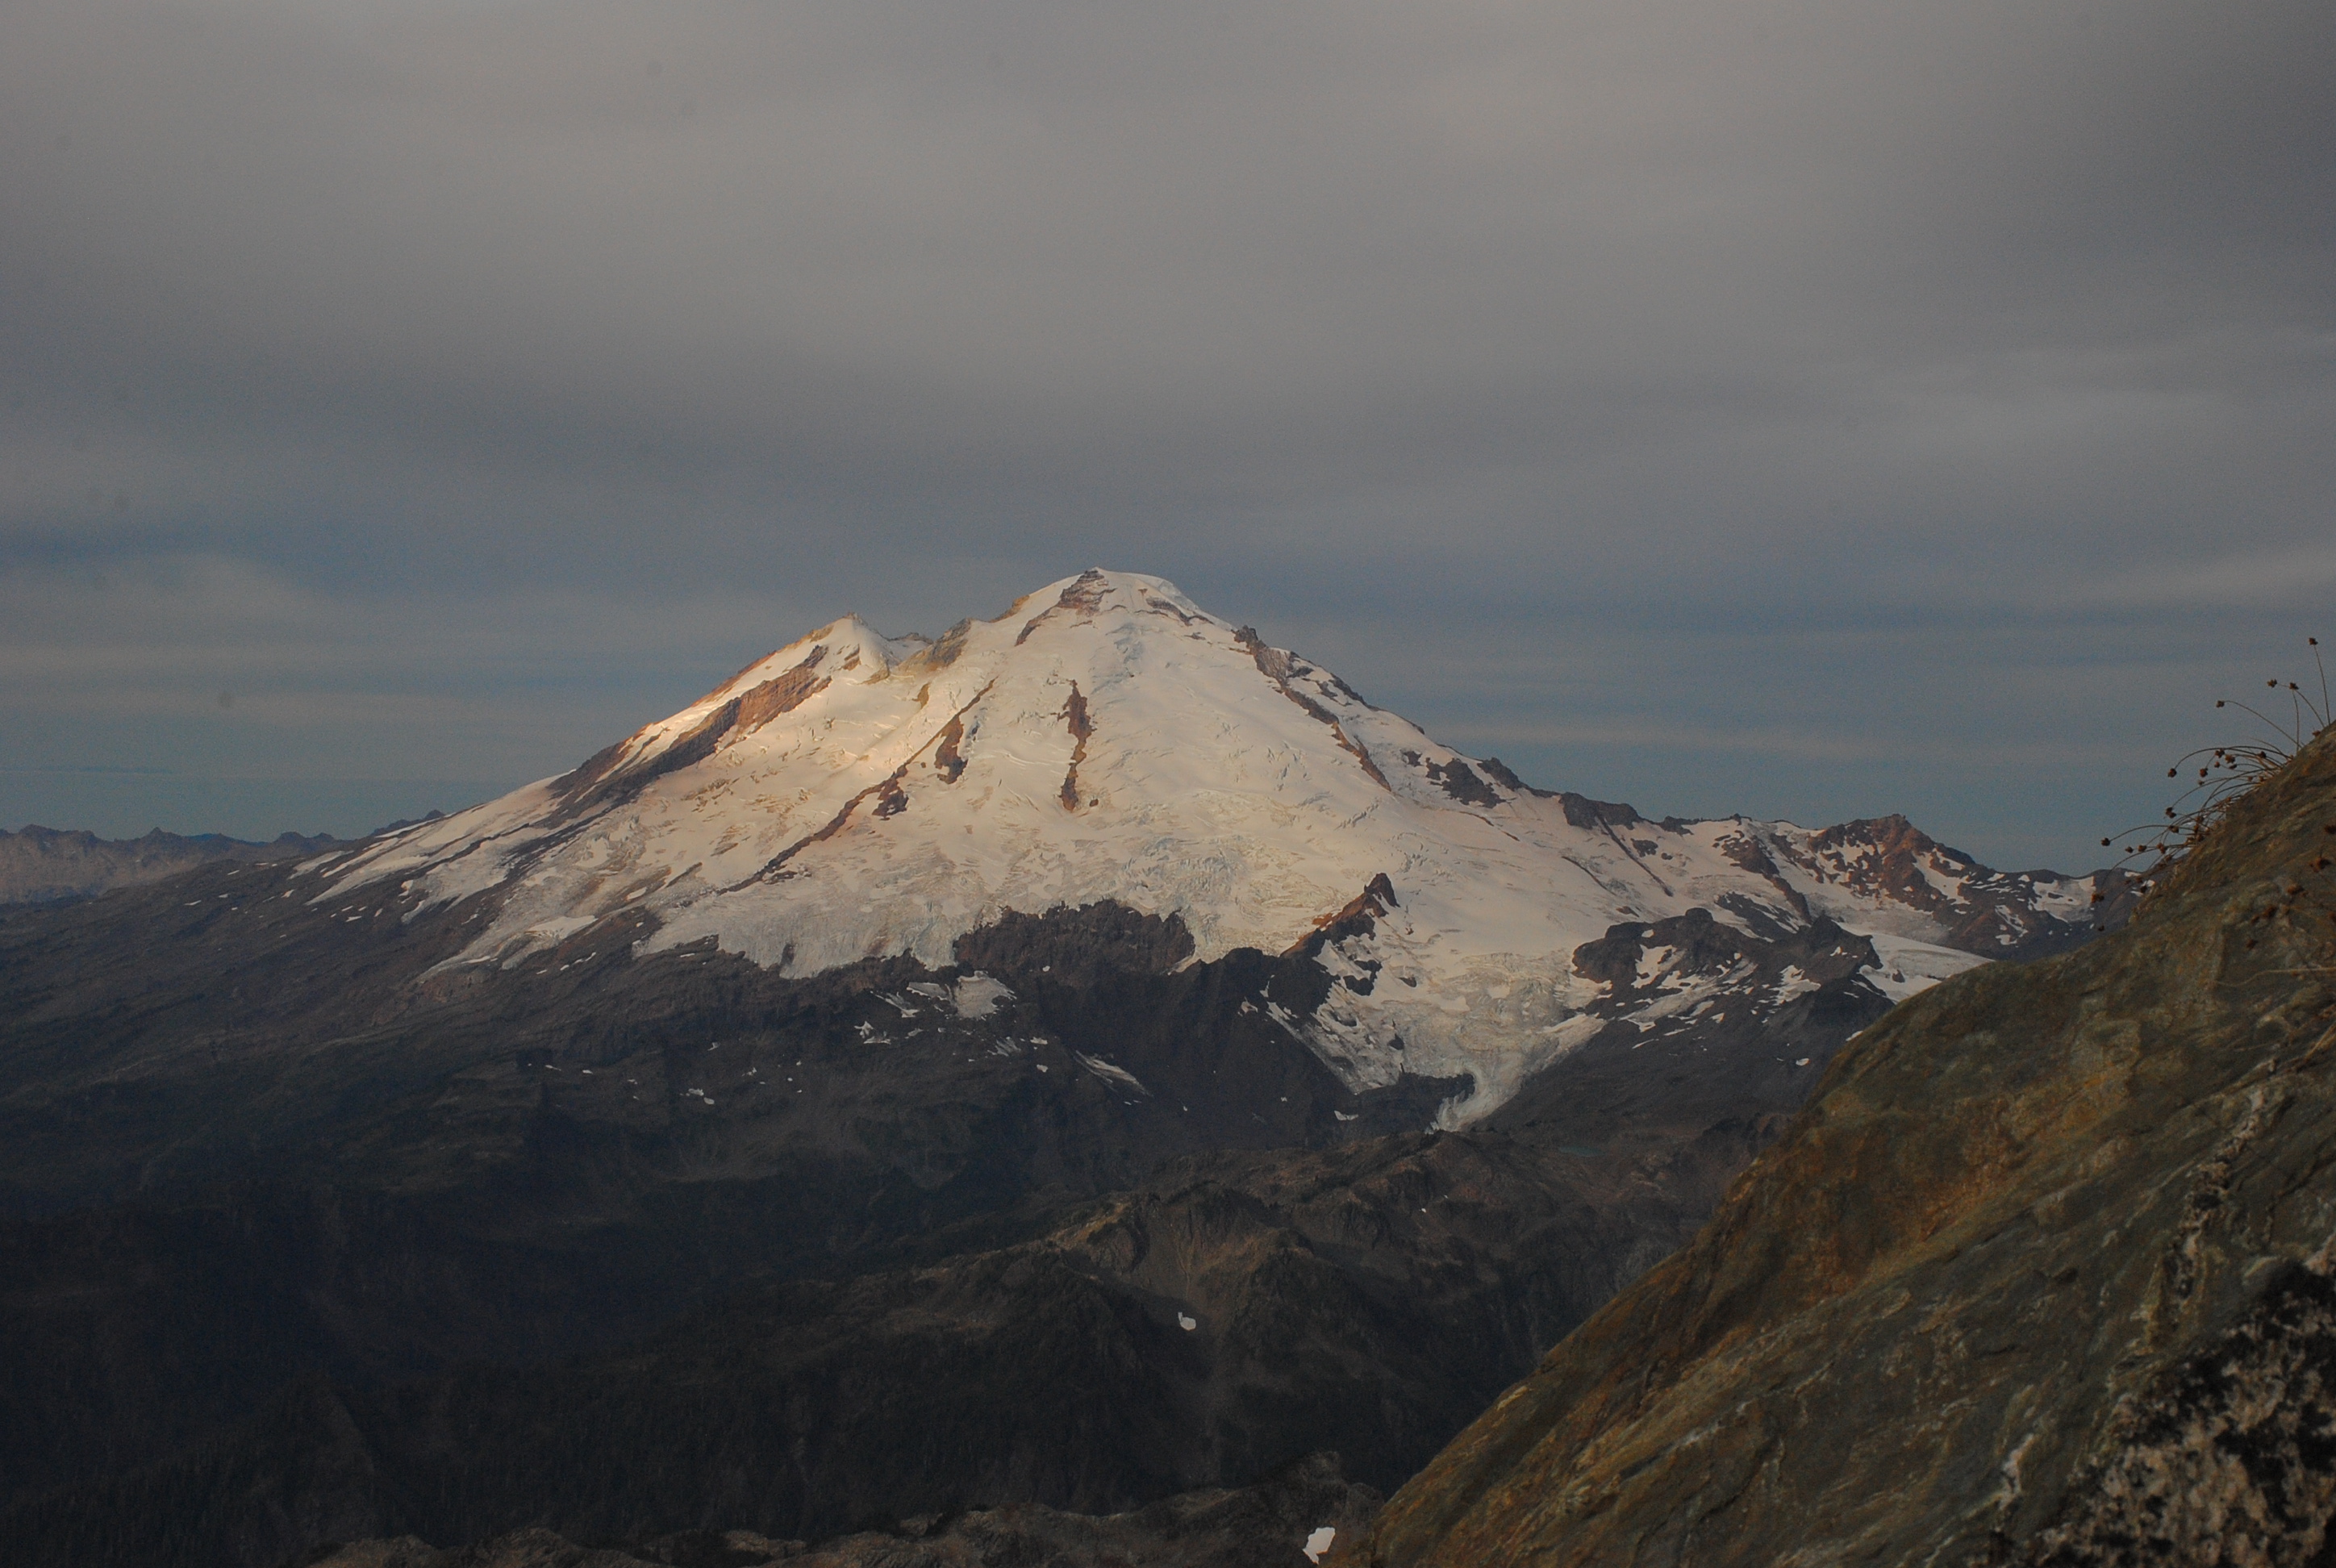
Mt. Baker at the end of the melt season, on September 24, 2026. Photo taken by Jill Pelto from the summit pyramid of Mt. Shuksan

North Cascade Glacier Climate Project 2025 Field Season Summary: Year 42

Core field team in 2025 Emmett Elsom, Mauri Pelto, Jill Pelto and Caitlin Quirk.

We hiked into North Cascade glacier to complete detailed observations for our 42nd consecutive year. These annual observations provide a detailed assessment of their response to climate change. For the third consecutive year North Cascade glacier on on average lost more than 2 m of glacier thickness. This cumulative loss of 7-8 m on most of the ranges glaciers that average 25-40 m in thickness represents 20% of their volume lost in just three years. On a few of the largest glaciers, such as those on Mount Baker that average 40-60 m in thickness the loss represents 12% of their volume lost.

The consequence is an acceleration of the collapse of the North Cascade glacier system. This landscape that has for long been shaped by ice is rapidly losing that glacier element. The rate of retreat for the glaciers we work on has accelerated so quickly that we are faced each year with changing terrain and new challenges. Beyond that, we are starting to really see the effect this retreat and the decrease in water has on the ecosystems both near the glaciers and further downstream. During the field season we love seeing the wildflowers, eating blueberries, and counting mountain goats. These are all parts of a habitat that is built around glaciers and snowpack. Seeing these shifts has been really difficult, but it helps to still return to these landscapes and continue to tell their stories through science and art. Below the story is told in images with captions by each of us who participated.

Two things that stood out during the 2025 field season were the strength of our collaborations, and the changing resources the glaciers are able to provide to the surrounding ecosystem. This visible change attracted the attention of KING5-Seattle NBC affiliate and CBS Morning News. At the bottom of this post the resulting footage is embedded. The film “Shaped By Ice” Jill and I worked on with Dan McComb has been a finalist in two recent film festivals, this footage also at bottom of this long read post.

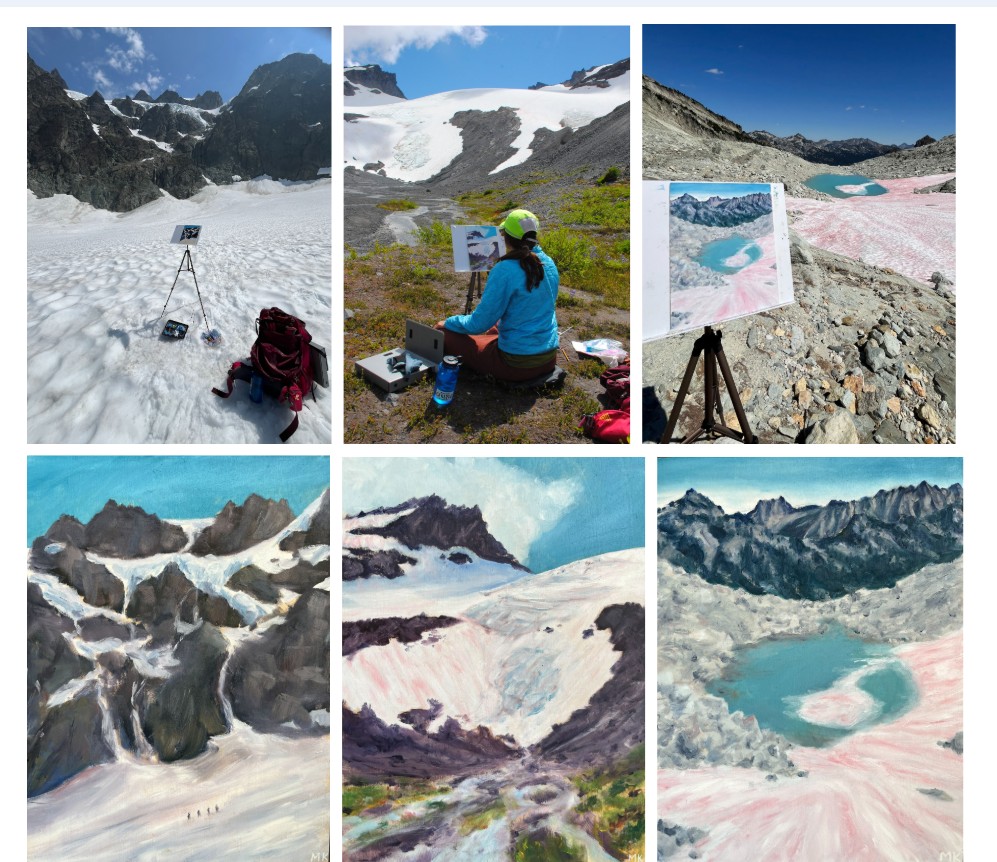
Working on Rainbow Glacier from left-Katie Hovind, Caitlin Quirk, Claire Seaman, Jill Pelto and Margaret Kingston

We worked with two oil painters, one watercolor painter, one printmaker, two news film crews, a team of botanists, and more. The result of all these collaborations has led to so many great stories being created and shared about our collective work. It also meant our core group of field assistants had to be flexible to a changing group and the sometimes difficult and imperfect logistics that accompany that. -Jill Pelto

This photograph of an icefall at 2000 m (6700 ft) on the Easton glacier encompasses the wide range of emotions that I felt working on these glaciers this summer. The focal point of the picture is the wound inflicted upon the glacier by our changing climate. Bedrock and sediment creep through the gaping wound in the lowest icefall of the Easton, the opening visible for the first time in the project’s 42-year history. The place also holds a beauty, a sense of majesty that cannot be diminished by the tragic context of our work. The seracs at the top of the scene lean at impossible angles, destined to crash down onto the slope below, piercing the quiet of the snowy expanse in dramatic fashion. The dark annual layers in the glacier speak to the age of the ice, flowing down the flank of Mt. Baker over decades. The landscape has been a facet of my life for the past few years, as it falls upon the Easton Glacier route to the mountain’s summit. The icefall has always drawn me in as I pass, sparking a profound sense of wonder. It makes me deeply sad to see the beauty of such special places diminished, sad in a way that little else does. Over the past few years, I’ve come to like visiting these places to visiting an elderly loved one. While time may change them and even take them away from us, their beauty and meaning to me will hold true.-Emmett Elsom

How does being present in a place shape our understanding? To the left is a view of Sholes Glacier, complete with my on-site rendition. I can’t express how lucky I feel to have had the chance to experience these places first hand. To interact with a place by attempting to capture its likeness — paying attention to the negative space not only between the white snowpack and black exposed rock, but in the empty, carved-out area that used to be filled with ice. Experiencing the texture of the glacier under your feet, the cool air drifting off the snow, the good tired feeling of your body after physically traversing top to bottom. This is what you don’t get from a photo. To know places such as these is to love them and see their role in the world, and want to protect them. But so many never get the chance to understand them this way.-Claire Seaman

This field season I focused on exploring the once-barren foreland a glacier leaves behind. Studying the plants growing in the wake of the Easton Glacier made me reflect on the way life responds to these major changes. This photo of a bright monkeyflower cluster in the streambed of the nearby Sholes Glacier exemplifies this resilience and optimism to me. The Sholes, in the background, drains a lifeblood that will feed the watershed downstream into the Nooksack, supporting people, fisheries, and a whole riparian ecosystem. The eventual loss of glacial ice feeding the river will be catastrophic, yet the scarred space left behind will blossom with vegetation. Witnessing firsthand how staggering the extent of glacial retreat is can be overwhelming, but that bright patch of flowers stands as encouragement. Alone in an altered landscape, those flowers will pave the way for more to follow. Change is nuanced, and as we watch it occur we can change, sharing stories of the beauty of this environment supported by ice, and adapting our lives and policies in a way that can be the difference which keeps glaciers flowing.-Katie Hovind

As a backcountry skier and oil painter focused on winter landscapes of the North Cascades, the idea of painting glaciers in the field was a dream come true! I knew what we would see and learn about the health of our glaciers from the scientists would be highly emotional, but the power of these environments disappearing in our lifetimes is something my words fail to communicate how devastating that feels. During the study on Rainbow glacier I caught on film the moment a serac collapsed, loudly crashing, crumbling from a newly melted out rock knob down the mountain splitting into smaller and smaller pieces. It looked sickly as it broke before our eyes. Another unique experience was going into a teal, translucent, otherworldly ice cave. I have started 2 paintings to capture this vanishing environment. My goal is to assist the project in translating the study’s findings through landscape paintings that communicate the beauty of these places with titles that call attention to the retreating glaciers in the North Cascades. We all have a responsibility as humans to make individual changes to combat climate change and vote like fresh water and air depends on it, because it does. -Margaret Kingston

The pace of glacier change struck me hard this summer. Never before have humans lived with such a deglaciated Cascades mountain range. Not the settlers, not the fur trappers, not the first people who have been here for 13,000 years or more. Cultures and ecosystems spawned from the retreating edge of the Cordilleran Ice sheet into the Puget Sound area. Alpine glaciers fed streams, rivers, salmon, all kinds of human projects in Washington State. Our societies are shaped by the ice and now we are experiencing glaciers disappear.

I write this at the end of the 2025 hydrological year, waiting for winter snow to shelter the land I love in a cool white blanket. The devastation of the alpine glaciers has surfaced so frequently in conversation these last couple months. Those who have seen the mountains are alarmed as beds of ice they once knew to be hundreds of feet thick look shallow and frail, ice pitches that were once climbed are now grey gullies of rock, and volcanoes which have always been white are unnervingly gray and shrouded in smoke. The realities of climate change in the Northwest are clear.

It is a painful time to care about the glaciers of the Cascades. Witnessing the erosion of something so much older and bigger and impactful than myself is staggering. There is much action to be done in this new terrain but for now, I come back to this: I sit in the dying glaciers warm light as the sun rises, summon the deepest snowfall in years and tell the glacier that we care, that we were grateful for all the help watering our food and feeding our oceans and making sure our salmon had somewhere to live. We are here because of you. 
-Cal Waichler
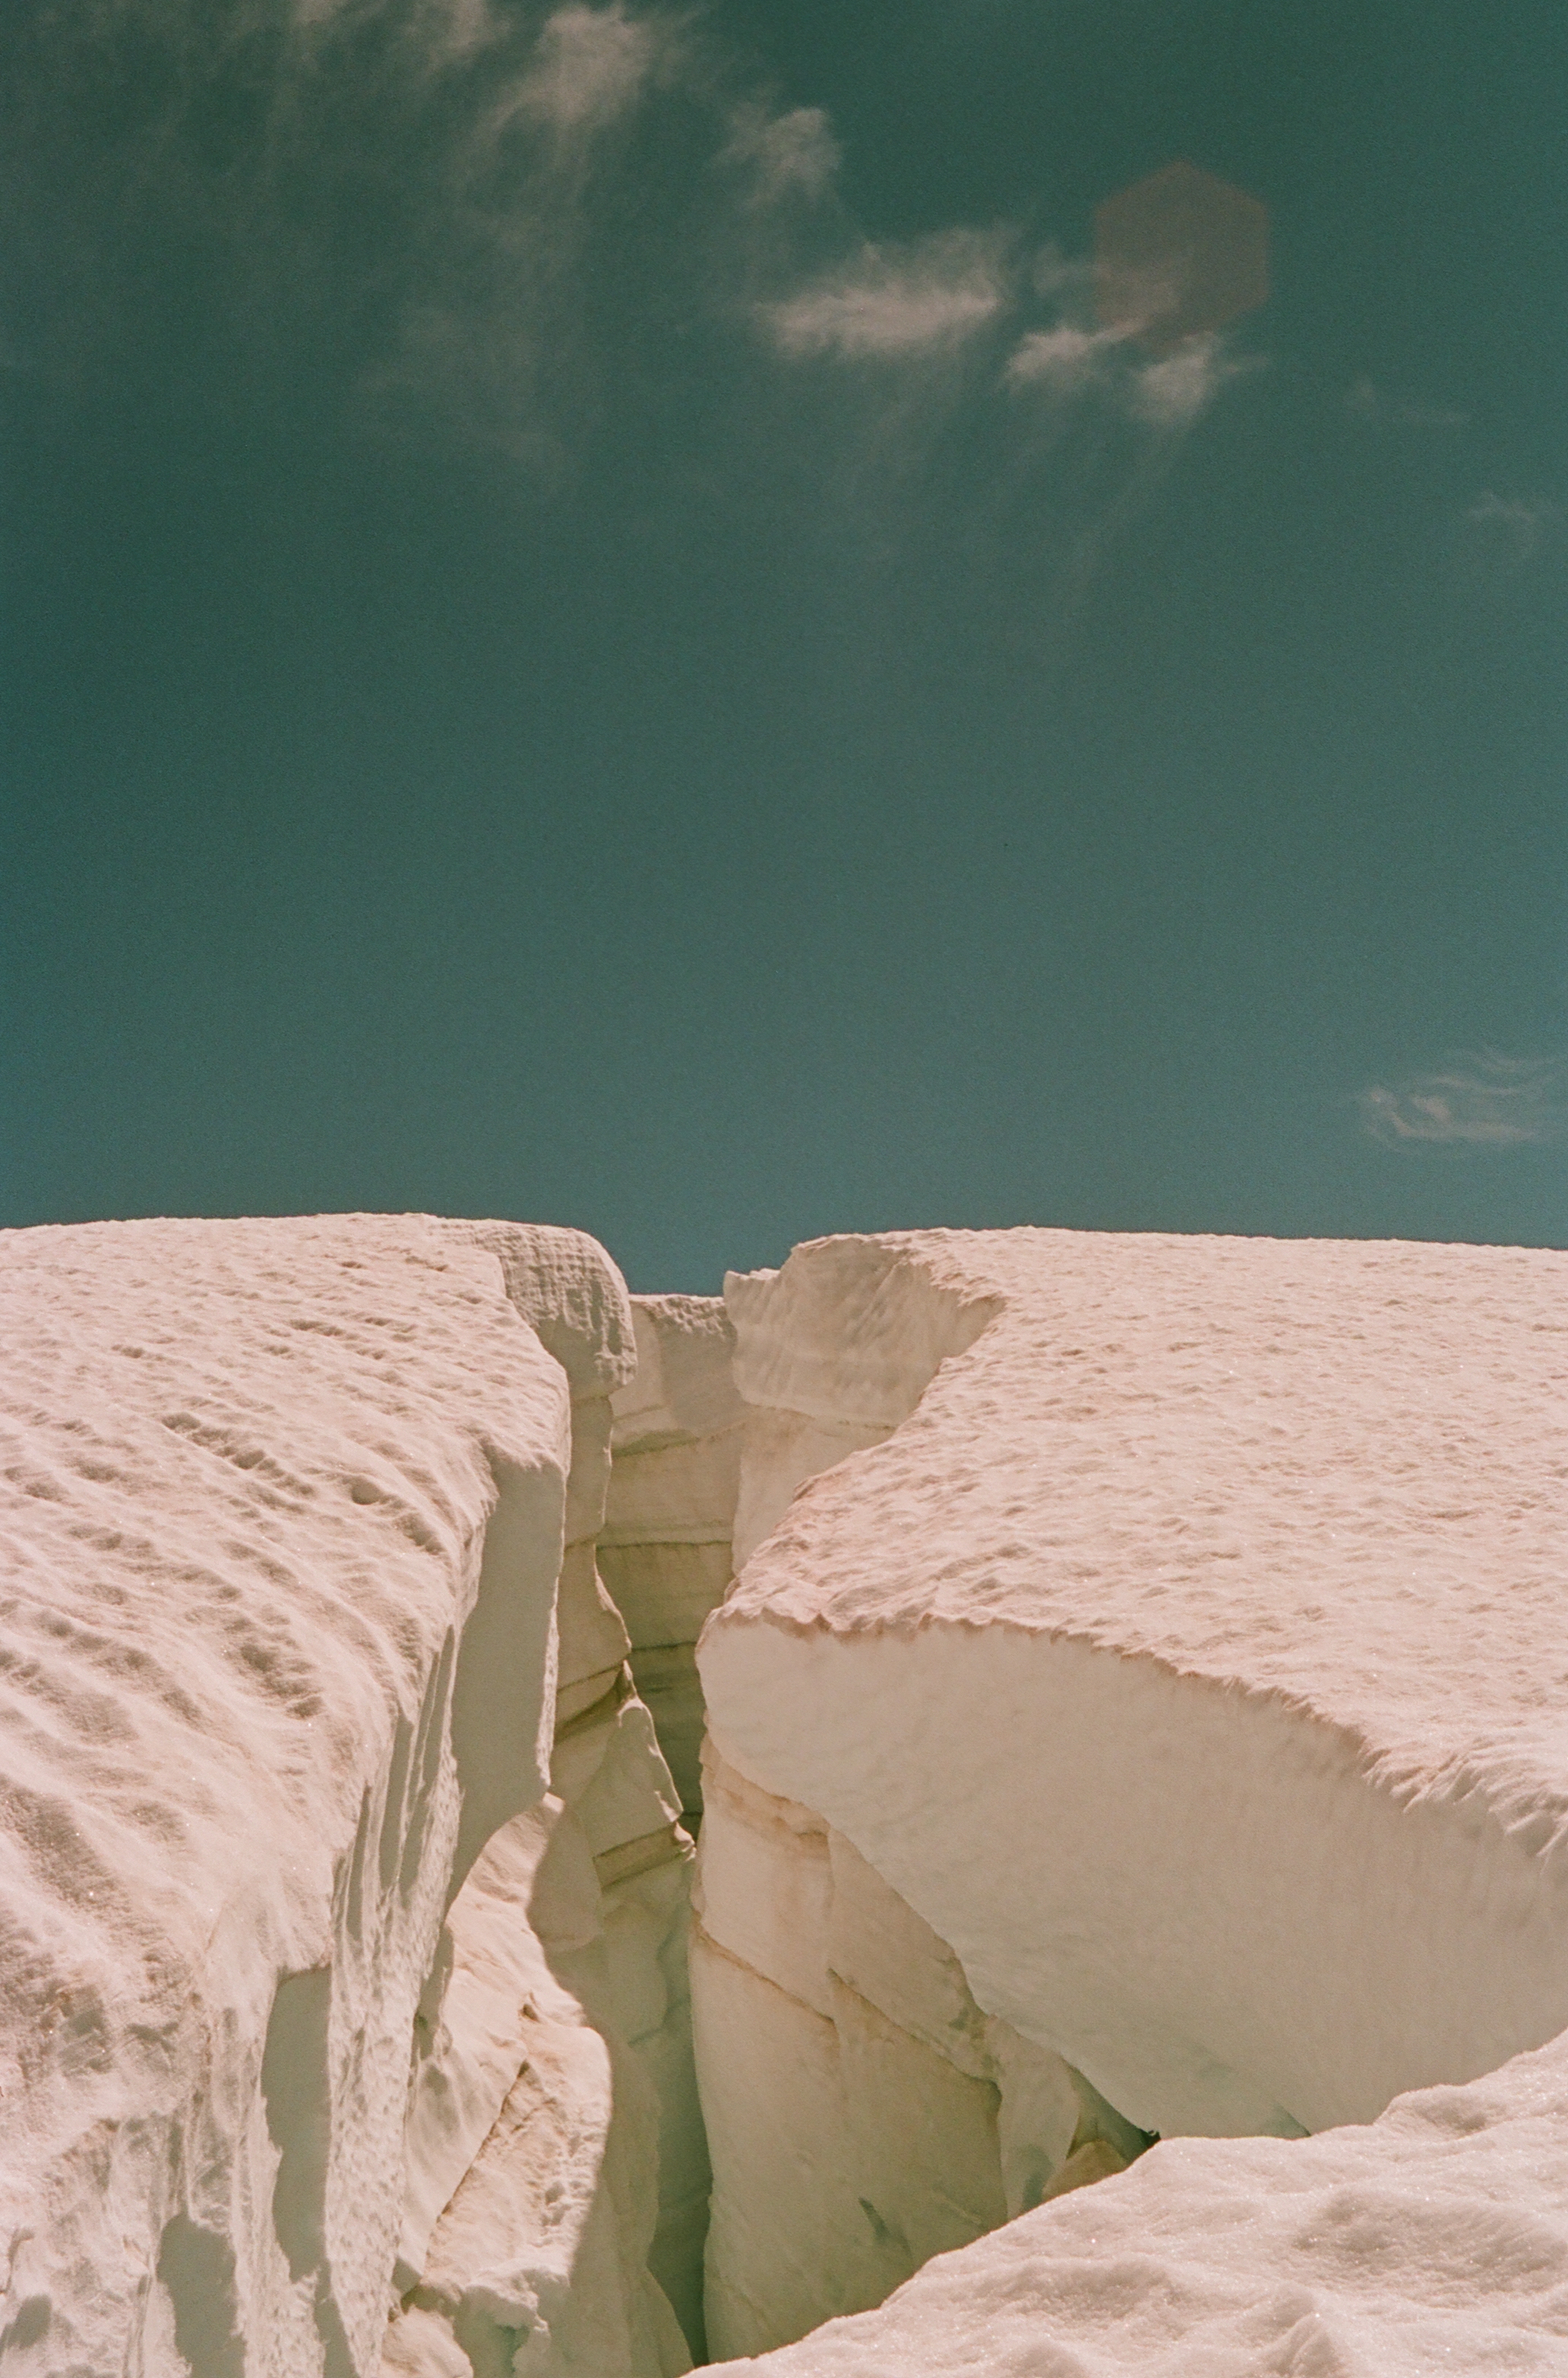
Image description: This image shows a crevasse on the Easton Glacier of Mount Baker. The saturation is distorted because I shot this photo on 35mm and pre-exposed the film to light and heat to parallel the material effects of global warming on our glacier systems. The Easton glacier is a source of water for Baker Lake, which provides recreation and hydropower to the region. When I see this photo, I think of the impacts of glacial melt to water, energy, cultural, and economic resources in Washington. -Caitlin Quirk
Columbia Glacier is one of sixty global reference glaciers. This summer it lost 5% of its volume.
Lower Curtis Glacier continues to rapidly thin at the top of the glacier as well as at the terminus. The glacier retained additional avalanche accumulation, leading to a less negative balance than other glaciers.
Rainbow Glacier is one of the sixty global reference glaciers. This year new bedrock began to emerge and expand in several icefalls, leading to serac fall.
Easton Glacier has retreated 700 m since 1990 and has a number of bedrock areas emerging in icefall up to 2500 m.
Lynch Glacier east and west side are separating. The upper basin did retain some snow in 2025.
Daniels Glacier lost all snowpack by the end of the summer and bedrock is quickly expanding amongst the glacier.

The trajectory for most North Cascade glaciers is one of fragmentation. This is illustrated by Foss Glacier on the east flank of Mount Hinman, that we began observing annually in 1984 but stopped measuring as it fragmented. Foss Glacier from the top was a 1 km long and nearly 600 m wide glacier. In Sept. 2025 Cal Waichler captured view from the top with the two main fragments now less than 50 m wide and 300 m long.-Mauri Pelto

Leah Pezzetti KING5 meterologist hiked in with us to Lower Curtis Glacier.

The CBS team hiked into Sholes Glacier with us spending the night, and we had three generations of Pelto’s.

Mount Everest Region Snow Line Winter 2024: Rises Above and Remains Above 6000 m

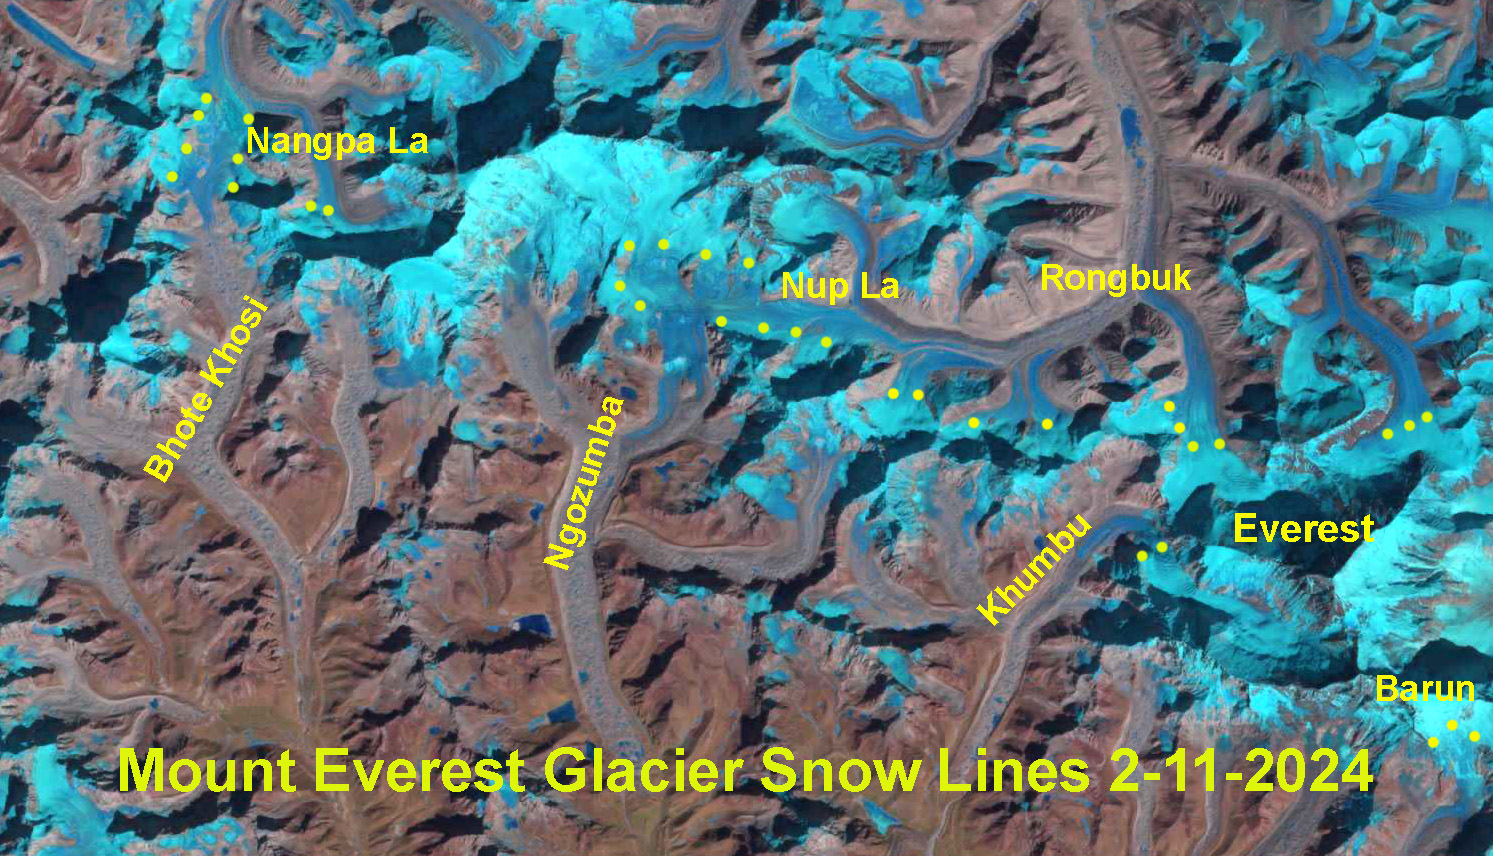
The snow line on Mount Everest Region glaciers on Feb. 11, 2024 indicated by yellow dots on the Landsat image. Note that Nangpa La and Nup La-two high passes (5800-5900 m) are both snow free. The average snow line is 6000 m.

The snow line on Mount Everest Region glaciers on Oct. 30, 2023 indicated by yellow dots on the Landsat image. Note that Nangpa La and Nup La-two high passes are both snow covered. The average snow line is 5700 m.
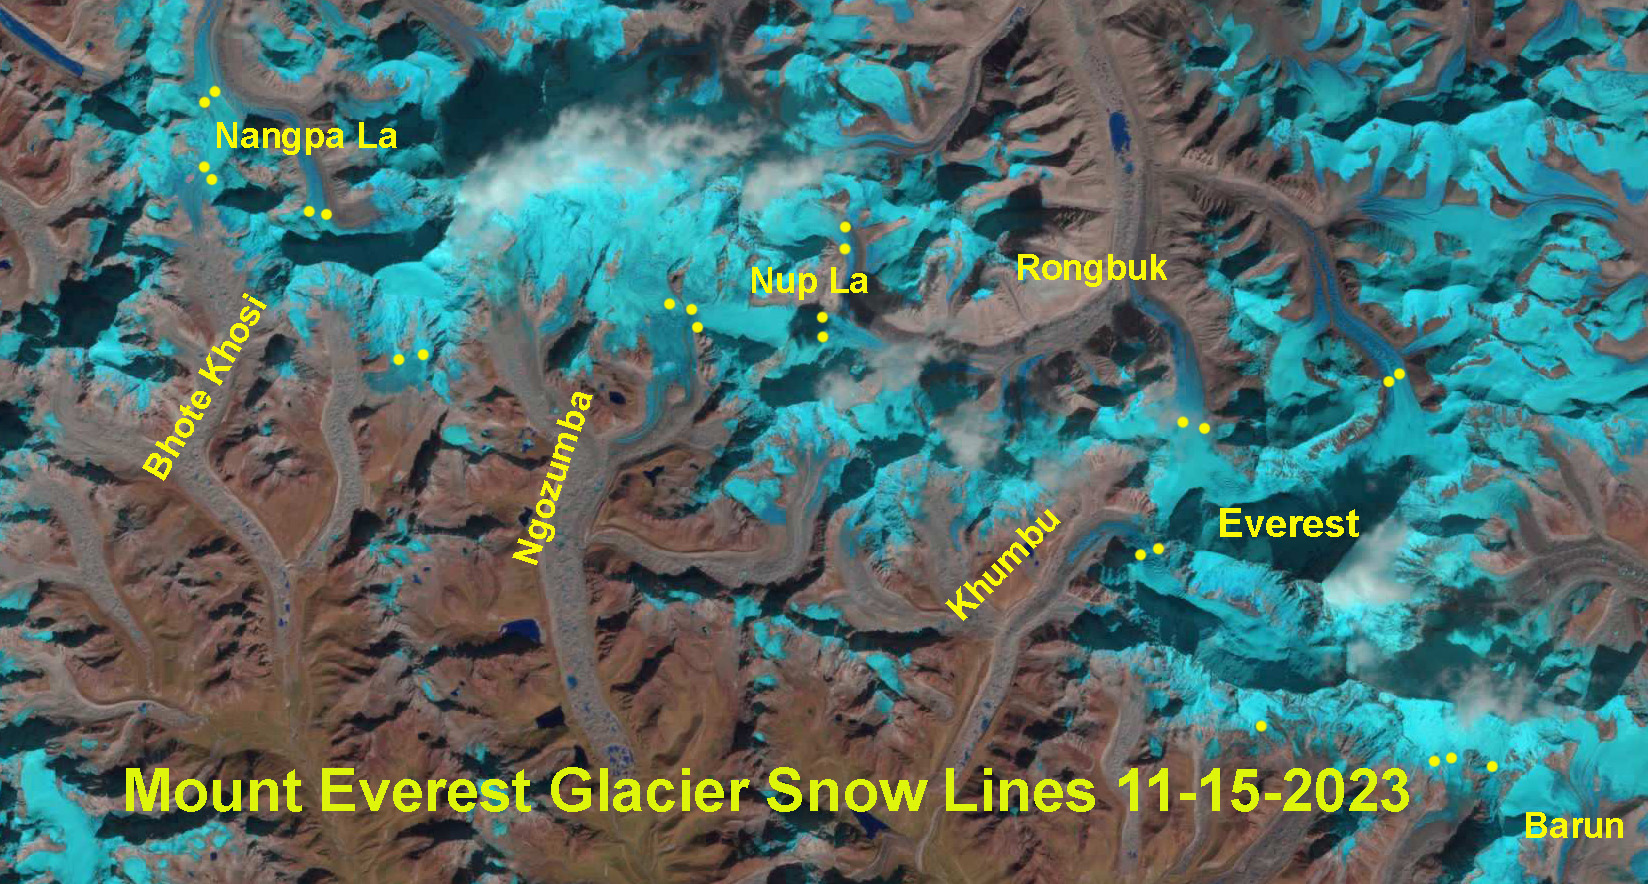
The snow line on Mount Everest Region glaciers on Nov. 15, 2023 indicated by yellow dots on the Landsat image. Note that Nangpa La and Nup La-two high passes are both snow covered. The average snow line is 5800 m.
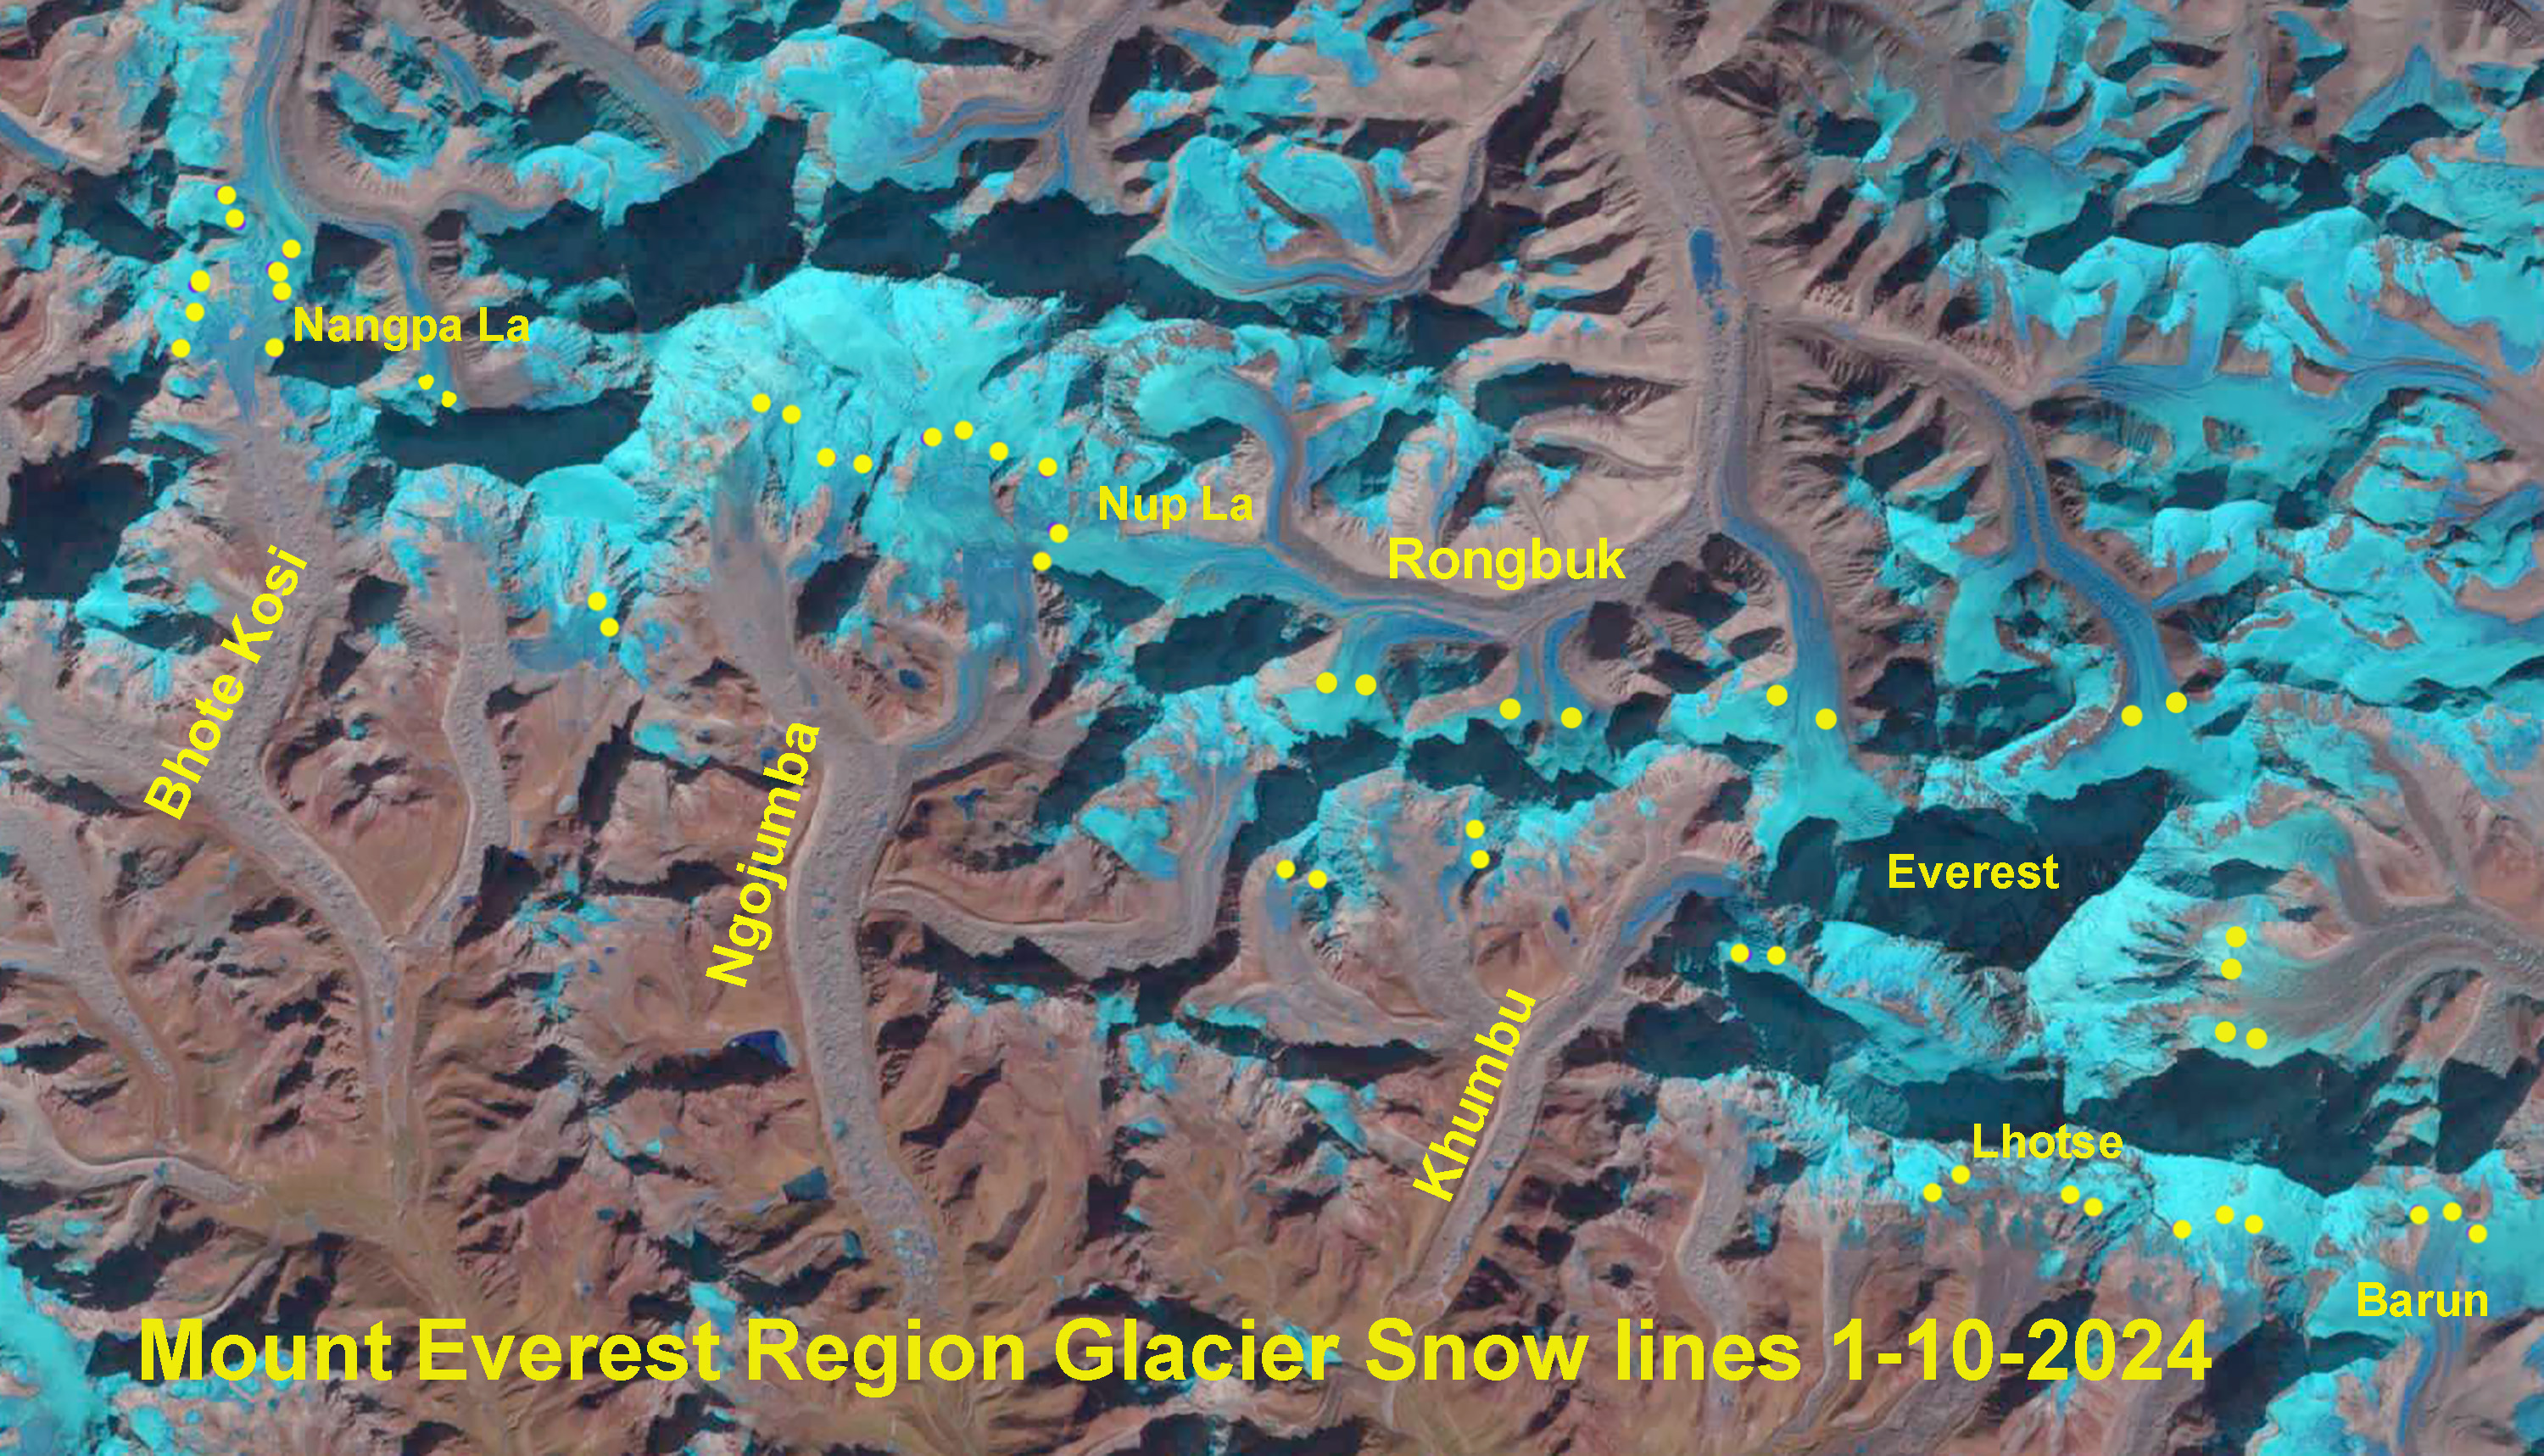
The snow line on Mount Everest Region glaciers on Jan. 10, 2024 indicated by yellow dots on the Landsat image. Note that Nangpa La and Nup La-two high passes are both snow free. The average snow line is 5950 m.
Cumulative precipitation through the year at Everest Base Camp. The typical dry period begins in October and extends into Februrary, but this year is the lowest since the National Geographic Rolex Perpetual Planet weather station was installed.

In several recent years including Winter 2017/18, 2020/21 and 2023/24 the snow line has risen substantially on Mount Everest glaciers from October into the mid-winter period (Pelto et al 2022).. This indicates not just dry conditions, but conditions that allow significant ablation at the snow line, which has risen 150-300 m during each of these periods on the glaciers. The ablation can be from melting or as the case this winter sublimation, which can lead to losses up to 2.5mm/day (Tenzing Chogyal Sherpa et al 2023). When will snow finely cover the glaciers in the Everest region?