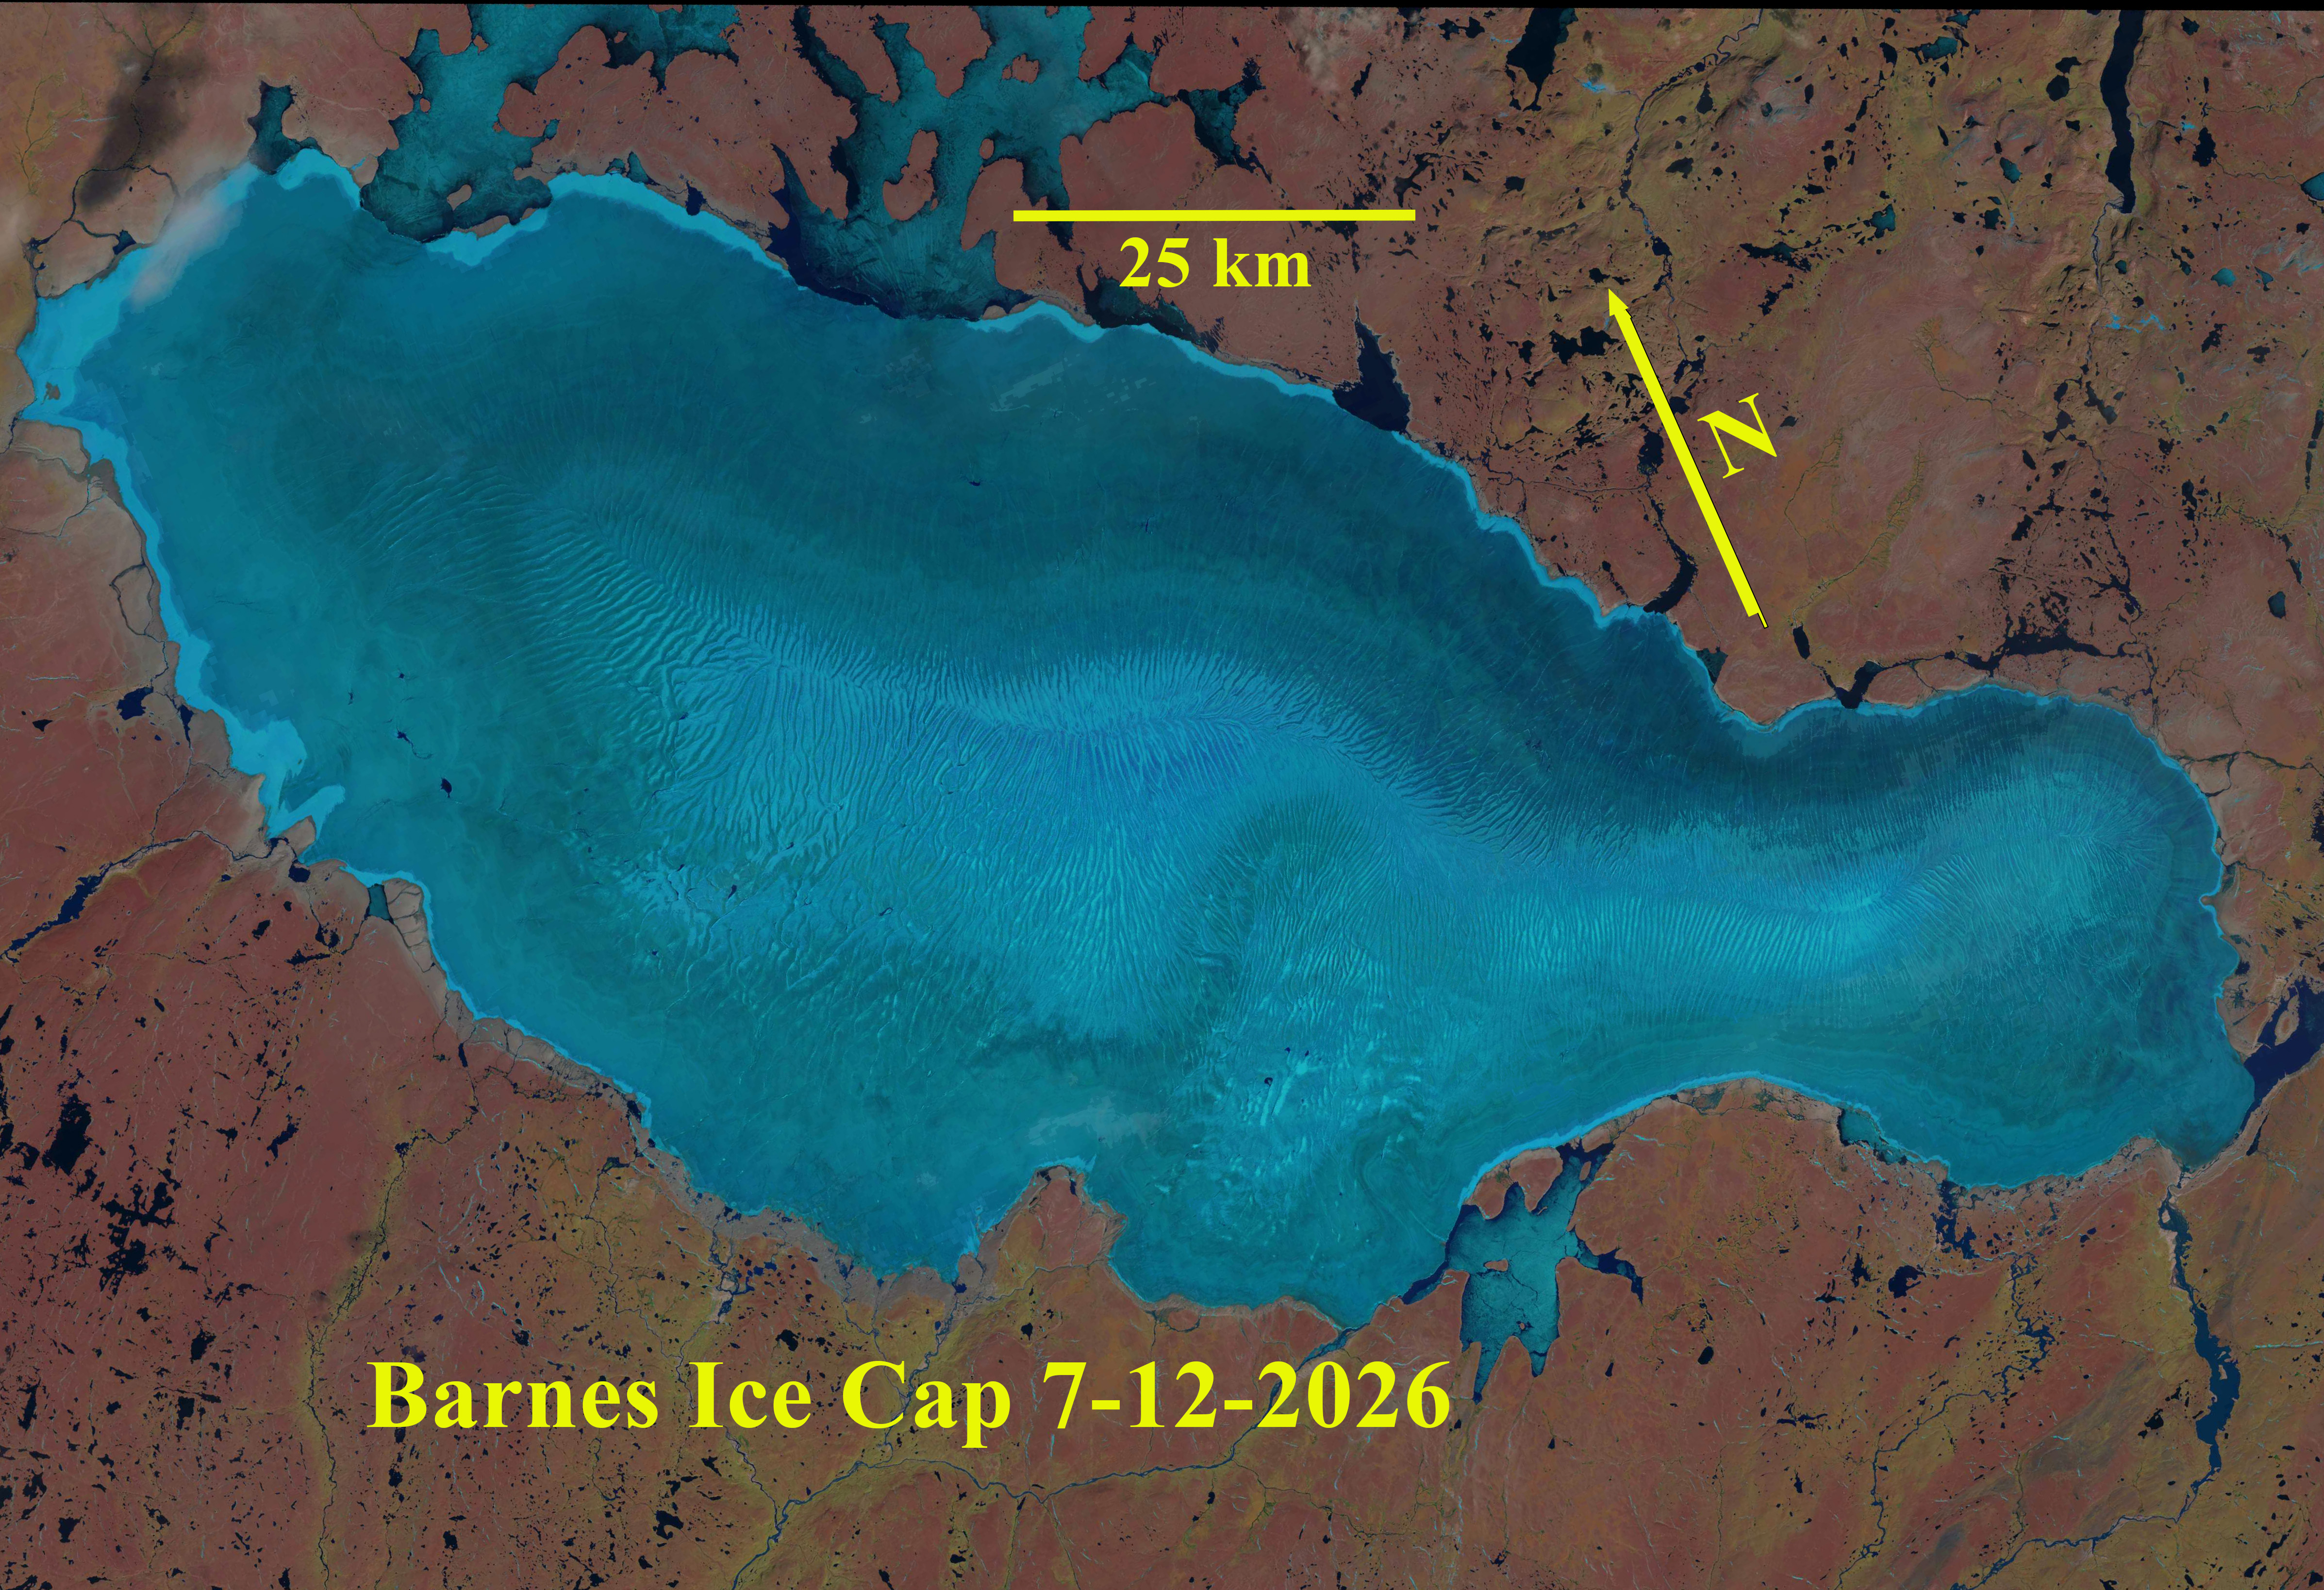
Barnes Ice Cap and Baffin Island Glaciers Lose Snow Cover in July 2026

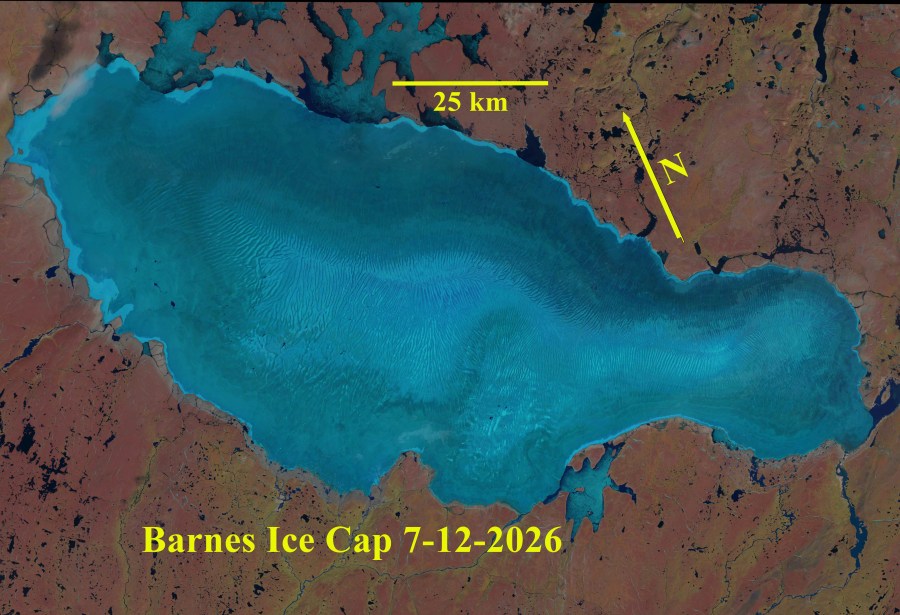
Barnes Ice Cap having in Landsat image with well developed melt channels from crest to margin of ice cap. Snow cover has been lost with over a month left in melt season.

Barnes Ice Cap located in the center of Baffin Island, Canada covers an area of ~5731 km2 in 2021 (Rippin et al 2026). The ice cap is approximately 150 km long, 60 km wide and has maximum ice thickness of ~730 m and a maximum ice elevation of 1124 m above sea level (asl) at the summit of the north dome. ICESat altimeter data indicated the thinning of the BIC at a mean rate of 0.75 m/year for the 2003–2009 period Gilbert et al (2016). They also noted that the ELA was at 950 in the 1960-80 period and is at 1100 m from 2002-2010 this leaves  a limited accumulation zone area. observe that  Barnes  Ice Cap lost its accumulation area beginning in 2010, in part due to the longer melt season.  The glacier does tend to not retain snowcover the accumulation zone consists of superimposed ice at the crest. Papasodoro et al (2016) noted that glacier wide balances were −0.52  m w.e./year from 1960 to 2013 and doubled to −1.06m w.e./year from 2005 to 2013 and remained at ~-1 m/a year through 2021 (Rippin et al 2026).

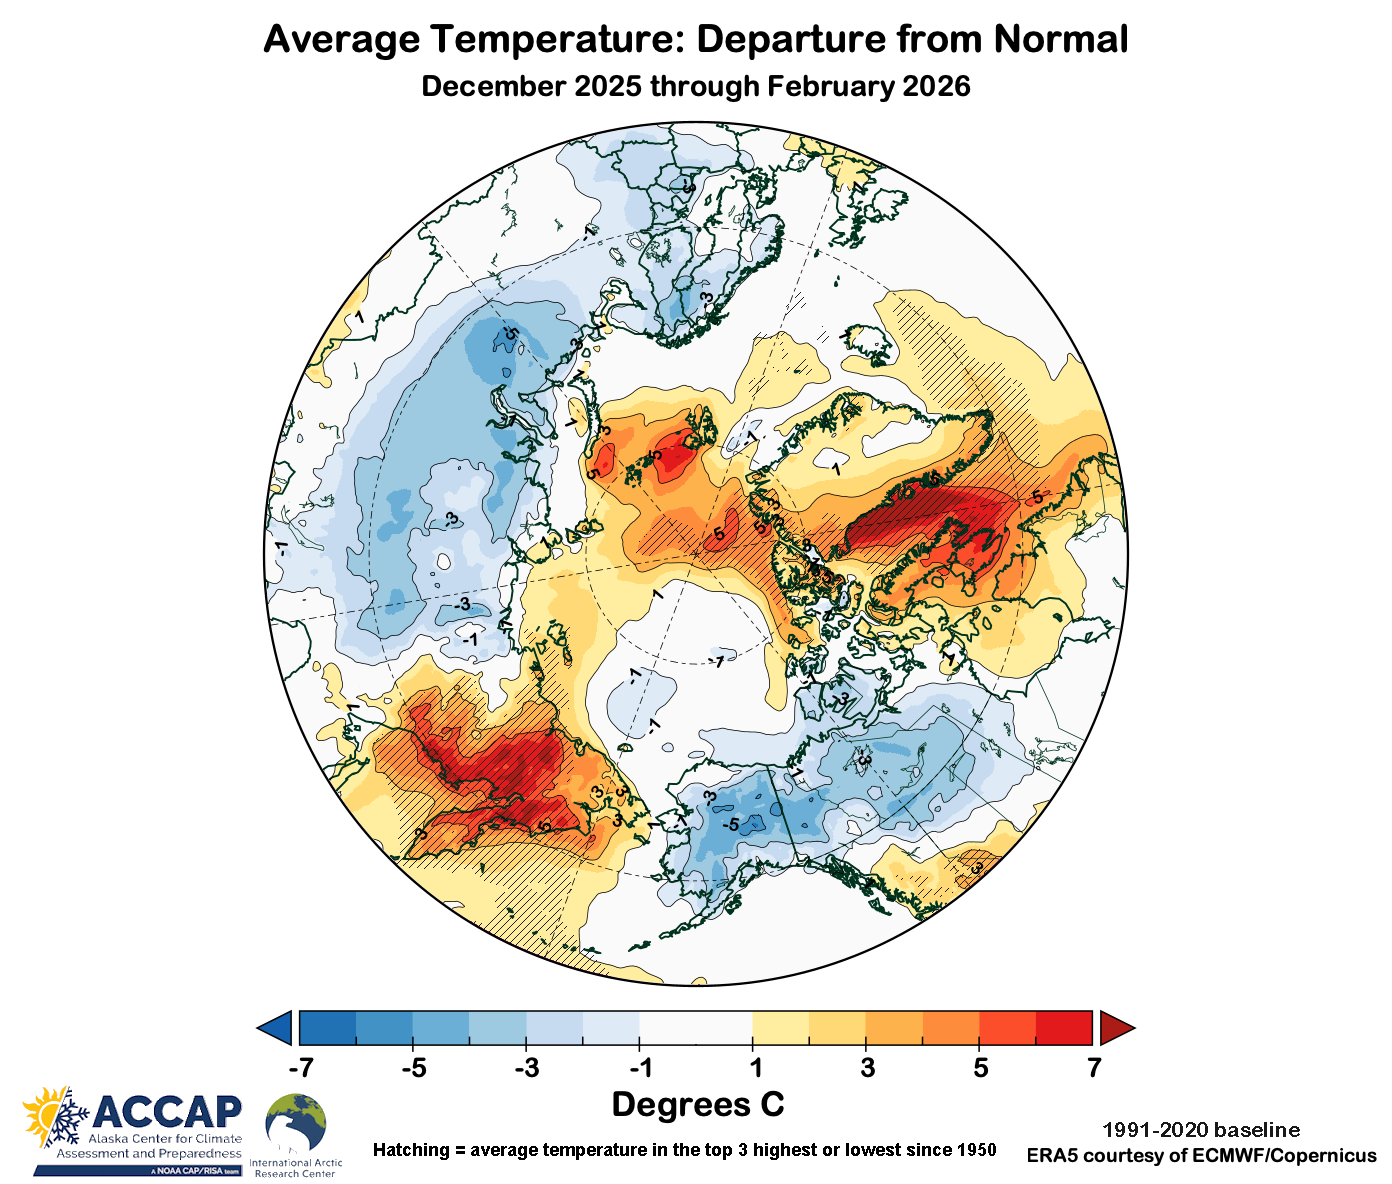
This has enabled supraglacial channels/valleys to develop and expand from year to year, extending from the ice cap crest to the margin, providing an effective pathway for meltwater to leave the ice sheet (Rippin et al 2026). This greatly diminishes refreezing, which had been the key mechanism for accumulation. The channels persist through and between melt seasons. There is insufficient ice motion or annual accumulation to offset the melt season runoff impact. Note the Band 4 image below indicates the extent of specific channels and how they cross cut specific stratigraphic ice horizons (H). Winter conditions were 3-5 C above average in the area, with spring and early summer conditions being normal or slightly below normal. This combined with the rapid snow loss on the ice cap between June 24 and July 12 indicates that snowpack was thin.
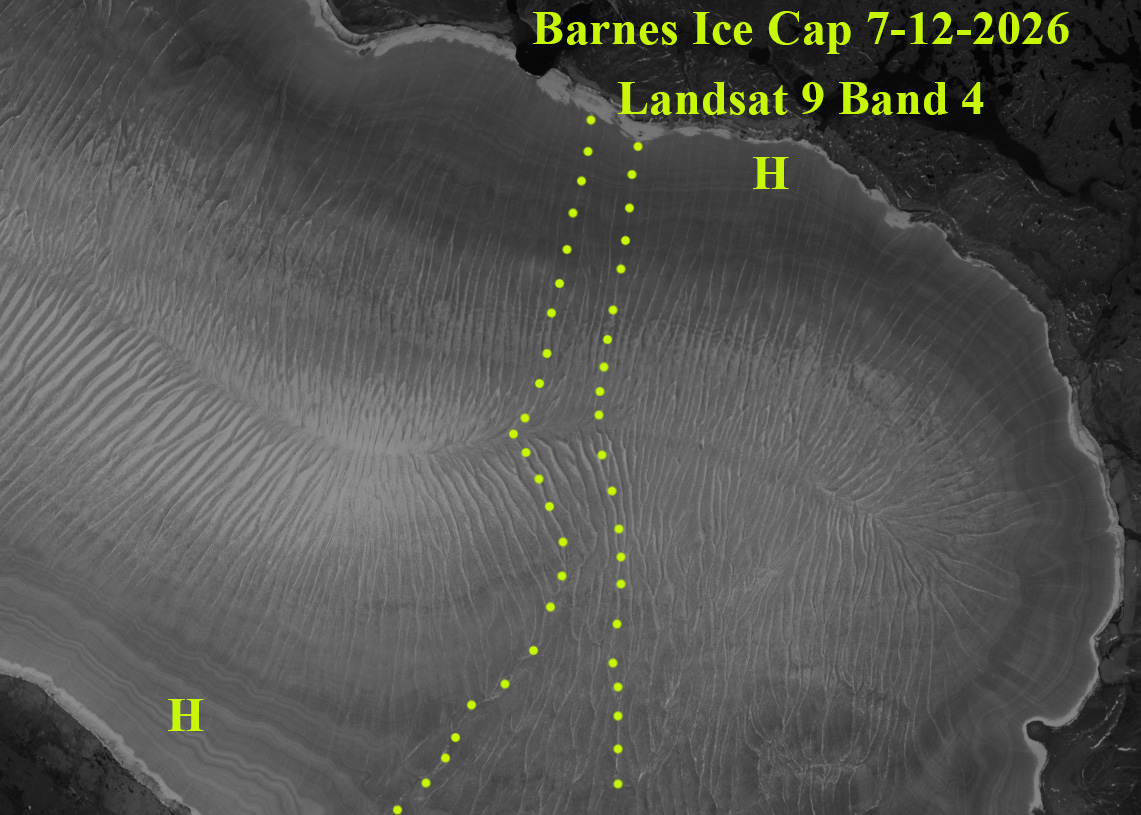
Barnes Ice Cap southern lobe with specific supraglacial stream channels noted. These have incised into the surface and persist. They cross stratigraphic ice horizons (H) near the margin of this Landsat Band 4 image from July 12, 2026.
Winter temperature anomaly across the Arctic.
Glaciers on Peninsula on northern side of Home Bay having lost nearly all snowcover by July 15, 2026 in this Landsat image.

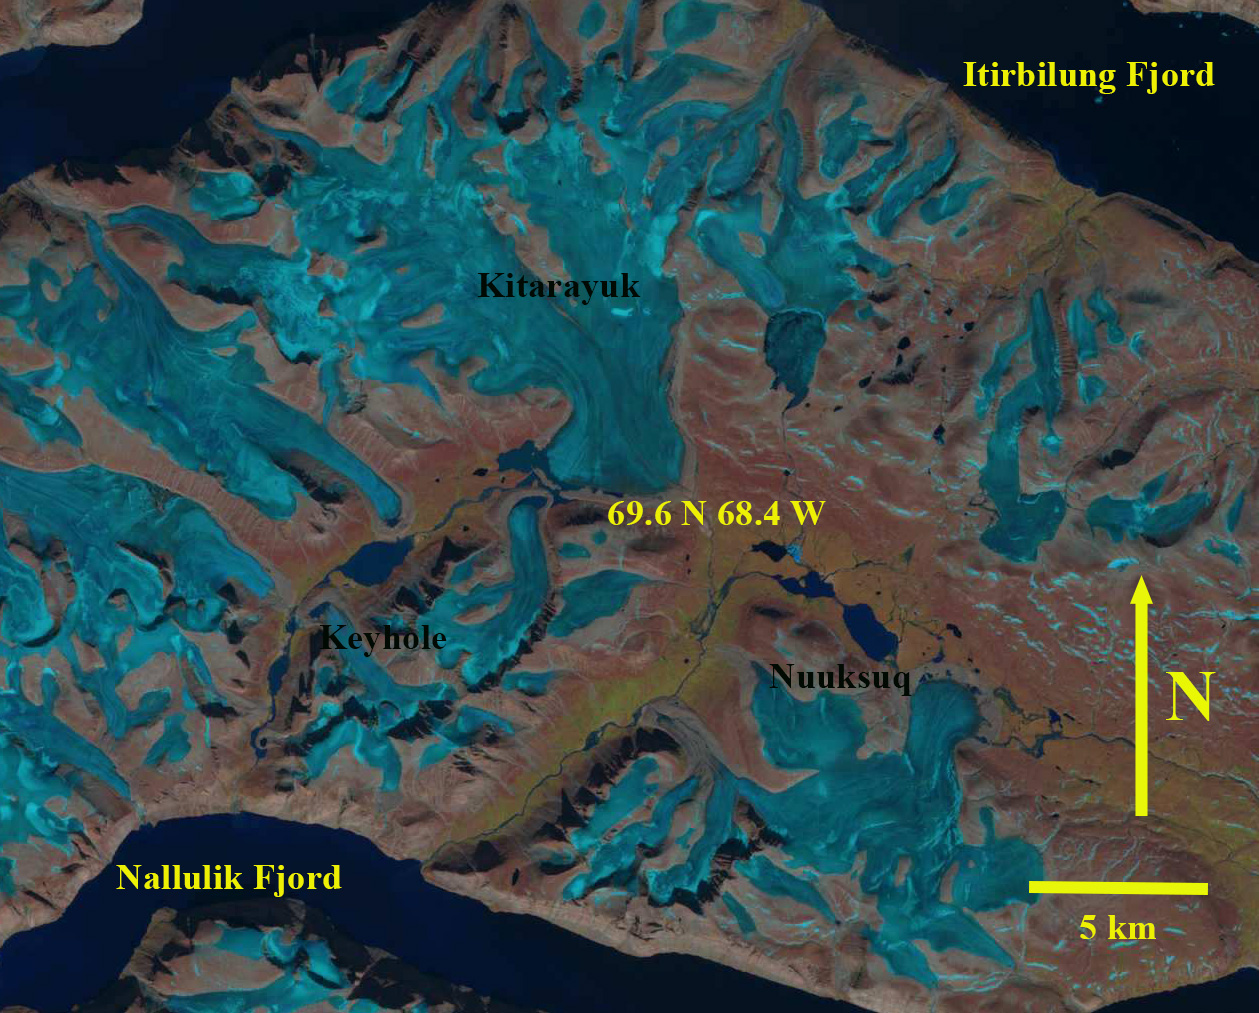
In mid-July 2026 Landsat imagery indicates the loss of all snow cover on Barnes Ice cap and that the supraglacial streams are fully activated. A series of glaciers to the east of the ice cap also have lost all snowcover including Keyhole, Kitarchick and Nuusuq Glacier. With over a month left in the melt season this will lead to substantial mass balance loss of these glaciers, driving further thinning and recession. Decade Icefield just to the north of this trio of glaciers also has lost all snow cover by mid-July.
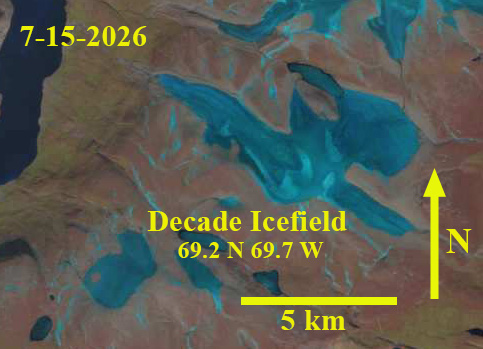
Decade Icefield in Landsat image from mid-July has lost its snow cover.
Barnes Ice Cap southeast region illustrating suprglacial stream extent and lack of snowcver from margin to summit of ice cap in Landsat image.

From a Glaciologists Perspective AGU Day 2

It has been 30 years since my first experience at the AGU, at that time glaciology and the cryosphere played a small role.  Today that is clearly not the case.  Today just a glimpse of a few of the many interesting glaciers studies are provided to again illustrate the vast array and amazing detail of work being conducted.

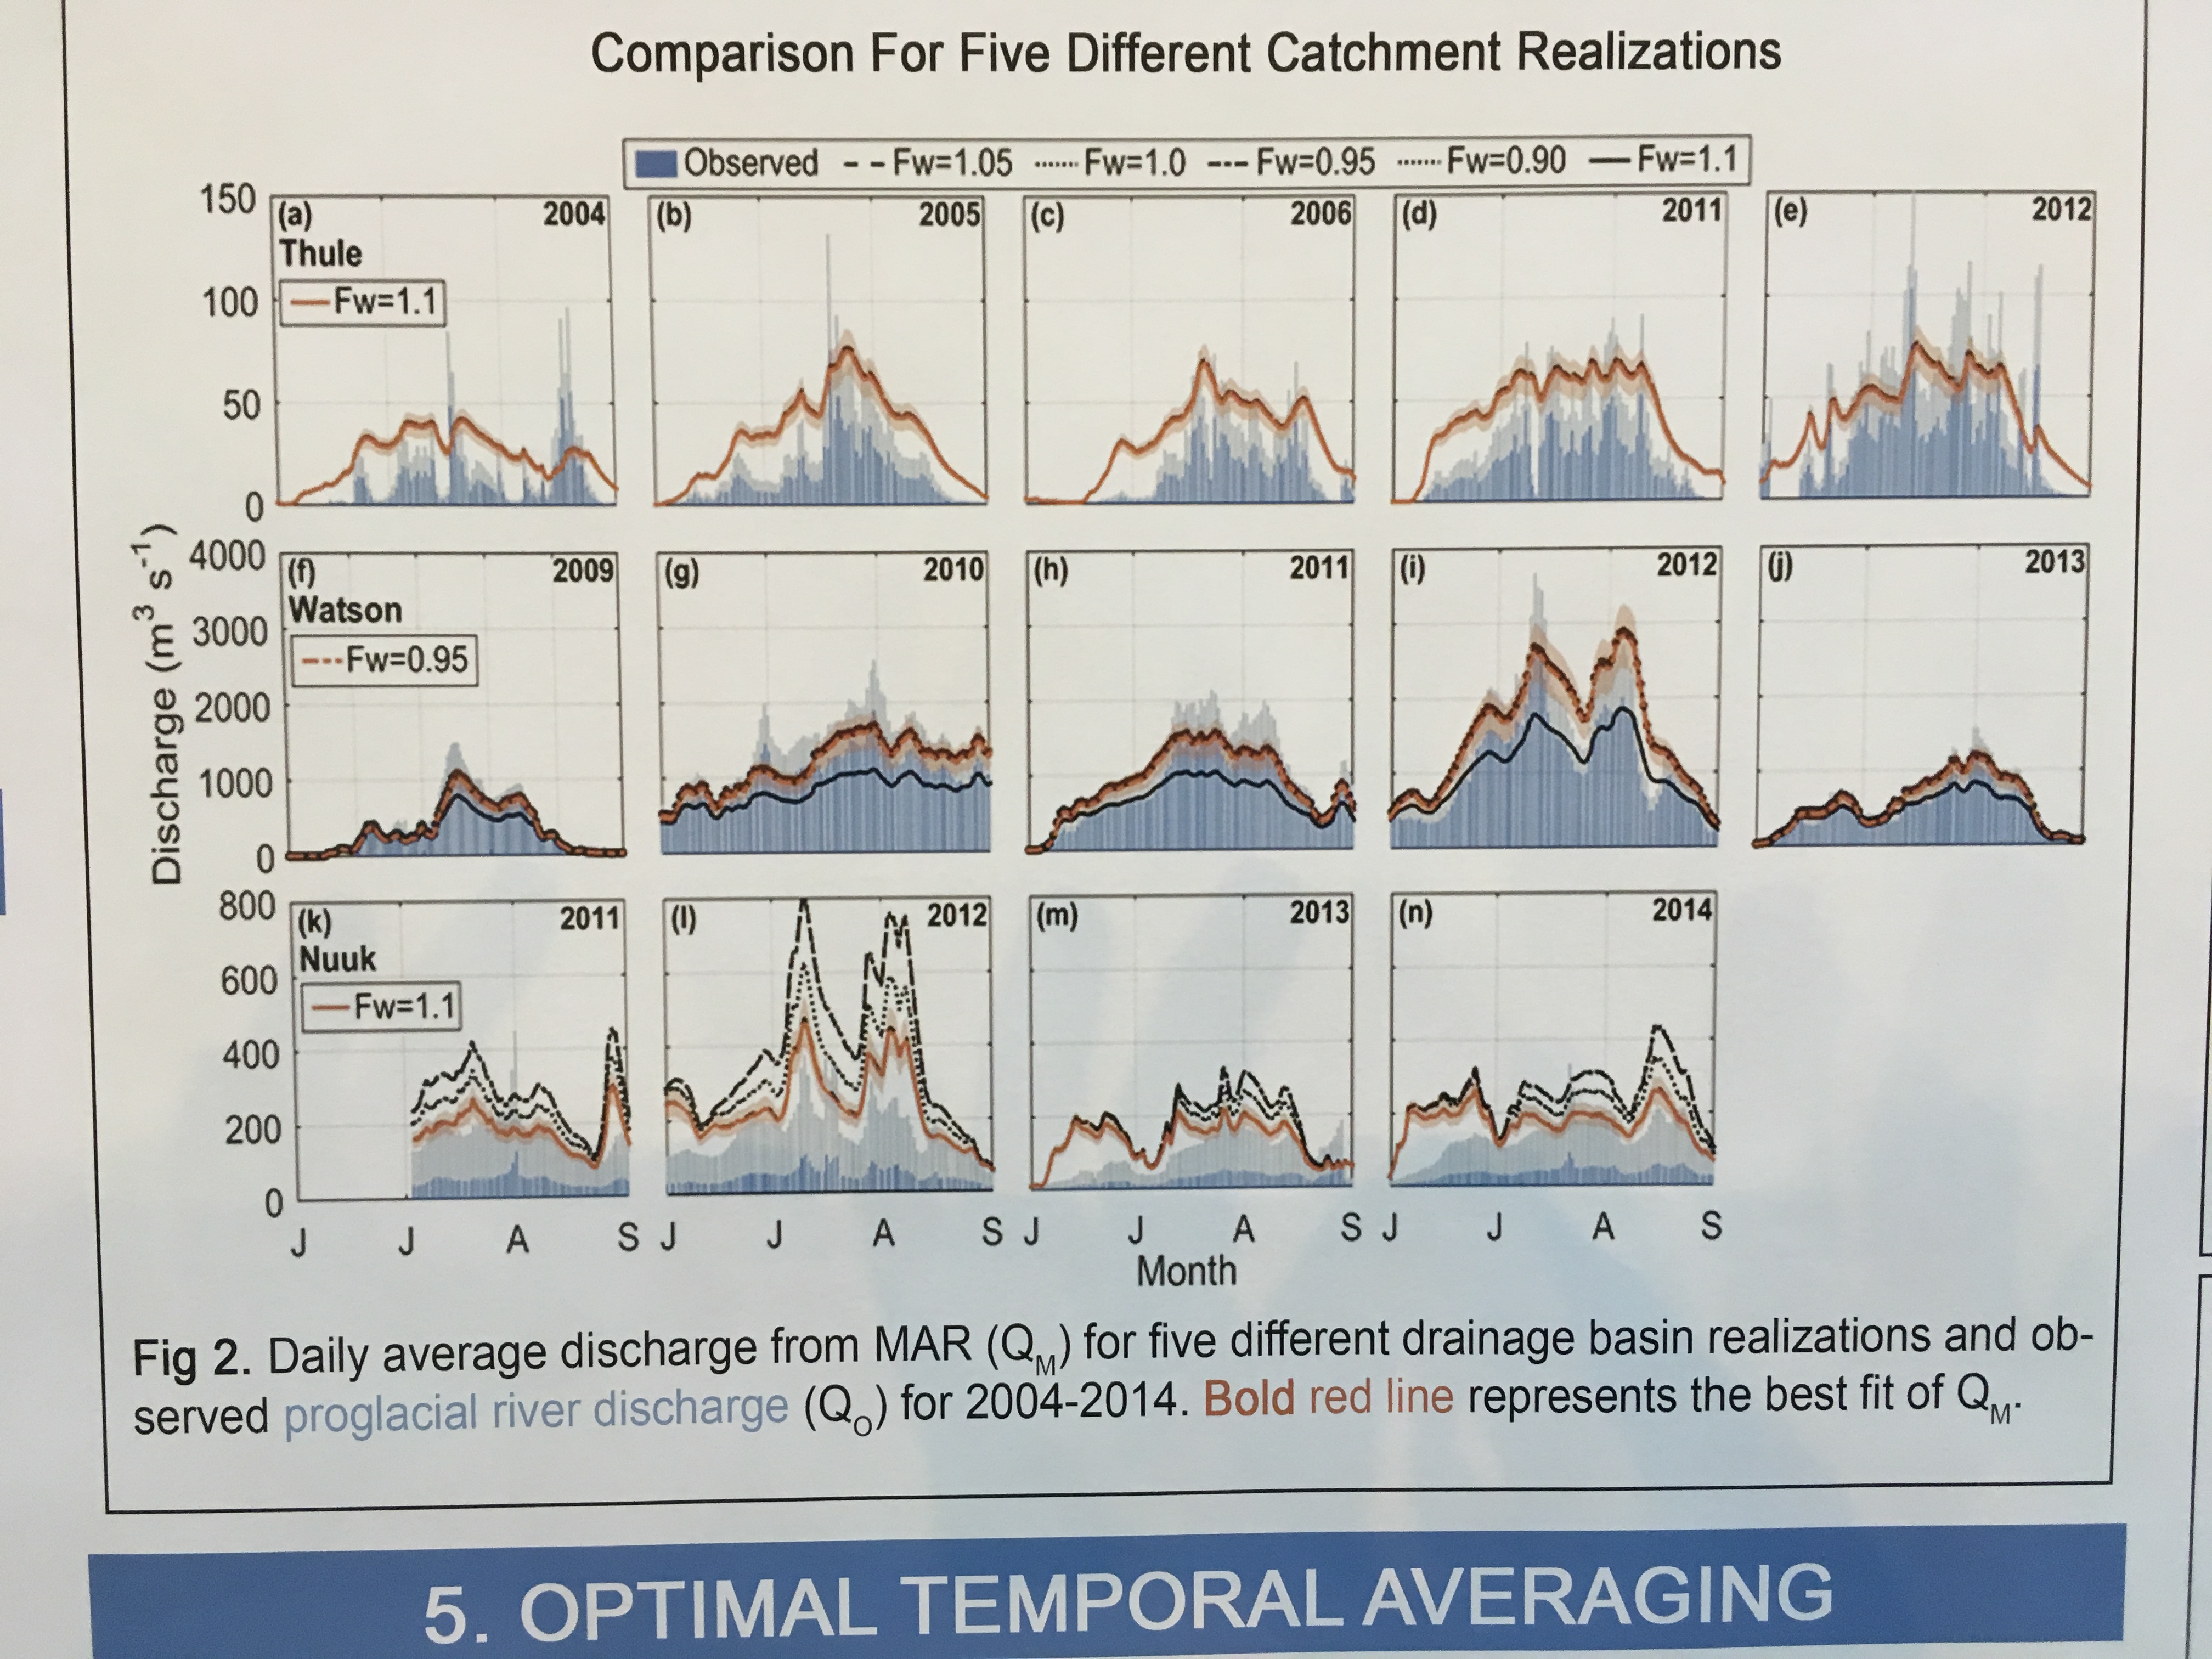
Samiah Mustafa, Brown University presented research looking at the ability of a melt model to generate accurate discharge at three watersheds in West Greenland; North River (Thule), Watson River (Kangerlussuaq), and Naujat Kuat River (Nuuk). In each watershed they modeled melt at daily, 5, 10 and 20 day time scales.  They found Nuuk and Thule basins did not do well at a daily time scale, but do capture variability over 5-, 10-, and 20-day means (r2 > 0.7). Results at Watson River were in good agreement at each time scale. Model agreement with river flow data  is reduced during periods of peak discharge, particularly for the exceptional melt and discharge events of July 2012 evident in chart above.

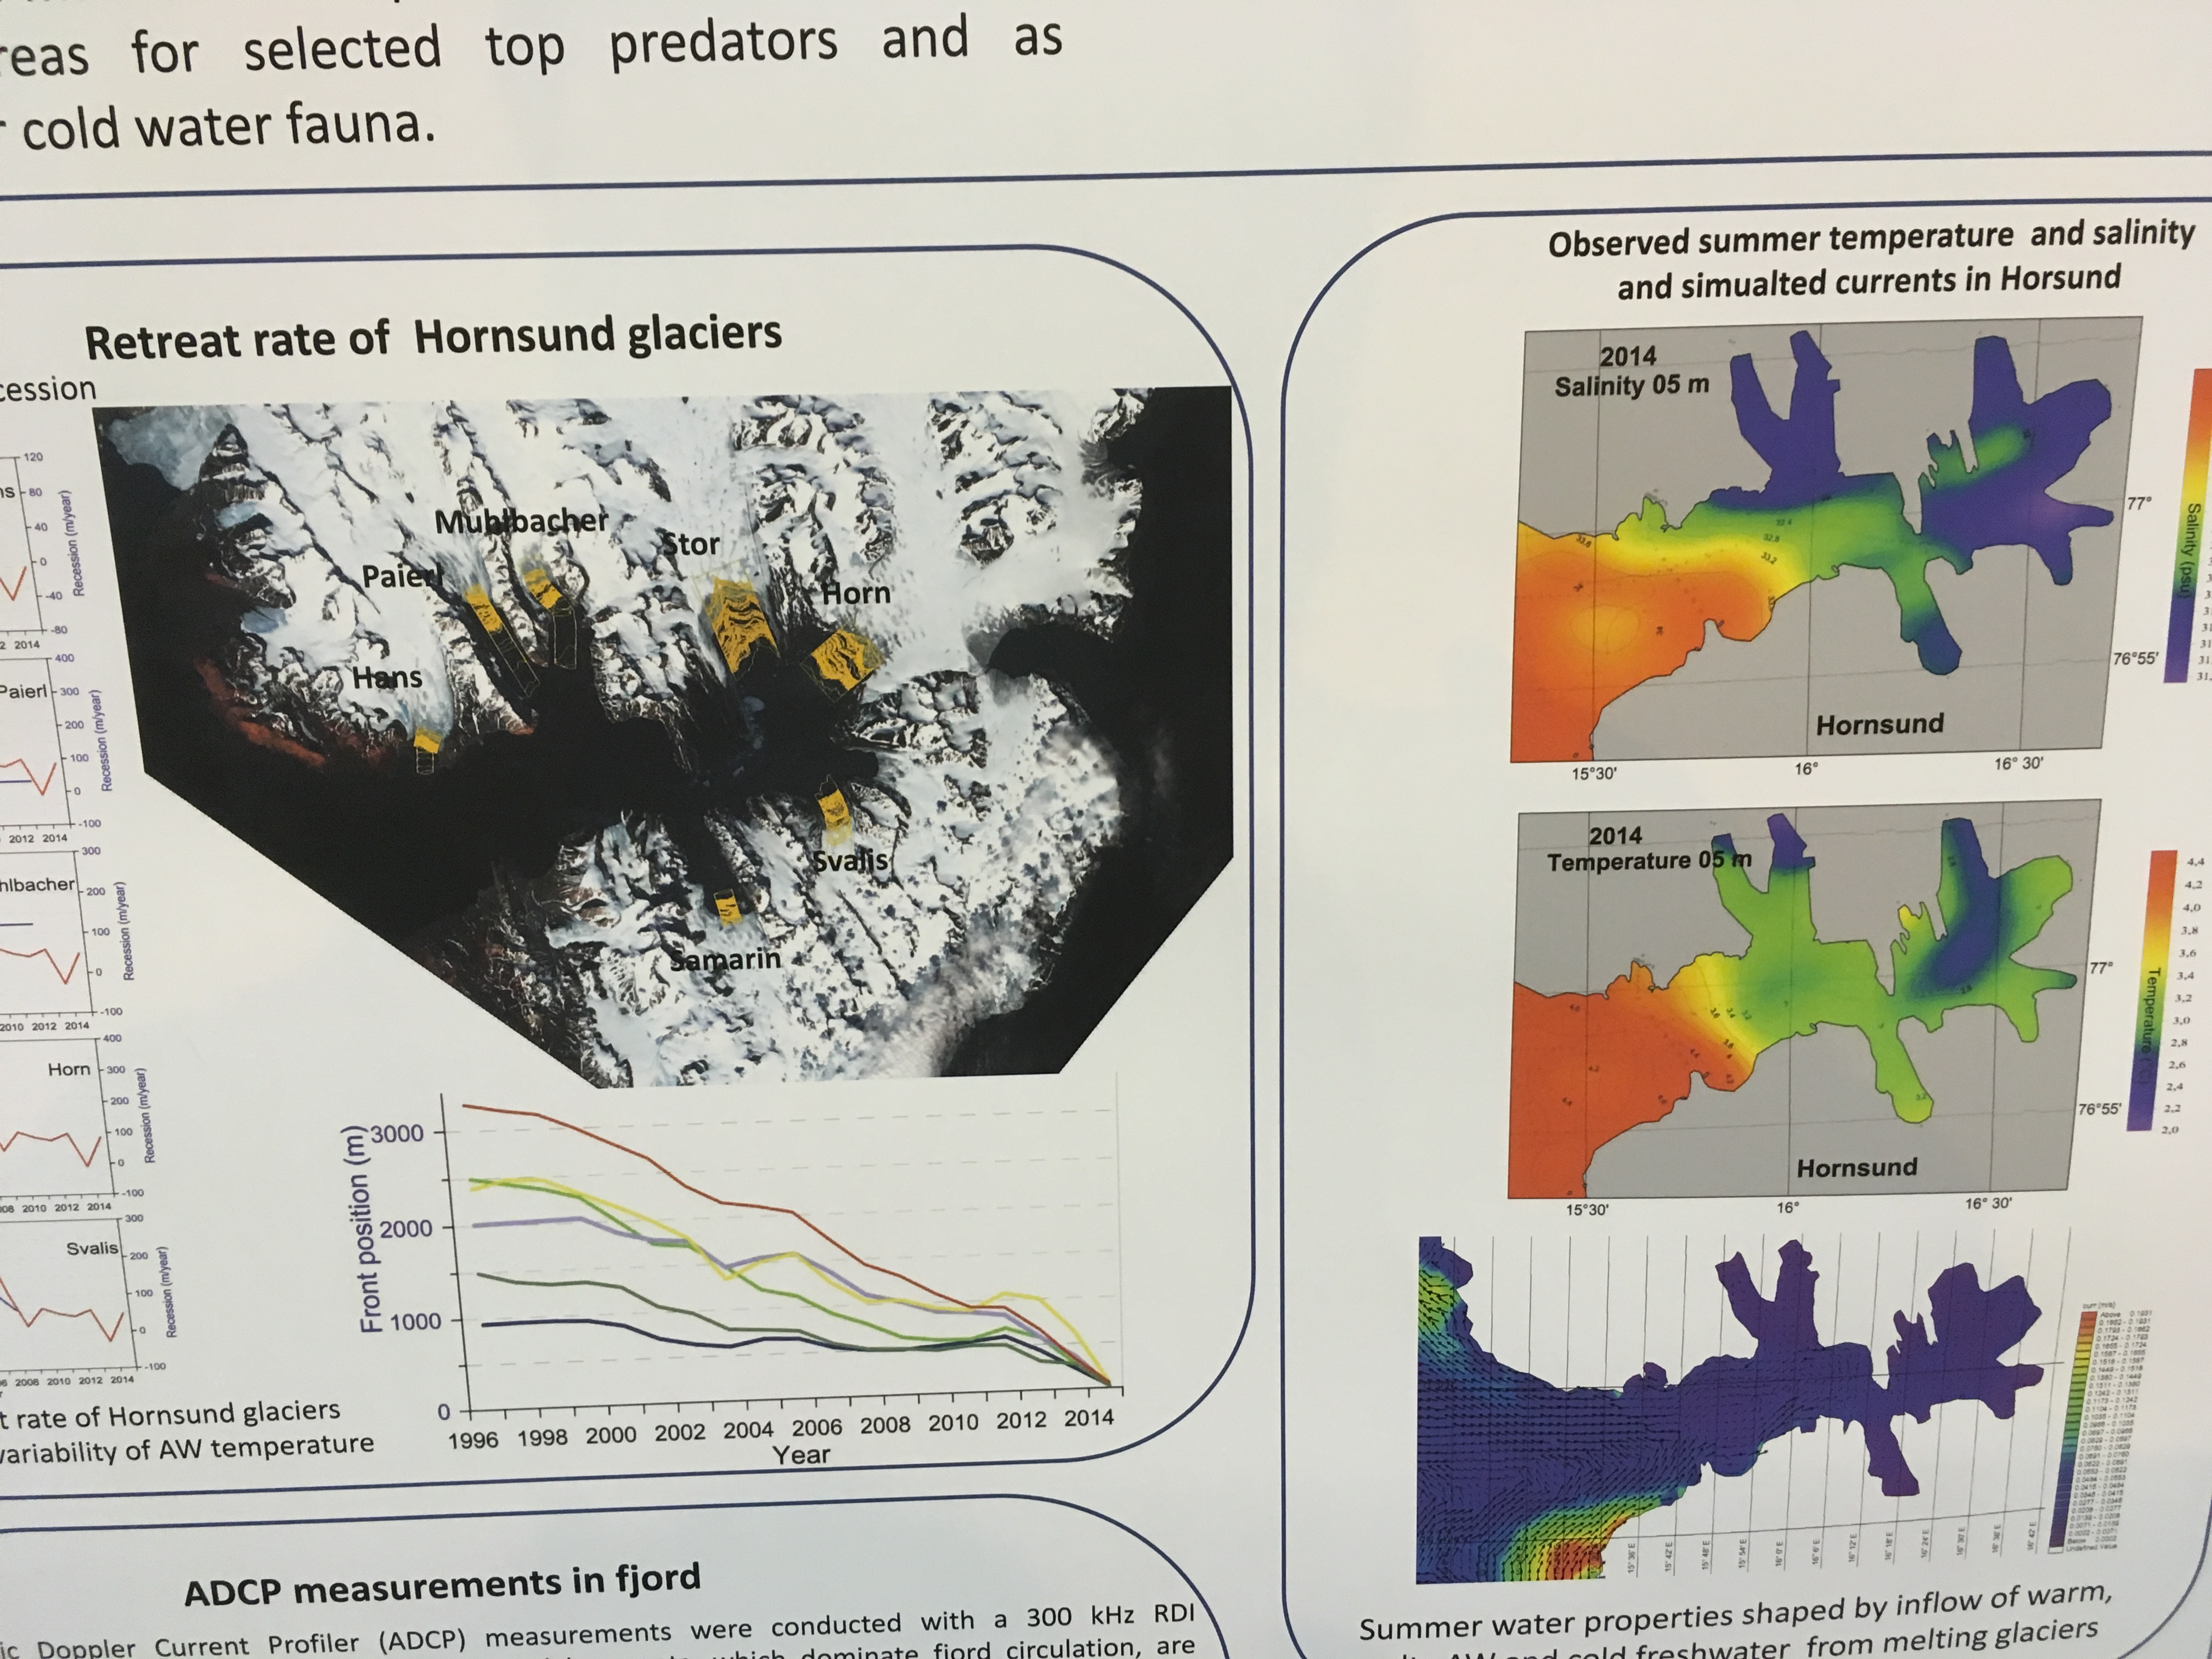
Waldemar Walczowski, Institute of Oceanology Polish Academy of Sciences reported on a study combining glacier retreat and examination of water temperatures in the Hornsund fjord (southern Svalbard), collected under the Polish-Norwegian projects GLAERE and AWAKE-2.  The observed direct contact of warm oceanic water with a glacier’s calving face enhances submarine melting, undercutting and glacier calving.  The turbulent plumes of subglacial meltwater were key in heat transfer and influence glacier retreat. 

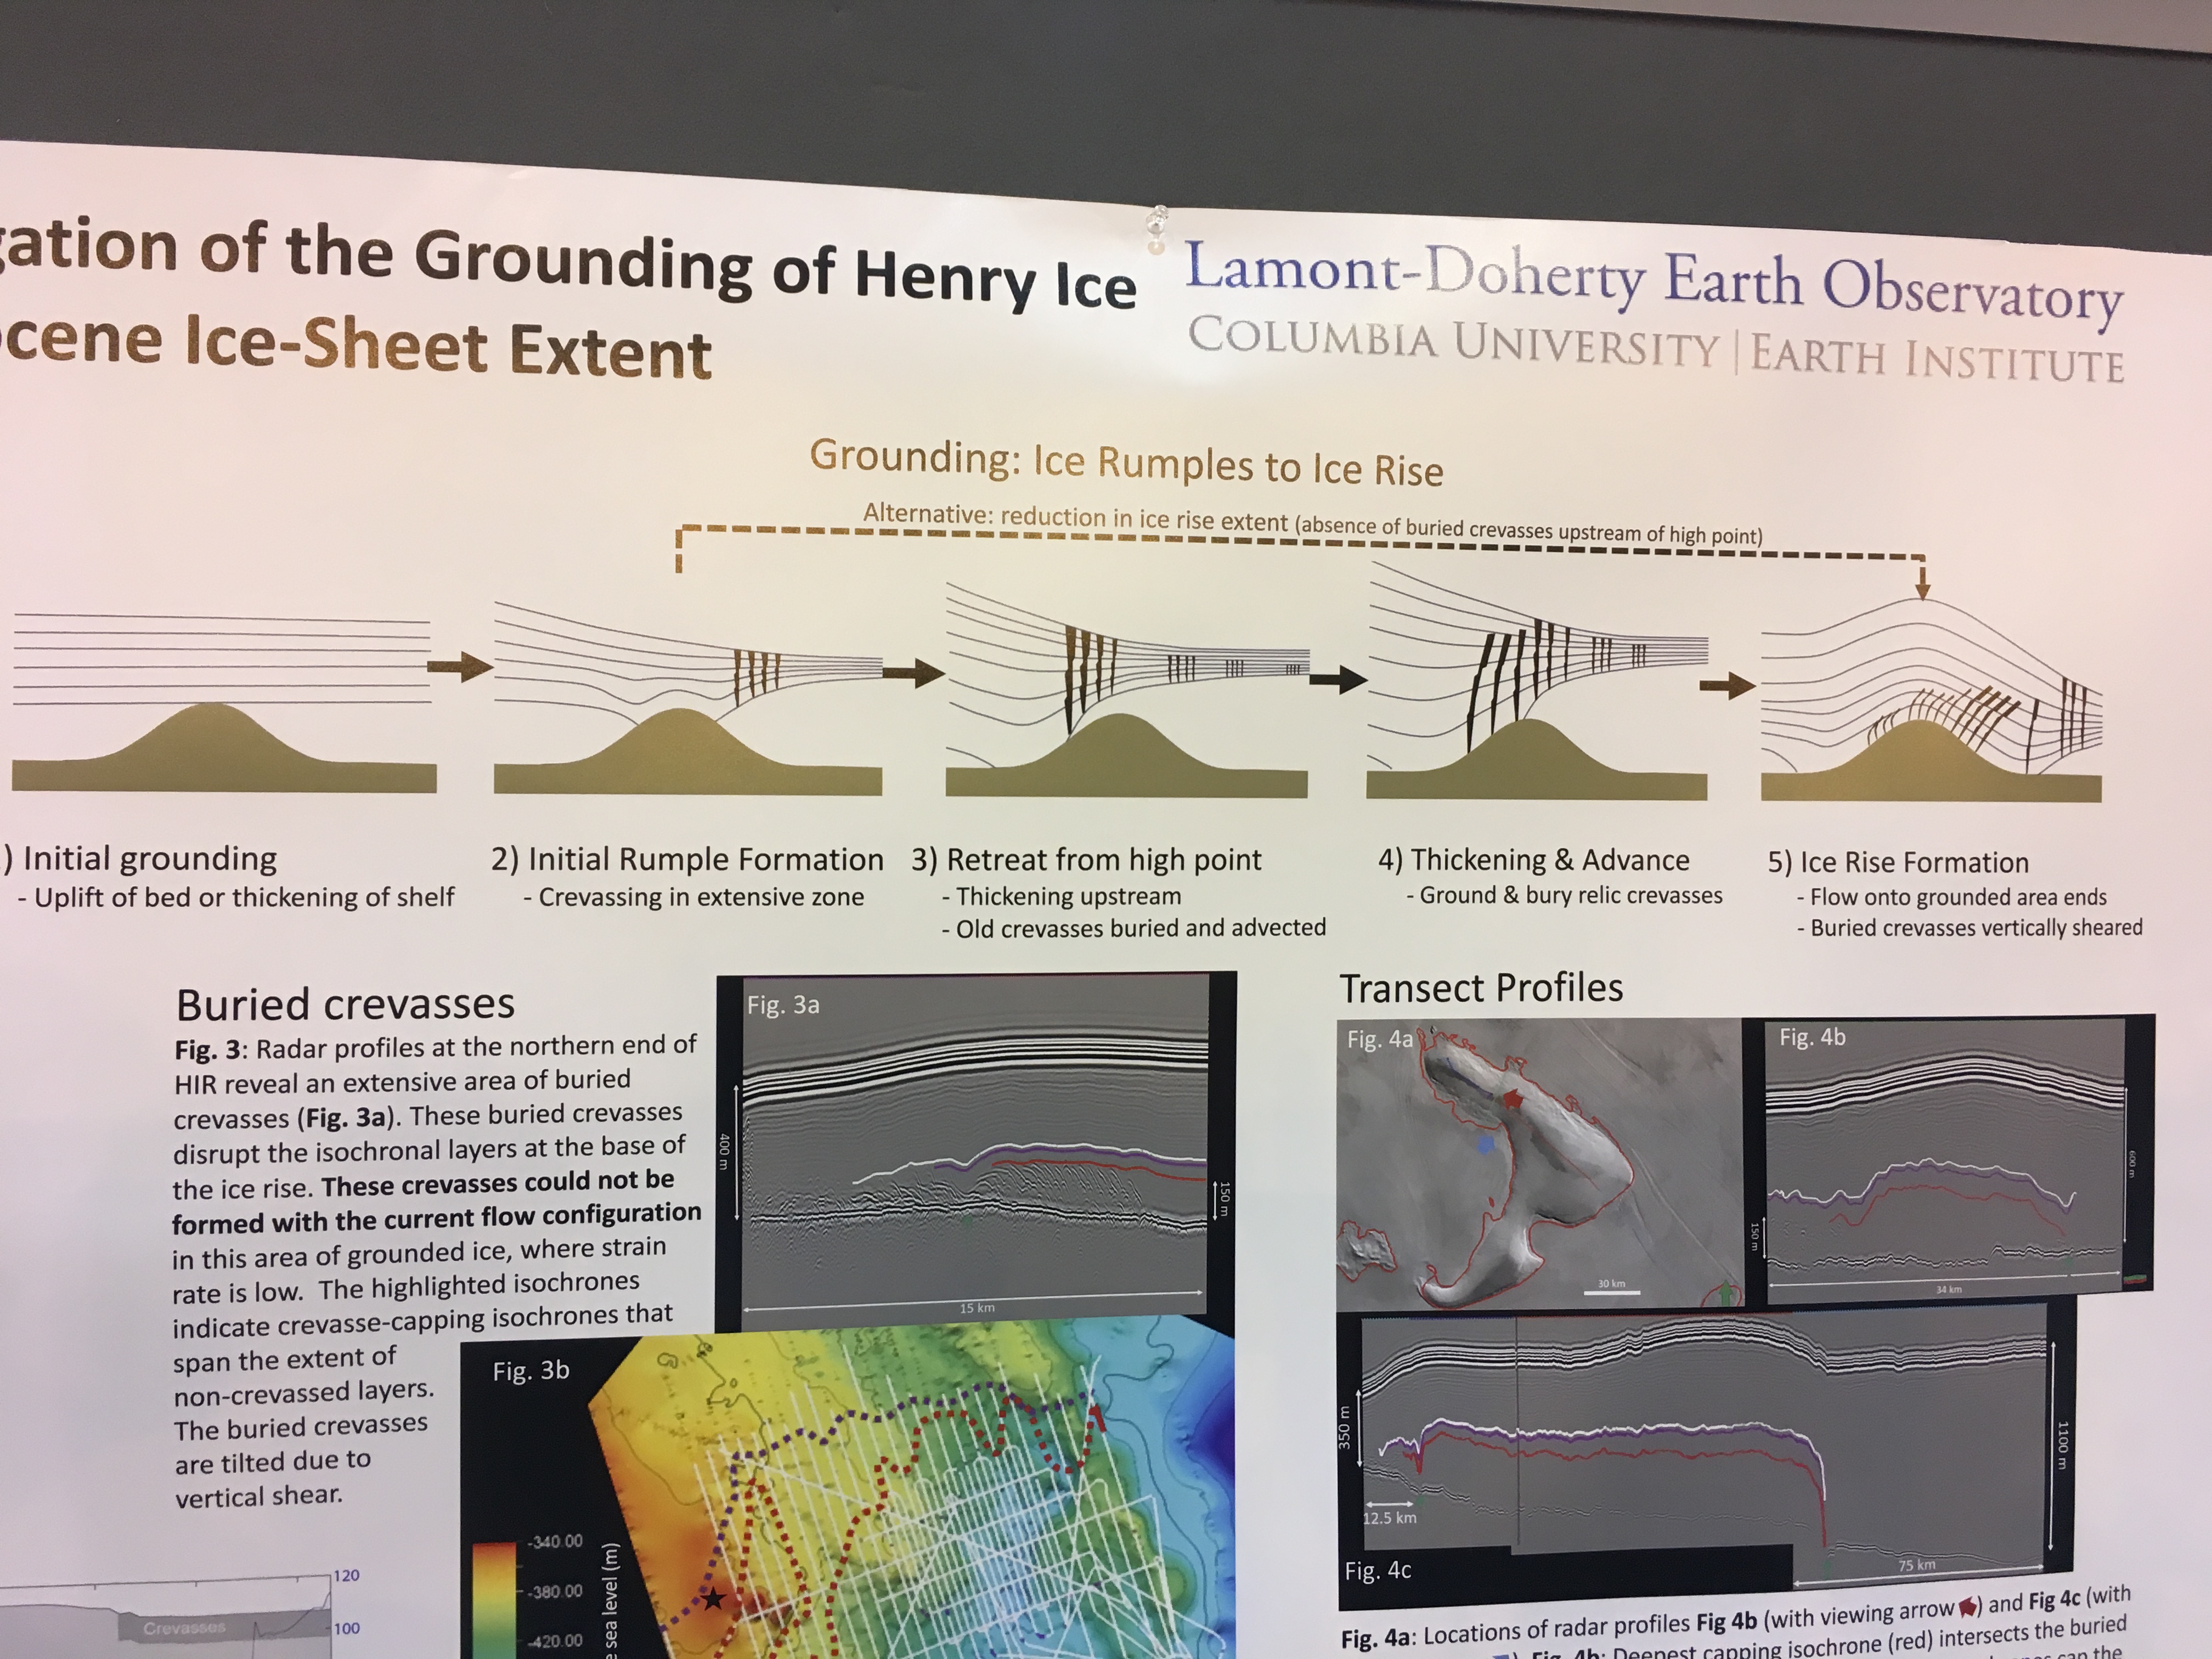
Martin Wearing from Lamont Doherty examined the development of crevasses in the past as the Ronne Ice Shelf advanced over the Henry Ice Rise.  The ice shelf thickened and advanced coming in contact with the bedrock high and generating crevasses that first formed around 600o years ago.  They discovered the featured in radar profiles of the ice shelf.  The sequence of crevasse development is seen above.

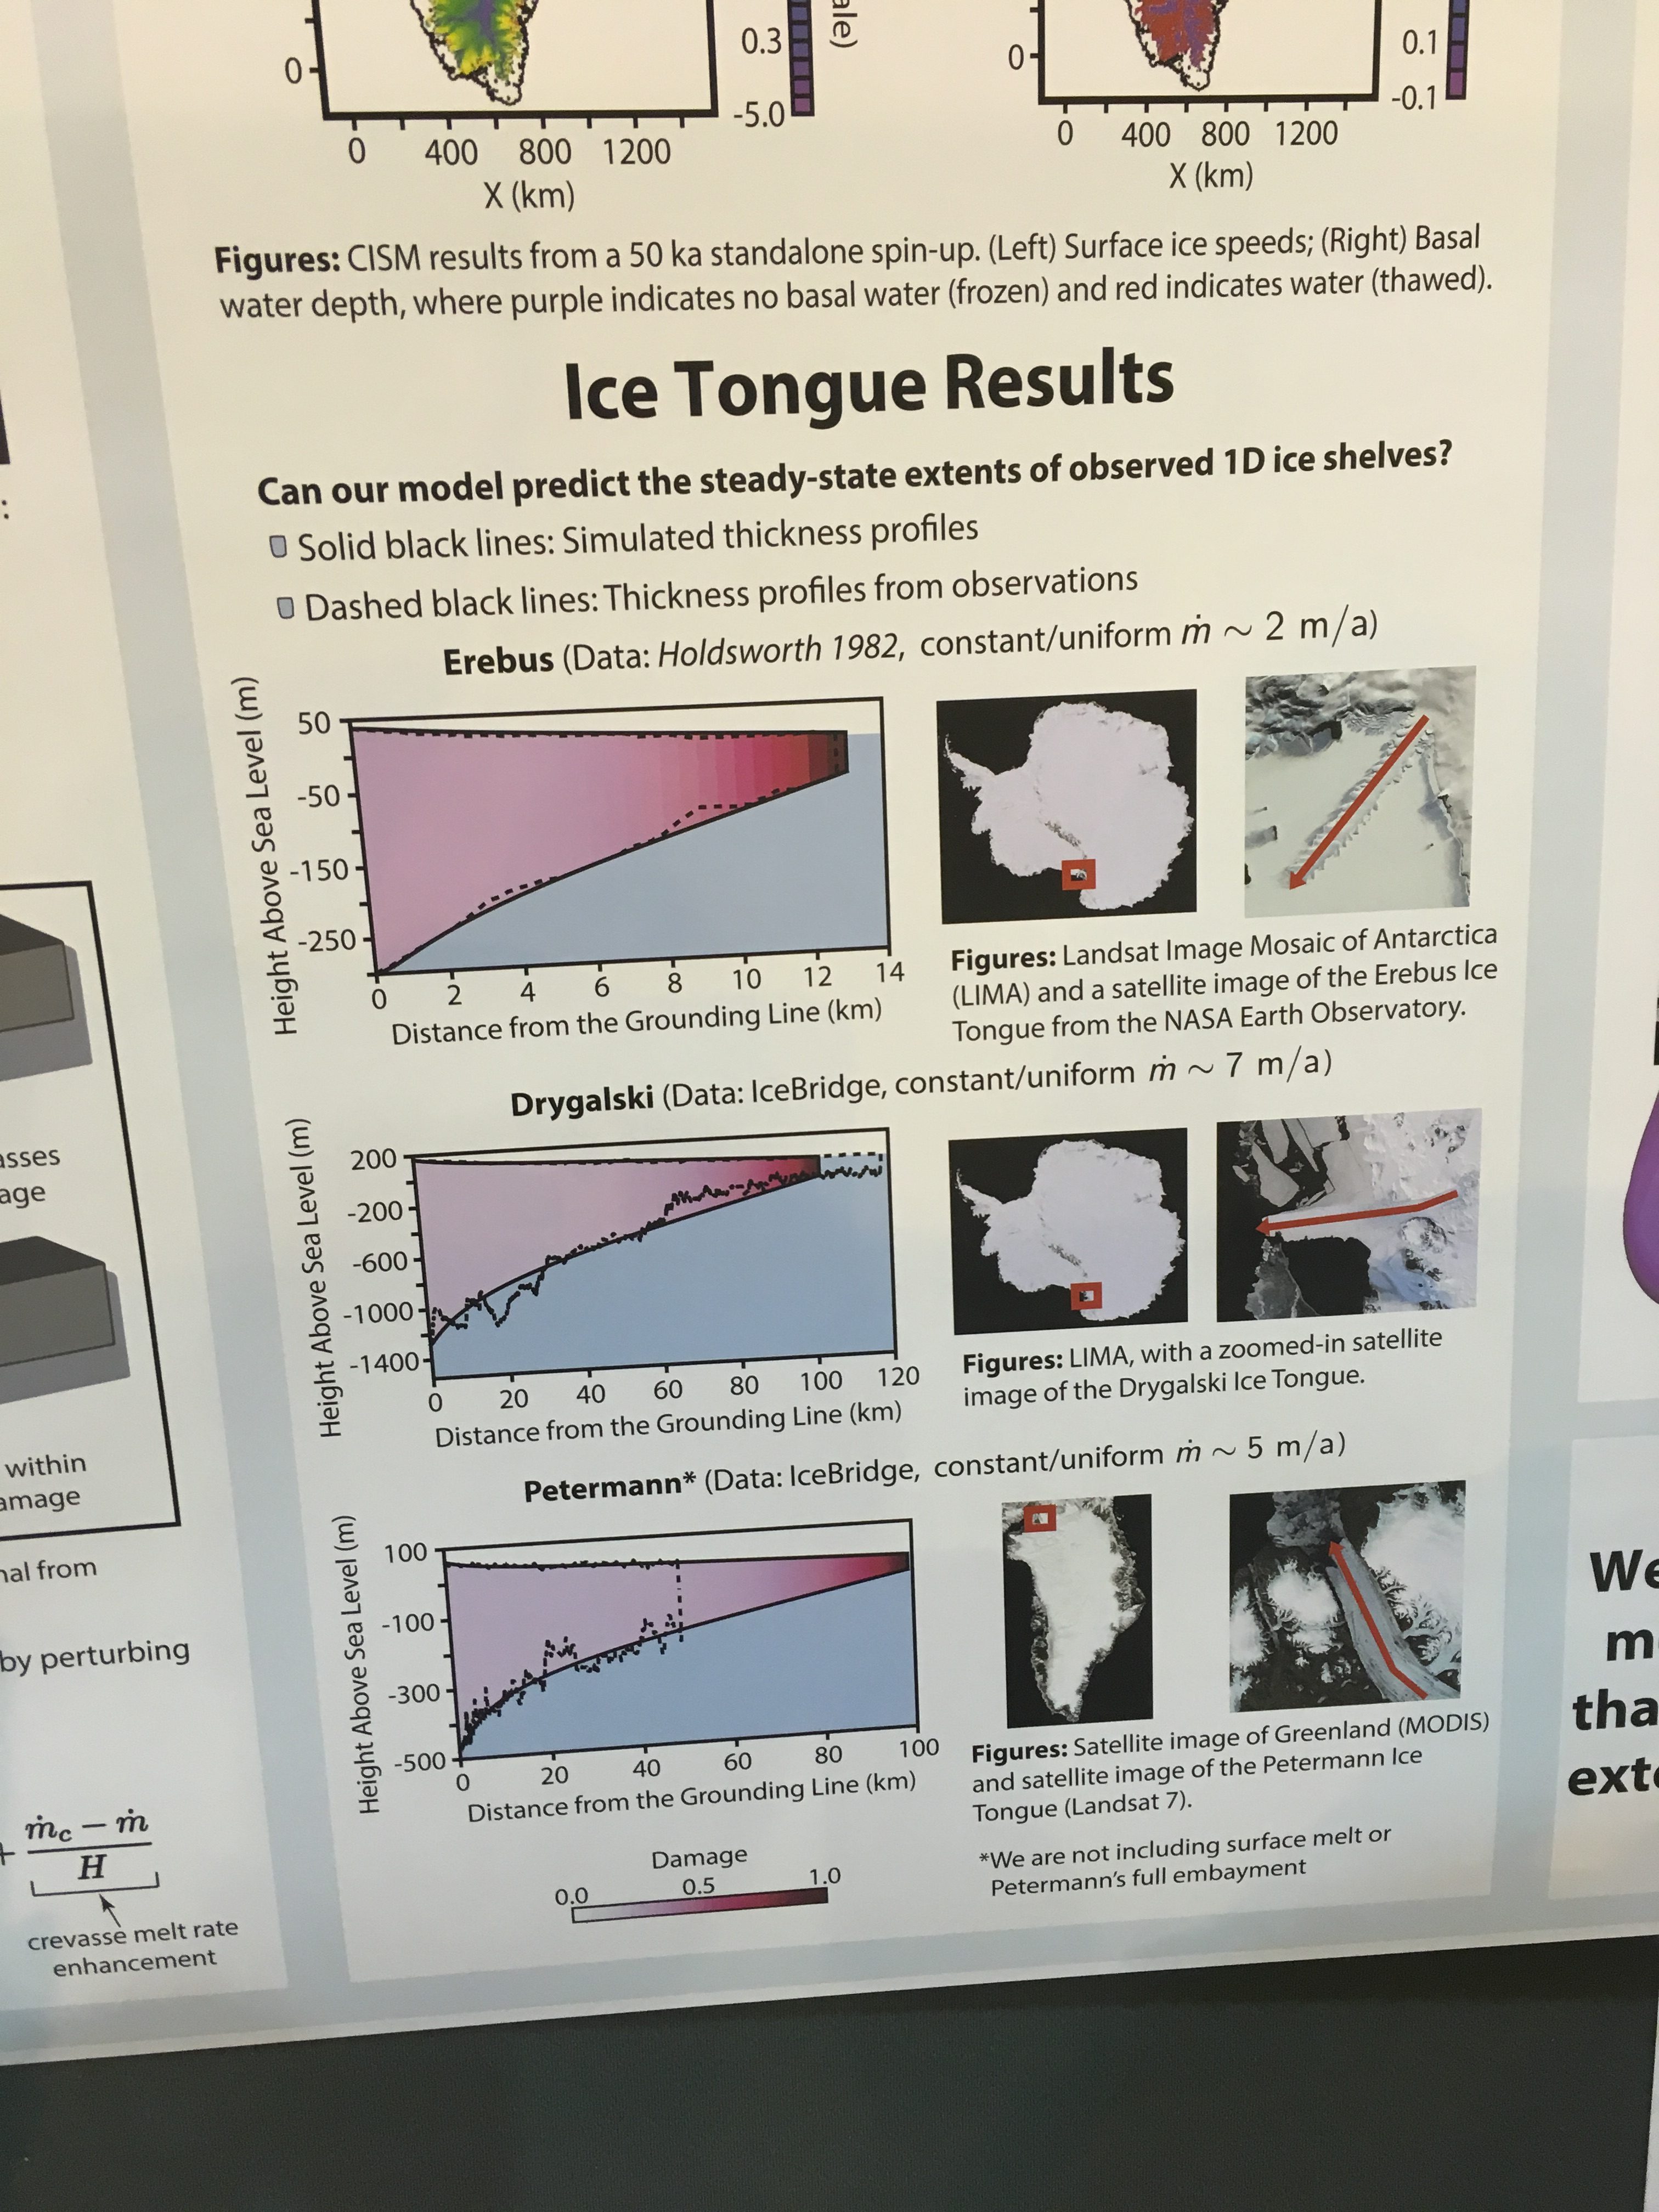
Morgan Whitcomb from University of Michigan used a simple damage evolution law, based on crevasse distributions as a continuum field to yield estimates of ice shelf calving rates when combined with the Community Ice Sheet Model (CISM).  Their basal melt function enhanced crevasse growth near the ice shelf terminus, leading to increased iceberg calving.  The diagram above shows the model predicts broadly correct calving rates for ice tongues ranging in length from 10 km  on Erebus to over 100 km  on Drygalski Glacier.


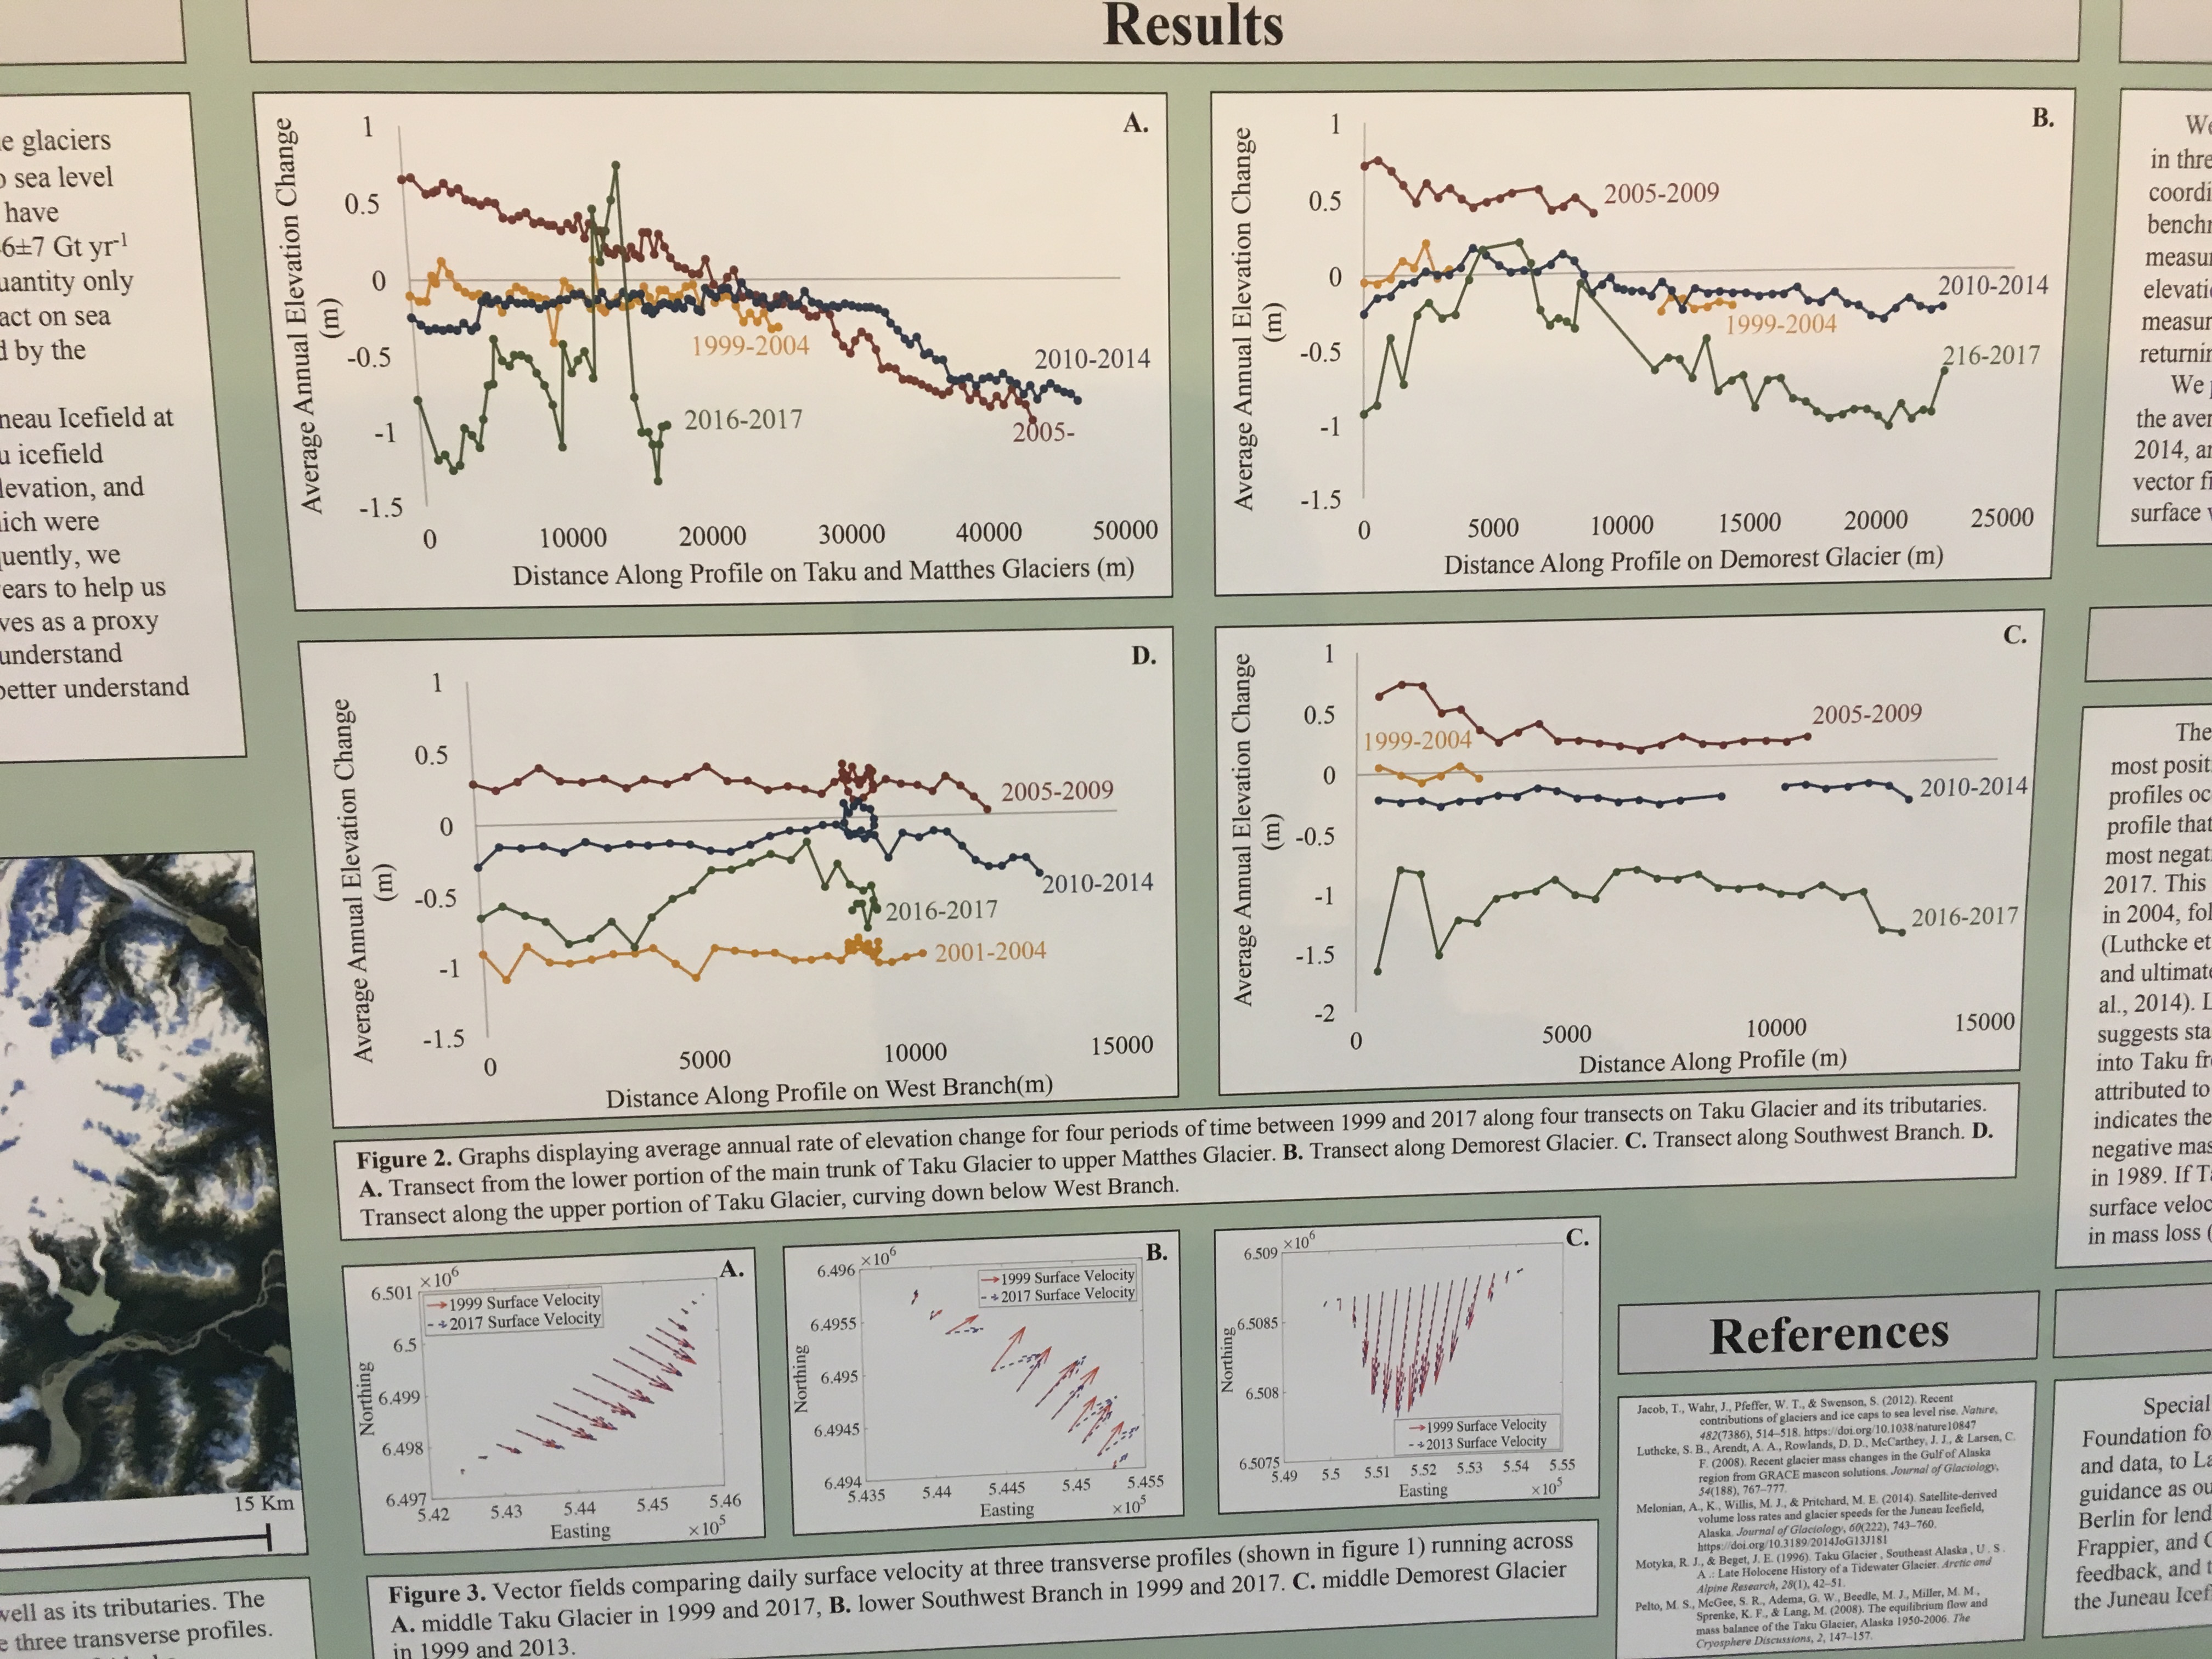
Ann Hill, Skidmore college working with the Juneau Icefield Research Programs velocity monitoring program reports on a comparison of velocity and surface elevation on Taku Glacier from 1997-2017.  The velocity on the main profile was consistent, as it had been back to 1950.  The surface elevation has experienced thinning after 1997 after a prolonged period of thickening.  Above are three velocity profiles with red and blue arrows from 1997 and 2017 mostly overlaying each other because velocity did not change.  Above are profiles of height changes for various periods.

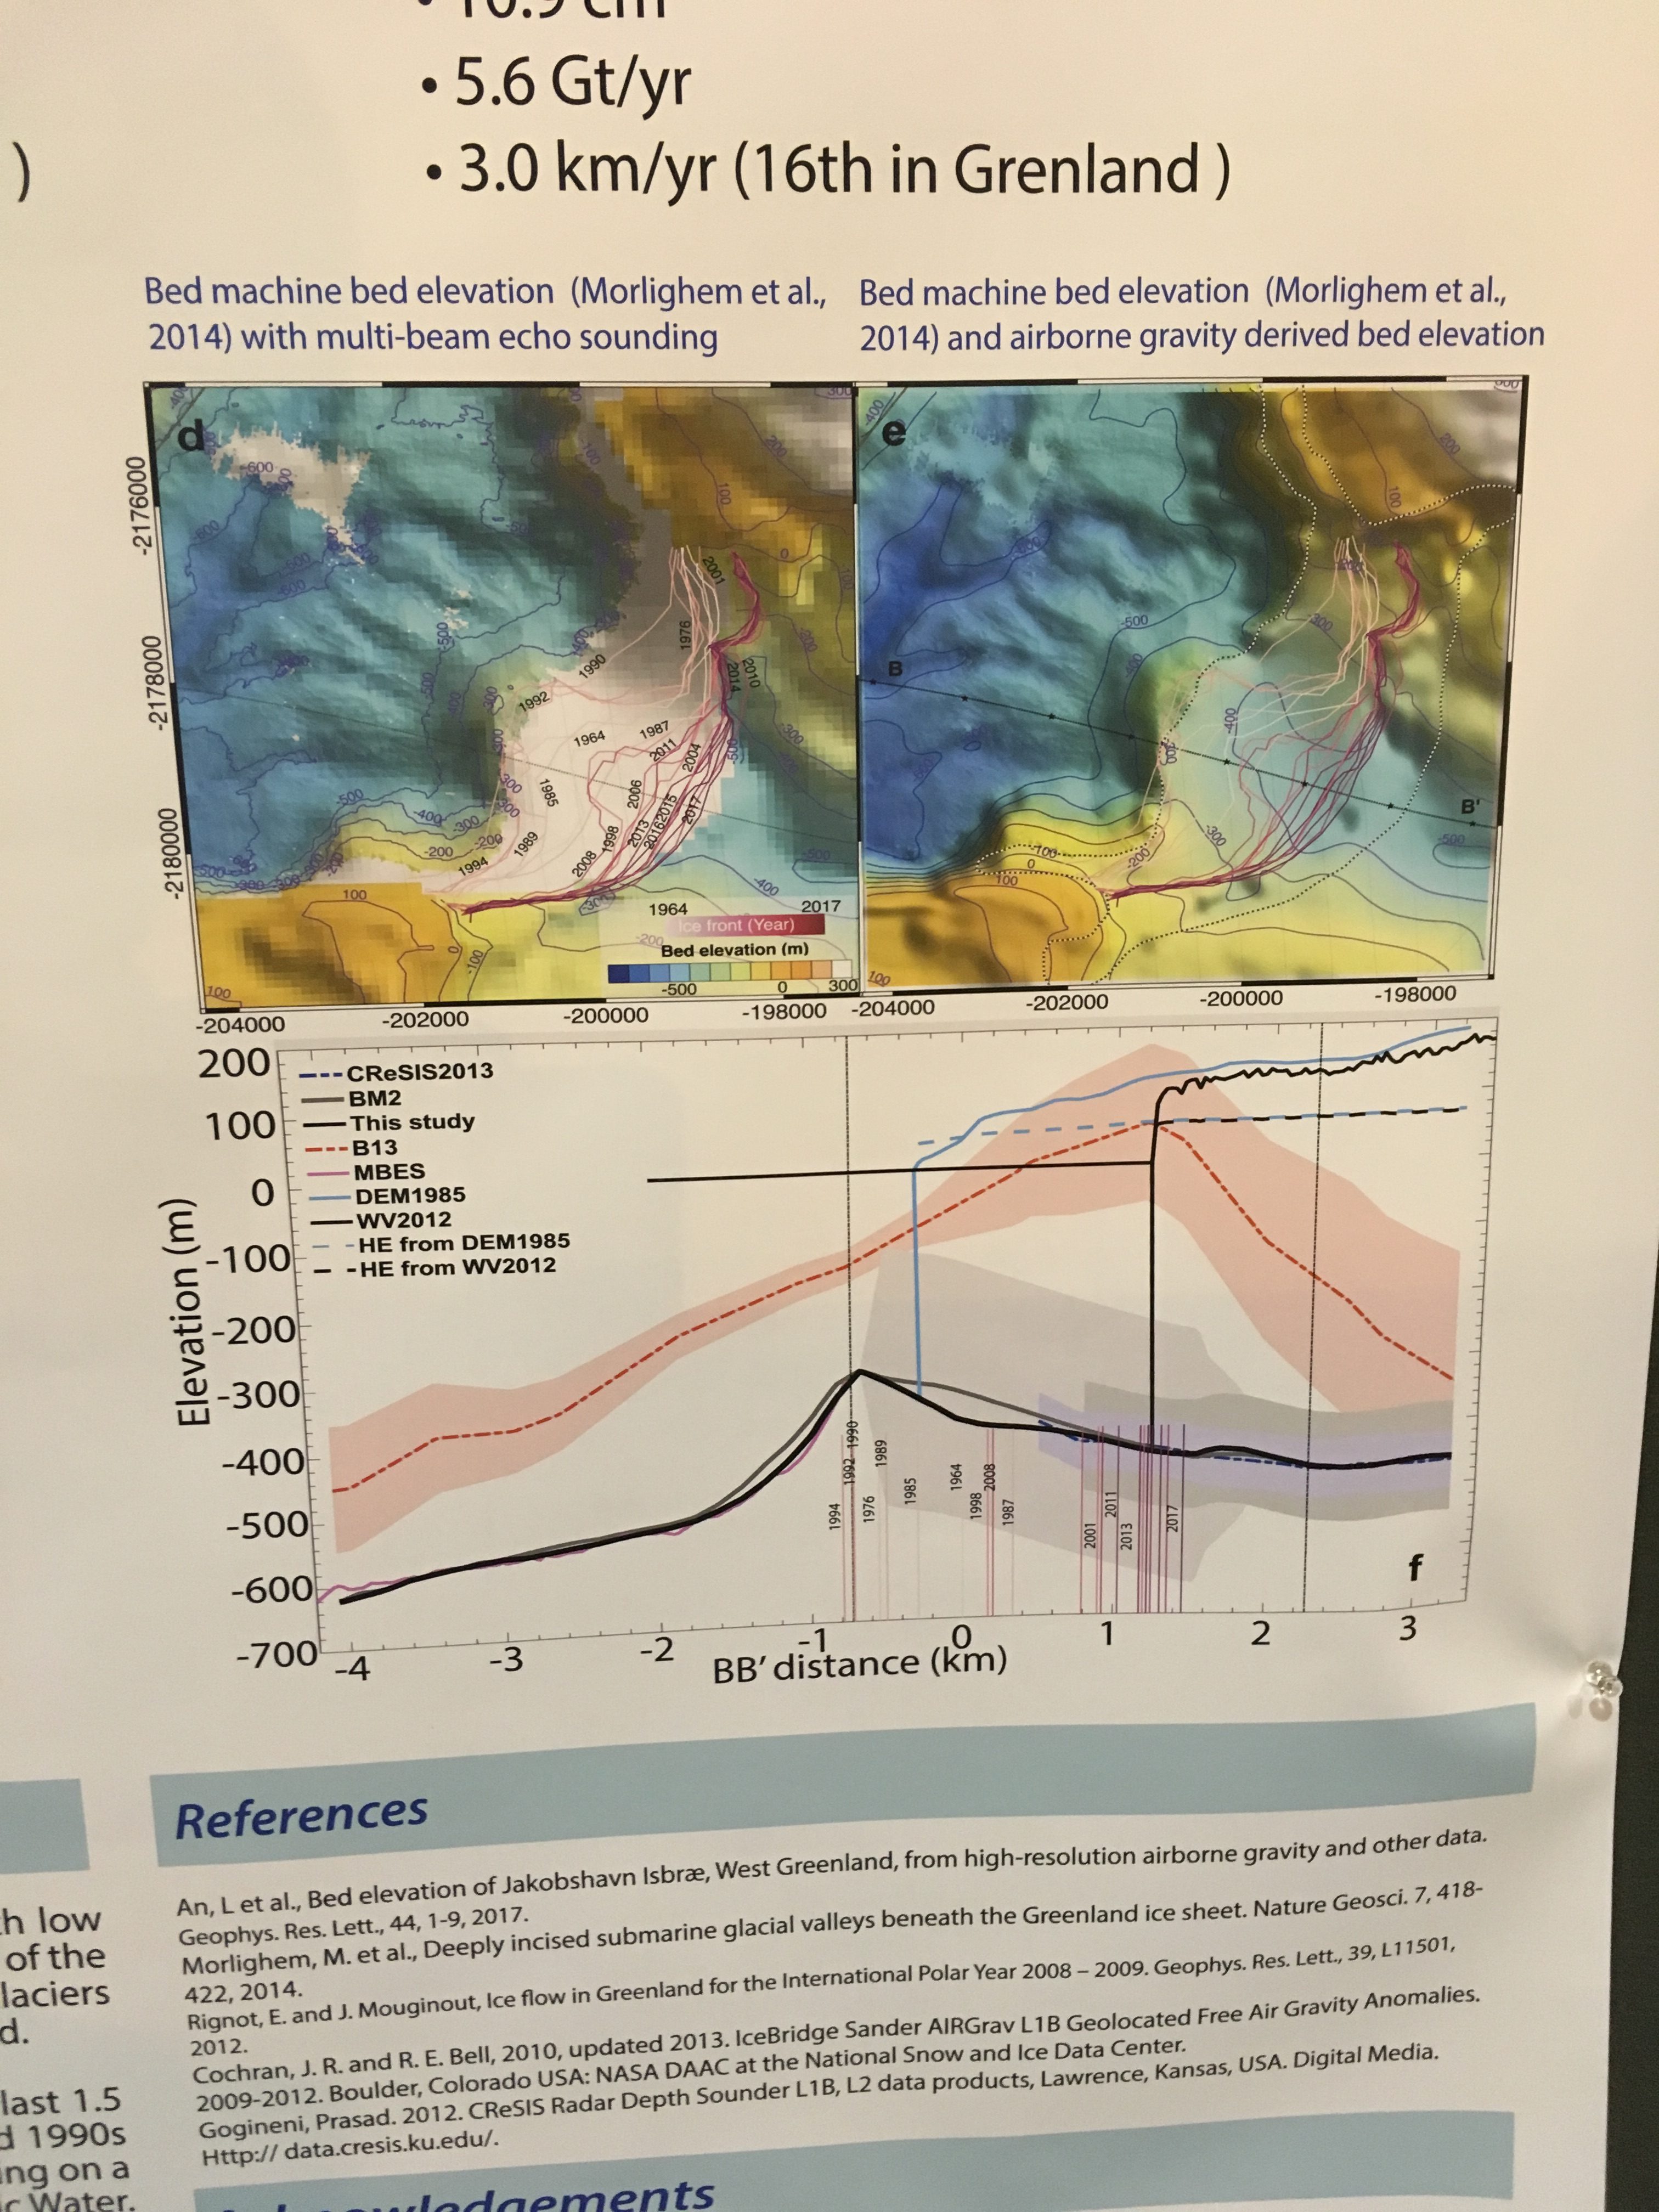
 Lu An from UCal Irvine used multiple sources to reconstruct bathymetry glacier bed topography near the grounding line of Sermeq Avangnardleq (AVA) and Sermeq Kujatdleq (KUJ) in central West Greenland.  They used high resolution airborne gravity data from AIRGrav and MultiBeam Echo Sounding data collected in the fjord. The seamless topography obtained across the grounding line reveal the presence of a 300-m sill for AVA that has stabilized its terminus.  For KUJ shown above the sill has helped stabilize the glacier though it has still retreated ~1 km and has led to iceberg stranding.