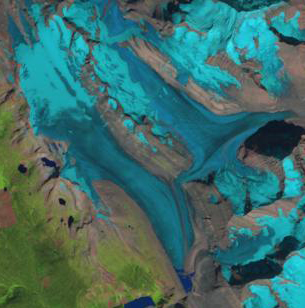
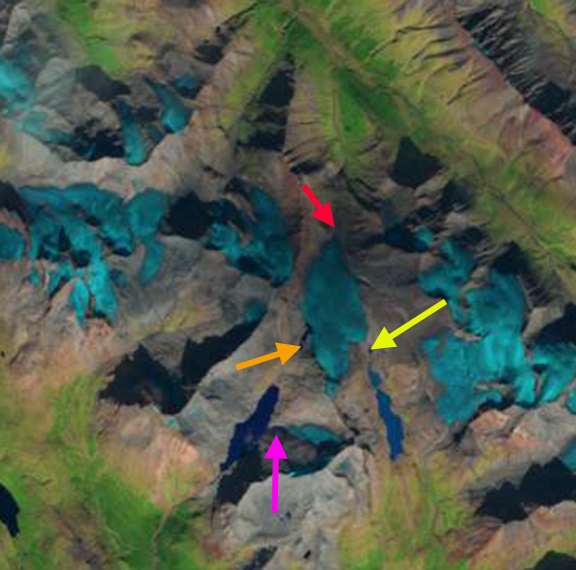
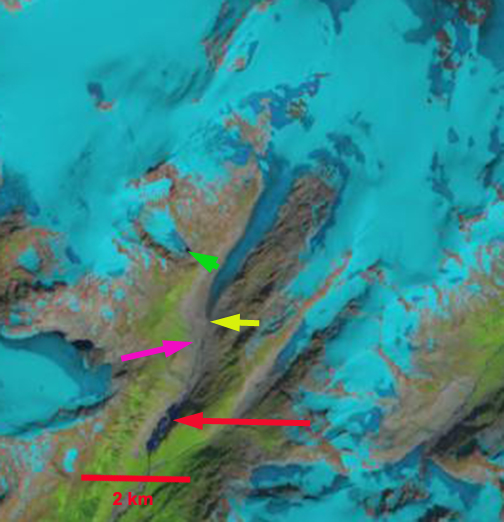
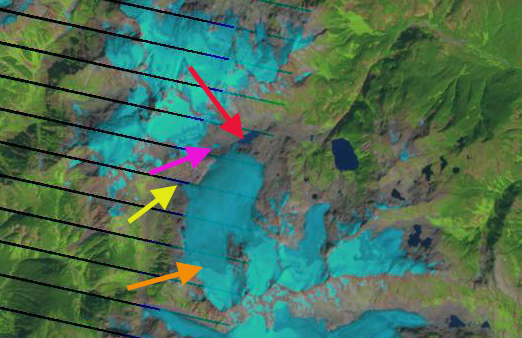
Swanson River glaciers, British Columbia in Landsat images from 1984 and 2019. EM=East Meade Glacier, CG=Canning, red arrows=1984 terminus, yellow arrow=2019 terminus, purple dots=snowline. Points 1-8 are specific glacier locations with very limited to no retained snowcover.
The Swanson River feeds into Tagish Lake in NW British Columbia. The watershed is host to dozens of glaciers. Here we exaine the retreat of the two largest glaciers in the watershed from 1984-2019, referred to as “East Meade” and “Canning Glacier” in this post. We also look at the loss of snowcover on glaciers across the watershed in 2018 and 2019. These glaciers are in the northeast sector of the Juneau Icefield, sharing a divide with the retreating Meade Glacier, Alaska. The Juneau Icefield Research Program focuses on glaciers to the south of these including the retreating Llewellyn Glacier.
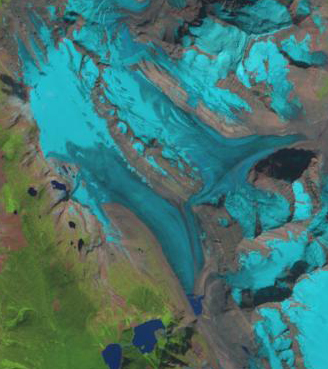
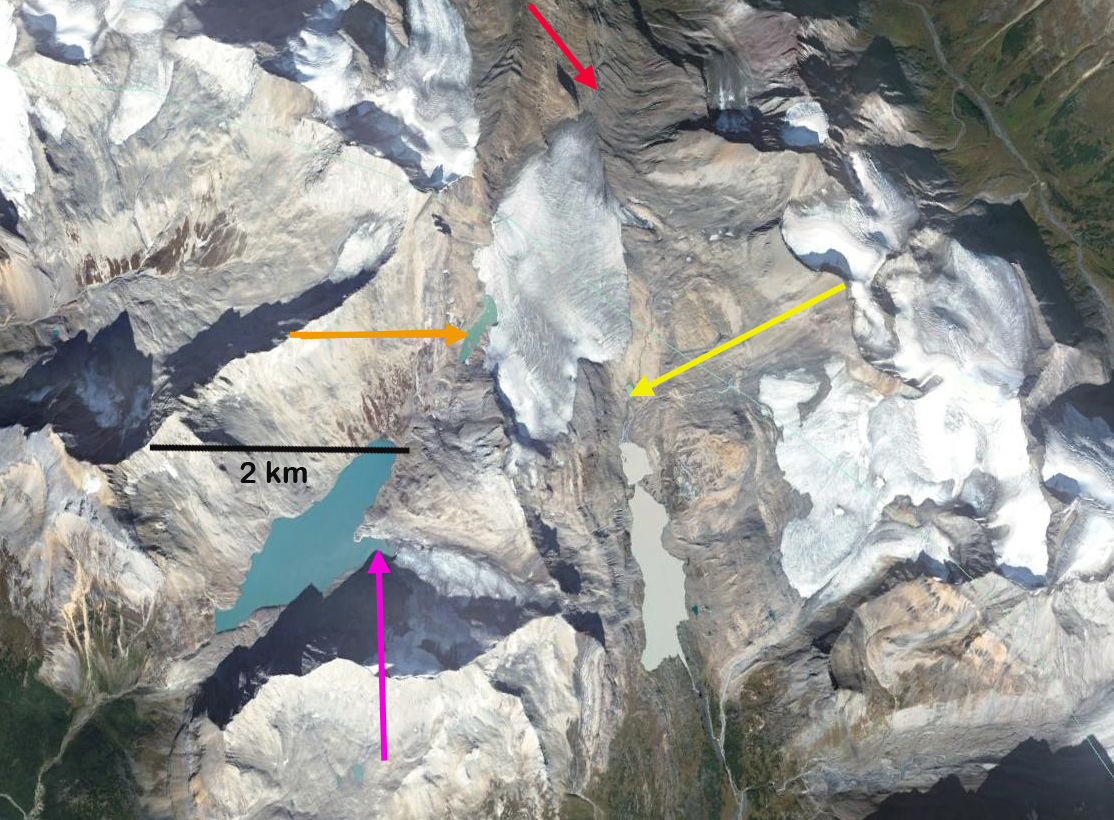
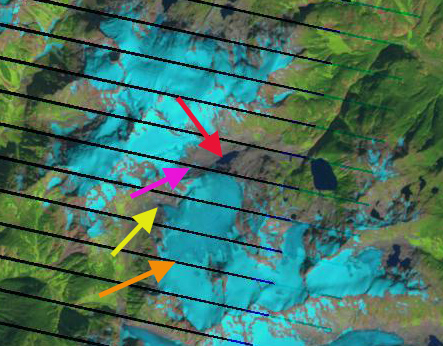
In 1984 the two glacier tongues terminated at 1000 m, red arrow and the snowline was at 1350 m, purple dots. This was a year of positive glacier mass balance on the Juneau Icefield, where I was working that summer. By 1998 there has ben modest retreat and the snowline is at 1400-1450 m. The retained snowpack at the end of the summer is limited to the upper reaches of the tributary glaciers. This year was a negative balance year on the Juneau Icefield where I was busy probing snowpack.
By 2018 Canning Glacier had retreated 1400 m since 1984 and terminated at 1100 m. East Meade Glacier had retreated 1100 m since 1984 and terminated at 1100 m. In 2018 there is no retained snowpack on East Meade Glacier. There is limited snowpack at the top of some of the tributaries in wind deposition zones, but many ofthe small alpine glaciers in the area have no accumulation zone. This summer led to the highest snowline ever observed on the Taku Glacier (Pelto, 2019). In 2019 the snowlineis even higher and the glaciers of the Swanson River basin are laid bare. There is no snowpack on East Meade (1) or on the adjacent tributaries at Point 2 and 3. There is no snowpack retained on Canning Glacier (4) or on the alpine glaciers east of the Juneau Icefield at Point 6 and 8. At Point 5 and 7 each has a small patch of retained snowpack at its upper margin close below a peak.
These back to back summers are the type of conditions that lead to the loss of alpine glaciers when they become frequent enough to remove any retained snowpack not just from that year, but from previous years. The retreat of East Meade and Canning Glacier is much less than Meade Glacier, 4 km 1986-2018, and similar to Warm Creek Glacier.
.
Swanson River glaciers, British Columbia in Landsat images from 1998 and 2018. EM=East Meade Glacier, CG=Canning, red arrows=1984 terminus, yellow arrow=2019 terminus, purple dots=snowline.
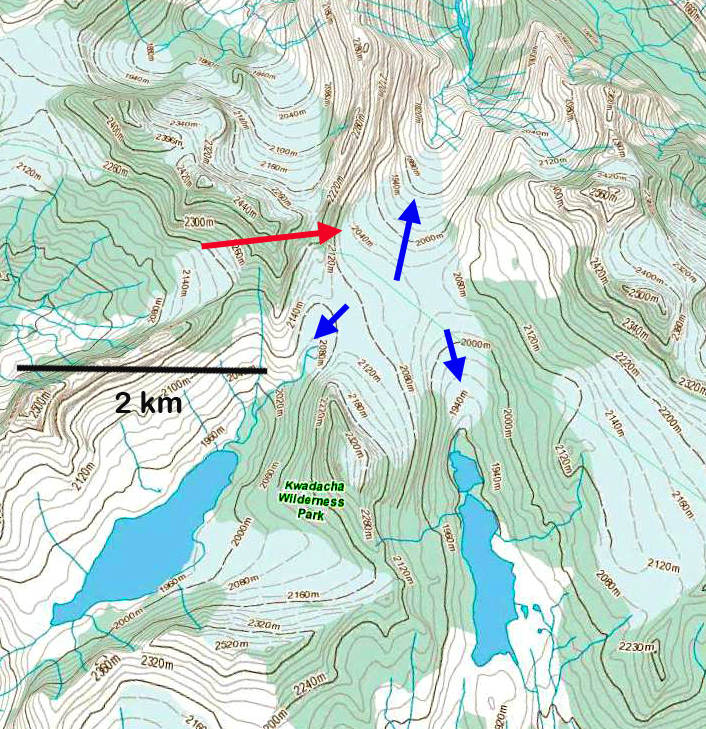
Canadian Topographic map of the area EM=East Meade Glacier, CG=Canning Glacier and TL=Tagish Lake
The southwest side of Kokanee Glacier from the ridge with Cond Peak at the Right and Sawtooth Ridge at center.
By Ben Pelto, PhD, UBC Mitacs Elevate Postdoctoral Research Fellow
Since 2013 I have been working on the Kokanee Glacier. Located just outside of Nelson in southeastern British Columbia (BC), the Kokanee Glacier is due north of the Washington-Idaho border. This work began as part of a five-year study of the cryosphere in the Canadian portion of the Columbia River. This project was carried out by the Canadian Columbia River Snow and Glacier Research Network — spearheaded by the Columbia Basin Trust. The glacier research, which included the Kokanee Glacier, was led by my former PhD supervisor at the University of Northern British Columbia Dr. Brian Menounos and myself. At the culmination of the project, we published a technical report, and a plain language summary of that report. When the five-year project officially ended in 2018, I learned of a BC Parks program called Living Labs, which offers funding for climate change research in BC Parks, particularly research which documents change and guides protected area management. With Living Labs funding in 2019-2021, I have kept the annual mass balance trips going — now a continuous nine-year record — and a winter mass balance trip in 2021. In conjunction with this, Brian Menounos has secured continued funding (continued from our 5-year project) from BC Hydro for LiDAR surveys of the glacier every spring and fall. These surveys are carried out by the Airborne Coastal Observatory team from the Hakai Institute.
During the 2021 spring trip, we found that the Kokanee Glacier had an average snow depth of 4.4 meters. Using snow density measurements collected with a snow-corer, we found that the winter balance for 2021 was 1.91 meters water equivalent (m w.e.). This value was lower than the 2013-2020 average of 2.18 m w.e. (Pelto et al. 2019).
Ali Schroeder probing snow depth on the Kokanee Glacier while Joel McBurney and Drew Copeland look on.
Ben Pelto with the snow corer with Tom Hammond and Micah May on Kokanee Glacier. Photo: Jill Pelto
With a below average winter balance, 2021 would need to feature a cool summer. Instead, multiple heat waves occured, with temperature records being broken across the province. Wildfires burned all over BC and the neighboring US states of Washington and Idaho, swamping the region in smoke for weeks on end. Rather than mitigate for a slightly-below-normal snowpack on the Kokanee, summer 2021 took a blow-torch to glaciers across the region.
We hiked into the Kokanee Glacier on September 12, stopping under a boulder to wait out proximal booms of thunder and flashes in the clouds. We got pelted with bursts of both hail and graupel, and soaked in the rain, before gingerly working our way up boulder field and talus that is climbers route up the Keyhole to the Kokanee Glacier. Like the satellite imagery had shown, there was no snow in sight on the glacier — bare ice only. Instead of my usual camp on the snow, we chose a climbers bivy site to set our tent.
Camp in the Keyhole — a total lack of snow forced us to skip camping on-glacier.
The Keyhole route, a challenging scramble with 43 lb packs.
Stepping out onto the glacier, we immediately ran into difficult terrain, crevasse bridges of snow or firn had collapsed, leaving bedroom-width crevasses gaping open, necessitating an exercise in maze navigation. Our first stop was a stake at 2600 m which typically retains snow (50 to 100 cms), but this year had lost 1.6 meters. In fact, two stakes drilled at the site in 2015 and subsequently buried by snow had melted out, demonstrating that all snow/firn from the intervening years had been lost. This observation clued me in to the magnitude of melt to expect this year.
The first stake visited, showing 1.6 m of melt
Exposed layers of firn in a crevasse by the stake, showing 1.5 m-thick annual layers — now being eaten away by melt.
Travel on the glacier was more challenging in spots, but overall faster, as the total lack of snow meant that most crevasse bridges were gone, requiring less probing of crevasse bridges and roped-travel. Later, using a satellite image from the dates of our visit, I mapped the retained snow cover, limited to two tiny patches high on the glacier’s east side. The accumulation area ratio (AAR), or the ratio of snow cover to bare ice/firn was <0.01, meaning that under 1% of the glacier was covered in snow.
The upper reaches of Kokanee Glacier to Cond Peak (2800 m) with no retained snow in 2021. Bare ice is exposed on the lower half of the image, and firn, or multi-year snow above
The brown surface is multi-year firn, exposed by the loss of snow. In a typical year, the snow line would be visible here. The white surface below the brown is bare glacier ice.
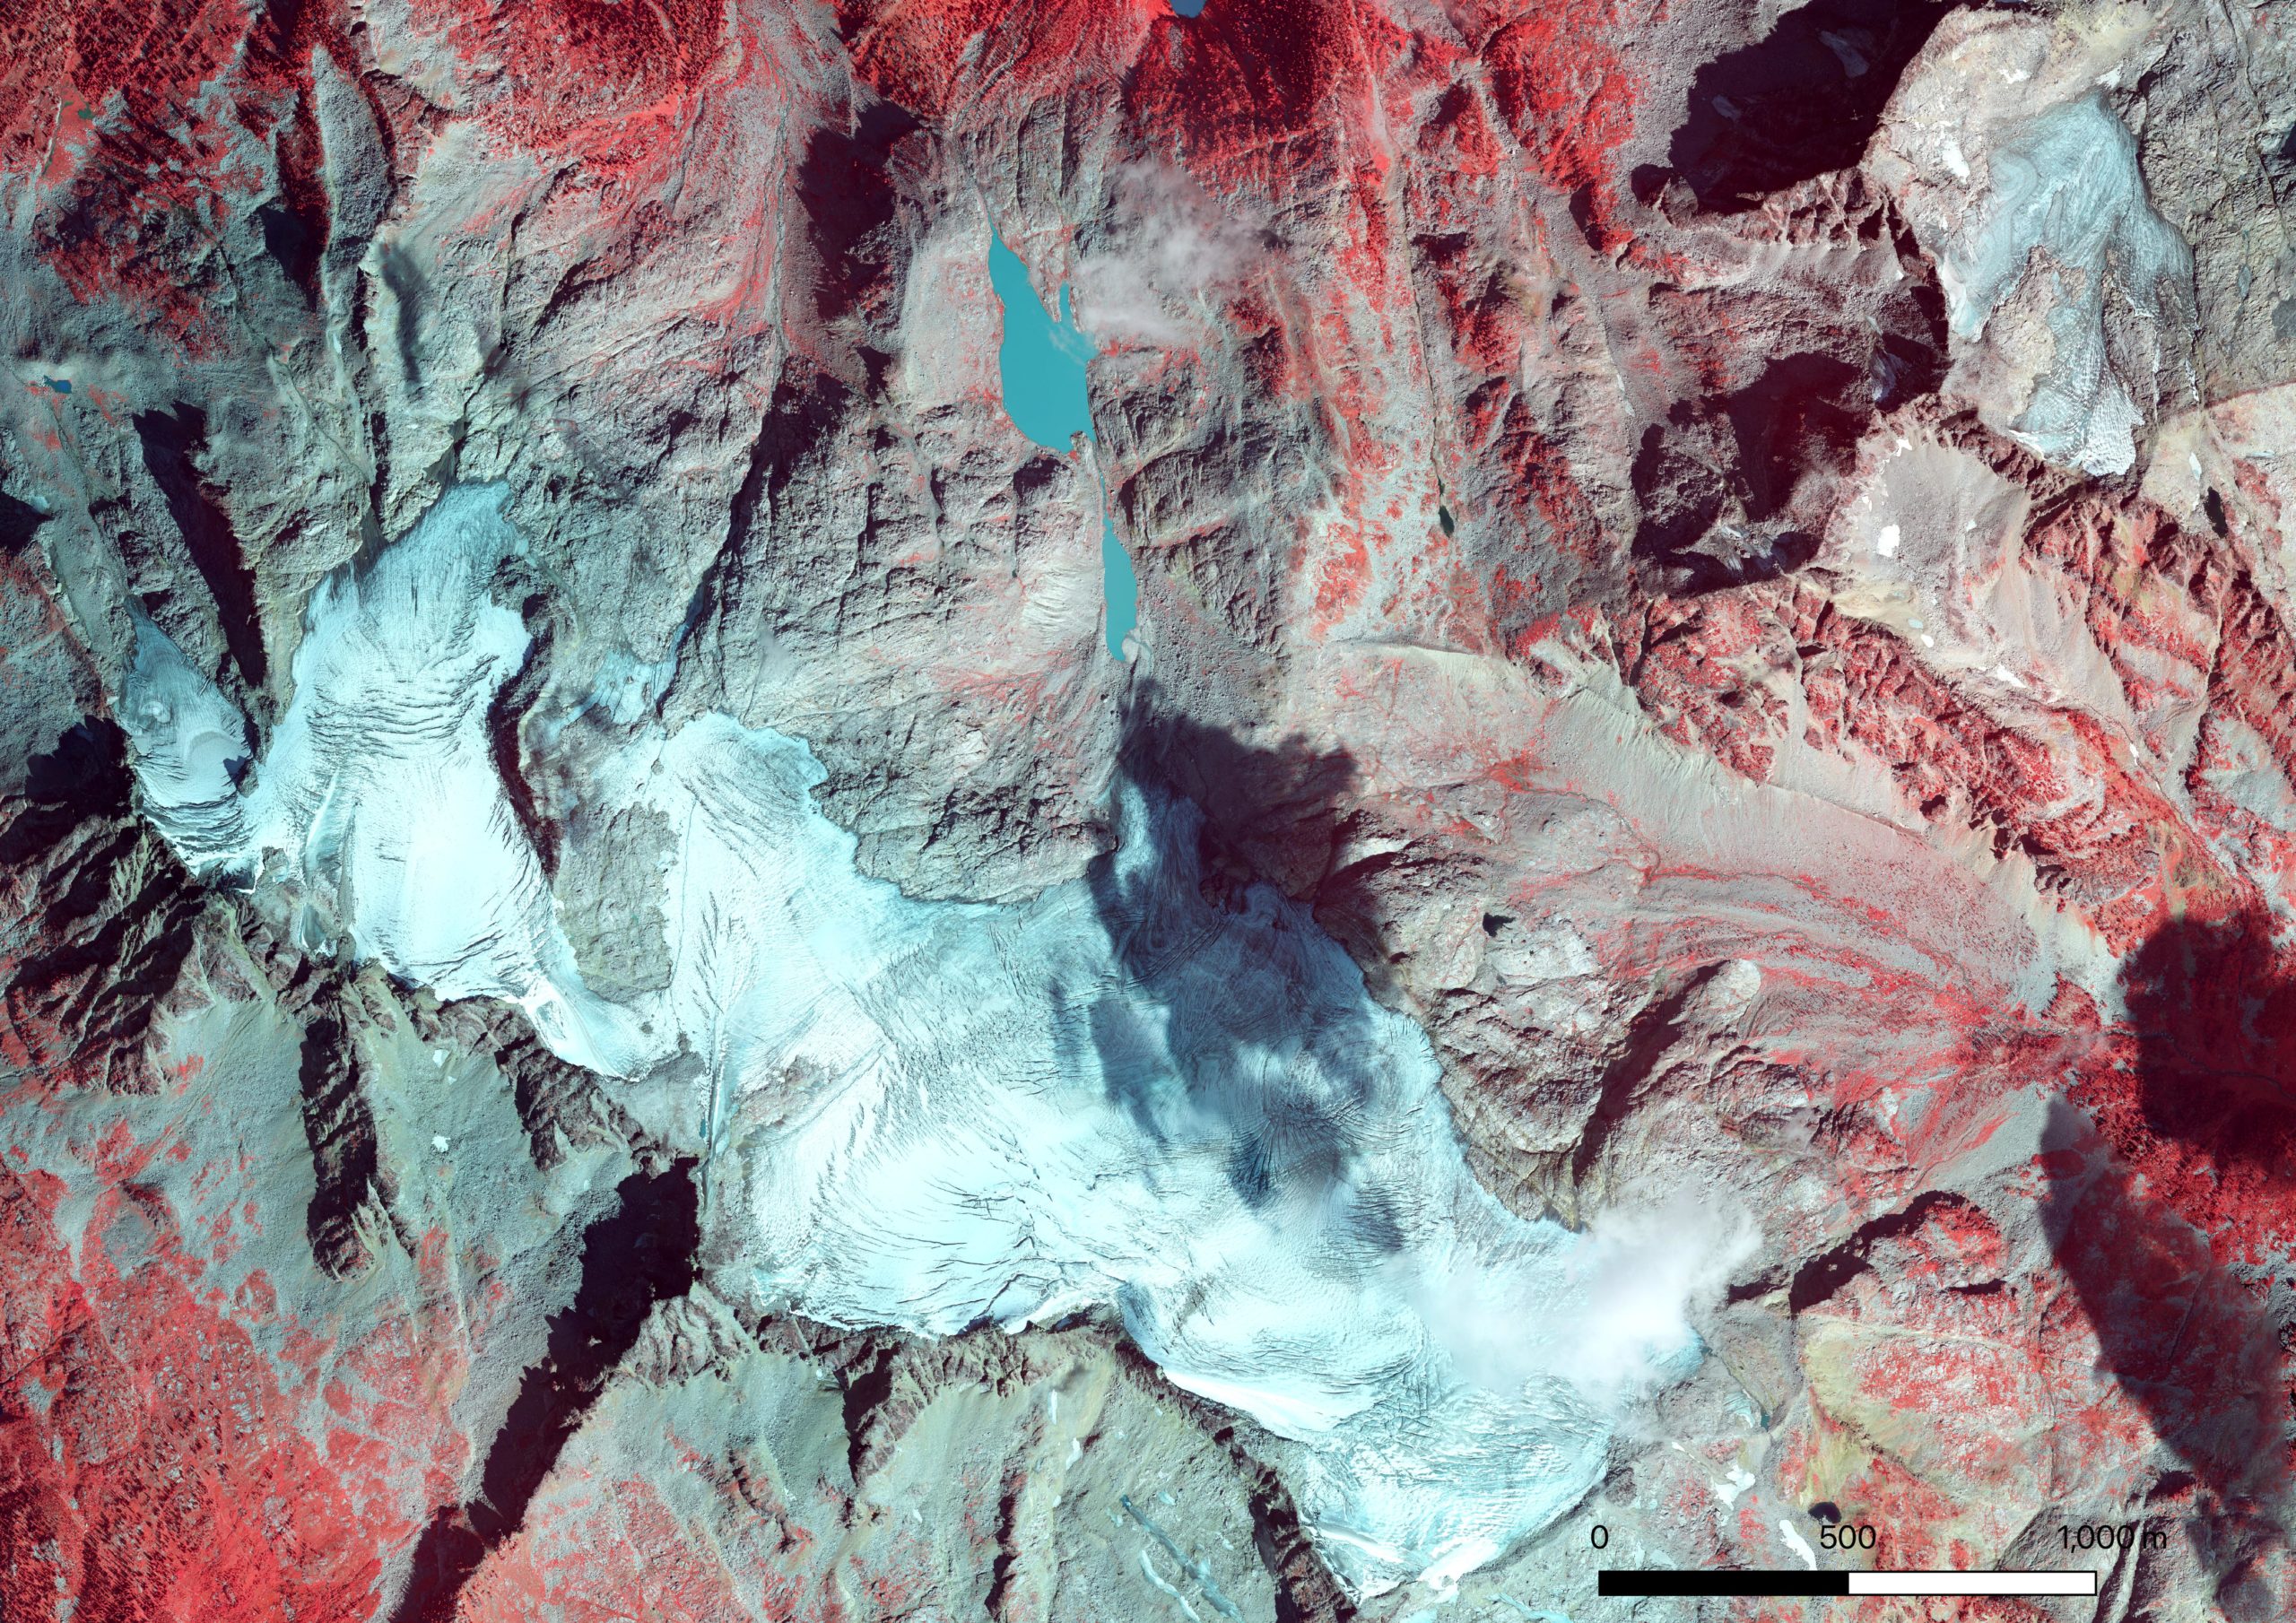
Near infrared-Red-Green 30 cm resolution ortho image of Kokanee Glacier from the Hakai Geospatial/ACO team on Sept. 2, 2021. Note how badly crevassed the glacier is, most crevasses are exposed with no retained snow. The white color and mottled appearance over the upper glacier is a skiff of overnight snow just a few centimeters thick that melted off the next day. Also note bare ice patches exposed under formerly perennial snow patches that have shrunk in recent years and now are disappearing.
Visiting the toe of the glacier, our lowest stake indicated just under 5 m of ice melt, double that of 2020. In May, this location had 3 m of snow; the combined melt of snow and ice (loss of winter snow and glacier ice) is termed the summer mass balance, and at this site was -6.2 m w.e., far higher than the usual -4 m w.e. I also noticed that much of the thin ice along the margin of the toe was gone, and a little rock nunatak (rock island) that appeared in 2015 (images below) became a bite out of the glacier rather than a island. We estimated that the toe experienced 60 m of retreat. Over the past 5 years, the Kokanee has lost an average of 16 m in length annually. Expecting to see above average thinning and retreat, I was still startled to see how diminished and thin the toe looked.
2015: a small hole forms in the glacier margin above the toe, Jesse Milner in the foreground
2021: the hole is now a bite out of the glacier with two prominent rock knobs
A week prior to my field visit, the Hakai Institute ACO team flew a LiDAR survey of the Kokanee Glacier as part of their work with Brian Menounos at UNBC. Comparing this year’s glacier surface with that from last year’s survey, Brian found a whopping 2.55 m of thinning. After mapping the glacier facies (ice/firn/snow) to represent on the density of the observed thinning, this equates to a glacier mass balance of -2.16 m w.e., higher than the previous record loss of -1.20 m w.e. in 2015.
LiDAR-derived height change 2020 to 2021 from 1 m resolution DEMs from Brian Menounos and the Hakai Institue ACO team. The black line is the 2021 glacier outline, note the bite out of the glacier above the toe to the NE corner of the glacier. Small red patches off-ice are seasonal snow patches losing mass. Points represent mass balance observation locations.Kokanee Glacier terminus from 2015 to 2021. 140 meters of retreat for 23 m/yr. Data in the GIF are from Hakai Institute and Brian Menounos of UNBC ACO glacier surveys.
Back home, I crunched the numbers from our glaciological observations of mass balance (consisting of 14 ablation stakes this year) and calculated a mass balance of -1.97 m w.e. With Brian, I published a paper in 2019 (Pelto et al. 2019) comparing glaciological (field) and geodetic (LiDAR) mass balance estimates and found them to be similar — if some factors like snow and firn density were carefully considered. The small difference between estimates is likely due to timing (the LiDAR mass balance is from 8/26/2020 to 9/3/2021, while the field mass balance is 9/12/2020 to 9/13/2021), and that there was a skiff of fresh snow (likely 5-10 cms) on the glacier during the 2020 LiDAR survey.
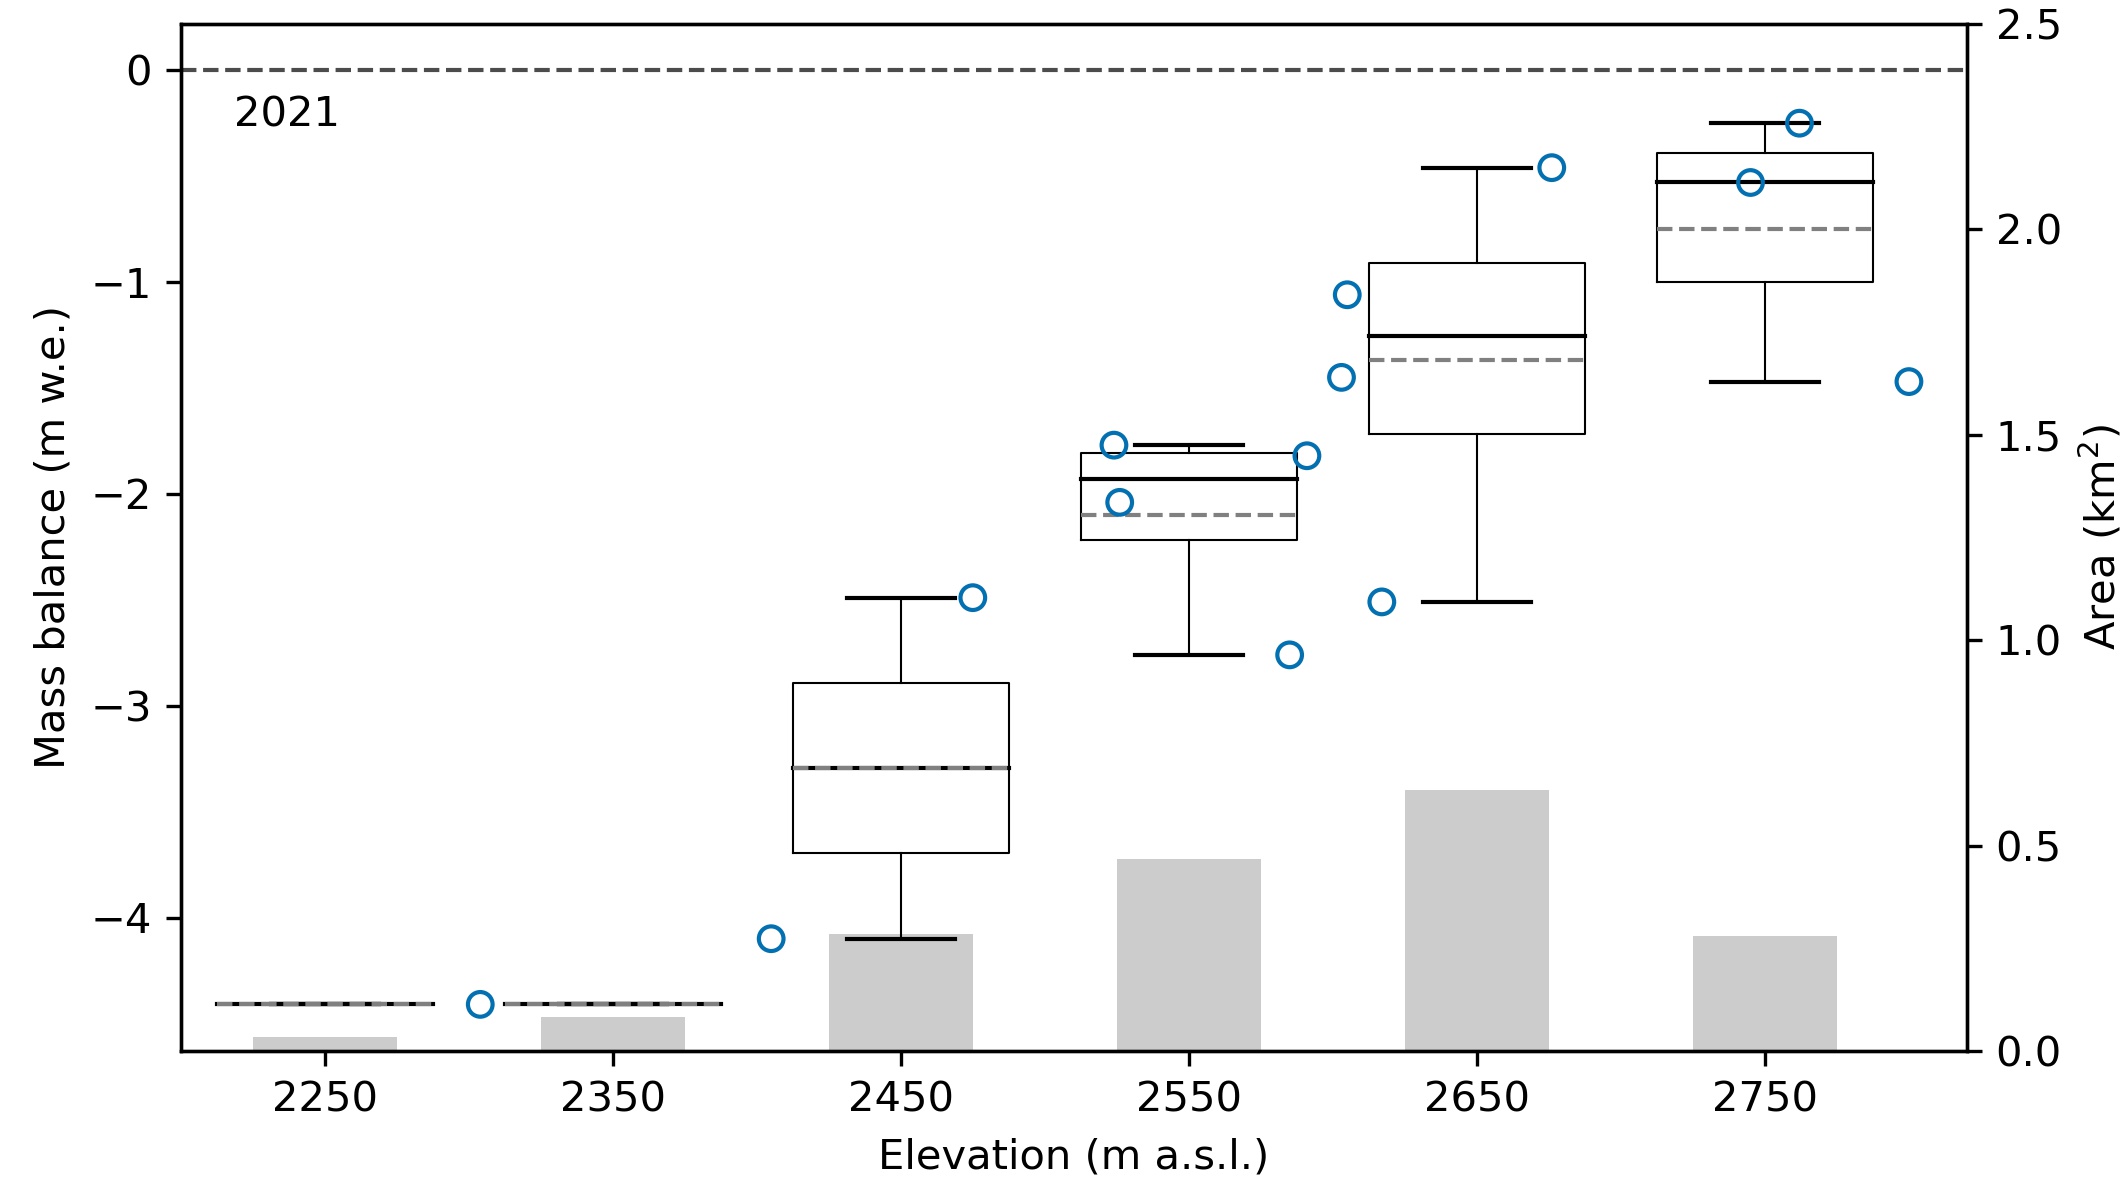
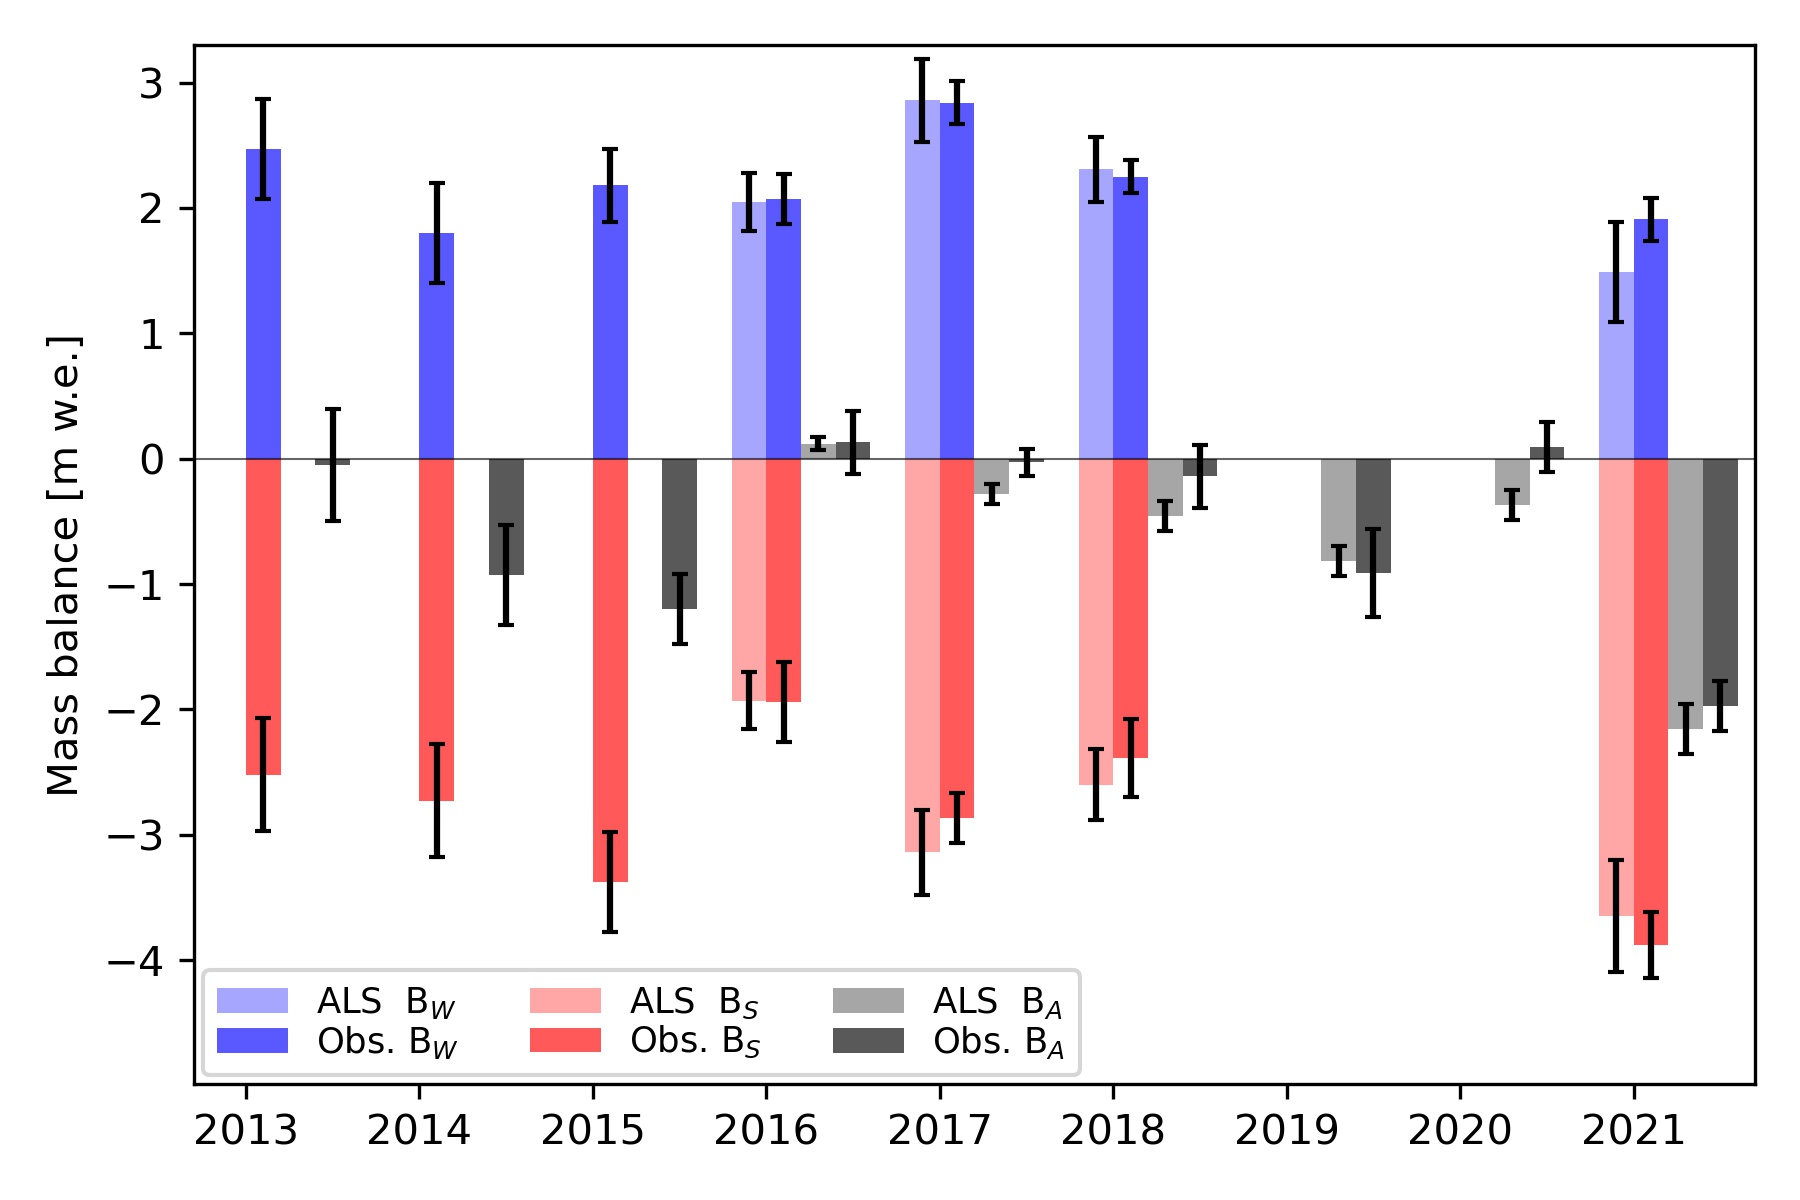
Kokanee 2021 glacier mass balance. Blue dots are observations. The boxplots show the 100 m bins used to estimate glacier-wide mass balance (median line in black, mean dashed grey line). The grey bars depict the area of the glacier for each 100 m elevation-bandSeasonal and annual mass balance for Kokanee Glacier from LiDAR and glaciological measurements for each balance year from 2013 to 2021 with 2σ uncertainties.
In 2017, I visited the Kokanee Glacier to measure it’s ice thickness using ice-penetrating radar. I found that the glacier on average was 43 m thick using my measurements to tune a glacier model. I published these results in the Journal of Glaciology (Pelto et al. 2020). In the five years since that work, the glacier has lost over 4.8 m of total thickness. That equates to a loss of over 11% of its total volume. 2021 alone wasted away 6% of the glacier’s total volume — an eye-watering number for a single year.
Cumulative mass balance for Kokanee Glacier 2013-2021 from both field and LiDAR measurments. LiDAR-derived mass balance began in 2016.
The heat of 2021 was an outlier, but years like 2021 and 2015 take a toll on the glaciers. Currently, glaciers in western North America are losing around 0.75 m of thickness per year (according to my work in the Columbia Basin (Pelto et al. 2019) and work by Brian Menounos for all of western North America (Menounos et al. 2018)). The better years for Kokanee Glacier (2016 mass balance: +0.12 m w.e.) pale in comparison. That meager surplus was lost the very next year (2017).
Herein lies the issue, positive mass balance years in recent decades are not large enough to offset even average years; hot dry summers take years off the lifespan of glaciers across western North America.
Losing 6% of it’s total volume in 2021, the best we can hope for Kokanee Glacier is a few near-neutral or positive mass balance years to cover back up the exposed firn, to keep the glacier albedo from becoming too dark and increasing the rate at which ice can melt.
Klinaklini Glacier comparison in Landsat images from 1987 and 2017. Red arrow 1987 terminus, yellow arrow 2017 terminus and snowline at purple dots.
Klinaklini Glacier is the largest glacier in the Coast Mountains of British Columbia between Vancouver and Prince Rupert. The glaier drains west and south from Mt. Silverthrone. There is significant accumulation area above 2500 m and the glacier terminates at 300 m. GLIMS noted the area in 2004 as ~470 km2. Glaciers in this region are retreating and losing volume, Schiefer et al (2007) noted that the rate of volume loss had doubled in the most recent decade. Clarke et al (2015) modeled a 70% loss in volume of all glacier in western BC by 2100. Here we examine Landsat imagery from 1987-2017, to identify changes. In particular examining the area of large icebergs in 2015-2017 generated from a rapid calving retreat that has occurred since 2010. The glacier drains in to Knight Inlet a famous area for salmon fishing.
I first saw this glacier in 1982 and at that time it ended on an outwash plain with a narrow lake/wide river leading from the terminus. In 1987 the terminus was at this same location, red arrow, with no significant lake at the terminus. The snowline in 1987 is at 1500 m. By 1995 a lake had formed across the width of the terminus. The lake was than 600 m long and the snowline was at 1600 m. In 2010 the glacier had retreated more than 1 km across its entire 1.3 km width. The lake at the terminus had a surface area greater than 1.5 km2 and was largely filled with icebergs. The snowline in 2010 is at 1500 m. By 2013 the main proglacial lake has expanded to a length of over 2 km and remained largely filled with icebergs. Retreat from 2010-2013 was as great as the retreat from 1995 to 2010. The snowline in 2013 was at 1600 m. From 2013 to 2014 there was no real change in the terminus position and the largest iceberg remained the same, pink (1). In 2015 the snowline is at 1600 m and is at 1700 m in 2016. In the side by side comparison of the terminus in 2015, 2016 and 2017 it is apparent that there was limited retreat from 2013, and a large calving event in 2017 generating an iceberg with an area of 0.7-0.9 square kilometers, pink (2), along with other smaller icebergs. The lake is now 4 km long, yielding a retreat rate of 130 m/year from 1987-2017. Nearly 50% of the retreat occurred in 2017. In 2017 the snowline is at 1700 m as well. The high snowlines each year are leading to mass loss, which leads to reduced flow through the ablation zone. The thinning terminus due to higher ablation and less flux from above is then more prone to breakup. The Klinaklini Glacier wins the prize for the largest observed iceberg produced by a glacier in Western Canada. The retreat is similar to other valley glaciers in the region Bishop Glacier, Jacobsen Glacier, Bridge Glacier and Klippi Glacier.
Comparison of the terminus, pink dots in 2015, 2016 and 2017. The red arrow is the 1987 terminus, yellow arrow the 2017 terminus and the largest icebe
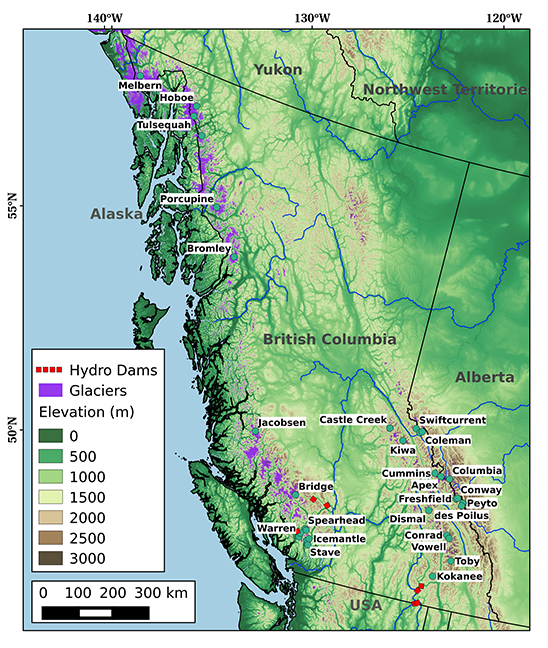
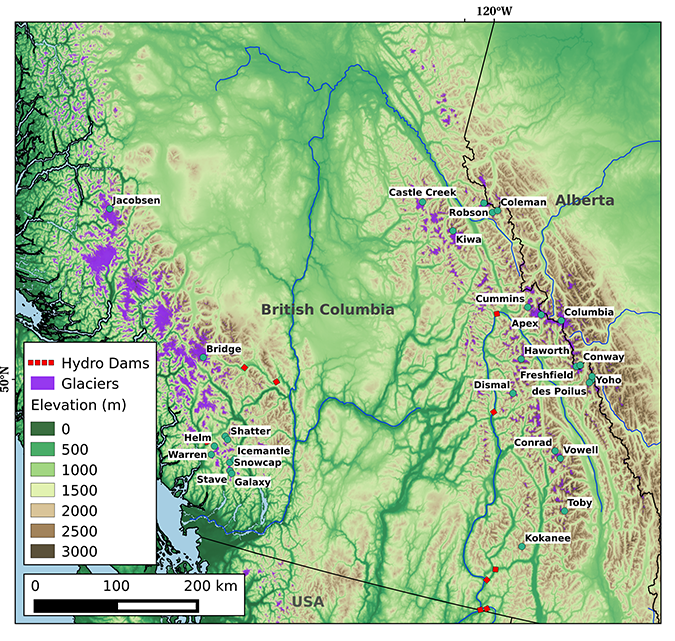
British Columbia is host to many mountain ranges; Purcell, Monashee, Bugaboo, Selkirk, Cariboo, Coat Range, Kootenay, Kwadacha are just some of the diverse mountain ranges that host glaciers and span climate zone. A shared characteristic today regardless of climate zone or mountain range is dwindling glacier size and volume. Bolch et al (2010) found that from 1985-2005 Alberta glaciers lost 25% of their area and BC glaciers 11% of their area. Tennant and Menounos (2012) examined changes of the Rocky Mountain glaciers including Alberta finding that between 1919 and 2006 glacier cover decreased by 590 square kilometers, 17 of 523 glaciers disappeared and 124 glaciers fragmented into multiple ice masses. Jiskoot et al (2009) examined the behavior of glaciers of the Clemenceau and Chaba Icefield and found that from the mid 1980’s to 2001 the Clemenceau Icefield glaciers had lost 42 square kilometers, or 14% of their area. Pelto (2016) reported on specific retreat of many of these BC glaciers. Below are links to 31 detailed post examining the changes in recent decades of British Columbia glaciers in response to climate change.
In the summer glaciers in many ranges are crucial water resources for aquatic life and hydropower. In BC 92% of electricity is generated by hydropower mainly from large projects. BC Hydro has 31 such large projects, including several heavily fed by glaciers: Bridge River, Mica, Cheakamus, Ruskin and Stave Falls. There are also run of river hydroprojects with a new one constructed by AltaGas, the 195 MW Forrest Kerr Project on Tahltan First Nation land on the Iskut River. The Iskut River like the Stikine River is heavily glacier fed. As spring begins glaciologists will be heading out to measure glacier mass balance a critical input to understanding current and future glacier runoff, such as the Columbia Basin Trust sponsored project overseen by Brian Menounos at UNBC, and field operation direct by Ben Pelto at UNBC.
Forrest Kerr Hydro is a run of river project relying on a weir instead of a dam to divert water into the intake.
There are also numerous salmon fed streams with critical glacier input, such as the Skeena River and Rivers Inlet. Stahl and Moore (2006) identified that discharge from glacierized and nonglacierized basins in British Columbia indicates the negative August streamflow trends illustrate that the initial phase of increase runoff causing by climate warming has passed and runoff is now declining. This is similar to further south in the North Cascades of Washington (Pelto, 2015).
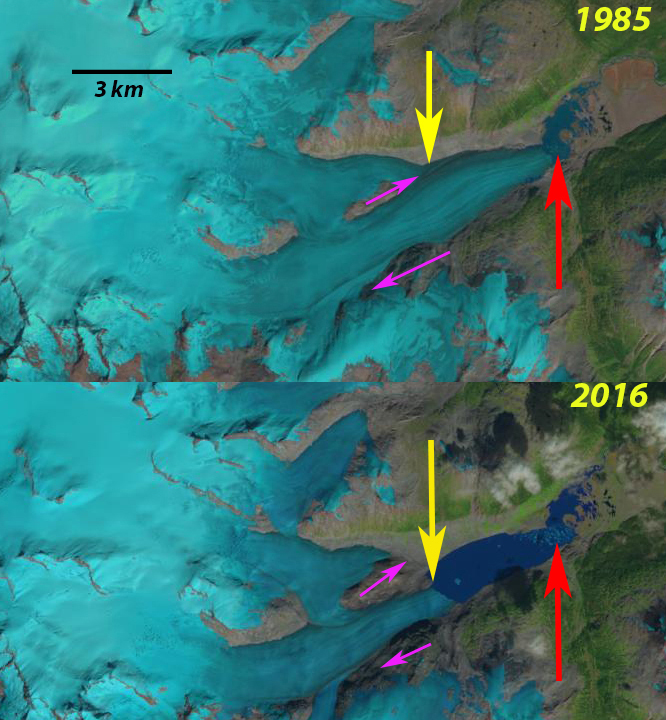
Bridge Glacier comparison in 1985 and 2016 Landsat Images. Red arrow is the 1985 terminus, yellow arrow the 2016 terminus and purple arrows indicate locations where tributaries have separated between the two dates.
Bridge Glacier is an 17 km long outlet glacier of the Lillooet Icefield in British Columbia. The glacier ends in a rapidly expanding glacial lake and had an observed retreat rate of 30 m per year from 1981-2005 by Allen and Smith (2007). They examined the dendrolchronology of Holocene advances of the glacier and found up to 2005 a 3.3 kilometer advance from the primary terminal moraine band, with the most extensive advances being early in the Little Ice Age. Chernos (2016) indicates that the glacier in 2013 is approaching the upglacier end of the lake, which will lead to reduced retreat rates. Here we compare Landsat imagery from 1985 to 2016 to determine response.
In 1985 the proglacial lake was 2.5 km long and 3.5 km upglacier of the terminus a major tributary joins. The transient snow line is 2100 m. By 1993 the glacier has retreated 200-300 m and the snowline was at 2150 m. By 2004 the terminus in a Google Earth image the terminus had retreated 1100 m since 1985. By 2004 the tributary from the north has separated from the north side of the glacier.There are also some evident areas where the proglacial lake is visible up to 800 m upglacier of the terminus. This suggests imminent collapse of this section of the terminus, which is afloat. Matt Chernos researching this glacier documents this well with images. Chernos (2016) observed that calving due to greater water depth and terminus buoyancy was key to retreat, but that most volume loss stemmed from melting. In 2016 the terminus has retreated beyond the former junction of the Bridge Glacier and the northern tributary. The glacier terminus is now within 500 m of a slope increase, likely marking the end of the developing lake basin. The total retreat in 31 years has been 4.1 km, this is a rate of 130 m/year, much faster than before. The 3 km retreat from 2004 to 2016 indicates a retreat of 250 m/year. The separation of the three tributaries, purple arrows are not impacted by calving and indicate melting alone is sufficient to drive significant retreat. The enhanced melt is also the cause of the high snowlines,, in 2016 the snowline is at 2150 m. The retreat is faster than nearby Klippi and Jacobsen Glacier, but both of those are also retreating fast.
This continued retreat and area loss will lead to glacier runoff decline in summer. This is crucial to the large Bridge River Hydro complex. This complex managed by BC Hydro can produce 490 MW of power, which is 6-8% of Province demand. Stahl et al (2008) note in their modeling study of the glacier that ,”The model results revealed that Bridge Glacier is significantly out of equilibrium with the current climate, and even when a continuation of current climate is assumed, the glacier decreases in area by 20% over the next 50 to100 years. This retreat is accompanied by a similar decreasein summer streamflow.” Lillooet News (2016) notes that BC Hydro has commissioned research on the glacier to investigate impact on runoff tiiming. This parallels our findings on the Skykomish River in the North Cascades, Washington Pelto (2011). The change in timing and the hydropower also impact salmon with late summer runs of chinook and fall coho runs.
Bridge Glacier comparison in 1993 Landsat Image. Red arrow is the 1985 terminus, yellow arrow the 2016 terminus.
2005 Google Earth image of Bridge Glacier, note tributary separation from the north.
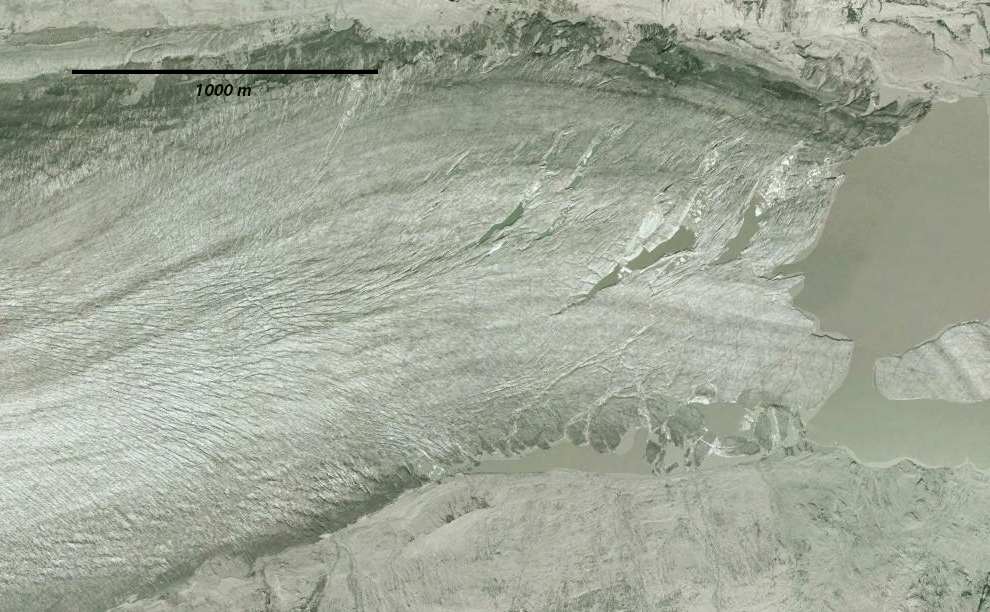
Closeup of terminus indicating exposures of proglacial lake upglacier of the terminus.Bridge Glacier Retreat Acceleration, BC, Canada
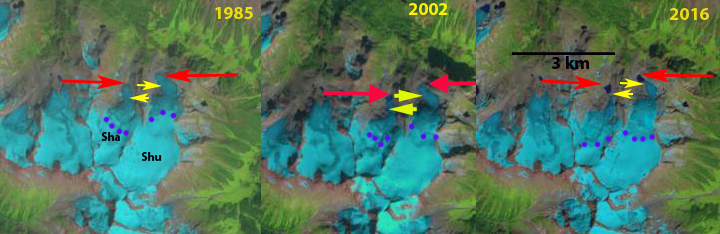
Red arrow is the 1985 terminus location and yellow arrow the 2016 terminus location. Note the formatiion of new lakes at end of both glaciers. Purple dots is the transient snowline in August of each year.
Shatter and Shudder Glacier are at the eastern end of the Spearhead Range in Garibaldi Provincial Park, British Columbia. Osborn et al (2007) mapped the Little Ice Age extent of the glaciers compared to the 1990’s margins indicating a retreat of 300 m for Shatter Glacier and 700 m for Shudder Glacier (see below). Koch et al (2009) identified the recession in area from 1928 to 1987 noting a 6% loss in Shatter Glacier and 22% loss for Shudder Glacier. Koch et al (2009) identify an 18% loss in area from 1987-2005, indicating considerable recent change in the Park. Here we use Landsat imagery from 1985-2016 to update glacier change.
In 1985 there are no lake at the terminus of either Shatter or Shudder Glacier. In 2002 a lake has formed at the terminus of Shudder Glacier, but not Shatter Glacier. In 2016 both glaciers have proglacial lakes that have formed, and the terminus of both glaciers have retreated from the lakes. This marks a retreat of 325 m on Shudder Glacier and 275 m on Shatter Glacier since 1985. Shudder Glacier retreated more rapidly in the first half of this period, while Shatter Glacier has experienced most of the retreat since 2005.
On Shatter and Shudder Glacier In 1987 the late August image indicates the snowline is at 2040 m, in mid-August 2015 the snowline is at 2250 m. In late August of 2014 the snowline was at 2120 m. In mid-August 2016 the snowline is at 2080 m. The higher snowlines are an indicator of mass loss for these glaciers that in turn drives retreat. The region continues to experience significant loss in glacier area and development of many new alpine lakes with glacier retreat, five new lakes since 1987 just in this range with seven glaciers. Spearhead and Decker Glacier are two other glaciers in the range that have developed new lakes since 1987. Nearby Helm Glacier is faring even worse.
Landsat images from 1987, 2014 and 2015 indicating the transient snowline position at the purple dots on Shatter and Shudder Glacier.
Pink Arrows indicate five new alpine lakes that have developed since 1987 as Spearhead Range glaciers have retreated
Map of Spearhead Range glacier extent for LIA-Bold lines and 1987, light lines from Osborn et al (2007)
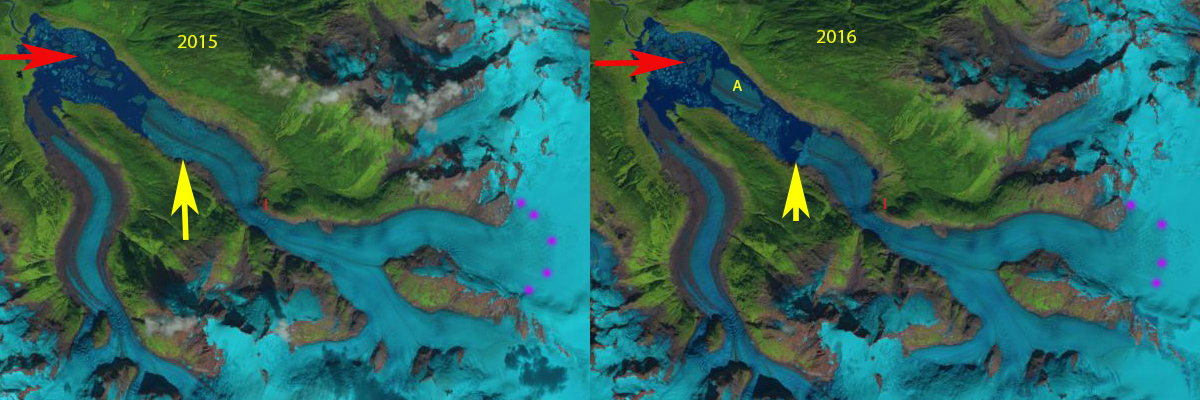
Landsat images from Sept. 2015 and Sept. 2016. Red arrow is the 1988 terminus and the yellow arrow the 2016 terminus. I marks an icefall location and point A marks the large iceberg.
Porcupine Glacier is a 20 km long outlet glacier of an icefield in the Hoodoo Mountains of Northern British Columbia that terminates in an expanding proglacial lake. During 2016 the glacier had a 1.2 square kilometer iceberg break off, leading to a retreat of 1.7 km in one year. This is an unusually large iceberg to calve off in a proglacial lake, the largest I have ever seen in British Columbia or Alaska. NASA has generated better imagery to illustrate my observations. Bolch et al (2010) noted a reduction of 0.3% per year in glacier area in the Northern Coast Mountains of British Columbia from 1985 to 2005. Scheifer et al (2007) noted an annual thinning rate of 0.8 meters/year from 1985-1999. Here we examine the rapid retreat of Porcupine Glacier and the expansion of the lake it ends in from 1988-2016 using Landsat images from 1988, 1999, 2011, 2015 and 2016. Below is a Google Earth view of the glacier with arrows indicating the flow paths of the Porcupine Glacier. The second images is a map of the region from 1980 indicates a small marginal lake at the terminus.
Landsat images from 1988 and 2016 comparing terminus locations and snowline. Red arrow is the 1985 terminus and the yellow arrow the 2016 terminus. I marks an icefall location and point A marks the large iceberg. Purple dots indicate the snowline.
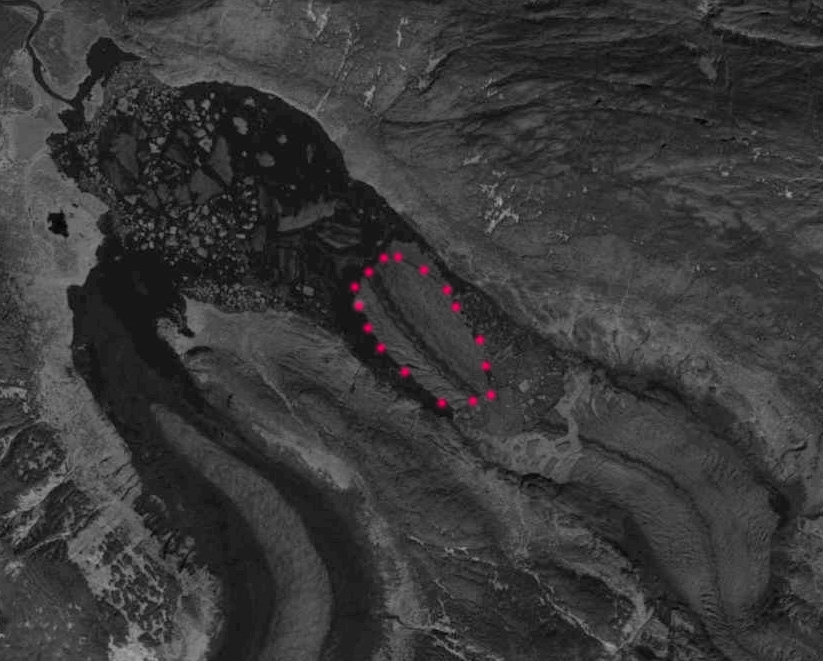
In 1988 a tongue of the glacier in the center of the lake reached to within 1.5 km of the far shore of the lake, red arrow. The yellow arrow indicates the 2016 terminus position. By 1999 there was only a narrow tongue reaching into the wider proglacial lake formed by the juncture of two tributaries. In 2011 this tongue had collapsed. In 2015 the glacier had retreated 3.1 km from the 1988 location. In the next 12 months Porcupine Glacier calved a 1.2 square kilometer iceberg and retreated 1.7 km, detailed view of iceberg below. The base of the icefall indicates the likely limit of this lake basin. At that point the retreat rate will decline.The number of icebergs in the lake at the terminus indicates the retreat is mainly due to calving icebergs. Glacier thinning of the glacier tongue has led to enhanced calving. The retreat of this glacier is similar to a number of other glaciers in the area Great Glacier, Chickamin Glacier, South Sawyer Glacier and Bromley Glacier. The retreat is driven by an increase in snowline/equilibrium line elevations which in 2016 is at 1700 m, similar to that on South Sawyer Glacier in 2016.
August 27, 2016 Sentinel 2 image of iceberg red dots calved from front of Porcupine Glacier.
Canadian Toporama map of Porcupine Glacier terminus area in 1980.
Google Earth view indicating flow of Porcupine glacier.
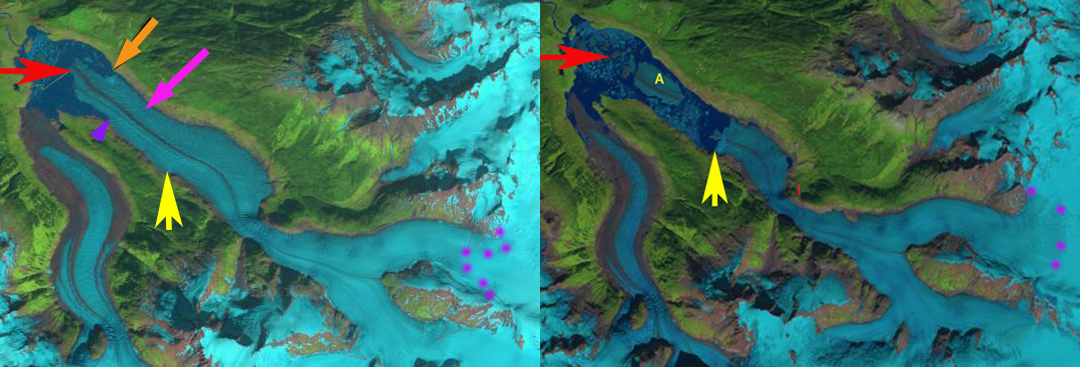
1999 Landsat image above and 2011 Landsat image below indicating expansion of the lake. Red arrows indicate the snowline. Purple, orange and yellow arrows indicate the same location in each image.
Comparison of the Cummins Glacier from 1986 to 2015. Purple arrows indicate upglacier thinning and disconnection. Red arrow indicates 1986 terminus position. Note the lack of snowcover in 2015.
The Cummins Glacier is part of the Clemenceau Icefield Group in the Rocky Mountains of British Columbia. The Cummins Glacier via the Cummins River feeds the 430 square kilometer Kinbasket Lake, on the Columbia River. The lake is impounded by the 5,946 MW Mica Dam operated by BCHydro. Jiskoot et al (2009) examined the behavior of Clemenceau Icefield and the neighboring Chaba Icefield. They found that from the mid 1980’s to 2001 the Clemenceau Icefield glaciers had lost 42 square kilometers, or 14% of their area. Tennant and Menounos (2012) examined changes of the Rocky Mountain glaciers and found between 1919 and 2006 that glacier cover decreased by 590 square kilometers, 17 of 523 glaciers disappeared and 124 glaciers fragmented into multiple ice masses. Here we examine the Landsat images from 1986-2015 to illustrate that Cummins is one of those fragmenting glaciers.
Cummins Glacier on the western side of the Clemenceau Icefield shares a connection with Tusk Glacier.
In 1986 Cummins Glacier had a joint terminus with the main southeast flowing branch and the west flowing branch terminating at the red arrow. The glacier also had a substantial connection, purple arrow, with Tusk Glacier that flows east terminating northeast of Tusk Peak. There are other connections with other high elevation accumulation areas, purple arrows. In 2013 and 2014 Cummins Glacier had less than 20% retained snowcover by the end of the melt season. Typically 50-65% of a glacier must be snowcovered at the end of the summer season to be in equilibrium. In 2015 conditions were even worse with no retained snowcover, in fact there is only minor patches of retained firn from previous years. The lack of a persistent accumulation zone indicates a glacier that cannot survive the climate conditions (Pelto, 2010). By 2015 a proglacial lake had formed at the terminus that is 500 m long, representing the retreat during the thirty year period. The west flowing portion of the Cummins has detached from the larger branch. The connection to Tusk Glacier is nearly severed, and in terms of flow is effectively ended. Retreat of the margin higher on the glacier is also evident at each purple arrow. Tusk Glacier is no longer connected to Duplicate Glacier, and has retreated to the north side of Tusk Peak. The dominant change in Cummins Glacier has been thinning, it should now be poised for a more rapid retreat.
The result for Kinbasket Lake of the loss of the collective large area is a reduction in summer glacier melt and summer glacier runoff. The annual runoff which will be dominated by annual precipitation would not change just because of the glacier loss as noted in cases like the Skykomish Basin (Pelto, 2011) and on Bridge River (Stahl et al 2008).
2013 Landsat image indicating 20% retained snowcover with a month left in the melt season.
Landsat image 2014 about 25% retained snowcover with three week left in the melt season.
Google Earth Image of Cummins Glacier location to Kinbasket Lake.
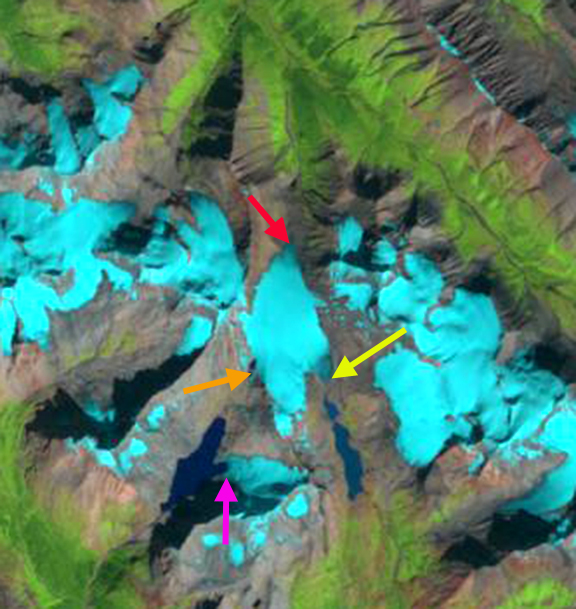
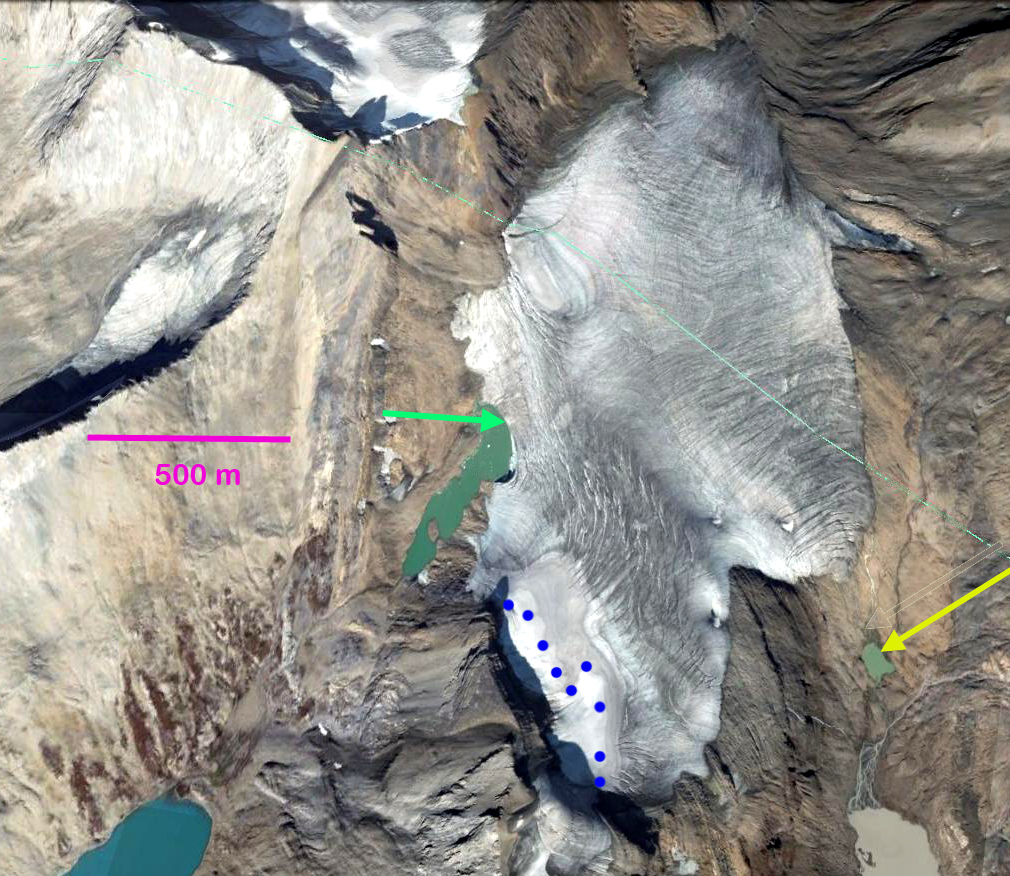
Kwadacha Wilderness Provincial Park in Northern British Columbia is host to numerous glaciers. Here we focus on an unnamed glacier that drains north into the Kechika River, which joins the Laird River. This glacier straddles both a watershed divide. The map of the glacier indicates the three separate termini of this glacier. Bolch et al (2010) noted that this area of BC lost 15% of its glacier area from 1985 to 2005. A comparison of Landsat imagery and Google Earth imagery during the 1994-2013 period indicate the changes to this Kwadacha Park glacier. In 1994 the glaciers three termini are at the red-northern terminus, yellow-southeaster terminus and orange-southwestern terminus arrows. A separate glacier ends at the margin of an alpine lake at the violet arrow. In 1995 there is no snowcover retained on the glacier. In 2001 the terminus at the orange arrow has retreated leading to lake expansion and at the red arrow. By 2013 the glacier’s northern terminus has retreated 250-300 m since 1994 and now terminates at the end of a rock rib. The southeastern terminus has retreated 250 m losing most of this glacier tongue. The southwestern terminus has retreated 300 m, and some calving is occurring. The glacier also has no retained snowpack in 2013. A glacier that consistently loses all of its snowpack cannot survive (Pelto, 2010). This glacier falls into that category. The retreat is evident in the Google earth image with the arrows marking the 1994 terminus locations. A closeup of this image indicates the lack of retained snowcover, blue dots mark snowline. The southwestern terminus calving margin is noted at the green arrow. The near stagnant nature of the northern terminus is also evident with the lack of crevassing. This glaciers will continue to thin and retreat and with current climate will not survive. The retreat is similar to that of other glaciers in the region including Snowshoe Glacier, Yukon, Great Glacier and Freshfield Glacier.
1994 Landsat image
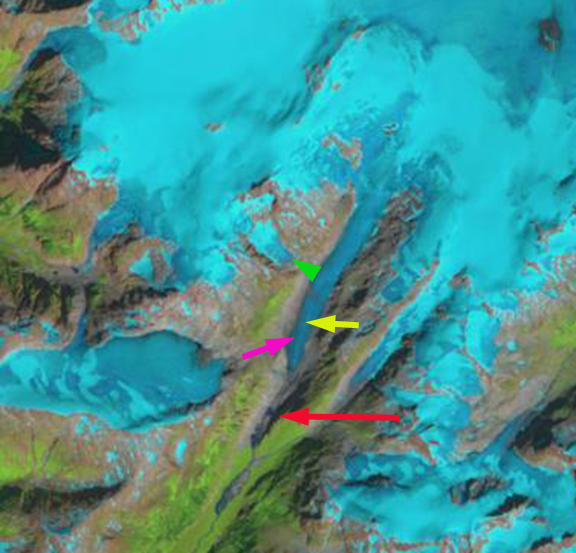
“Nass Peak” Glacier is a 5 km long unnamed valley glacier that feeds Coast Mountain Creek and then Nass River. The closest community is Kitsault, BC on the north side of the small icefield from which the glacier originates. Here we examine changes in the is glacier in Landsat imagery from 1986 to 2013. In 1986 the glacier terminated at the red arrow, this is also approximately the mapped terminus position. The terminus is near the nose of a long ridge at 650 m in 1986. By 1997 the glacier had retreated 800 m to a location adjacent to the southern outlet stream from another glacier in a side valley. By 2010 the glacier has retreated behond the northern outlet stream of the side glacier, pink arrow and almost too the yellow arrow. In 2013 the glacier has retreated just beyond the yellow arrow a distance of 2000 meters since 1986 and is at an elevation of 850 m. For a glacier that was 7.5 km long and is now 5.5 km long that is a 27% loss of length in 27 years. The green arrow point to the separation between a side glacier and the Nass Peak Glacier, this expanded 250 m both from retreat of the side glacier and the lateral thinning at this elevation of Nass Peak Glacier. The last image is a 2009 Google Earth Image indicating the mapped terminus outline to the 2009 terminus.
The Nass Peak Glacier retreat is larger as a percentage of the glacier, but similar in distance than the nearby Porcupine Glacier, BC, Bromley Glacier, BC, Jacobsen Glacier, BC, Chickamin Glacier, AK and Patterson Glacier, AK. Nass Peak Glacier also has lacked a proglacial lake which typically enhances retreat via calving, making the retreat quite significant in terms of surface mass balance loss.
1986 Landsat Image
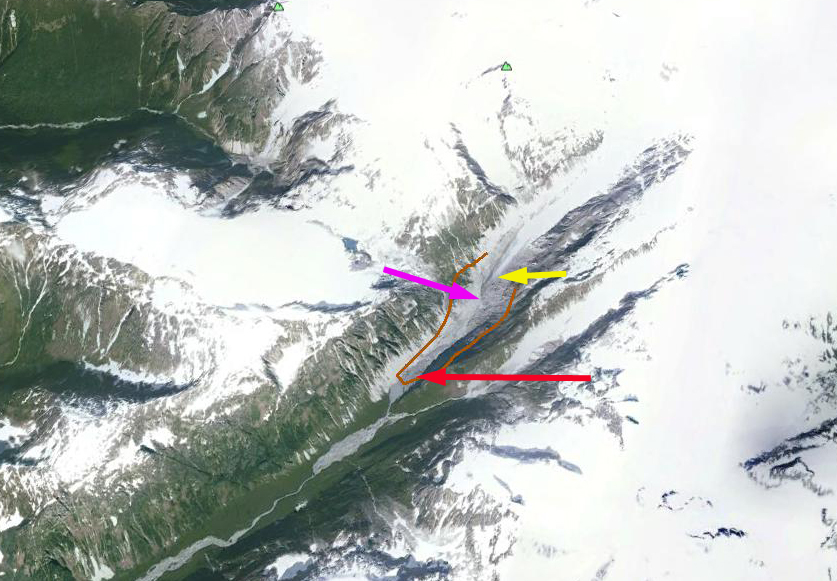
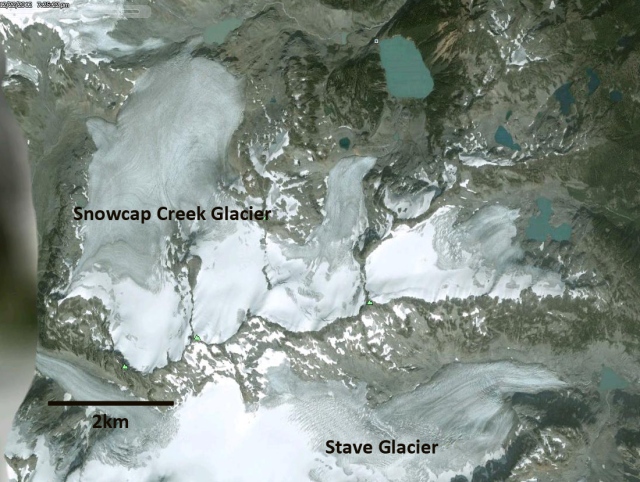
Snowcap Creek Glacier is one valley north of Stave Glacier in the Garibaldi Provincial Park Region of British Columbia. The retreat of glaciers in this region has been well documented by Koch et al (2009). The response varies from a glacier like the Helm Glacier which is melting away to the Snowcap Creek Glacier which is has been rapidly retreating but has remained vigorous.
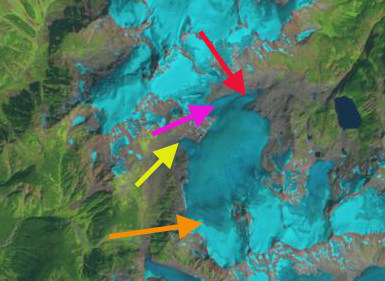
Landsat images and Google Earth images are used to document the development of a lake at the terminus of the glacier. In 1992 there is no lake at the main terminus, red arrow or subsidiary terminus at the yellow arrow. There is also a connection between the terminus and the glacier to the north at the magenta arrow. By 2009 there is a new lake at the main terminus that is 700 meters across the glacier reaches the western shore of this lake. A smaller lake has formed at subsidiary terminus, yellow arrow. The terminus is no longer connected to the glacier to the north at the magenta arrow. By 2012 the glacier has retreated 800 meters from 1992 and no longer reaches the western margin of the new unnamed lake, red arrow. The subsidiary terminus lake has expanded but is still less than 100 meters across.
In each image the snowline is noted by a yellow-orange arrow, the glacier continues to have a persistent accumulation, which indicates it can survive current climate. A closer examination of the terminus in 2006 from Google Earth indicates the two new lakes, the detached ice remnant and active crevassing of the glacier surface close to the terminus. In 2006 the glacier terminus still reaches the newly formed lake. The active crevassing begins within 300 meters of the current terminus. The ice tongue reaching down to the lake has already retreated from it and this narrow tongue will be lost soon.
The combined Melbern and Grand Pacific Glacier with a length of 55 km and width of 2-5 km, is a large valley glacier draining from the Saint Elias Mountains near the British Columbia-Alaska boundary. The glacier separates into two distinct glacier termini at Grand Pacific Pass. One of the tongues, Melbern Glacier, flows 20 km northwest ending in . Grand Pacific Glacier flows southeast to Tarr Inlet of Glacier Bay, just across the Alaska boundary. The Melbern Glacier turns north and ends in Lake Melbern. Lake Melbern began to form around 1979 as noted by Clague and Evans (1994). By 1986 the lake had expanded greatly as the former tributary to Melbern Glacier, Konamoxt Glacier had separated, and a 7km retreat of Melbern Glacier from the Konamoxt Glacier had ensued, first image from their paper. Clague and Evansin the second image further note that the ice dam of the Konamoxt Glacier that blocks Melbern Lake had broken by 1991 and the lake level had dropped. The retreat has continued unabated up through 2009. Here we use a series of Landsat images and one Google Earth Image to illustrate the retreat up to 2013. The first is a 1986 Landsat Image, K=Konamoxt and M=Melbern. In this image Konamoxt still blocks Melbern Lake and Melbern Glacier terminates adjacent to another tributary from the south, orange marks the 1986 terminus of both glaciers. The second image is a false color Landsat image from 2001. Konamoxt Glacier extends partly across the lake but not completely. The lake to the northwest of Konamoxt is filled with icebergs. Melbern Glacier has retreated 3 km since 1986. The third image is the Google Earth image also from 2001 showing the 1986 margin as well, in orange and the 2007 terminus in purple. The fourth image is from 2007, indicating a 1.5 km retreat of Melbern Glacier in the last six years. By 2013 the retreat is 2.25 km since 2001 and 5.25 km since 1986. Konamoxt Glacier no longer reaches Lake Melbern proper and is beginning a retreat up its own valley. The lake itself has changed color and lost its fleet of icebergs. The last image is from July 2013 and Lake Melbern is now 20 km long and still expanding.
Melbern Glacier is following the same pattern as nearby Yakutat Glacier and Grand Plateau Glacier. The lower 3 km of the glacier appears stagnant. However, there is a moraine band 10m km above the terminus that has shifted down glacier 1000-1500 meters from 2001 to 2007 as seen in images from those dates below. The green line indicates the moraine position in 2007. This indicates significant flow at this point. Thus, it is evident that retreat will continue on Melbern Glacier, but should slow as either the lake basin is left behind, or the moraine band is approached