Global Alpine Glacier 2025 State of Climate Report

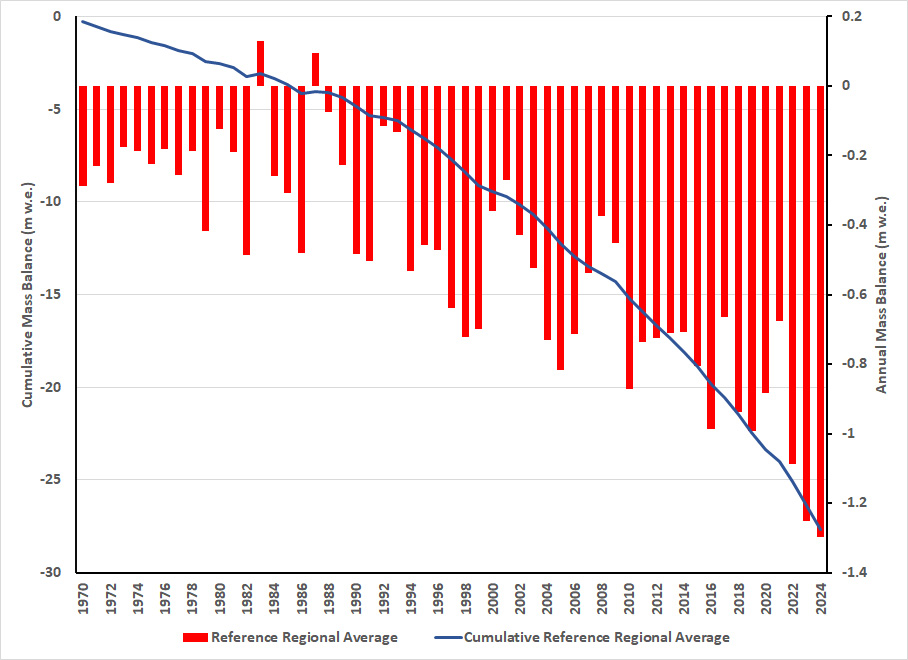
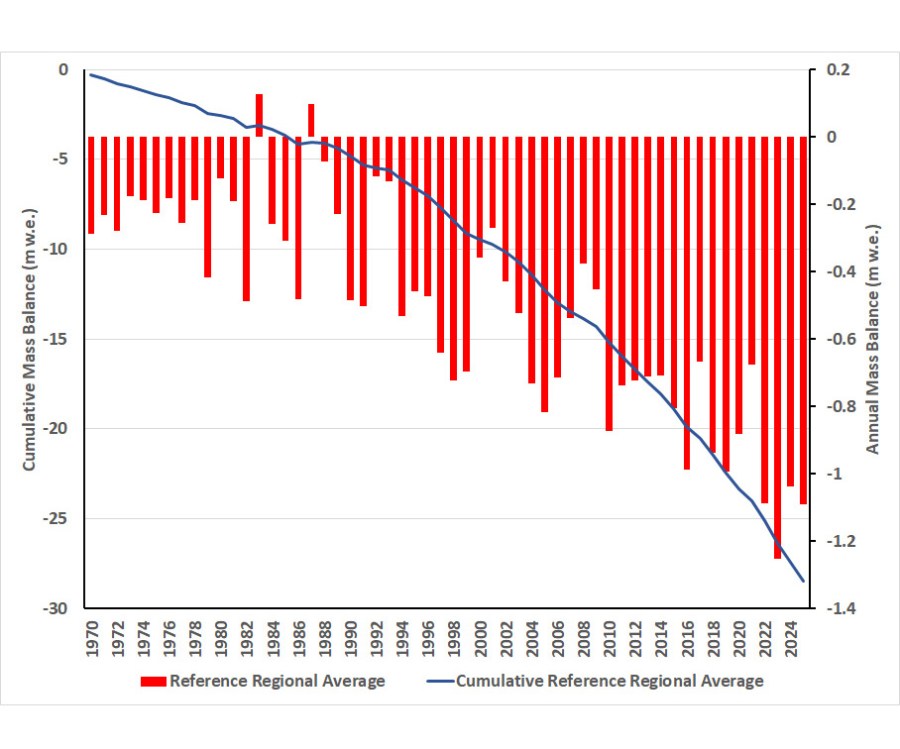
Figure 1. Global mean annual balance (bars) and cumulative balance (line) from the WGMS data set.

Each year since 2008 I have been responsible for summarizing the global alpine glacier status for each specific year in the Bulletin of the American Meteorological Society State of the Climate report. The 2025 report came out in early August. Below is the report with several added figures.

The 2025 World Glacier Monitoring Service (WGMS) dataset of annual glaciological mass balance observations includes 162 glaciers from six continents and 26 nations, 158 with a negative balance and four with a positive balance. In 2025, the mean annual mass balance of the 59 reporting global reference glaciers was –1.34 m w.e., and -1.34 m w.e. for all 162 reporting glaciers. The 2025 regionalized global average annual balance of –1.09 m w.e., is the fourth consecutive year with mass balance loss exceeding 1.0 m w.e., 2023 had the most negative -1.23 m w.e and 2024 was at 1.04 m w.e. Since 1976, mountain glaciers and ice caps have lost 9179+621 Gt of water, contributing 25.3+1.7 mm to the global mean sea level rise, with 41% of this loss occurring in the last decade (Dussaillant et al. 2025).

The mean annual balance of global reference glaciers was -1.34 m w.e., a similar result to 2023 and 2024 with a mean annual balance for global reference glaciers of -1.60 m w.e. and -1.37 m w.e., respectively.  This makes 2025 the 38th consecutive year with a global alpine mass balance loss, the 16th consecutive year with a regionalized global mass balance below –0.5 m w.e. The significant acceleration of mass balance loss is evident in glaciological observations, geodetic observations, altimetry observations and gravimetric observations (The GlaMBIE Team, 2025). The acceleration of mass balance loss indicates glaciers are not approaching equilibrium and increasingly are disappearing. The Global Land Ice Measurement from Space inventory of global glaciers has now added an extinct glacier layer to record glaciers that have disappeared, that is populated by 181 glaciers that had existed in a previous inventory (Raup et al. 2025). In conjunction with 2025 being the UN International Year for Glaciers’ Preservation the Global Glacier Casualty List has been created to chronicle the story of specific glaciers being lost from each glaciated region (Boyer and Howe, 2025).
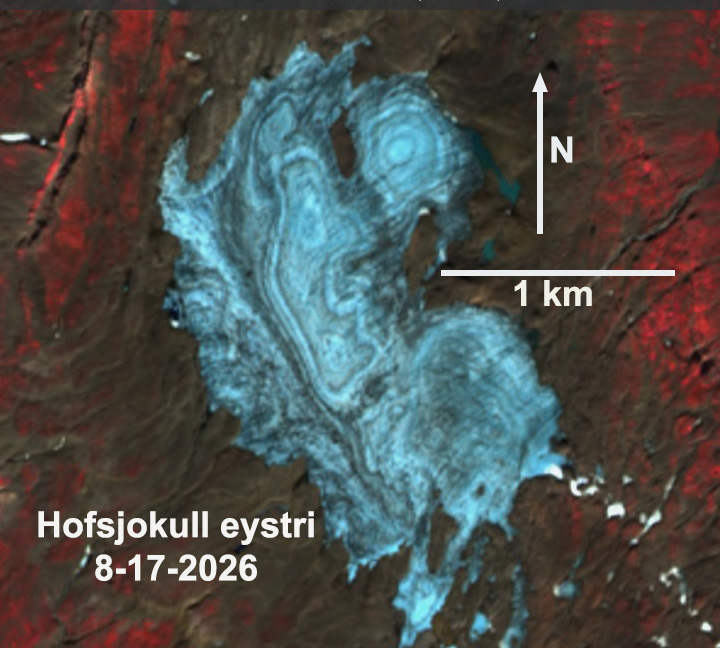
Hofsjokull eystri, Iceland was snow free by mid-August, leading to extensive ice cap thinning.

In the European Alps all 54 glaciers observed had negative balances, with 45 of the glaciers losing over 1 .0 m w.e. In Iceland (6) and Svalbard (9) all 15 glaciers observed lost over 1.0 m w.e. In Norway 8 of 10 glaciers had a negative balance, with two glaciers having a positive balance. In Sweden 3 of 4 glaciers had a negative balance.

High snow line on Durung Drung Glacier, India near end of summer monsoon season.

In Asia all 23 glaciers across 7 nations had negative balances averaging 0.97 m w.e. In New Zealand the glaciers observed had a negative mass balance.
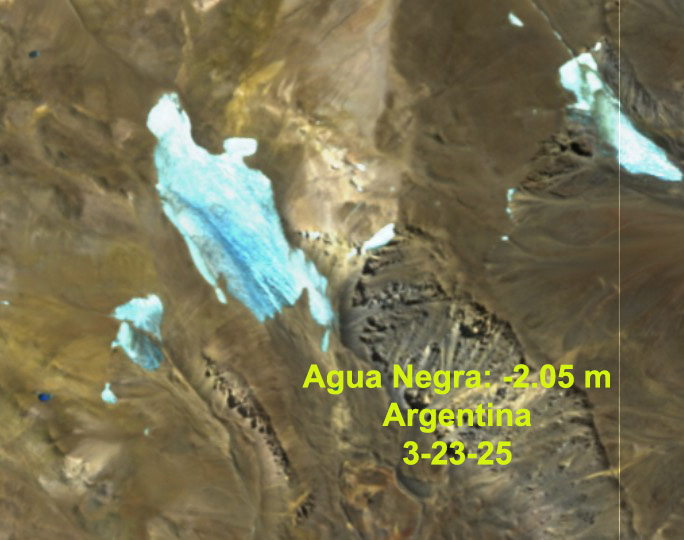
Agua Negra Glacier, Argentina with minimal snow cover at end of summer melt season.

In the Andes Mountains of South America nine of ten, reporting from four nations, had negative balances, with an average balance of -0.92 m w.e.

All 14 glaciers in Western North America, outside of Alaska, had mass balance below -1.0 m w.e. with an average of -2.24 m w.e. Peyto Glacier, Canada exemplifies the limited retained snow cover on alpine glaciers in Western North America in 2025, a glacier should be 50-60% snow covered at the end of summer to be in equilibrium (Fig X2). It is evident Peyto Glacier is representative of adjacent glaciers that also have limited retained snow cover.  In Alaska 3 of 4 glaciers had negative balances. The five glaciers in Arctic Canada all had small negative balances averaging -0.16 m w.e.
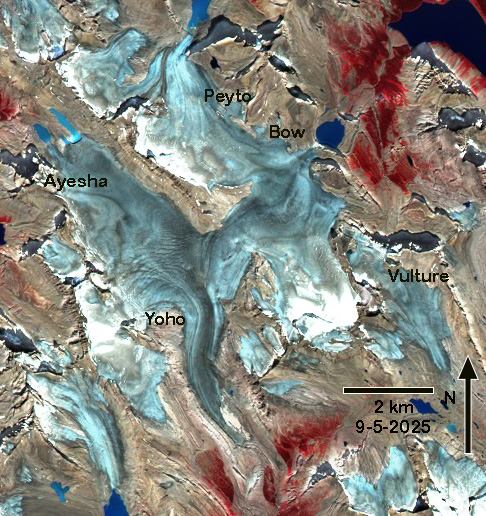
Snow cover was minimal in the Yoho-Peyto Glacier regions, Canada at the end of the melt season.

Alpine annual mass balance glaciological observations are reported to the WGMS by National representatives with a December 1 annual submission deadline. WGMS reference glaciers (60) have at least thirty continuous years of mass balance observation. Benchmark glaciers (23) have at least a ten-year mass balance record and are in regions that lack sufficient reference glaciers. The combination of benchmark and reference glaciers are used to generate regional averages (WGMS, 2023). Global values are calculated using a single averaged value for each of 19 mountain regions, limiting bias from observed regions (WGMS, 2023). Expansion of this data set leads to reanalysis and updated values.

References

Boyer, D. and Howe, C. 2025. Communication efforts to educate the public about vanishing glaciers, 1958–2025. Annals of Glaciology, 67: e2. doi:10.1017/aog.2025.10033

Dussaillant, I., Hugonnet, R., Huss, M., Berthier, E., Bannwart, J., Paul, F., and Zemp, M. 2025: Annual mass change of the world’s glaciers from 1976 to 2024 by temporal downscaling of satellite data with in-situ observations. Earth System Science Data 17(5): 1977-2006, https://essd.copernicus.org/articles/17/1977/2025/.

Raup, B., Andreassen, L., Boyer, D., Howe, C., Pelto, M., and Rabatel, A. 2025: Tracking extinct glaciers in GLIMS. Annals of Glaciology, 66, e35, 1–6. https://doi.org/10.1017/aog.2025.10027

The GlaMBIE Team, 2025: Community estimate of global glacier mass changes from 2000 to 2023. Nature. https://doi.org/10.1038/s41586-024-08545-z.

WGMS 2023: Global Glacier Change Bulletin No. 5 (2020–2021). Zemp, M., Gärtner-Roer, I., Nussbaumer, S.U., Welty, E.Z., Dussaillant, I., and Bannwart, J. (eds.), ISC(WDS)/IUGG(IACS)/UNEP/UNESCO/WMO, World Glacier Monitoring Service, Zurich, Switzerland, 134 pp., publication based on database version: doi:10.5904/wgms-fog-2023-09. [NG5] [MP6] 

Datasets used and their URLs

Dussaillant, I., Hugonnet, R., Huss, M., Berthier, E., Bannwart, J., Paul, F., and Zemp, M. (2025): Annual mass-change estimates for the world’s glaciers. Individual glacier time series and gridded data products. Digital media. https://doi.org/10.5904/wgms-amce-2025-02b[NG7] [MP8] 
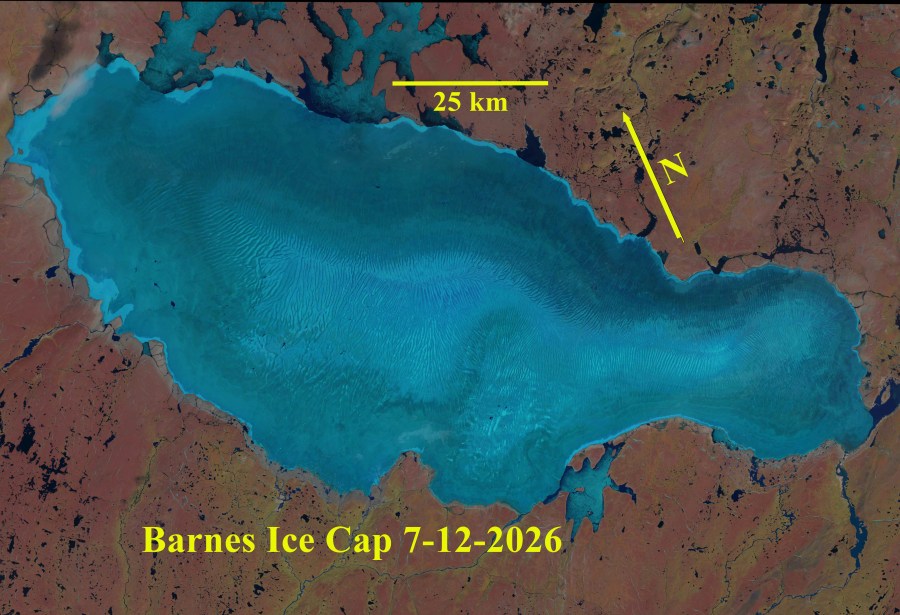
Barnes Ice Cap and Baffin Island Glaciers Lose Snow Cover in July 2026

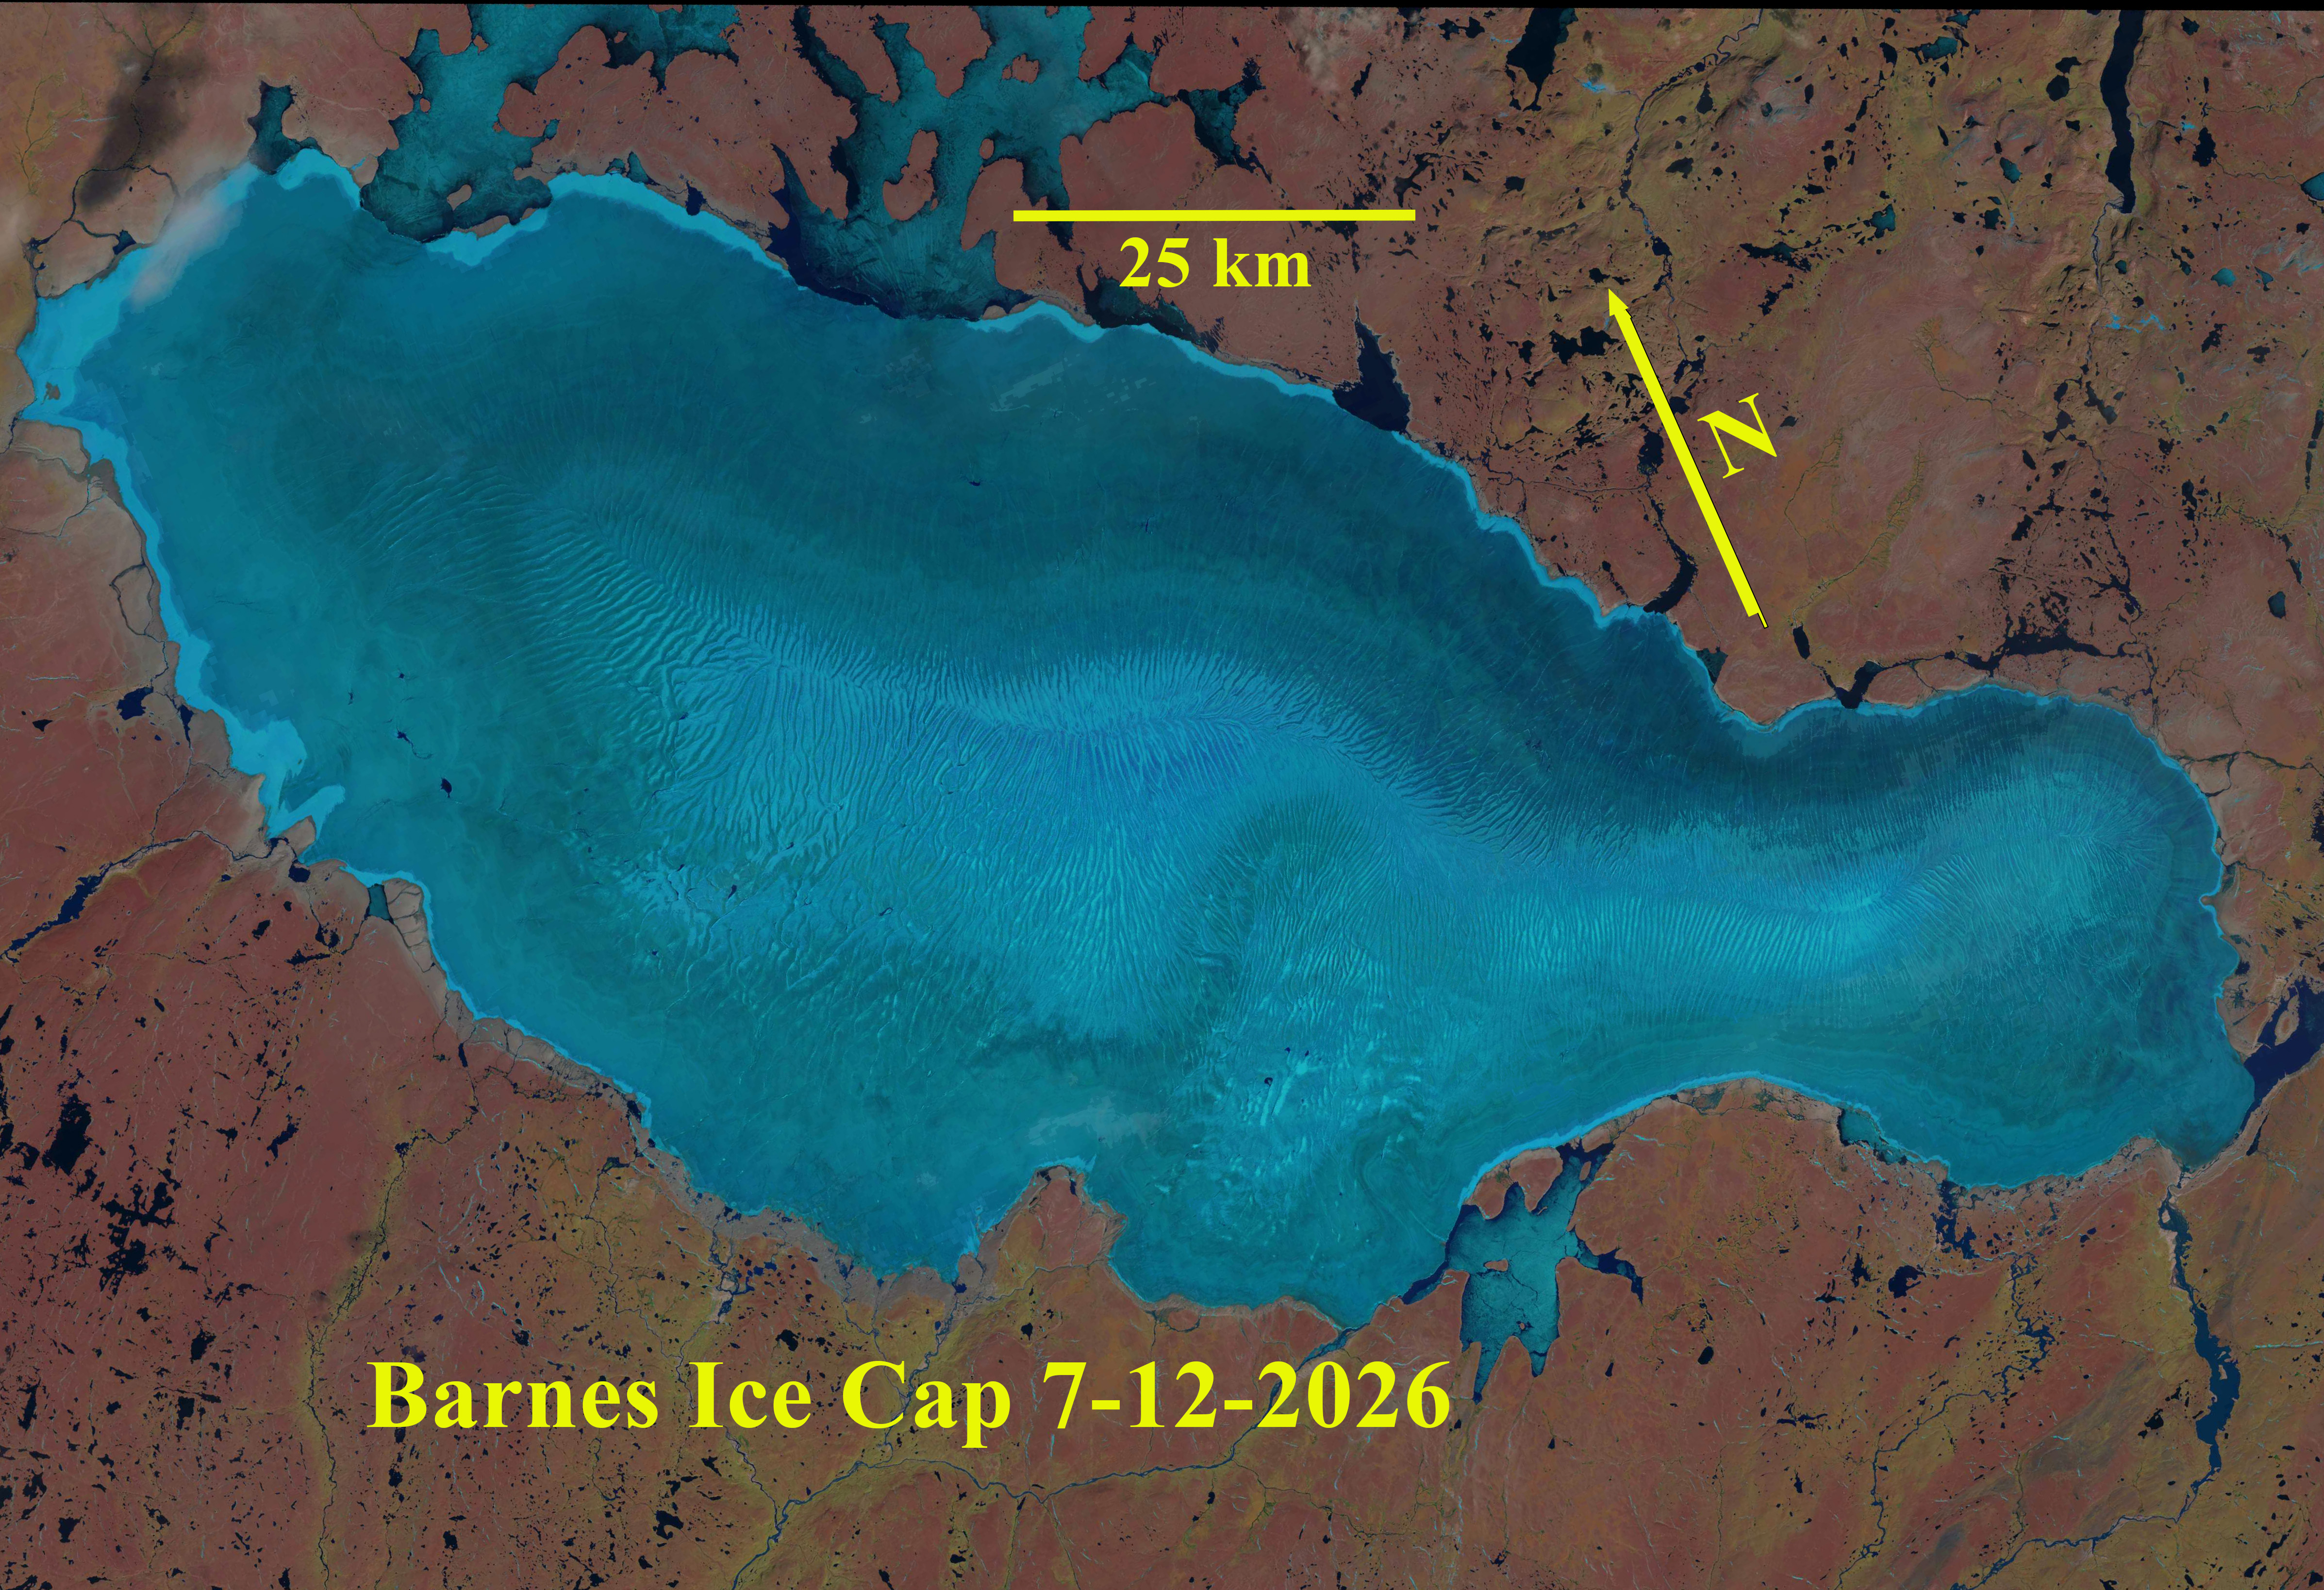
Barnes Ice Cap having in Landsat image with well developed melt channels from crest to margin of ice cap. Snow cover has been lost with over a month left in melt season.

Barnes Ice Cap located in the center of Baffin Island, Canada covers an area of ~5731 km2 in 2021 (Rippin et al 2026). The ice cap is approximately 150 km long, 60 km wide and has maximum ice thickness of ~730 m and a maximum ice elevation of 1124 m above sea level (asl) at the summit of the north dome. ICESat altimeter data indicated the thinning of the BIC at a mean rate of 0.75 m/year for the 2003–2009 period Gilbert et al (2016). They also noted that the ELA was at 950 in the 1960-80 period and is at 1100 m from 2002-2010 this leaves  a limited accumulation zone area. observe that  Barnes  Ice Cap lost its accumulation area beginning in 2010, in part due to the longer melt season.  The glacier does tend to not retain snowcover the accumulation zone consists of superimposed ice at the crest. Papasodoro et al (2016) noted that glacier wide balances were −0.52  m w.e./year from 1960 to 2013 and doubled to −1.06m w.e./year from 2005 to 2013 and remained at ~-1 m/a year through 2021 (Rippin et al 2026).

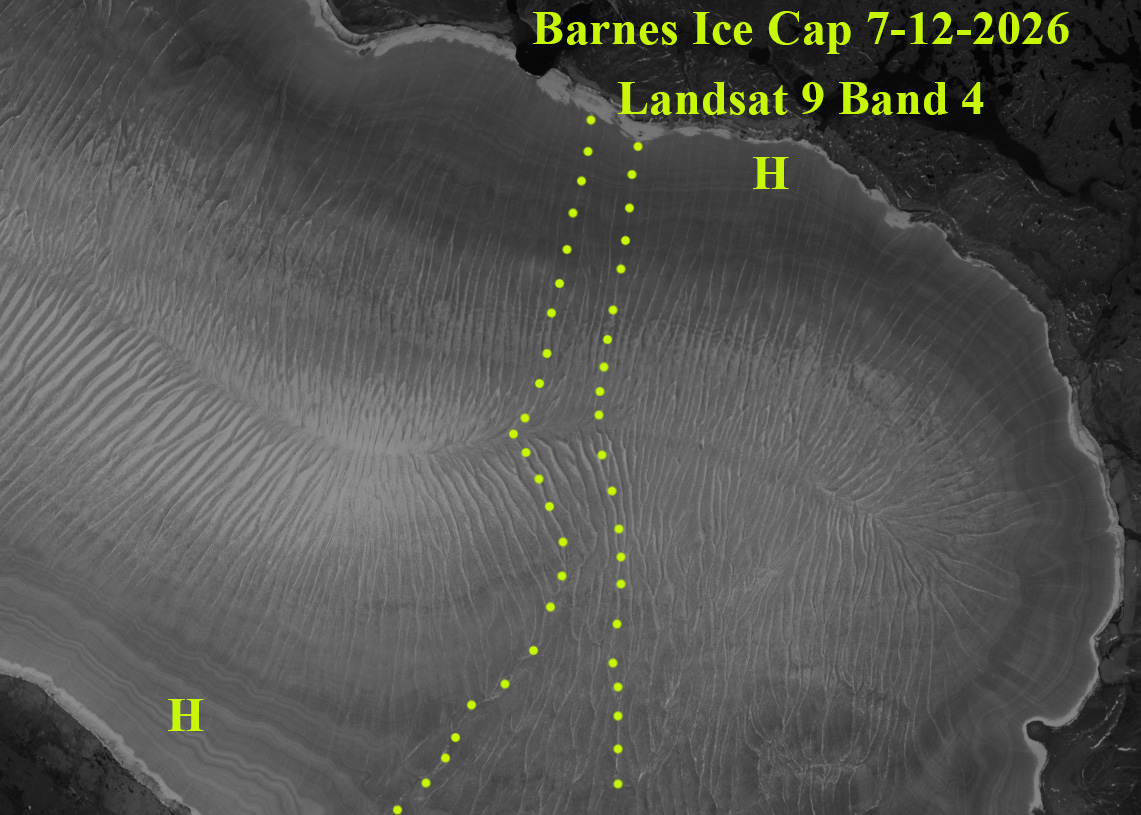
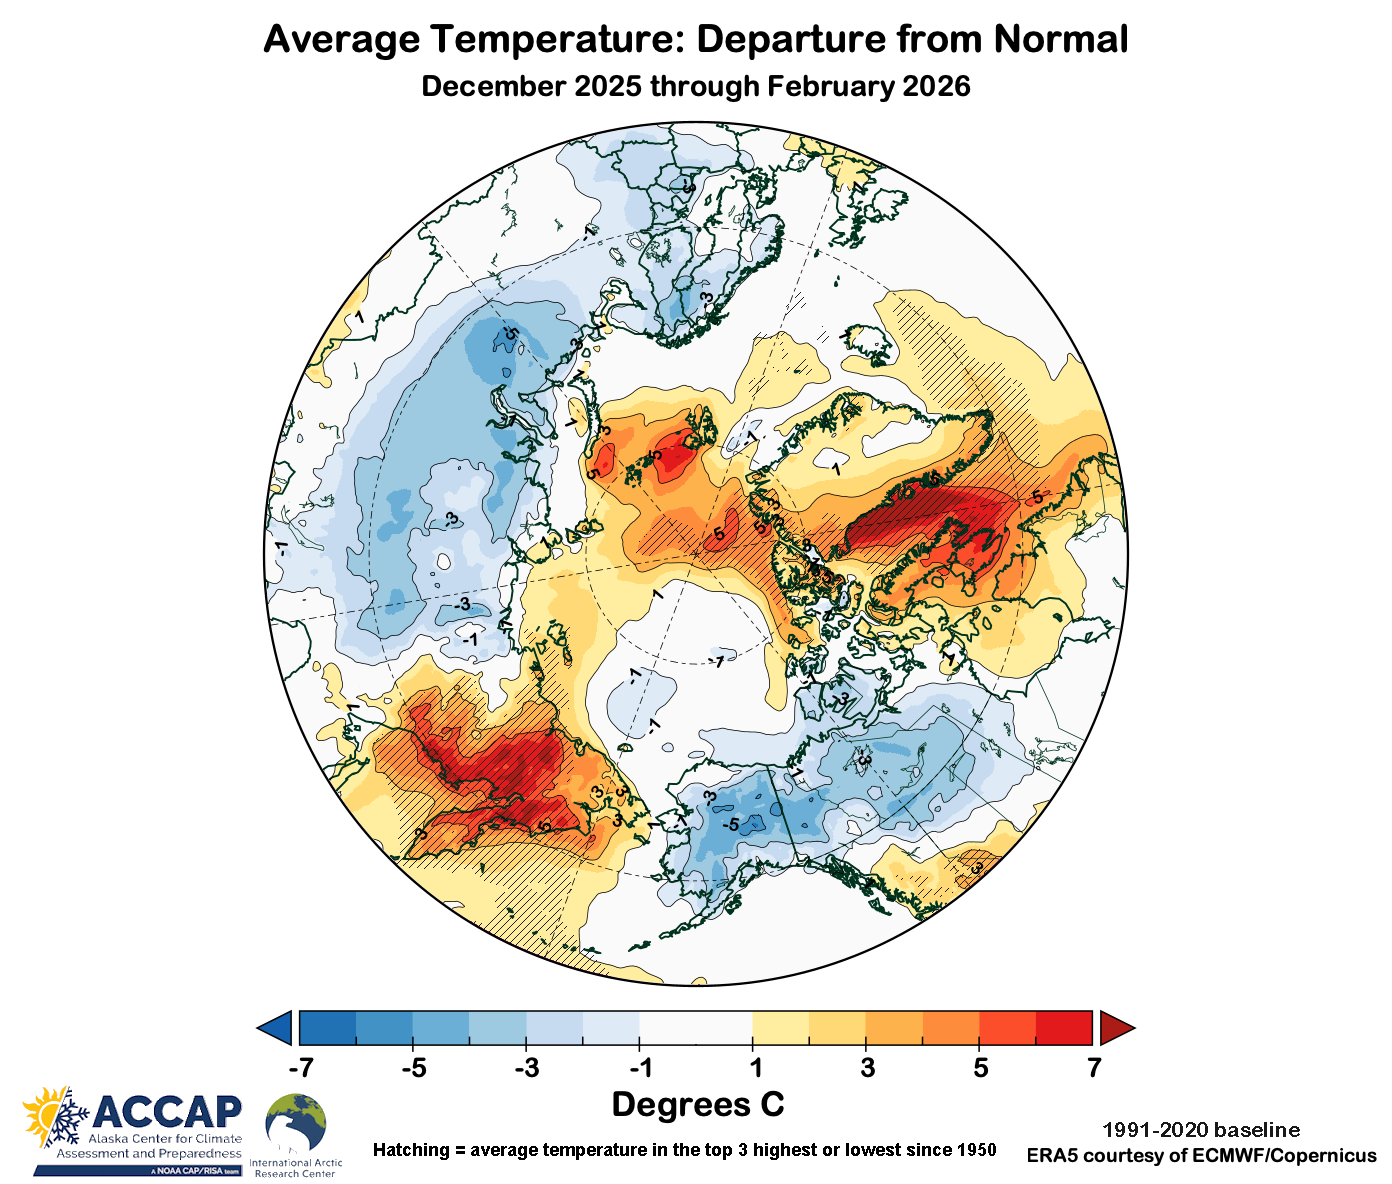
This has enabled supraglacial channels/valleys to develop and expand from year to year, extending from the ice cap crest to the margin, providing an effective pathway for meltwater to leave the ice sheet (Rippin et al 2026). This greatly diminishes refreezing, which had been the key mechanism for accumulation. The channels persist through and between melt seasons. There is insufficient ice motion or annual accumulation to offset the melt season runoff impact. Note the Band 4 image below indicates the extent of specific channels and how they cross cut specific stratigraphic ice horizons (H). Winter conditions were 3-5 C above average in the area, with spring and early summer conditions being normal or slightly below normal. This combined with the rapid snow loss on the ice cap between June 24 and July 12 indicates that snowpack was thin.

Barnes Ice Cap southern lobe with specific supraglacial stream channels noted. These have incised into the surface and persist. They cross stratigraphic ice horizons (H) near the margin of this Landsat Band 4 image from July 12, 2026.
Winter temperature anomaly across the Arctic.
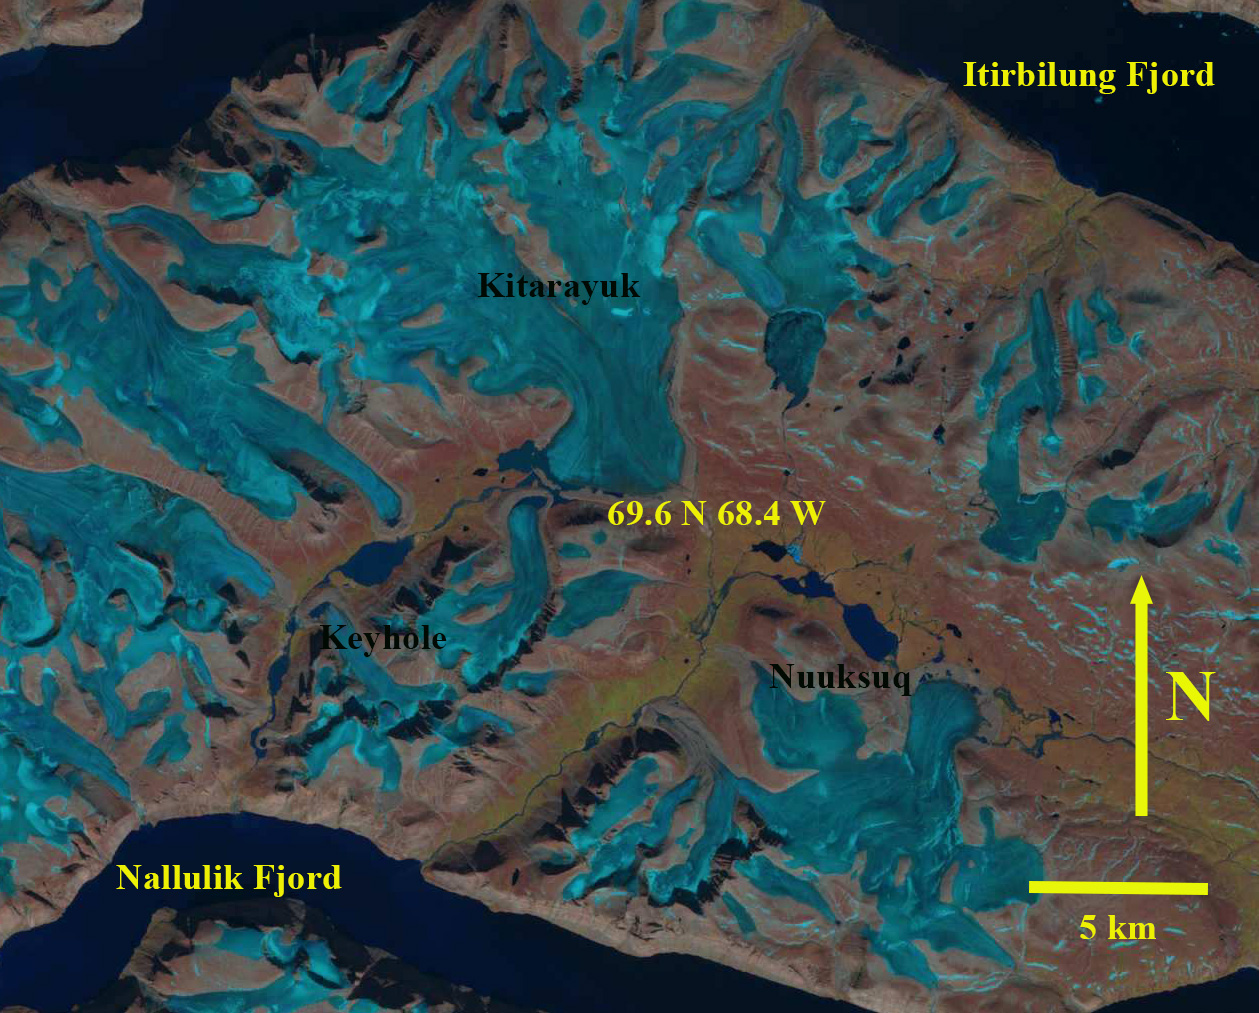
Glaciers on Peninsula on northern side of Home Bay having lost nearly all snowcover by July 15, 2026 in this Landsat image.

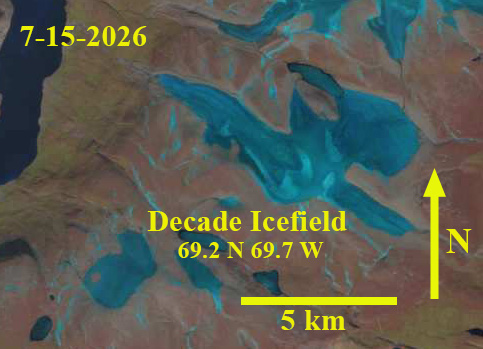
In mid-July 2026 Landsat imagery indicates the loss of all snow cover on Barnes Ice cap and that the supraglacial streams are fully activated. A series of glaciers to the east of the ice cap also have lost all snowcover including Keyhole, Kitarchick and Nuusuq Glacier. With over a month left in the melt season this will lead to substantial mass balance loss of these glaciers, driving further thinning and recession. Decade Icefield just to the north of this trio of glaciers also has lost all snow cover by mid-July.

Decade Icefield in Landsat image from mid-July has lost its snow cover.
Barnes Ice Cap southeast region illustrating suprglacial stream extent and lack of snowcver from margin to summit of ice cap in Landsat image.

Alpine Glaciers-State of Climate 2024

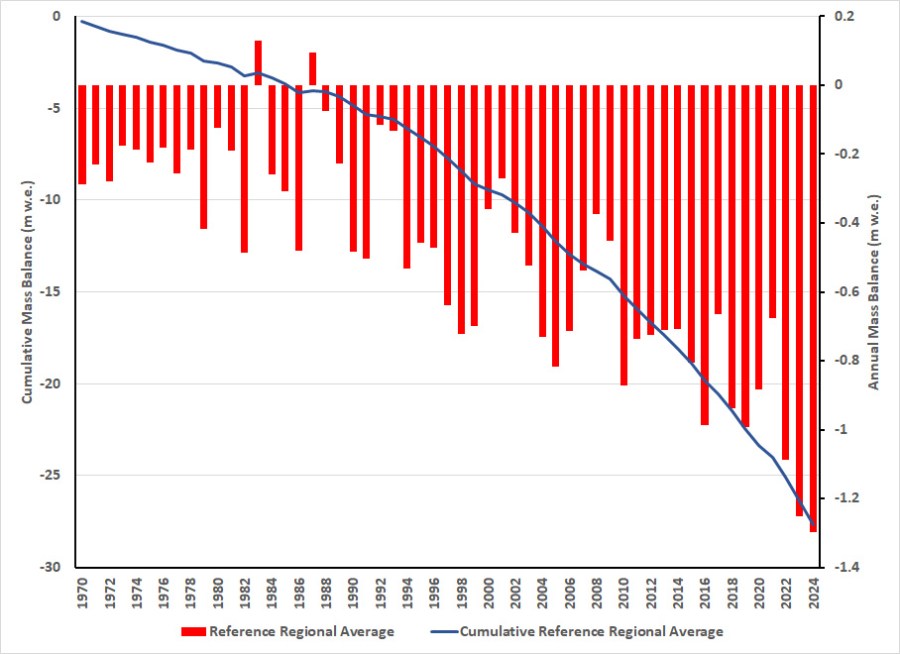
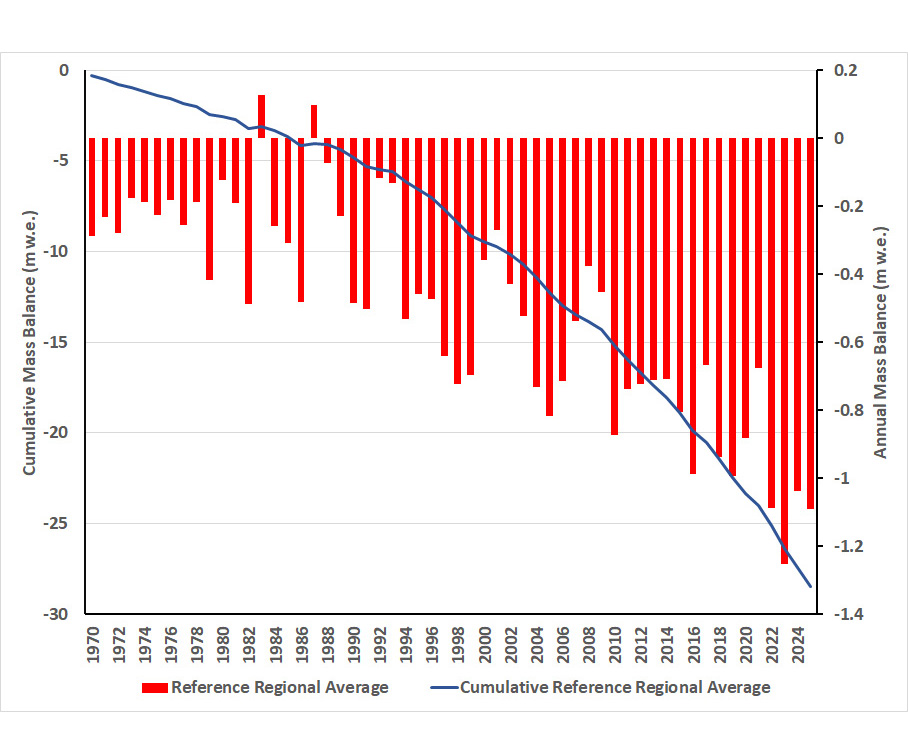
Global alpine mass balance in 2024 as reported to the World Glacier Monitoring Service. Solid line is the cumulative balance, bars are the annual balance.

Each of the last 15 years I have summarized the annual mass balance of alpine glaciers globally for the Bulletin American Meterological Society-State of the Climate report,. Below is the 2024 section on alpine glaciers with a few added figures.

  • ALPINE GLACIERS
  • M. Pelto

In 2024, all 58 global reference glaciers reported a negative annual mass balance. This is only the second year in the 1970–2024 period with all negative annual balances, following 2023. The global average annual mass balance based on equal weighting of 19 regions is −1.30 m water equivalent (w.e.), the most negative value in the record

The 2024 dataset of submitted glaciological observations includes 142 glaciers from six continents and 27 nations, with 140 reporting a negative balance and 2 a positive balance. In 2024, the mean annual mass balance of the 58 global reference glaciers was −1.44 m w.e. and −1.36 m w.e. for all 142 reporting glaciers. This is a similar result to 2023, which saw a mean reference glacier balance of −1.62 m w.e. and −1.35 m w.e. for all 116 reporting glaciers.

The 2024 regionalized global average of −1.30 m w.e. exceeds the previous most negative year in 2023, which saw a regional-ized global average of −1.25 m w.e. This makes 2024 the 37th consecutive year with a global alpine mass balance loss and the 15th con-secutive year with a regionalized global mass balance below −0.5 m w.e. The acceleration of mass balance loss indicates that alpine glaciers are not approaching equilibrium. The acceleration of mass balance loss is apparent regardless of datasets used to determine it, including glaciological, geodetic, altimetry, and gravimetric observations (The GlaMBIE Team 2025). The intercomparison assessment identified that global glaciers annually lost 273+26 gigatons (Gt) in mass from 2000 to 2023, with loss having been 36% greater in the second half than in the first half of this period (The GlaMBIE Team 2025).

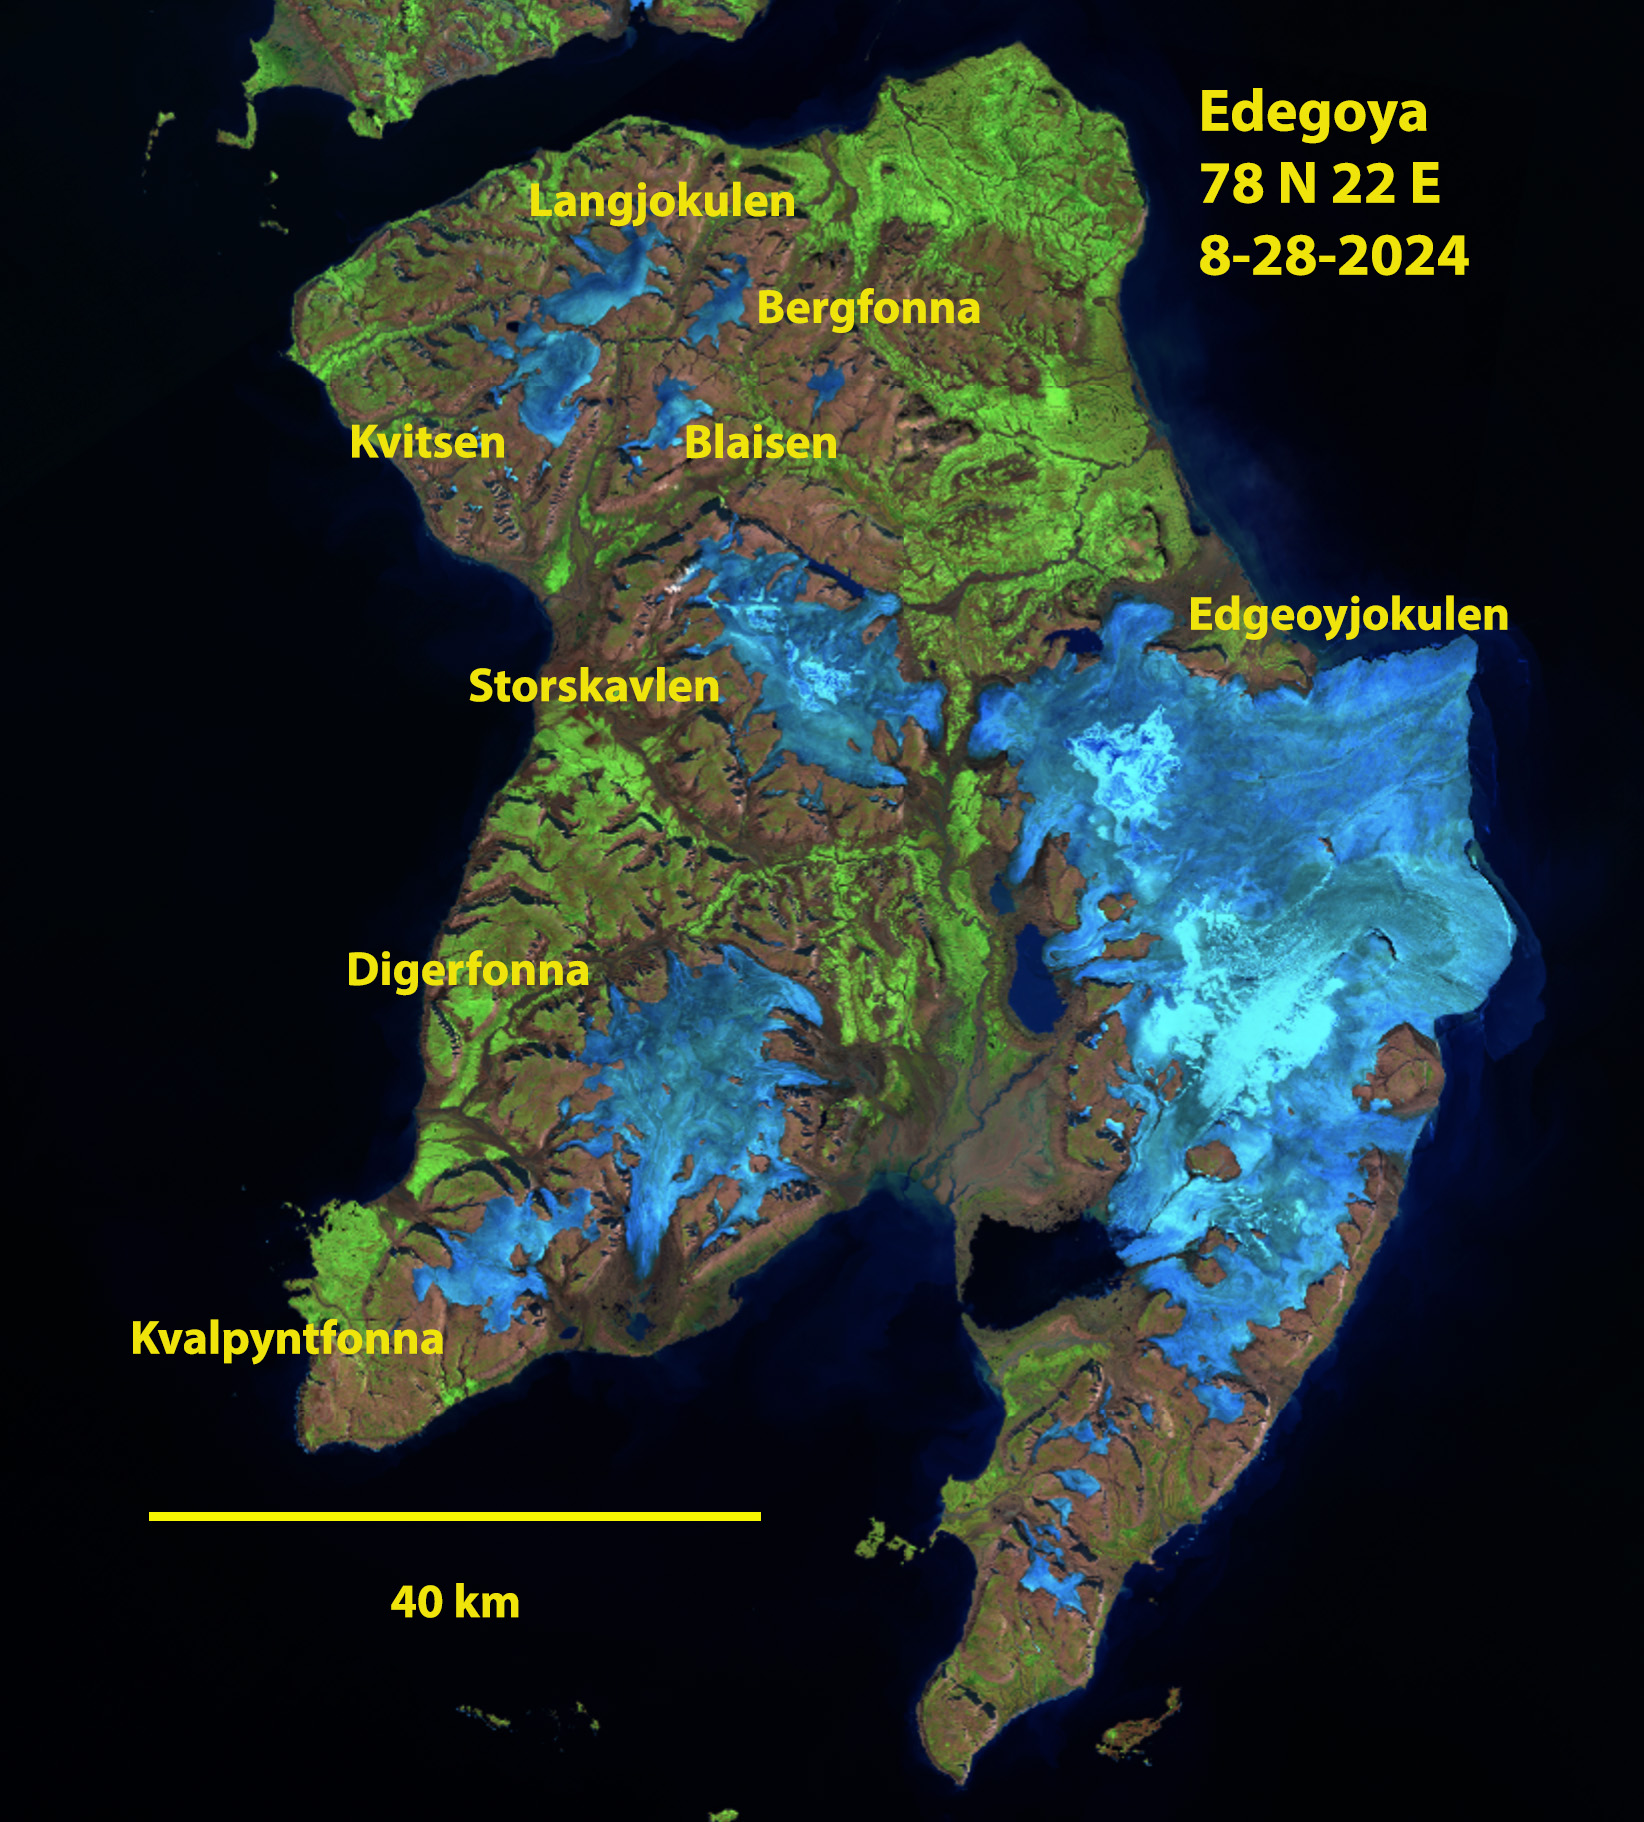
In the European Alps, all 49 glaciers reported negative mass balances, with 45 losing over 1 m w.e. All 10 Icelandic glaciers had negative balances. In Svalbard, all seven had negative balances exceeding an exceptional loss of 1.25 m w.e. This was the result of near complete snow cover loss across most glaciers (Fig. 2.20) following record temperatures in August (see section 7f5 for details). Twelve of the 13 glaciers from Norway and Sweden had mass losses of more than 1.0 m w.e.

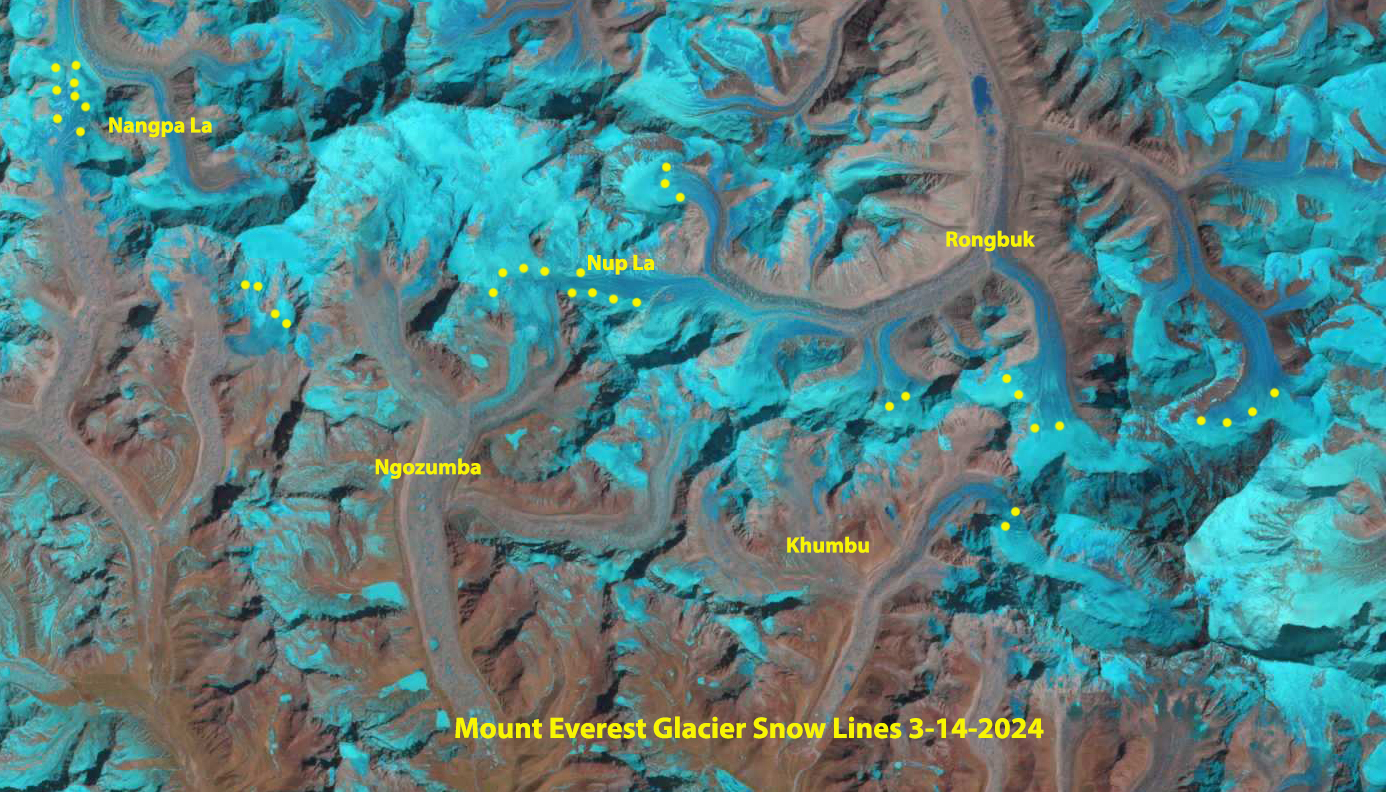
High snow line persisted through the winter on Mount Everest glaciers.

Across High Mountain Asia, 20 of 21 glaciers, reporting from seven nations, had negative balances. The highest average losses were in the Himalayas of Nepal and the lowest in the Pamir Range of Tajikistan.

In the Andes Mountains of South America, all 14 glaciers, reporting from five nations, had negative balances. Conejeras Glacier (Colombia), following a 5.04 m w.e. loss in 2023, was declared extinct in 2024. The daily hydrograph below this glacier changed from a predominanceof days with a purely melt-driven hydrograph from 2006 to 2016 to an increase in the frequency of days with flows less influenced by melt after 2016 (Morán-Tejeda et al. 2018).

All 16 glaciers in North America had negative balances. All four glaciers in Arctic Canada had mass balance losses under 1 m w.e. In western Canada and Washington and Montana (United States), all 16 glaciers reporting had losses exceeding 1 m w.e. The Ice Worm Glacier (Washington) was listed as extinct in 2023 after 40 years of continuous observations (Pelto 2024). In 2024, loss from the relict ice (ice that is no longer moving or part of a glacier) was 2.4 m and melt runoff below the glacier had decreased similar to Conejeras Glacier (Pelto and Pelto 2025). In Alaska, all three glaciers had mass balance losses. Davies et al. (2024) examined the Juneau Icefield, the most observed icefield in Alaska in terms of mass balance, and found an acceleration of mass loss with a doubling after 2010 compared to 1979–2010.

Easton Glacier, Washington extensive retreat since 1990, with last five years being the most rapid. Terminus and mass balance surveyed annually and reported to WGMS.

Alpine annual mass balance glaciological observations are reported to the World Glacier Monitoring Service (WGMS) by national representatives with a 1 December annual submission deadline. WGMS reference glaciers have at least 30 continuous years of mass balance observa-tion. Benchmark glaciers have at least a 10-year mass balance record and are in regions that lack sufficient reference glaciers. The combination of benchmark and reference glaciers is used to generate regional averages (WGMS 2023). Global values are calculated using a single averaged value for each of 19 mountain regions, limiting bias from observed regions (WGMS 2023). As this dataset expands, the annual values are reanalyzed and updated.

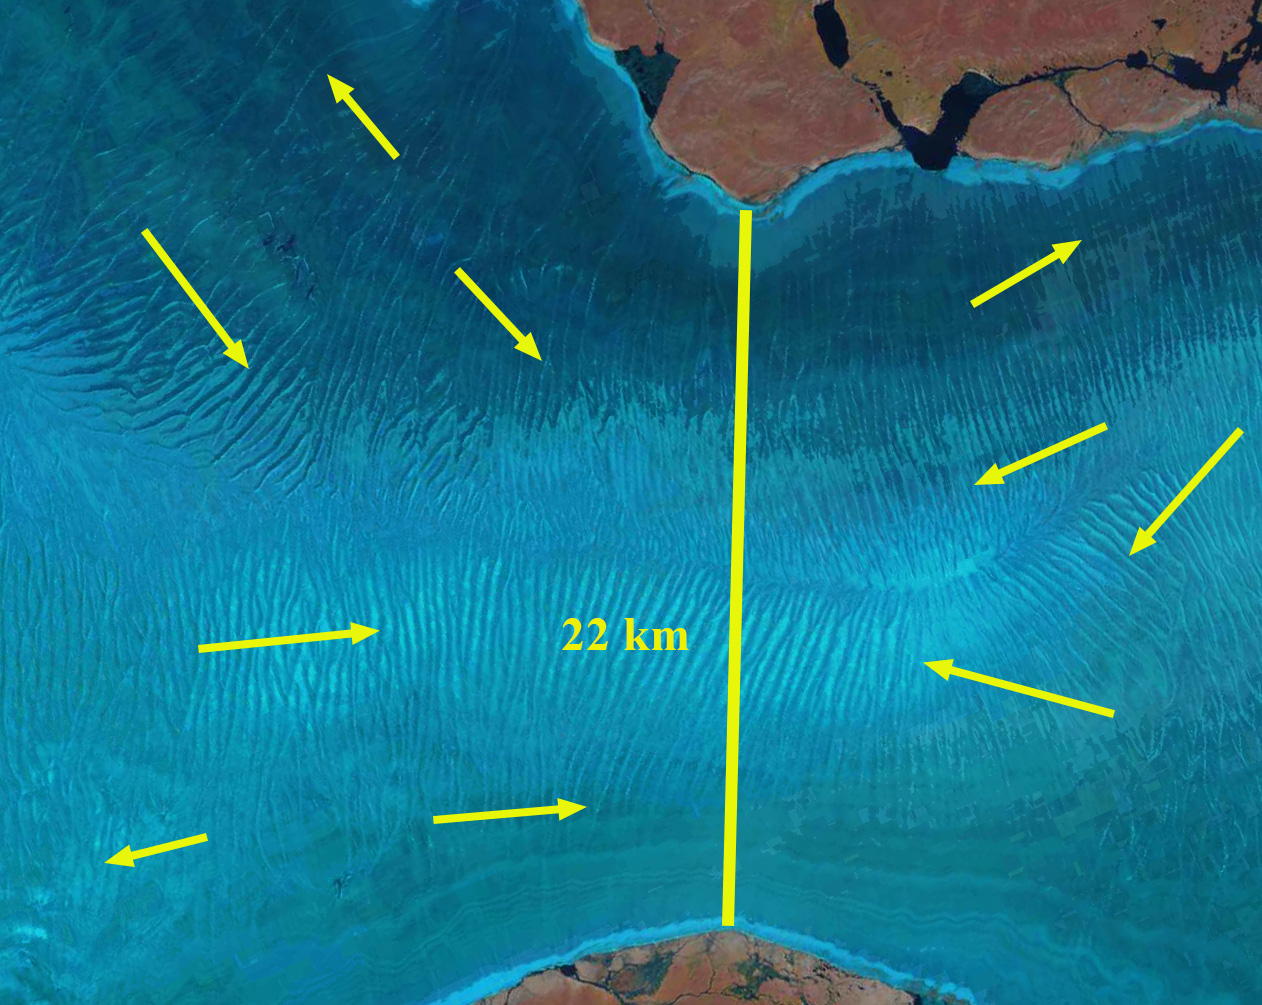
The lack of snow pack at the end of summer is evident across Edgeoya in Svalbard, blow a closeup of Digerfonna further illustrates with lettered points indicating new bedrock areas that are expanding amidst the ice cap.