Storbreen, Svalbard Major Retreat Opens New Fjord

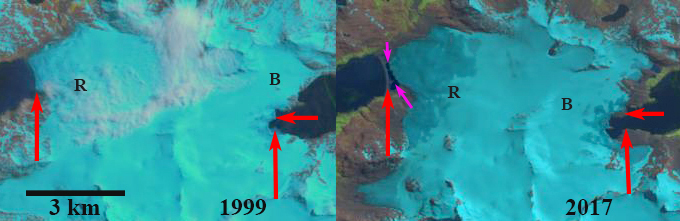
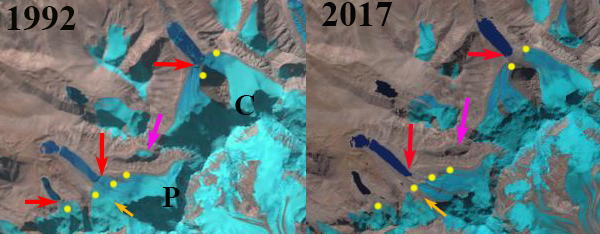
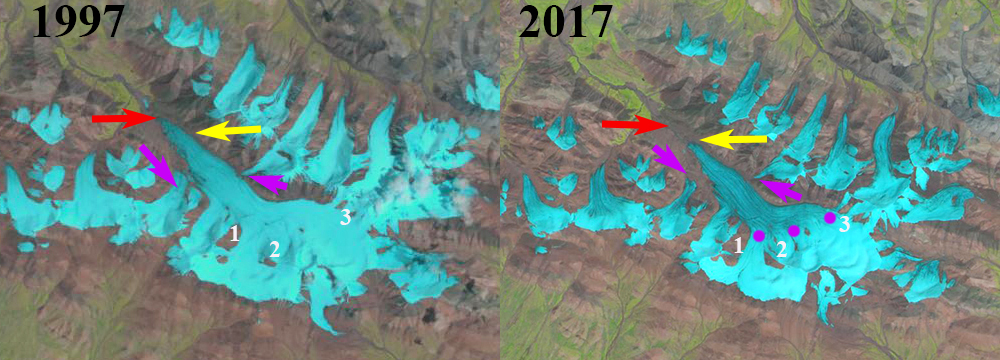
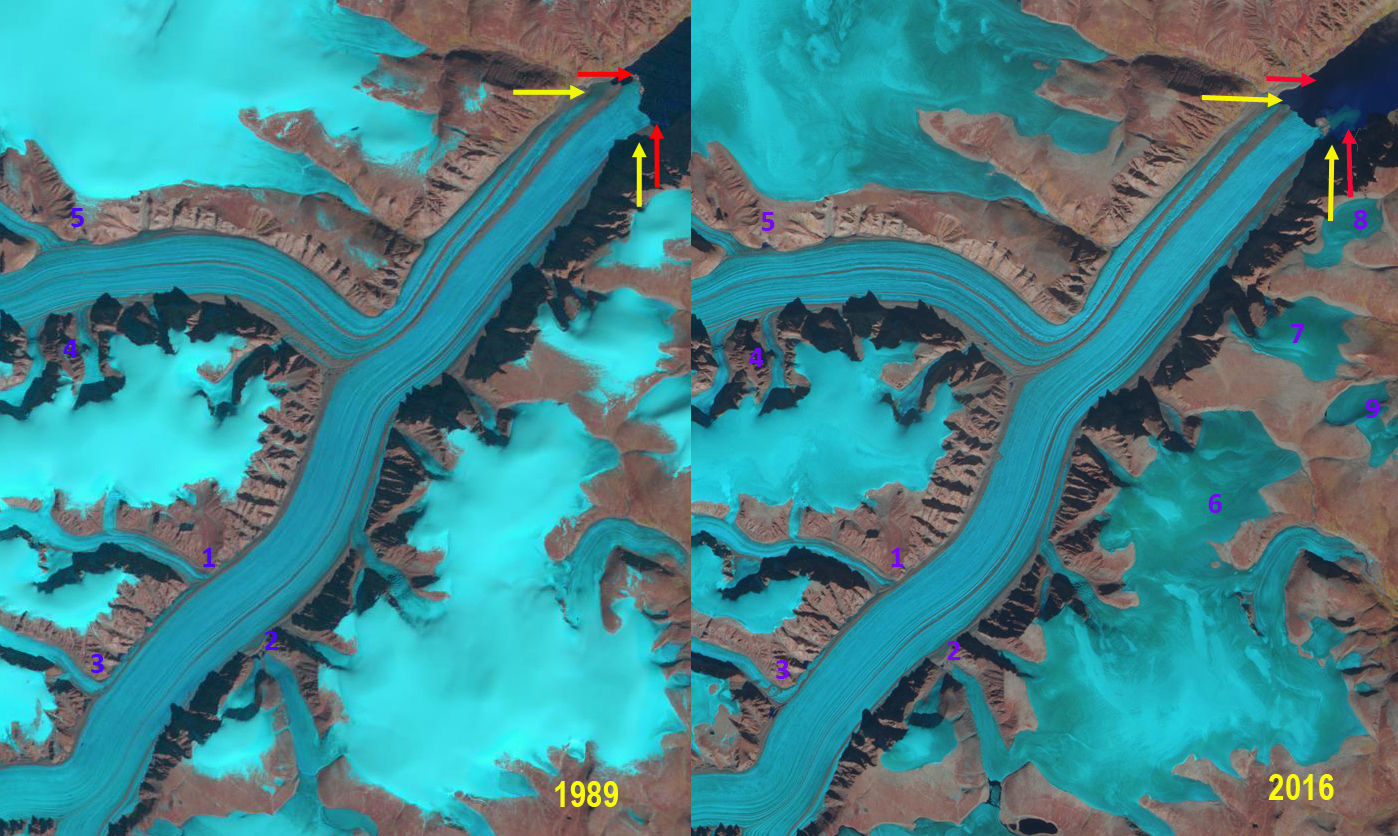
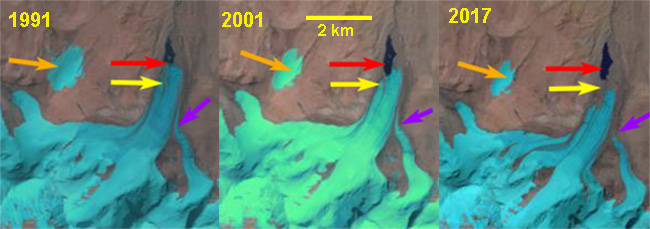
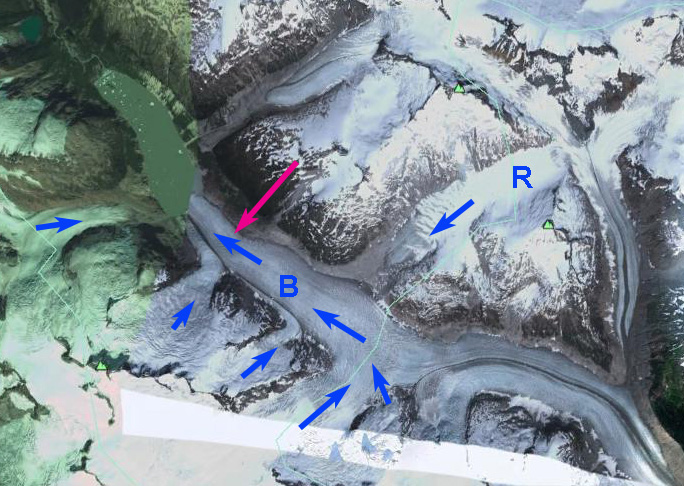
Storbreen, Svalbard in 1990 and 2017 Landsat images.  The red arrows indicate 1990 terminus , yellow arrow the 2017 terminus and purple dots the snowline in 1990.  A recent snow storm has obscured the actual snowline in Aug 2017. 

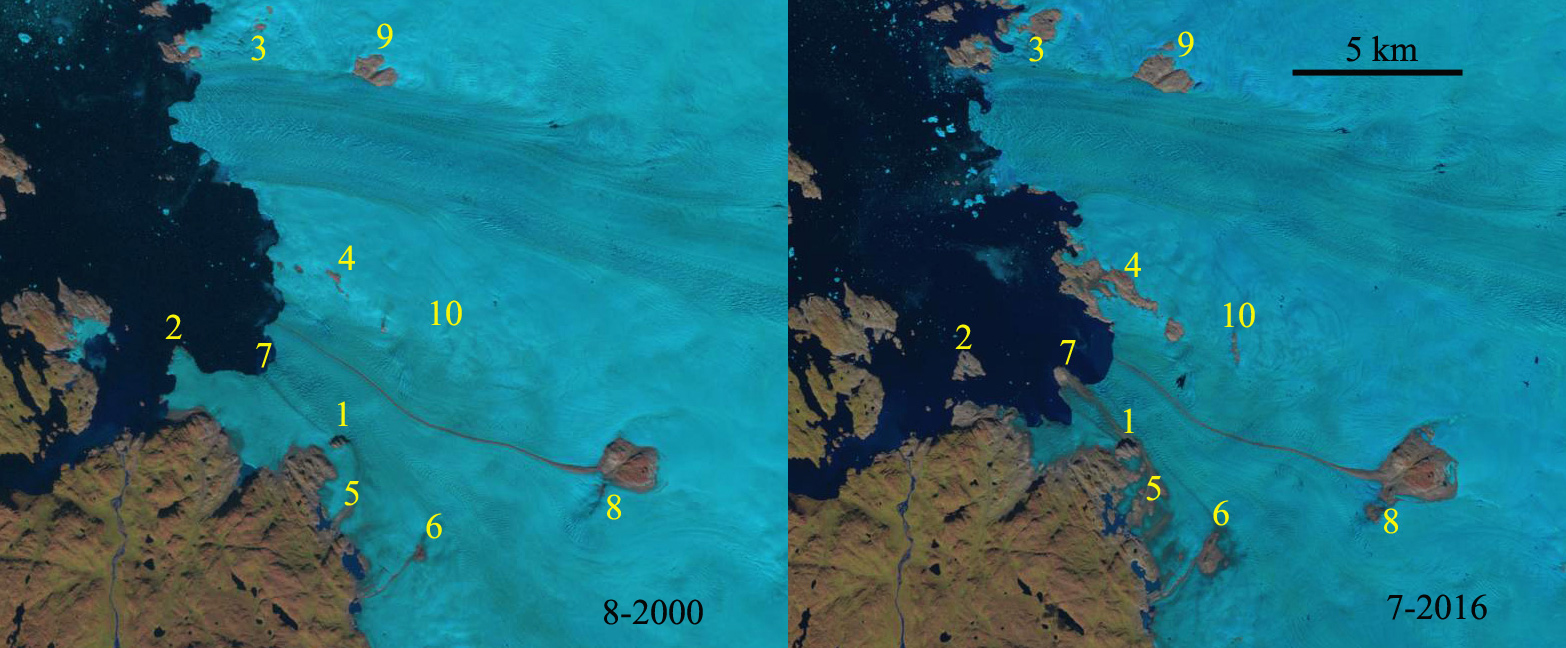
Storbreen Glacier (ST) terminates on the north side of Hornsund in southern Svalbard.  From 1990 to 2017 Storbreen has experienced a substantial retreat opening a new fjord and separating from Hornbreen (H).  Svalbard is host to 163 tidewater glaciers with a collective calving front of 860 km Błaszczyk et al, (2009). Nuth et al (2013) determined that the glacier area over the entire archipelago has decreased by an average of 80 km per year over the past 30 years, a 7% reduction. In the most recent period 1990-2007, terminus retreat was larger than in an earlier period from 1930-1990, while area shrinkage was smaller. Hornsund is a fjord that in 2014 almost cuts through the southern Island of Svalbard, and eventually will. The Institute of Geophysics Polish Academy has maintained a Polish Research Station in Hornsund since 1957.  The 1984 map, from the University of Silesia, of the glaciers and geomorphology document the extent of the glaciers in 1983. A more detailed examination by the same researchers, Blaszczyk et al. (2013) reported the total area of the glacier cover lost in Hornsund Fjord area from 1899–2010 was approximately 172 square kilometers. Pelto (2017) reported significant retreat of all 10 major tidewater glaciers of Hornsund Fjord.

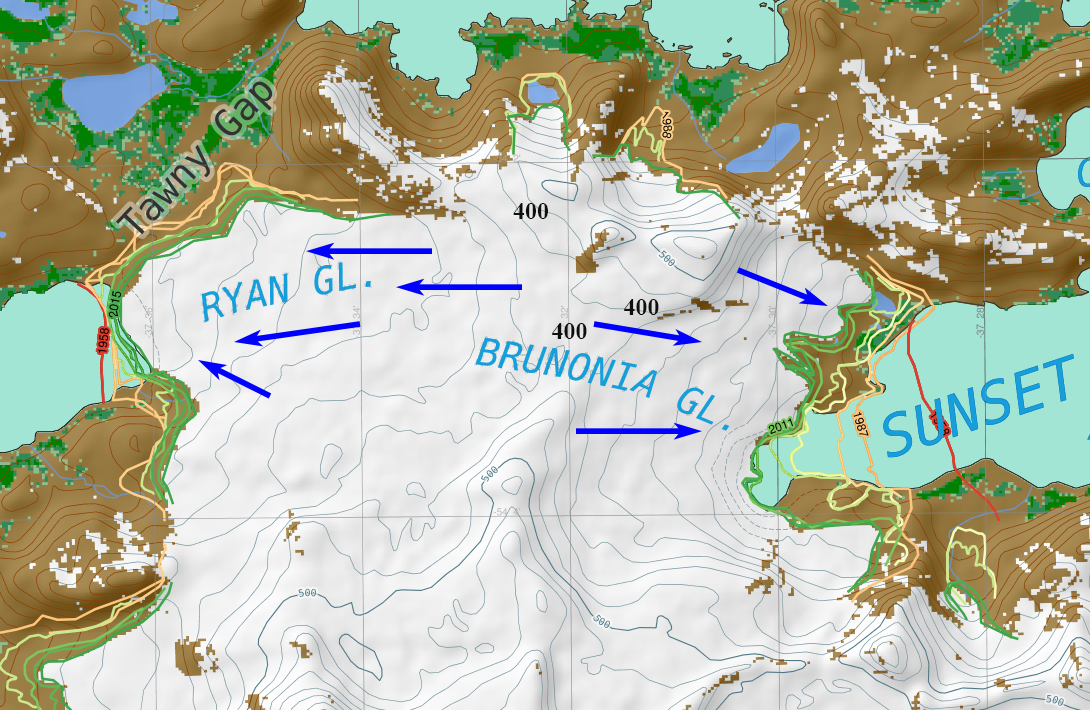
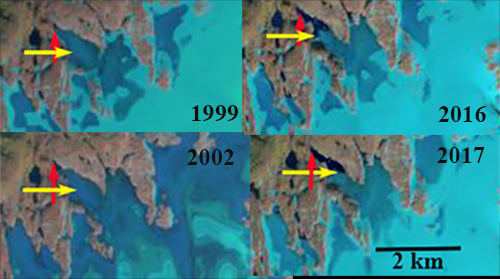
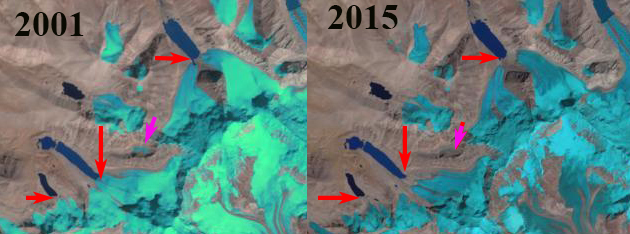
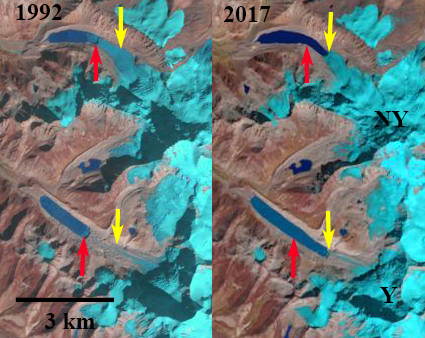
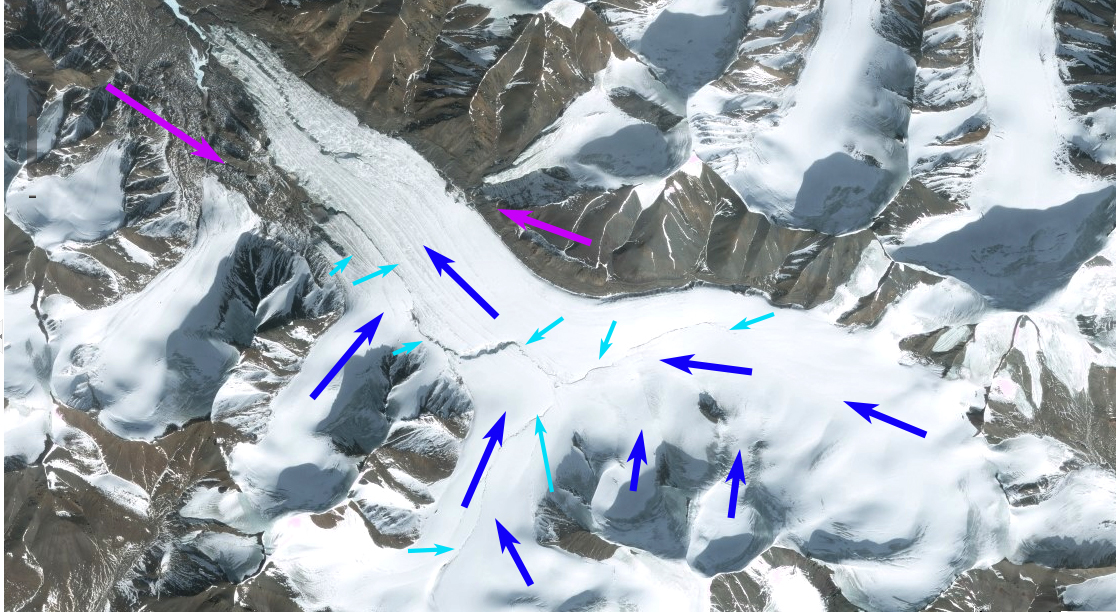
In 1990 the terminus of Storbreen on the east side is shared with Hornbreen Glacier (H), joining near the tip of a peninsula that will emerge between the glaciers with retreat.  On the west side the glacier terminates at the southern end of a peninsula.  The snowline is at 400 m in 1990.  In 2002 the glacier has separated from Hornbreen and terminates in a newly opening fjord, with the snowline at 350 m.  In 2013 and 2015 the glacier has retreated substantially up the new fjord with the snowline at 450 m in 2013 and 500 m in 2015.  By 2017 the glacier has retreated 8.7 km in the glacier center from the west margin in 1990, 6.0 km on the centerline and 4.8 km from the east margin of 1990.  The glacier terminus is still tidewater and is 4.7 km wide.  The extensive crevassing at the glacier front in Google Earth imagery, below, indicates continued rapid flow at the terminus.  The retreat continues with significant cahnge after 2013.  The crevassing may indicate a steeper surface slope too.  The topography at TopoSvalbard suggests limited change in surface slope based on older mapping.  The head of the fjord is not likely to occur until at least the junction point of several tributaries. The retreat here is similar to that of adjacent Hornbreen and Paierbreen.

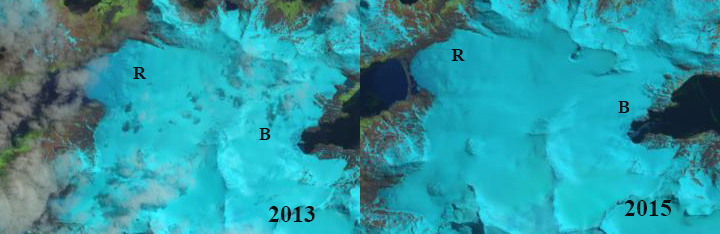
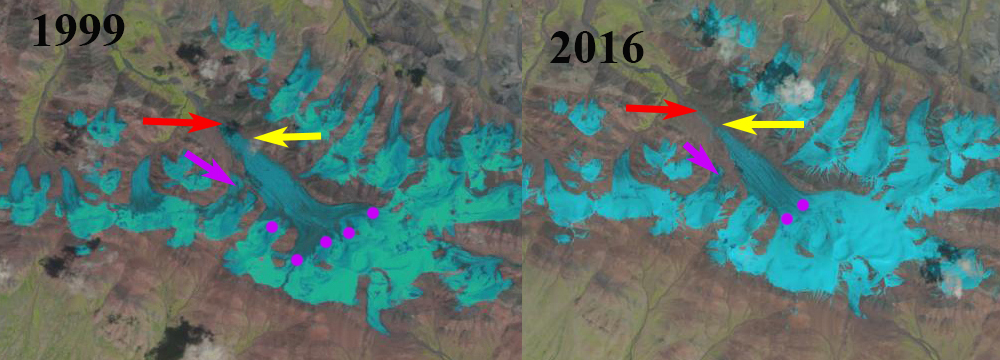
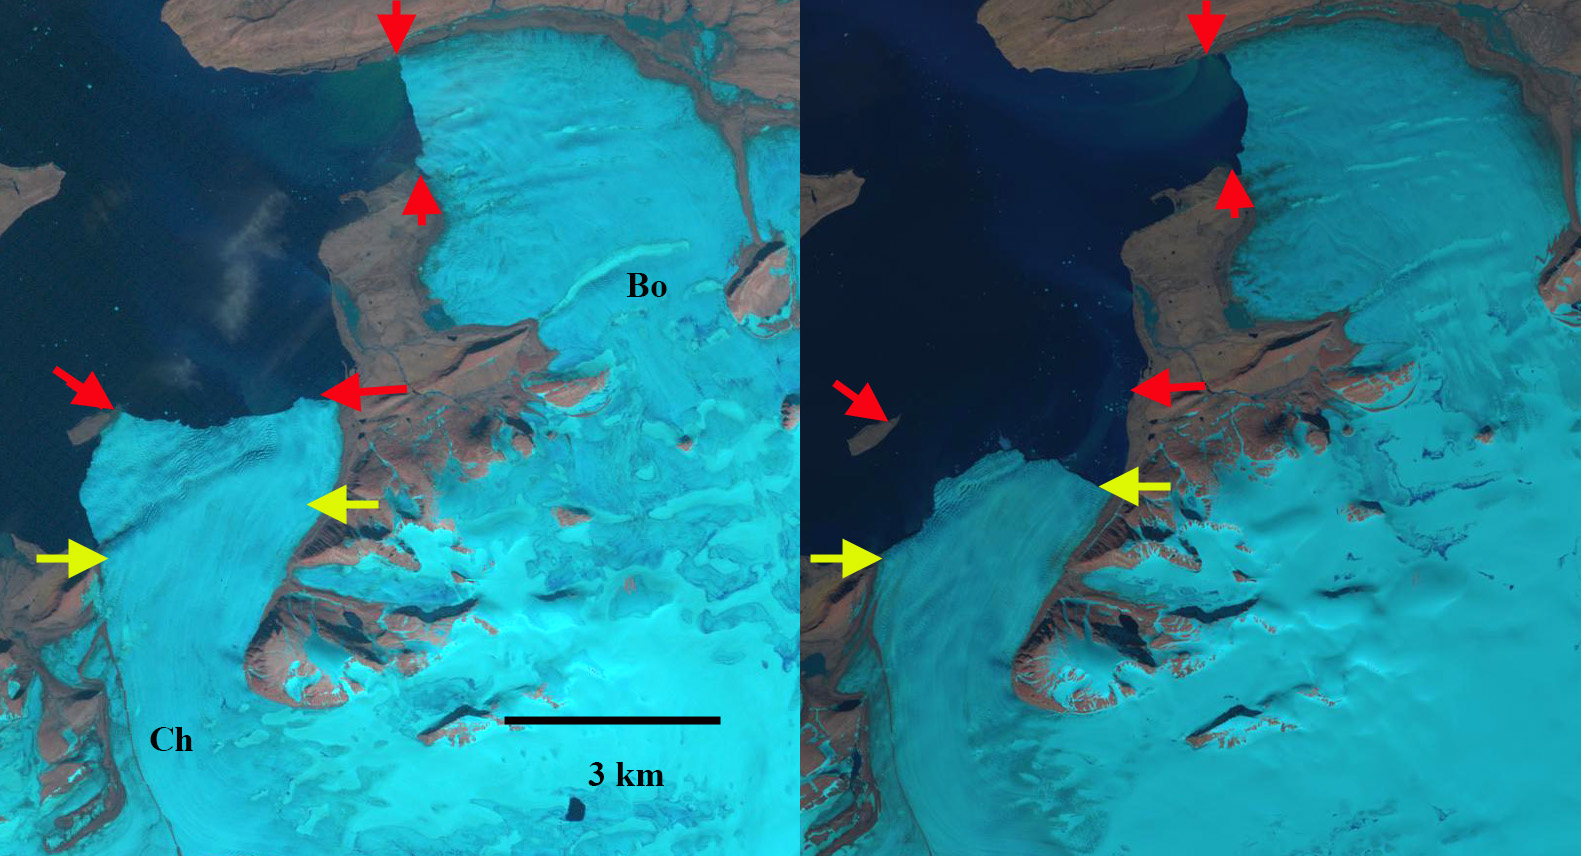
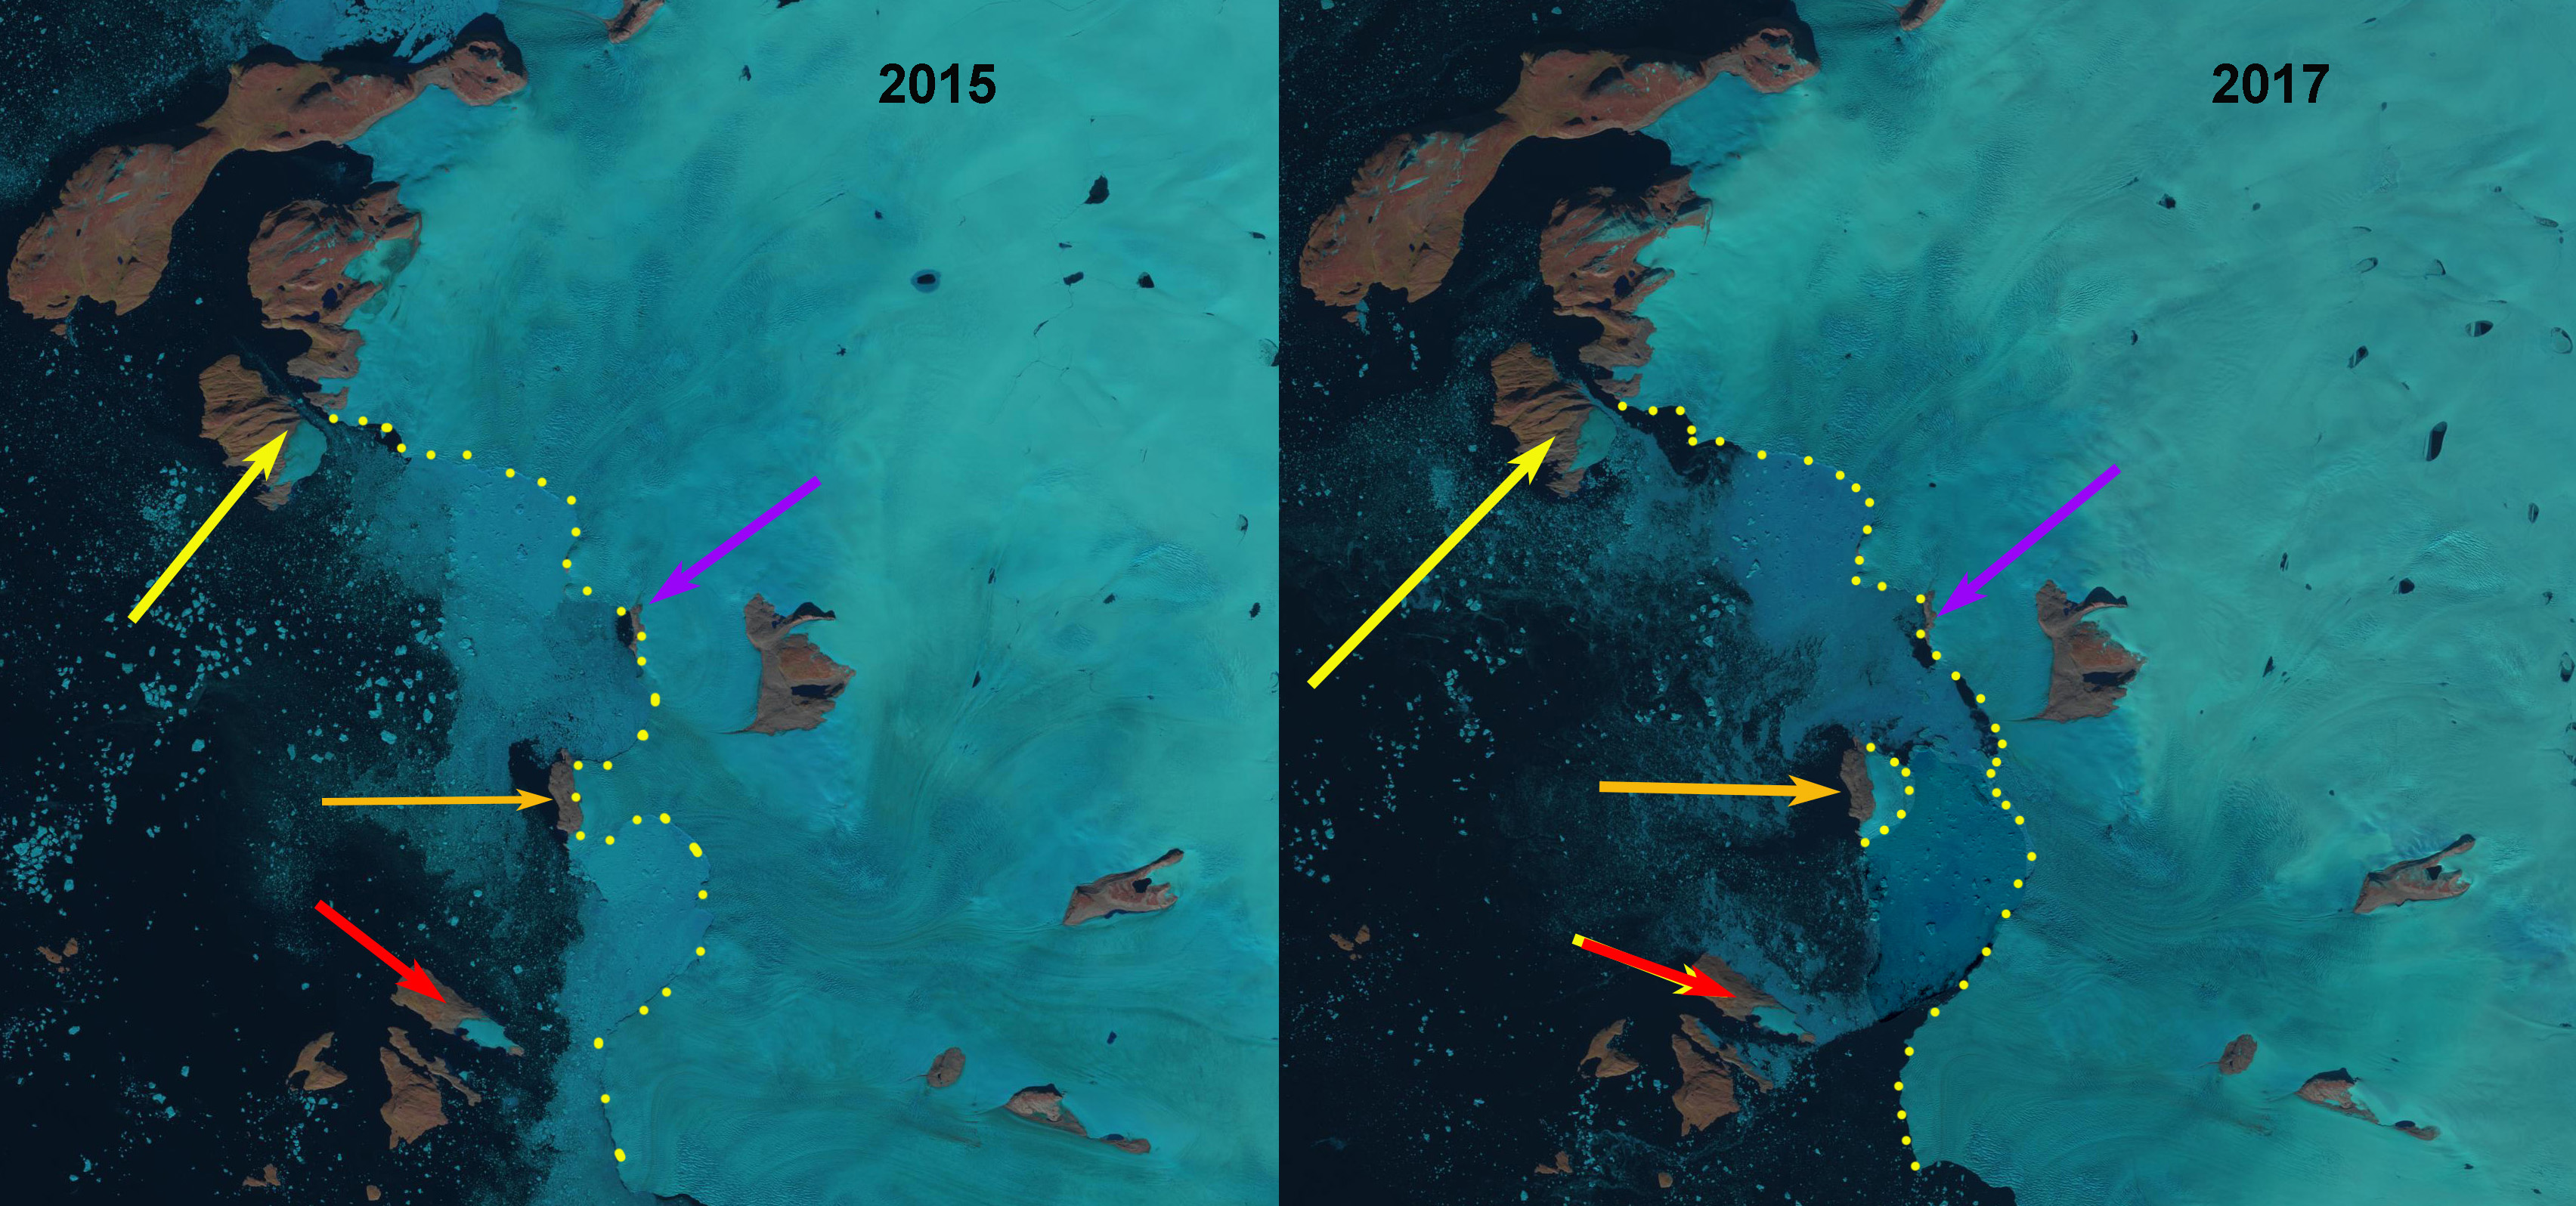
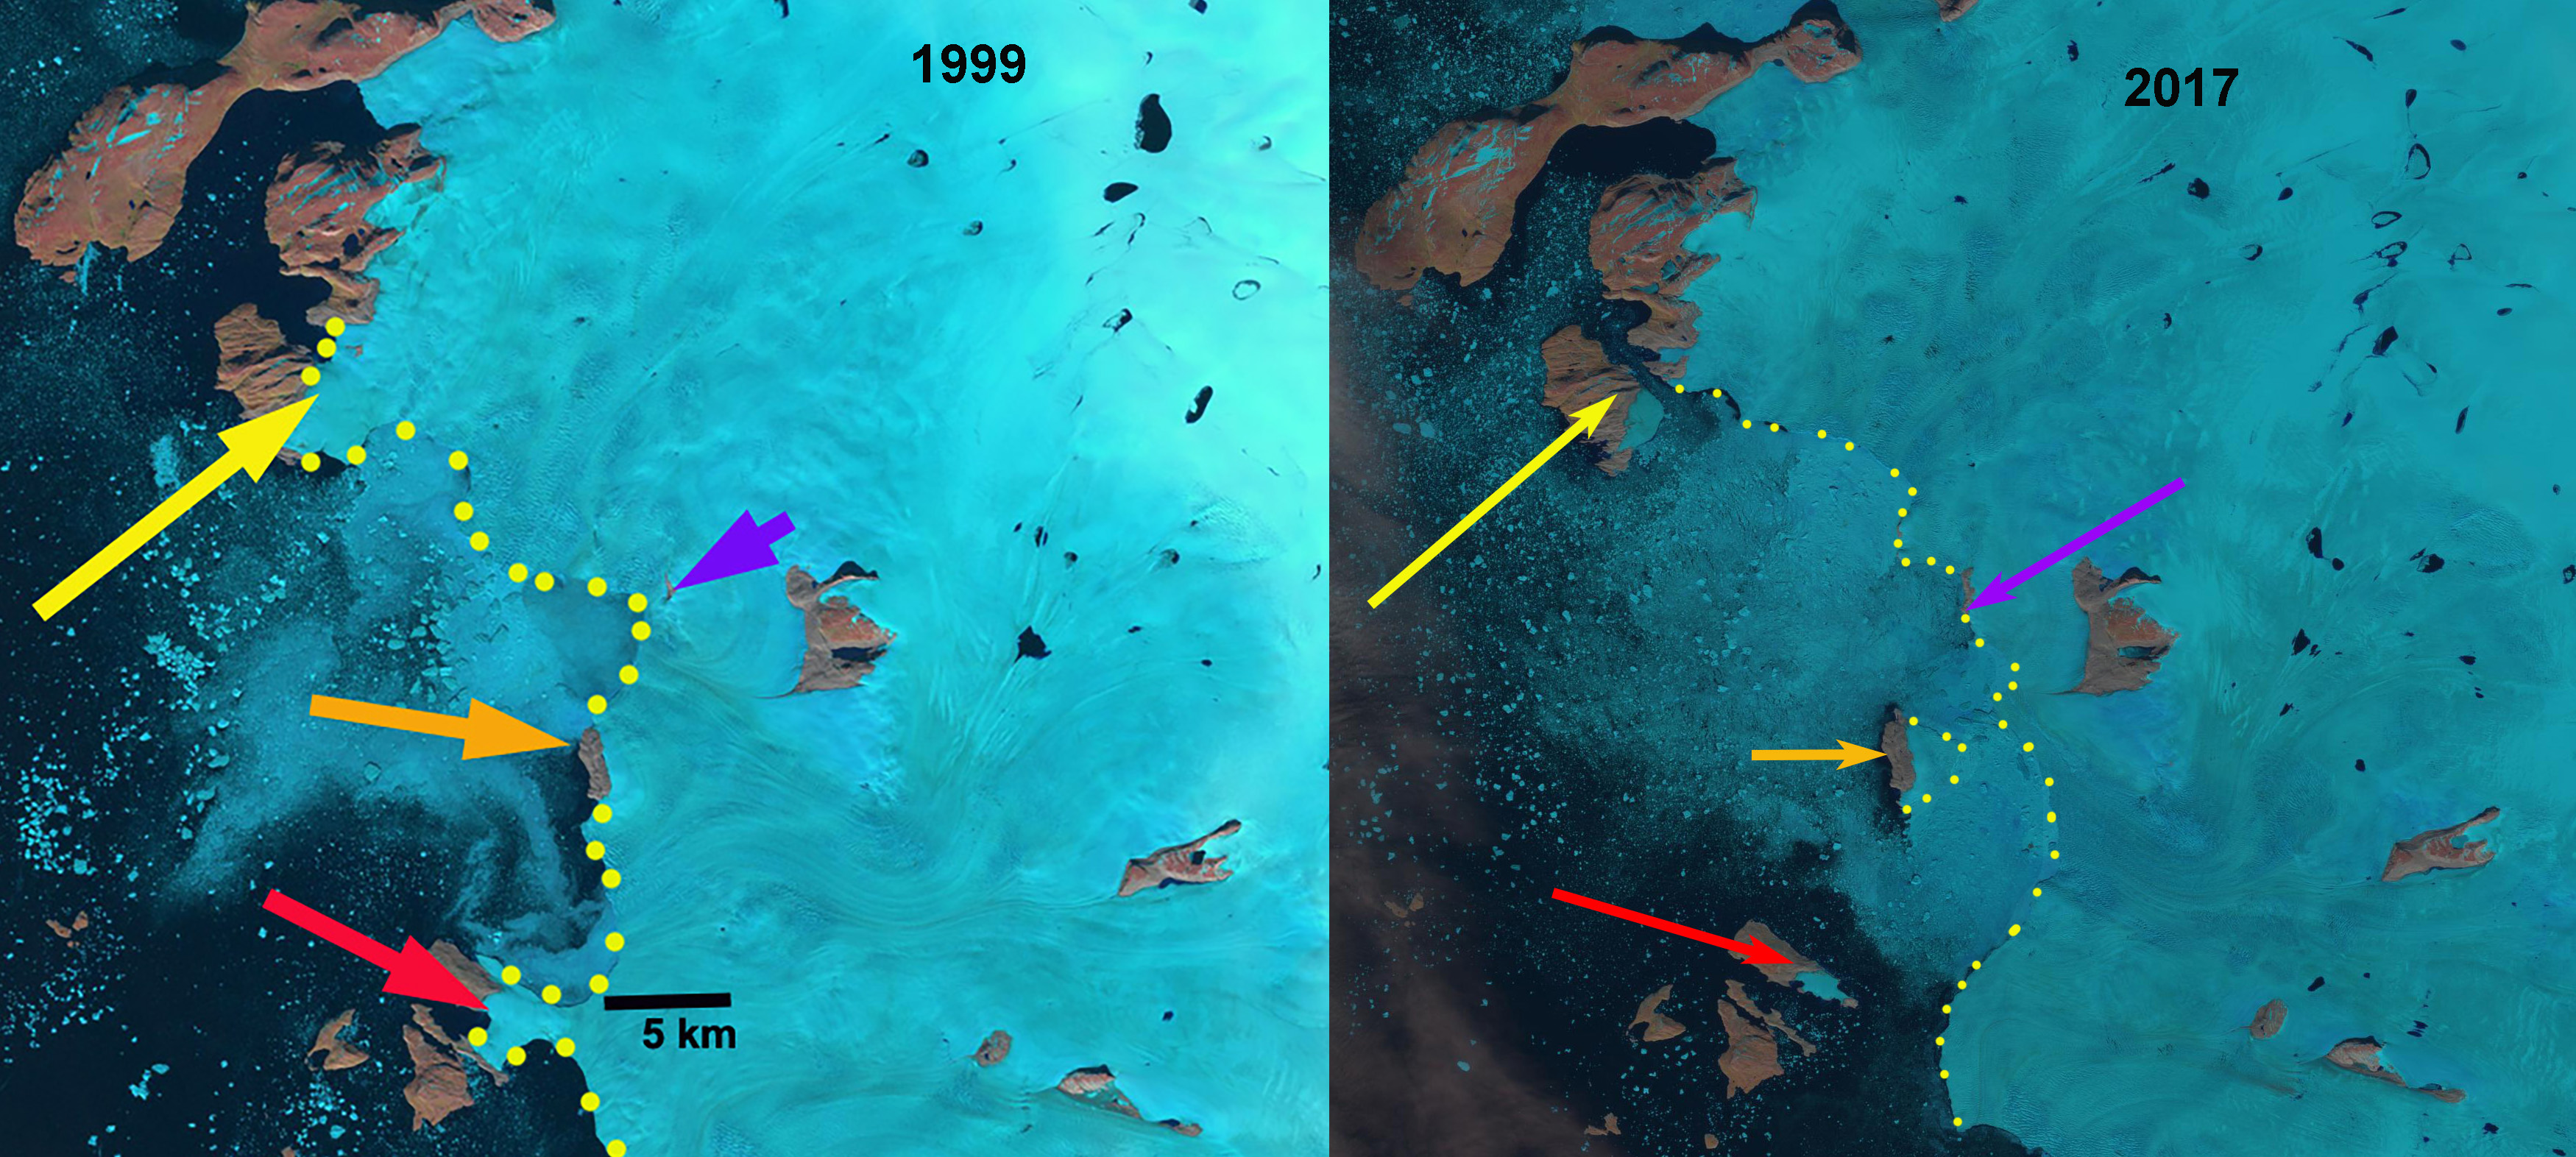
Storbreen, Svalbard in 2013 and 2015 Landsat images.  The red arrows indicate 1990 terminus , yellow arrow the 2017 terminus and purple dots the snowline.   

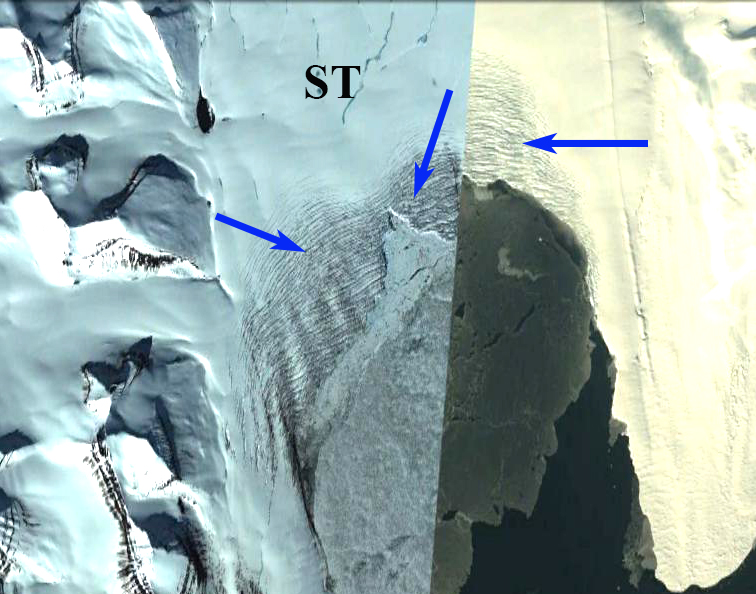
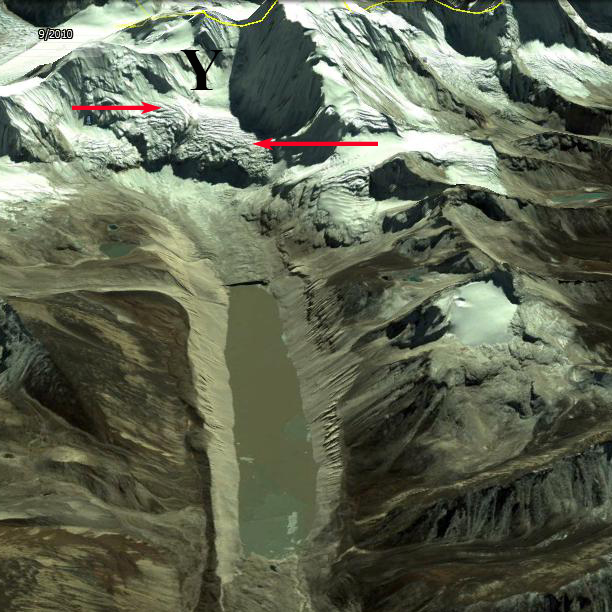
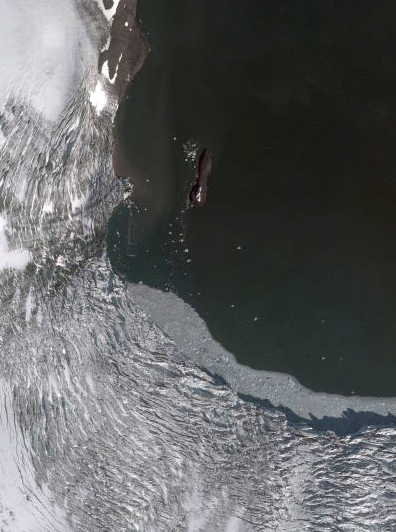
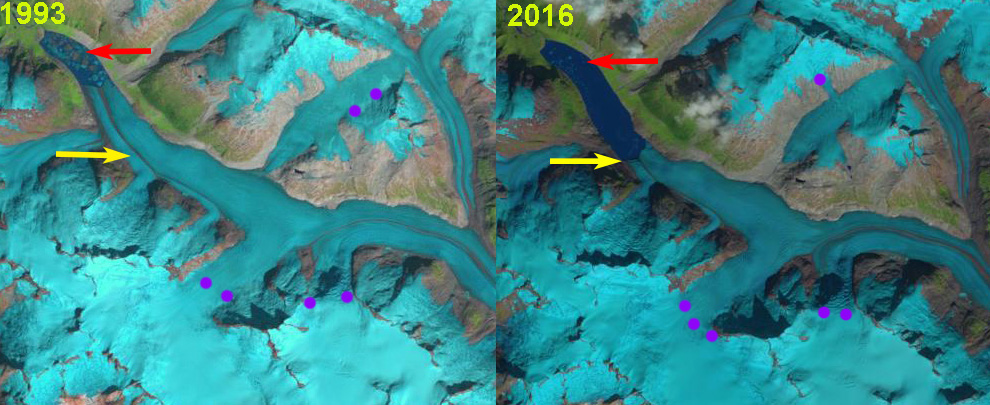
The crevassed front of Storbreen in 2014 on left.  Indicating active calving but also suggestive of a steeper slope than before.  The Fjord head does not appear to be near though. 


Storbreen, Svalbard in 2002 Landsat image.  The red arrows indicate 1990 terminus , yellow arrow the 2017 terminus and purple dots the snowline. 


Ryan Glacier, South Georgia Retreats from Tidewater

Ryan (R) and Brunonia Glacier (B) in 1999 and 2016 Landsat images.  Red arrows indicate the 1999 terminus and pink arrows a new proglacial lake. 

Ryan Glacier and Bunonia Glacier span the width of South Georgia near its northwestern tip.  Brunonia Glacier flow east and terminates in Sunset Fjord and Ryan Glacier flows to the west into Ice Fjord, which seems more viable as a “Sunset” Fjord.  The glacier divide is a very low 400 m.  The British Antarctic Survey (BAS) has generated an excellent online map of South Georgia that includes many layers including glacier frontal change since 1958 in this region.  BAS work by Cook et al (2010) and Gordon et al (2008) have emphasized that there is a island wide pattern of calving glaciers having faster retreat.  Gordon et al., (2008) observed that larger tidewater and calving outlet glaciers generally remained in relatively advanced positions from the 1950’s until the 1980’s. After 1980 most glaciers receded; some of these retreats have been dramatic a such as Hindle and Neumayer.   Here we examine 1999-2016 Landsat imagery to identify glacier change. 

In 1999 Ryan Glacier reaches tidewater across a 1.2 km glacier front.  Brunonia Glacier terminates in Sunset Fjord pinned on what is a bedrock prominence under the ice. In 2013 and 2015 Landsat imagery from early in the melt season indicates the melt zone is below 200 m. In 2015 it is evident that Ryan Glacier no longer reaches tidewater.  In 2016 Ryan Glacier is separated from Ice Fjord by a barrier beach and a narrow developing proglacial lake, pink arrow.  The glacier has retreated 200 m since 1999.  Brunonia Glacier has experienced a 400 m retreat exposing 2 new peninsulas.  The first is on the north side of the fjord and the other is mid glacier. Both had been under the ice in 1999. The snowline in 2016 on Ryan Glacier is also higher reaching 250 m in mid-February.  Retreat of Ryan Glacier from 1958 to 1999 was 100 m, while the retreat on Brunonia in the same period was 700-800 m.

British Antarctic Survey map of frontal change 1958-2015.

Ryan and Brunonia Glacier in 2013 and 2015 Landsat images. The 2015 image indicates Ryan Glacier is no longer tidewater. 


Gråfjellsbrea, Norway Retreat Forms New Lake

Gråfjellsbrea Retreat in Landsat images from 1999 to 2017.  Red arrow indicates 1999 terminus, yellow arrow the 2017 terminus location. 

Gråfjellsbrea is an outlet glacier on the northwest side of the Folgefonna  Icefield that drains into Mysevatnet.  The 2012 Norwegian Glacier Inventory notes the glacier having an area of 8.77 square kilometers in 2002.  In 2016 the Norwegian Water Resources and Energy Directorate (NVE) reported this glacier to have the greatest retreat in 2016 of the 36 glaciers where they measure terminus fluctuations annually.  The NVE report indicates a 550 m retreat from 2002-2016.  Here we examine Landsat imagery  from 1999-2017 that indicates the formation of three new lakes at the terminus of the glacier.

In 1999 the glacier terminated in a bedrock valley east of Grafjellsvatnet.  By 2002 minor retreat had led to formation of a proglacial lake.  The snowline was quite high that year with only a few pockets of retained accumulation.  By 2016 the glacier had receded 550 m since 2002 exposing a narrow length of similar length.  The terminus did retreat significantly~100 m in 2017, the exact distance will be reported by NVE in the coming months.  

Mysevatnet is a reservoir impounded for hydropower production. The lake through a tunnel falling 825 m to produce 250 MW at the Statkraft operated Mauranger Plant  NVE (2014) reports there have been no Jokulhlaups from Grafjellsbrea.This glacier is one of many in Norway supplied by glacier runoff, where the glacier is retreating, Storglombreen is another example.

Digital Globe image of Grafjellsbrea and adjacent lakes.

Grafjellsbrea in 2006 with the lake much smaller, NVE image in the Norwegian Glacier Inventory

Chaxiqudong Glacier, Tibet Retreat From Lake & Tributary Separation

Chaxiqudong Glacier (C) at right and Paqu Glacier (P) at left in Landsat images from 1992 and 2017.  The red arrow indicates the terminus in 1992 and the yellow dots the 2017 margin.  Purple arrow indicates a glacier that disappeared and orange arrow separation of Paqu Glacier. Both glaciers no longer reach the lake. 

Chaxiqudong Glacier and Paqu Glacier are located in a sub-range north of the Nepal-China border.  Chaxiqudong Glacier is adjacent to Longmiojian Glacier. The glaciers drain into Nepal entering the Bhote Khosi River.  The Bothe Khosi had a hydropower project that has been put out of service by a 2015 earthquake and 2016 flood event.    King et al (2017) observe significant surface lowering in the ablation zone of both glaciers (Figure 2), though less than on neighboring larger glaciers.  Zhang et al (2010) observed the loss of glacier area and lake expansion in the region from 1976-2006. Here we examine Landsat imagery from 1992 to 2017 to observe changes. 

Chaxiqudong Glacier terminus in 1992 is in a proglacial lake at the junction of a pair of tributaries red arrow). Paqu Glacier has a wide terminus in a proglacial lake (red arrow).  By 2001 Chaxiqudong Glacier has separated with the eastern tributary still at the margin of the proglacial lake and the western tributary having receded from the lake. Paqu Glacier still is in contact with the lake on a narrow front on the west margin of the lake. By 2015 both tributaries of the Chaxiqudong Glacier have receded significantly from the lake.  Paqu Glacier has retreated from the lake and has separated into two sections, orange arrow.  By 2017 Chaxiqudong Glacier has retreated 400 m since 1992, no longer terminates in a lake and has separated into two glaciers (yellow arrow).  Paqu Glacier has retreated 5oo m no longer terminates in a lake and has separated into two glaciers (yellow arrow).  The retreat of each glacier has occurred without significant calving indicating a retreat driven by negative surface mass balance.  The retreat is less than on the larger Yanong and North Yanong Glacier to the east that also end in lakes still. The retreat of these glaciers from the lakes also reduces the threat of glacier lake outburst floods, as both the risk of  calving and avalanches caused rapid water level change have declined. At the purple arrow is a small cirque glacier in 1992.  This glacier still exists in 2001, but has disappeared by 2015. 

Chaxiqudong Glacier at right and Paqu Glacier at left in Landsat images from 2001 and 2015.  The red arrow indicates the terminus in 1992.  Purple arrow indicates a glacier that disappeared. Both glaciers no longer reach the lake. 

Yanong Glacier, Tibet Retreat Lake Expansion 1992-2017

Yanong Glacier and North Yanong glacier in Landsat images form 1992 and 2017.  Red arrows indicate 1992 terminus and yellow arrows the 2017 terminus. 

Yanong Glacier  and North Yanong Glacier drain northwest from the western flank of Cho Oyu on the Nepal-China border and are in the Tama Khosi watershed.  The glacier terminates in an expanding proglacial lake like a number of neighboring glaciers Drogpa NagtsangRongbuk Glacier and Lumding Glacier King et al (2017) observe that both Yanong and North Yanong have had large negative balances of -.76 m/year and -0.62 m/year respectively.  They also note surface lowering of 3 m per year in the lower ablation zone.  Zhang et al (2010) observed the loss of glacier area and lake expansion in the region from 1976-2006. Here we examine Landsat imagery from 1992 to 2017 to observe changes.

In 1992 the Yanong Glacier and North Yanong Glcier terminate at the red arrows.  The proglacial lake at Yanong is 1.7 km long and is 1.3 km long at North Yanong. By 2001 significant retreat of 200-200 m has occurred on each glacier.  By 2015 Yanong Glacier has retreated east of the a former tributary from the north. The North Yanong glacier is now wider at the terminus than in 2001. In 2017 the proglacial lake at Yanong Glacier is 2.8 km long indicating a retreat since 1992 of 1100 m.  The North Yanong Glacier proglacial lake is 2.1 km long indicating a retreat since 1992 of 800 m.  The steep crevassed nature of North Yanong Glacier right to the terminus suggests the glacier is nearing the end of the lake basin.  The Yanong Glacier has a low slope terminus area that suggests the lake will continue to expand.  The Upper Tamakoshi Hydropower project is a 456 MW peaking run of river  is a hydropower project on the Tamakoshi that is just to be finished in 2018.

Yanong Glacier and North Yanong glacier in Landsat images form 2001 and 2015.  Red arrows indicate 1992 terminus and yellow arrows the 2017 terminus. 

Digital Globe image of Yanong Glacier note the low slope terminus tongue below steep crevassed icefall section, red arrows.

Digital Globe image of  North Yanong Glacier note the l steep crevassed icefall section, red arrows that leads right to the terminus. 

Gangge’er Glacier, Retreat & Tributary Separation Qilian Mt. China

Gangge’er Glacier, Qilian Mt., China comparison in 1997 and 2017 Landsat Images.  Yellow arrows indicates 2017 terminus, red arrows the 1990 terminus, and purple arrows tributaries that have detached.  The snowline is  purple dots and Points 1-3 indicate bare rock areas amidst the glacier.

The largest glacier in the Gangge’er Xiaoheli Shan range of the the Qilian Mountains in China, here referred to as Gangge’er Glacier, drains northwest into the Shule River.   Glaciers in the Qilian Mountains in northwest China’s Gansu Province have shrunk by 36 square kilometers, a 4.2 percent loss, during the past decade Quiang (2016).  Tian et al (2014) report Qilian Mountain glacier area shrank by 30% from 1956 to 2010 and the shrinkage accelerated remarkably in the past two decades.  Yang et al (2015)  Results show that mountain glaciers in China are very vulnerable to climate change with 41% of glaciers having had a high vulnerability in the period 1961–2007. For the Upper Shule Basin the impact of glaciers on the overall water resource is not known as Li  and Yang (2017) observe that  that the basic features of precipitation in the upper reaches of the Shule River were unexplored prior to their study and there is no national weather station in the basin.  They found that most of the precipitation occurred during the summer. 

What is apparent in a comparison of Landsat images from 1997-2017 is the changes in the glacier.  In 1997 the glacier is joined by three main tributaries from the south and four from the north.  The western most from the north and south are noted by the purple arrow.  The glacier terminates at the red arrow and the snowline is low on the glacier at 4600 m, likely after a summer snowstorm. The areas of bedrock amidst the glacier at Points 1-3 are limited.  In 1999 the snowline is above the main stem of the glacier at 4800 m.  There has been limited change since 1997, there is a small cloud causing a ground shadow right at the terminus.  By 2016 and 2017 the westernmost tributary from the north and south have detached from the glacier , purple arrows.  The areas of bedrock amidst the glacier at Point 1-3 have all expanded indicating upglacier thinning.  The terminus has retreated to the yellow arrow a distance of 900 m in 20 years.  In the digital globe image below extensive surface streams indicate significant meltwater drainage up to 4900 m, above the snowline in both images. The surface streams indicate a cold layer of ice preventing surface meltwater infiltration.  


Gangge’er Glacier, Qilian Mt., China comparison in 1999 and 2016 Landsat Images.  Yellow arrows indicates 2017 terminus, red arrows the 1990 terminus, and purple arrow tributary that has detached.   Points 1-3 indicate bare rock areas amidst the glacier.


Google Earth image of the glacier indicating flow directions dark blue arrows, surface streams light blue arrows and separated tributaries purple arrows.

Glacier Retreat Generating New Islands List

Climate change has been driving the recession of glaciers and ice sheets, which in turn has been changing our maps.  One notable category of physical geographic features indicative of the change due to the retreat is the formation of new islands.  Below is a list of new islands that this blog has identified and reported.  This is not a comprehensive list of all islands that have been formed.  

Upernavik Glacier, Greenland in Landsat images from August 2000 and August 2016.  Each Point is at the same location in both image, and the changes are noted in the discussion below.  The same locations are also identified in the July 2001 and Aug. 2016 image below. 

Kong OscarGreenland: Island A forms with B and C on the verge.

Steenstrup Glacier, Greenland front in 2015 and 2017 illustrating location with respect to the new islands at: Red Head-red arrow, Tugtuligssup Sarqardlerssuua at yellow arrow , and the 2017 new island at orange arrow.  Yellow dots indicate icefront and purple arrow another future island to be released from the glacier.  

corontation-compare-copy

Coronation Glacier, Canada: A Landsat image from 1989 and a Sentinel 2 image from 2016 illustrate the retreat of Coronation Glacier.  Red arrows indicate the 1989 terminus and yellow arrows the 2016 terminus location.  Purple numbers 1-5 indicate locations of tributary retreat or thinning. Purple numbers 6-9 are icecaps that did not retain snowcover in 2016. 

Chernysheva Glacier and Borozova, Novaya Zemlya comparison in 1990 and 2015 Landsat images. Red arrows indicates 1990 terminus and yellow arrow 2015 terminus position. Island has formed at the 1990 terminus position of Chernysheva.

Tasija and Krayniy GlacierNovaya Zemlya: Tasija Glacier (T) and Krayniy Glacier (Ky) compared in 1990 and 2015 Landsat images.  Red arrows indicate 1990 terminus positions, yellow arrows 2015 terminus positions and purple arrows upglacier thinning. A new island formed upper right red arrow.

Nizkiy Glacier, Novaya ZemlyaNizky Glacier (N) and Glasnova Glacier (G) compared in 1990 and 2015 Landsat images.  Red arrows indicate 1990 terminus positions, yellow arrows 2015 terminus positions and purple arrows upglacier thinning.  An island has formed at the second red arrow from the bottom.

Krivosheina GlacierNovaya Zemlya:  Krivosheina Glacier compared in 1990 and 2015 Landsat images.  Red arrows indicate 1990 terminus positions, yellow arrows 2015 terminus positions and purple arrows upglacier thinning.  Point A indicates a new island that has formed.

Vilkitskogo GlacierNovaya ZemlyaVilkitskogo South Glacier (Vs) and Vilkitskogo North Glacier (Vn) compared in 1990 and 2015 Landsat images.  Red arrows indicate 1990 terminus positions, yellow arrows 2015 terminus positions and purple arrows upglacier thinning.


Vasilievebreen, Svalbard: retreat from 1990-2017 has led to the creation of one island at the pink arrow, while the island at the orange arrow has eroded and an island at the white arrow is on the verge of being released by the glacier.  

Samarinbreen, Svalbard: Landsat imagery from 1990-2014 illustrates that the retreat of the glacier has been 2.1 km including the formation of an island.

Chako Glacier, Tibet Retreats From Proglacial Lake

Chako Glacier, Tibet in Landsat images from 1991, 2001 and 2017.  Red arrow indicates 1991 terminus, yellow arrow 2017 terminus, purple tributary glacier connection and orange arrow nearby icecap.

Chako Glacier flows north from Chako Peak on the Nepal-Tibet, China border, in the Lugula Himal.  Glacier runoff eventually reaches the Yarlung Tsangpo and then the Brahmaputra River. Gardelle et al, (2013) identified this glacier as part of their West Nepal region, which experienced mass loss averaging -0.32 m/year from 1999-2011. This mass loss has driven wide spread retreat of glaciers along the border ranges between India/Nepal and Tibet.  In Tibet west and east of Chako Glacier are the retreating Menlung Glacier, West Ganglung Glacier and Chutenjima Glacier.

In 1991 the glacier terminated in a proglacial lake at 5450 m red arrow, with a key tributary entering from the east, purple arrow. An ice cap just west of the glacier has a width of 700 m. In 1994 there is little evident change. By 2001 the glacier has retreated to the southern end of the lake basin, with the eastern tributary still connected.  In 2005 the terminus remains heavily crevassed and still in contact with the lake.  By 2016 the eastern tributary no longer connected with Chako Glacier and the glacier no longer reaches the lake.  In 2017 the glacier has retreated 600-700 m since 1991 with limited crevassing at the terminus.  The terminus is notably thinner as well.  The loss of crevassing and connection with the tributary from the east indicates retreat is ongoing. The icecap to the west has been reduced in area, the width being 450 m in 2017. The images are typically from September-November and do not show the snowline at the highest elevation. The expansion of three bedrock areas separating tributaries and generating lateral moraines indicate upglacier thinning as well.


Chako Glacier, Tibet in Landsat images from 1994 and 2016.  Red arrow indicates 1991 terminus, yellow arrow 2017 terminus, purple tributary glacier connection and orange arrow nearby icecap.

Google Earth image of Chako Galcier terminus in 2005 and 2017.  Note difference in crevassing.  red arrow 2005 terminus and yellow arrow 2017 terminus.

Chako Glacier, with Chako Peak indicated by green triangle.

Steenstrup Glacier, NW Greenland Releases New Island in 2017

Steenstrup Glacier front in 2015 and 2017 illustrating location with respect to the new islands at: Red Head-red arrow, Tugtuligssup Sarqardlerssuua at yellow arrow , and the 2017 new island at orange arrow.  Yellow dots indicate icefront and purple arrow another future island to be released from the glacier.  

Steenstrup Glacier is located at 75.2 N in Northwest Greeland terminating in Melville Bay. The glacier terminates on a series of headlands and islands, the glacier immediately to the south is Kjer Glacier. The boundary between Steenstrup Gletscher and Kjer Glacier is Red Head and Steenstrup Glacier’s northern margin is at Cape Seddon. A previous post examined changes in the terminus position of Steenstrup and Kjer Glacier from 1999 to 2013 including formation of a new island at Red Head.  Another post in 2014 examined the formation of an additional island at Tugtuligssup Sarqardlerssuua.  Here we report formation of another new island at the glacier front in 2017 that is southwest of the Kloftet Nunatak.  The islands act as pinning points stabilizing the front, when a connection is lost there is typically a significant retreat of the glacier in the vicinity of the new island. 

In 1999 the Front of Steenstrup was pinned on three headlands at the yellow, orange and red arrows.  By 2005 the glacier had retreated from Red Head (Van As, 2010).  By 2013 the connection of ice at the yellow arrow at Tugtuligssup Sarqardlerssuua was thin and on the verge of failure which did occur in 2014.  In 2015 the connection to the pinning point at the orange arrow was thinning, this continued in 2016 and failed in 2017 creating a new island.  Retreat from Red Head 2005 to 2017 is 6 km, retreat from the orange arrow pinning point from 2016 to 2017 is 4 km and retreat at Tugtuligssup Sarqardlerssuua from 1999-2017 is 3 km.  The ice front is approaching Kloftet Nuntak just south of the purple arrow. McFadden et al (2011) noted several glaciers in Northwest Greenland Sverdrups, Steenstrup, Upernavik, and Umiamako that had similar thinning patterns. Each glacier also had a coincident speed-up with a 20% acceleration for Steenstrup Glacier (McFadden et al, 2011). This is a familiar pattern with thinning there is less friction at the calving front from the fjord walls, pinning points and the fjord base, leading to greater flow. The enhanced flow leads to retreat and further thinning, resulting in the thinning and the acceleration spreading inland.  Changes in the position of the ice front can also be viewed at  the Polar Portal.

Steenstrup Glacier front in 1999 and 2017 illustrating location with respect to the new islands at: Red Head-red arrow, Tugtuligssup Sarqardlerssuua at yellow arrow , and the 2017 new island at orange arrow.  Yellow dots indicate icefront and purple arrow another future island to be released from the glacier.  

Steenstrup Glacier front in 2016 indicating connection still to the pinning point that becomes an island in 2017, orange arrow.

Klinaklini Glacier, British Columbia Retreat Generates Large Icebergs

Klinaklini Glacier comparison in Landsat images from 1987 and 2017.  Red arrow 1987 terminus, yellow arrow 2017 terminus and snowline at purple dots.

Klinaklini Glacier is the largest glacier in the Coast Mountains of British Columbia between Vancouver and Prince Rupert.  The glaier drains west and south from Mt. Silverthrone.  There is significant accumulation area above 2500 m and the glacier terminates at 300 m.  GLIMS noted the area in 2004 as ~470 km2.  Glaciers in this region are retreating and losing volume, Schiefer et al (2007) noted that the rate of volume loss had doubled in  the most recent decade.  Clarke et al (2015) modeled a 70% loss in volume of all glacier in western BC by 2100. Here we examine Landsat imagery from 1987-2017, to identify changes.  In particular examining the area of large icebergs in 2015-2017 generated from a rapid calving retreat that has occurred since 2010. The glacier drains in to Knight Inlet a famous area for salmon fishing. 

I first saw this glacier in 1982 and at that time it ended on an outwash plain with a narrow lake/wide river leading from the terminus.  In 1987 the terminus was at this same location, red arrow, with no significant lake at the terminus.  The snowline in 1987 is at 1500 m.  By 1995 a lake had formed across the width of the terminus.  The lake was than 600 m long and the snowline was at 1600 m. In 2010 the glacier had retreated more than 1 km across its entire 1.3  km width.  The lake at the terminus had a surface area greater than 1.5 km2 and was largely filled with icebergs.  The snowline in 2010 is at 1500 m.  By 2013 the main proglacial lake has expanded to a length of over 2 km and remained largely filled with icebergs.  Retreat from 2010-2013 was as great as the retreat from 1995 to 2010.  The snowline in 2013 was at 1600 m.  From 2013 to 2014 there was no real change in the terminus position and the largest iceberg remained the same, pink (1).  In 2015 the snowline is at 1600 m and is at 1700 m in 2016.  In the side by side comparison of the terminus in 2015, 2016 and 2017 it is apparent that there was limited retreat from 2013, and a large calving event in 2017 generating an iceberg with an area of 0.7-0.9 square kilometers, pink (2), along with other smaller icebergs.  The lake is now 4 km long, yielding a retreat rate of 130 m/year from 1987-2017.  Nearly 50% of the retreat occurred in 2017.  In 2017 the snowline is at 1700 m as well.  The high snowlines each year are leading to mass loss, which leads to reduced flow through the ablation zone.  The thinning terminus due to higher ablation and less flux from above is then more prone to breakup.  The Klinaklini Glacier wins the prize for the largest observed iceberg produced by a glacier in Western Canada. The retreat is similar to other valley glaciers in the region Bishop GlacierJacobsen Glacier, Bridge Glacier and  Klippi Glacier.

Comparison of the terminus, pink dots in 2015, 2016 and 2017.  The red arrow is the 1987 terminus, yellow arrow the 2017 terminus and the largest icebe

rgs also labelled. 


34th Annual, 2017 North Cascade Glacier Climate Project Field Season

2017 Field Season Video

For the thirty fourth consecutive summer we headed into the field to monitor the continued response of North Cascade glaciers to climate change.  In 1984 when I began this program we selected 10 key glaciers to monitor.  Two of these have now disappeared.  All the glaciers have retreated extensively and lost considerable volume.  The mass balance loss is 19 m of water equivalent thickness, which is over 20 m of ice thickness loss on glaciers that averaged less than 75 m thick. This is significant with 25-30% of their entire volume lost. This project continues to monitor glacier loss and the runoff they provide.  We also complete an annual inventory of ice worms on Sholes Glacier and mountain goats on Ptarmigan Ridge region.  In 2017 our key project was a continue partnership with the Nooksack Indian Tribe monitoring glacier melt and runoff in the North Fork Nooksack River basin.  We have not yet had the chance to determine the daily glacier discharge and the resultant contribution to the North Fork Nooksack River. The dry conditions of August certainly will lead to many days with  more than 40% of the flow coming from glacier melt as was the case in 2015. 

The snowpack on April 1st snowpack was 110% of normal, by June 1st, the snowpack was trending down steeply, but
remained well above the last four years and similar to 2012. Summer turned out to be the driest on record in Seattle and

June 1 snowpack comparison

tied for the warmest for the June 21-Sept. 22nd period (KOMONews).  In the mountains the overall melt season temperatures for May 1 through Sept. 30th was 0.15 C cooler than 2015 values, due to a cooler spring.  The most striking feature of the field season was the forest fire smoke largely from British Columbia that obscured views most days. 

Of the glaciers observed one had a significant positive balance, one a slight positive balance-essentially equilibrium and seven had negative mass balances.  The two glaciers with the most positive balance were the Sholes and Rainbow Glacier, adjacent glacier on the north side of Mount Baker.  The nearby Mount Baker ski area reported 860 inches of snow in 2017, significantly above average.  Compared to other locations in the range this winter snowfall was a positive anomaly, that also was observed on the nearby glaciers. The snow water equivalent in multiple crevasses on Rainbow Glacier at 2000 m in early August was 3.8-4.1 m.  On both Easton and Rainbow Glacier the mass balance gradient was steeper than usual.  On Rainbow Glacier the mass balance was -3 m at 1500 m, 0 at 1700 m and +2.5 m at 200 m as summer ended. We also observed terminus retreat on every glacier.   Retreat averaged 12 m in 2017, lower than in 2015 or 2016.  More striking than retreat in some cases is thinning that reduces slope and frontal thickness.  On Lower Curtis Glacier the terminus seracs are 15 m shorter than two years ago.  On Columbia Glacier the lowest 200 m of the glacier has a slope that has declined by 5 degrees in the last three years and the glacier terminus has retreated 60 m in two years. 


Bishop Glacier Retreat, British Columbia Generates Substantial Alpine Lake

Bishop Glacier retreat in Landsat images from 1985 and 2017, 3000 m retreat. Red arrow is the 1985 terminus, yellow arrow is the 2017 terminus, purple dots is the snowline. B=Bishop, R=Ring, L=Lillooet.

Bishop Glacier is a 10.5  km long western outlet glacier of the Lillooet Icefield in British Columbia. The glacier shares a divide with the eastern outlet Lillooet Glacier at 1750 m.  The glacier from 1985-2017 has ended in a rapidly expanding glacial lake.  Here we examine the retreat using Landsat imagery from 1985-2017.  Bridge Glacier drains east from the same icefield and after a period of sustained retreat, 30 m per year from 1981-2005 (Allen and Smith, 2007), calving enhanced the retreat from 2004-2016 averaging 250 m/year (Pelto, 2017).  Chernos (2016) observed that as Bridge Glacier neared the upglacier end of the developing lake basin retreat would slow. 

In 1985 Bishop Glacier terminated in a 1 km long proglacial lake at 1300 m. Ring Glacier was the main tributary, joining from the north.  The snowline averaged 2000 m. By 1993 the lake had expanded to a length of 2.25 km, the snowline was at 2150 m and Ring Glacier was barely connected to the main glacier.  From 1993-2002 retreat was slower with the lake expanding to 2.5 km in length, the snowline was at 1950 m and Ring Glacier had detached from Bishop Glacier.  In 2016 the snowline was at 2300 m and the lake was relatively free of icebergs.  In 2017 the proglacial lake is 4 km with a glacier retreat of 3000 m in 32 years.  Ring Glacier has retreated 800 m from Bishop Glacier. The lake is relatively free of icebergs in 2017 as well, suggesting a reduced calving rate in recent years.  There is an increase in slope 1 km above the terminus, pink arrow in Google Earth image suggesting this is the maximum distance the lake will extend upvalley.   Retreat should slow due to reduced calving, but will continue as indicated by the Ring Glacier and others retreating that are not calving glaciers. The snowline in 2017 despite a snowy winter is quite high at 2300 m.   The retreat is similar to other valley glaciers in the region Jacobsen Glacier  Klippi Glacier.

Bishop Glacier retreat in Landsat images from 1993 and 2016. Red arrow is the 1985 terminus, yellow arrow is the 2017 terminus, purple dots is the snowline.


Google Earth image of Bishop and Ring Glacier, pink arrow shows the change in slope.

Bishop Glacier retreat in Landsat images from 2002. Red arrow is the 1985 terminus, yellow arrow is the 2017 terminus, purple dots is the snowline.