Nizkiy Glacier Embayment Expands Island Forms, Novaya Zemlya

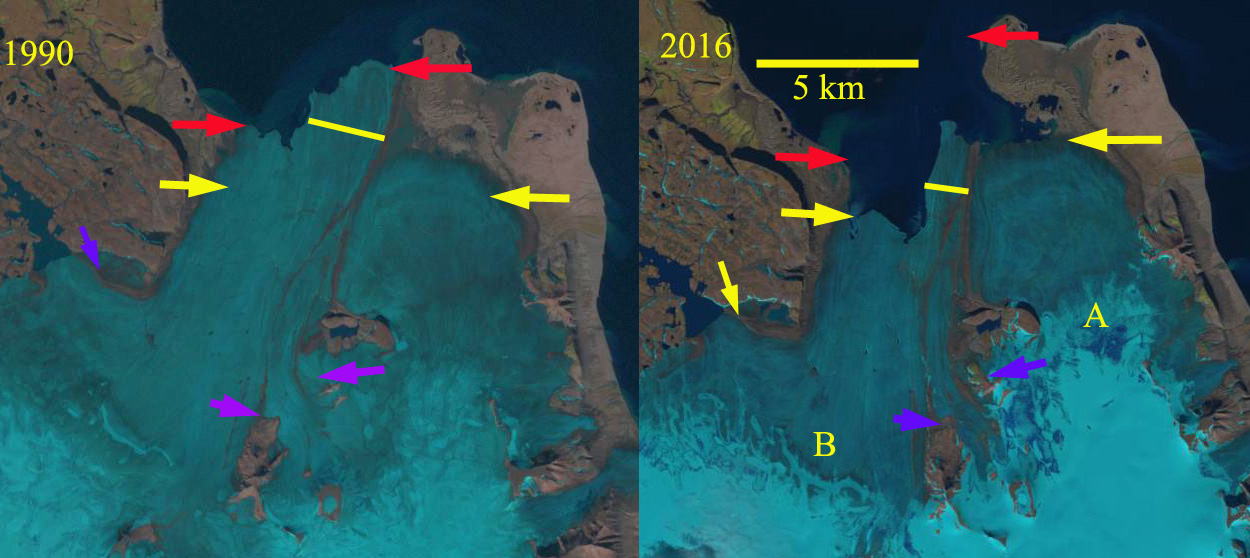
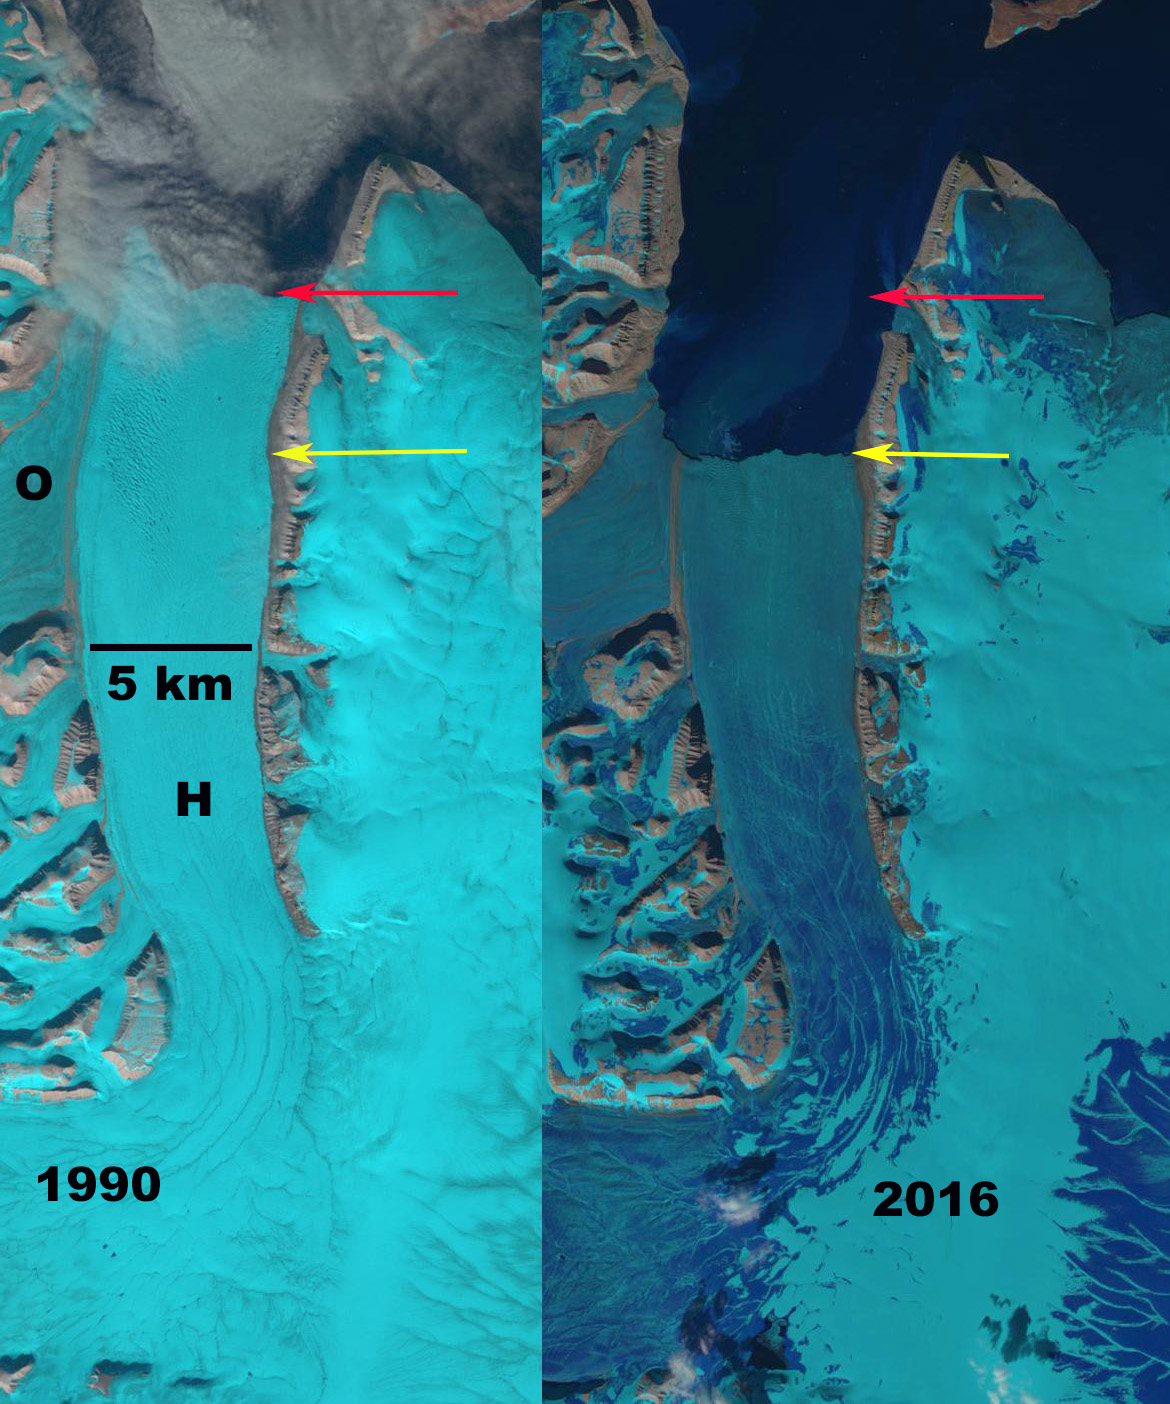
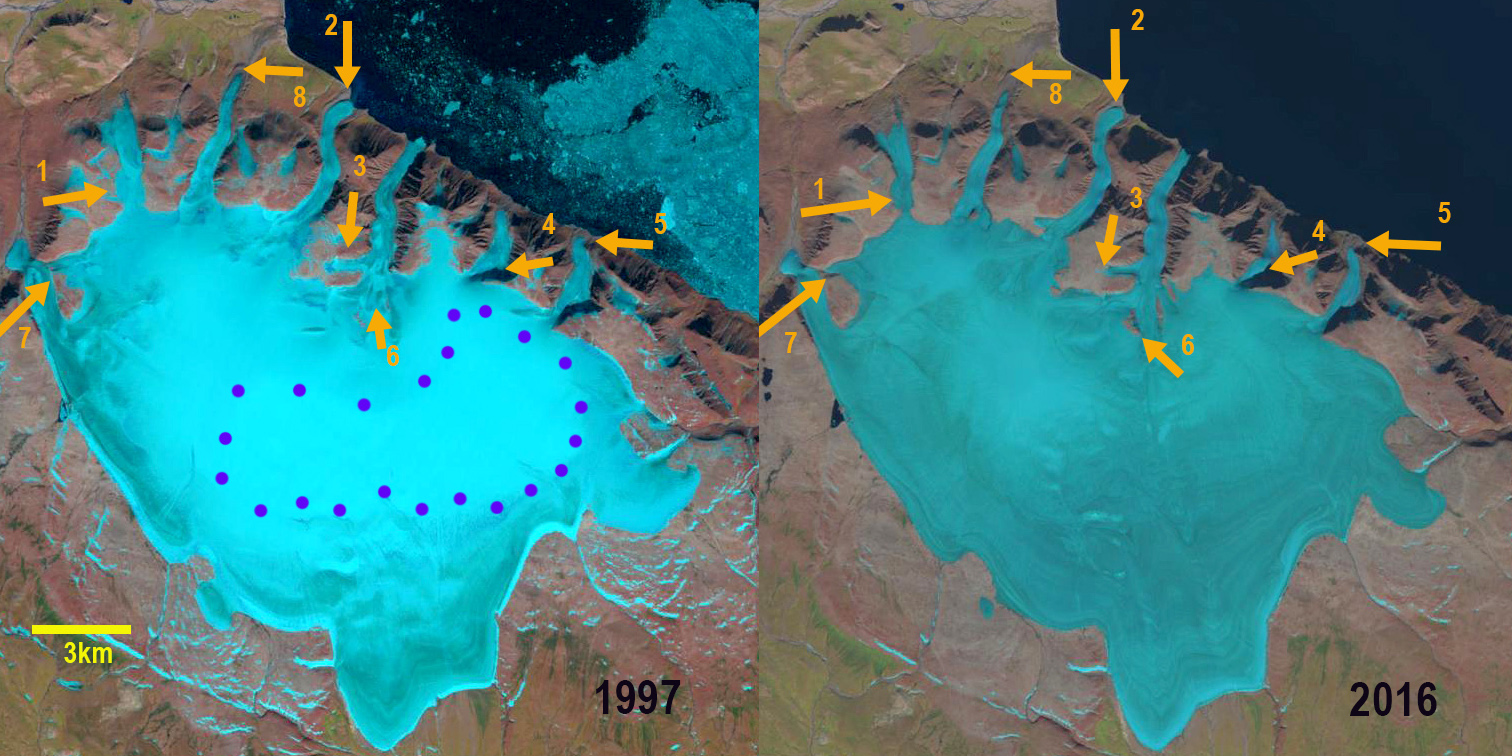
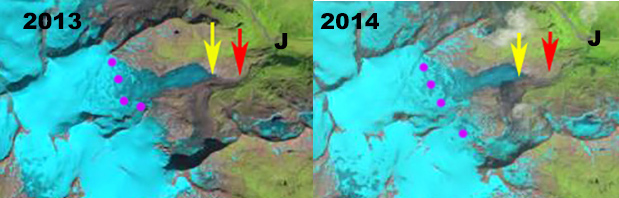
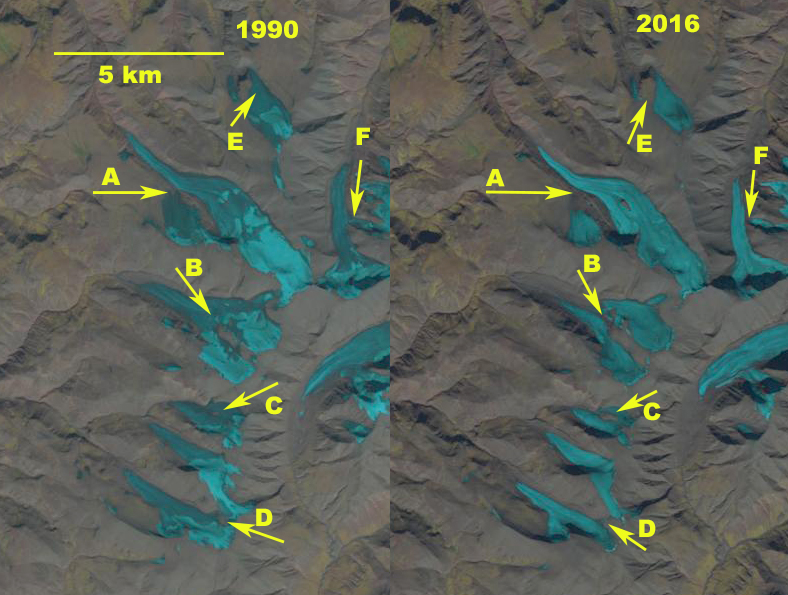
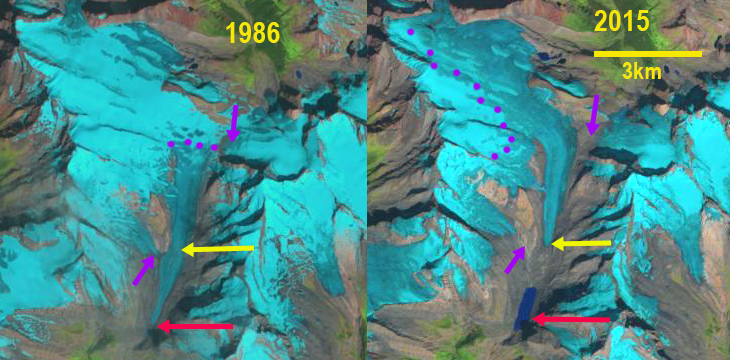
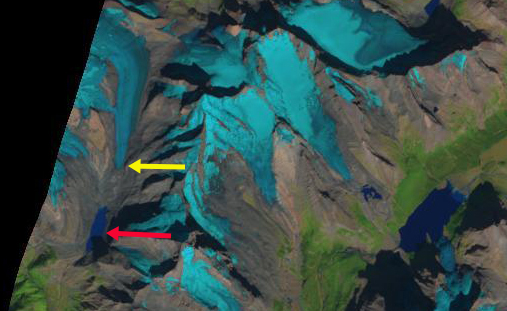
Nizkiy Glacier in 1990 and 2016 Landsat images.  red arrows indicate locations of the 1990 terminus and yellow arrows the 2016 terminus.  Purple arrow indicates an expanding bedrock rib amidst the glacier and purple dots indicate the snowline.

Nizkiy  Glacier is on the west coast of the island reaching the Barents Sea Coast. The glaciers of northern Novaya Zemlya, Russia are truly generally out of sight out of mind. There remoteness and lack of importance as a water resource being the key reasons. It is particularly important to pay attention to these glaciers due to the recent changes in sea ice cover that have left a much longer duration of open water around the island particularly to the west in the Barents Sea.  Nizkiy lost 1.2  km2 in area  from 1990-2000  (LEGOS, 2006).  Carr et al (2014) identified an average retreat rate of 52 meters/year for tidewater glaciers on Novaya Zemlya from 1992 to 2010 and 5 meters/year for land terminating glaciers. Here we compare a Landsat image from 1990 and 2016.

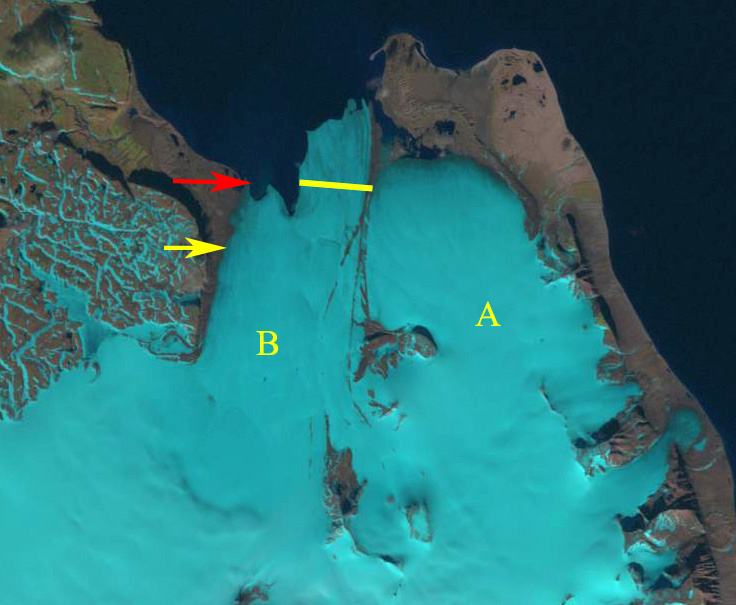
The Nizkiy Glacier has several termini in lakes and one in the Barents Sea. The main terminus juts north out to the end of a peninsula in 1990, with an embayment developing from the peninsula across to the northern edge of the terminus. The middle terminus ends in a proglacial lake and in 1990 the terminus largely envelops an island in the lake. The southernmost terminus is in a proglacial lake shown is indicated by a red arrow as well. The 2016 Landsat image indicates the continued reduction in Nizkiy Glacier width reaching the peninsula at the yellow arrow, having retreated 1200 m from the 1990 position.  Hence, It will likely be quite soon when the proglacial lake with the island joins with the Barents Sea. The northern edge of the terminus has retreated little, but the size of the embayment between the northern edge and the peninsula has doubled since 1990.   A new island has been exposed in the proglacial lake between the main terminus and the peninsula.  The expansion of the proglacial lake on the north side of the glacier just inland of the main terminus has retreated 600 m.  The southernmost terminus has retreated 1100 m in an expanding proglacial lake. The purple arrow in the comparison image indicates an expanding rib of bedrock amidst the glacier. In 1990 the snowline is at  550 m.  In 2015 the snowline is at 450 m.  In July of 2016 the snowline is at  525 and in September is at 600 m. This glacier fits the pattern of other Novaya Zemlya glaciers (Pelto, 2016), such as Krayniy and Tasija.  The lack of sea ice off the west coast of Novaya Zemlya in April of 2017, seen below, is a continuation of the pattern of open water early in the melt season, enhancing frontal melt. Note the pattern of sea ice in mid-April of 2004-2012 below

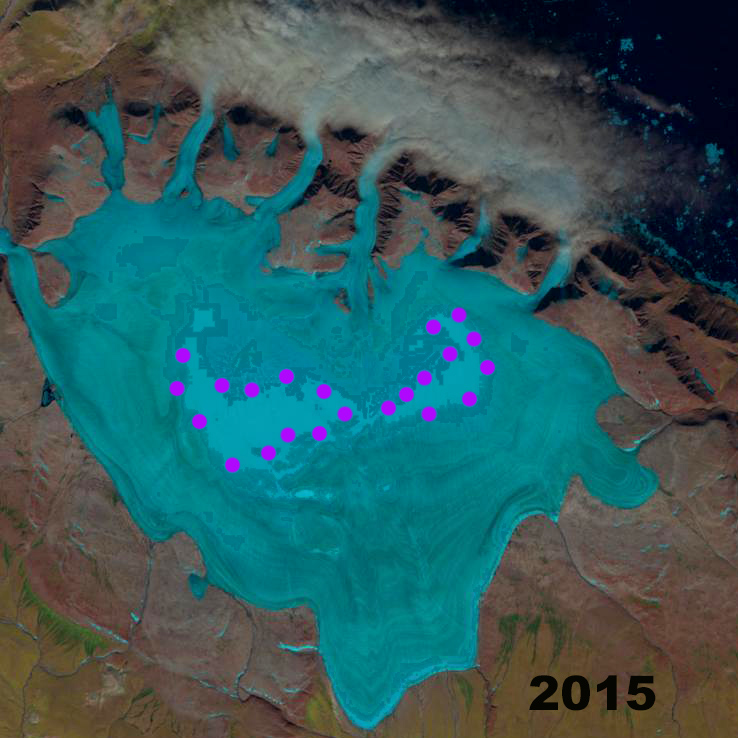
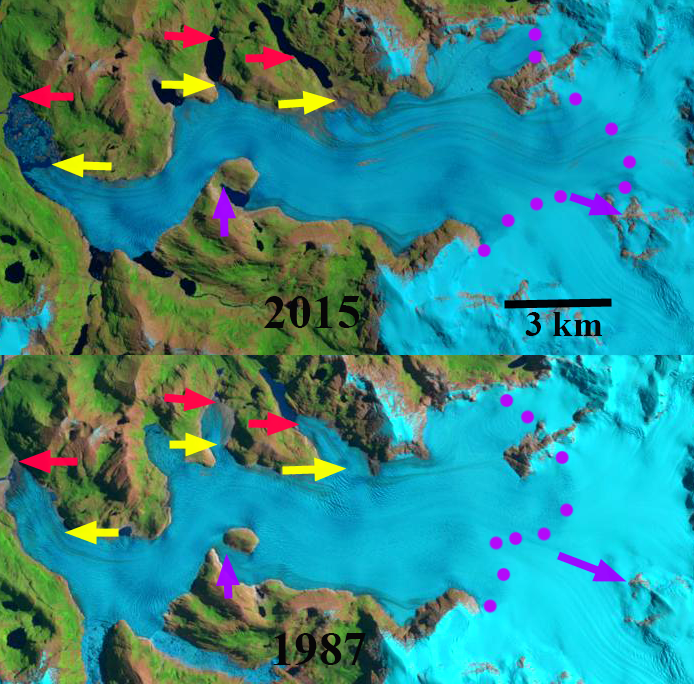
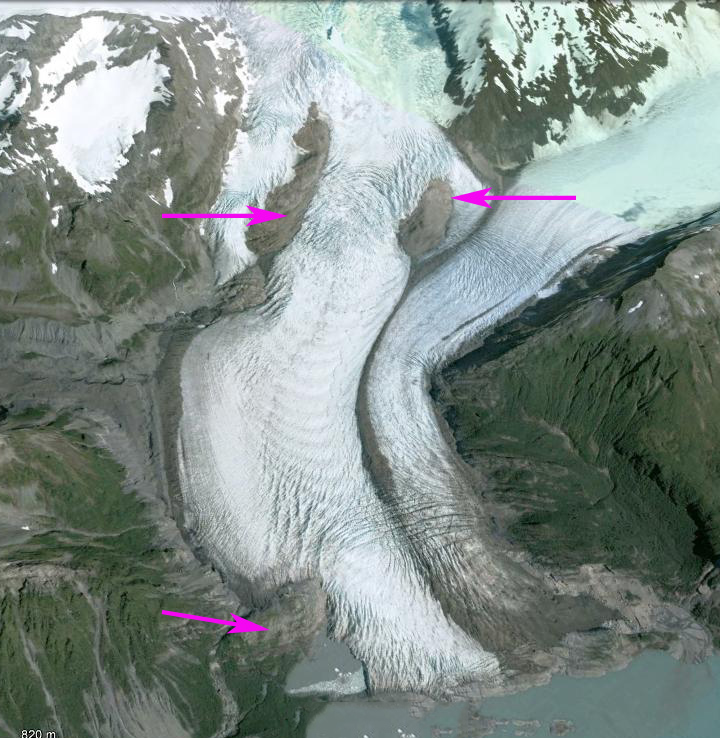
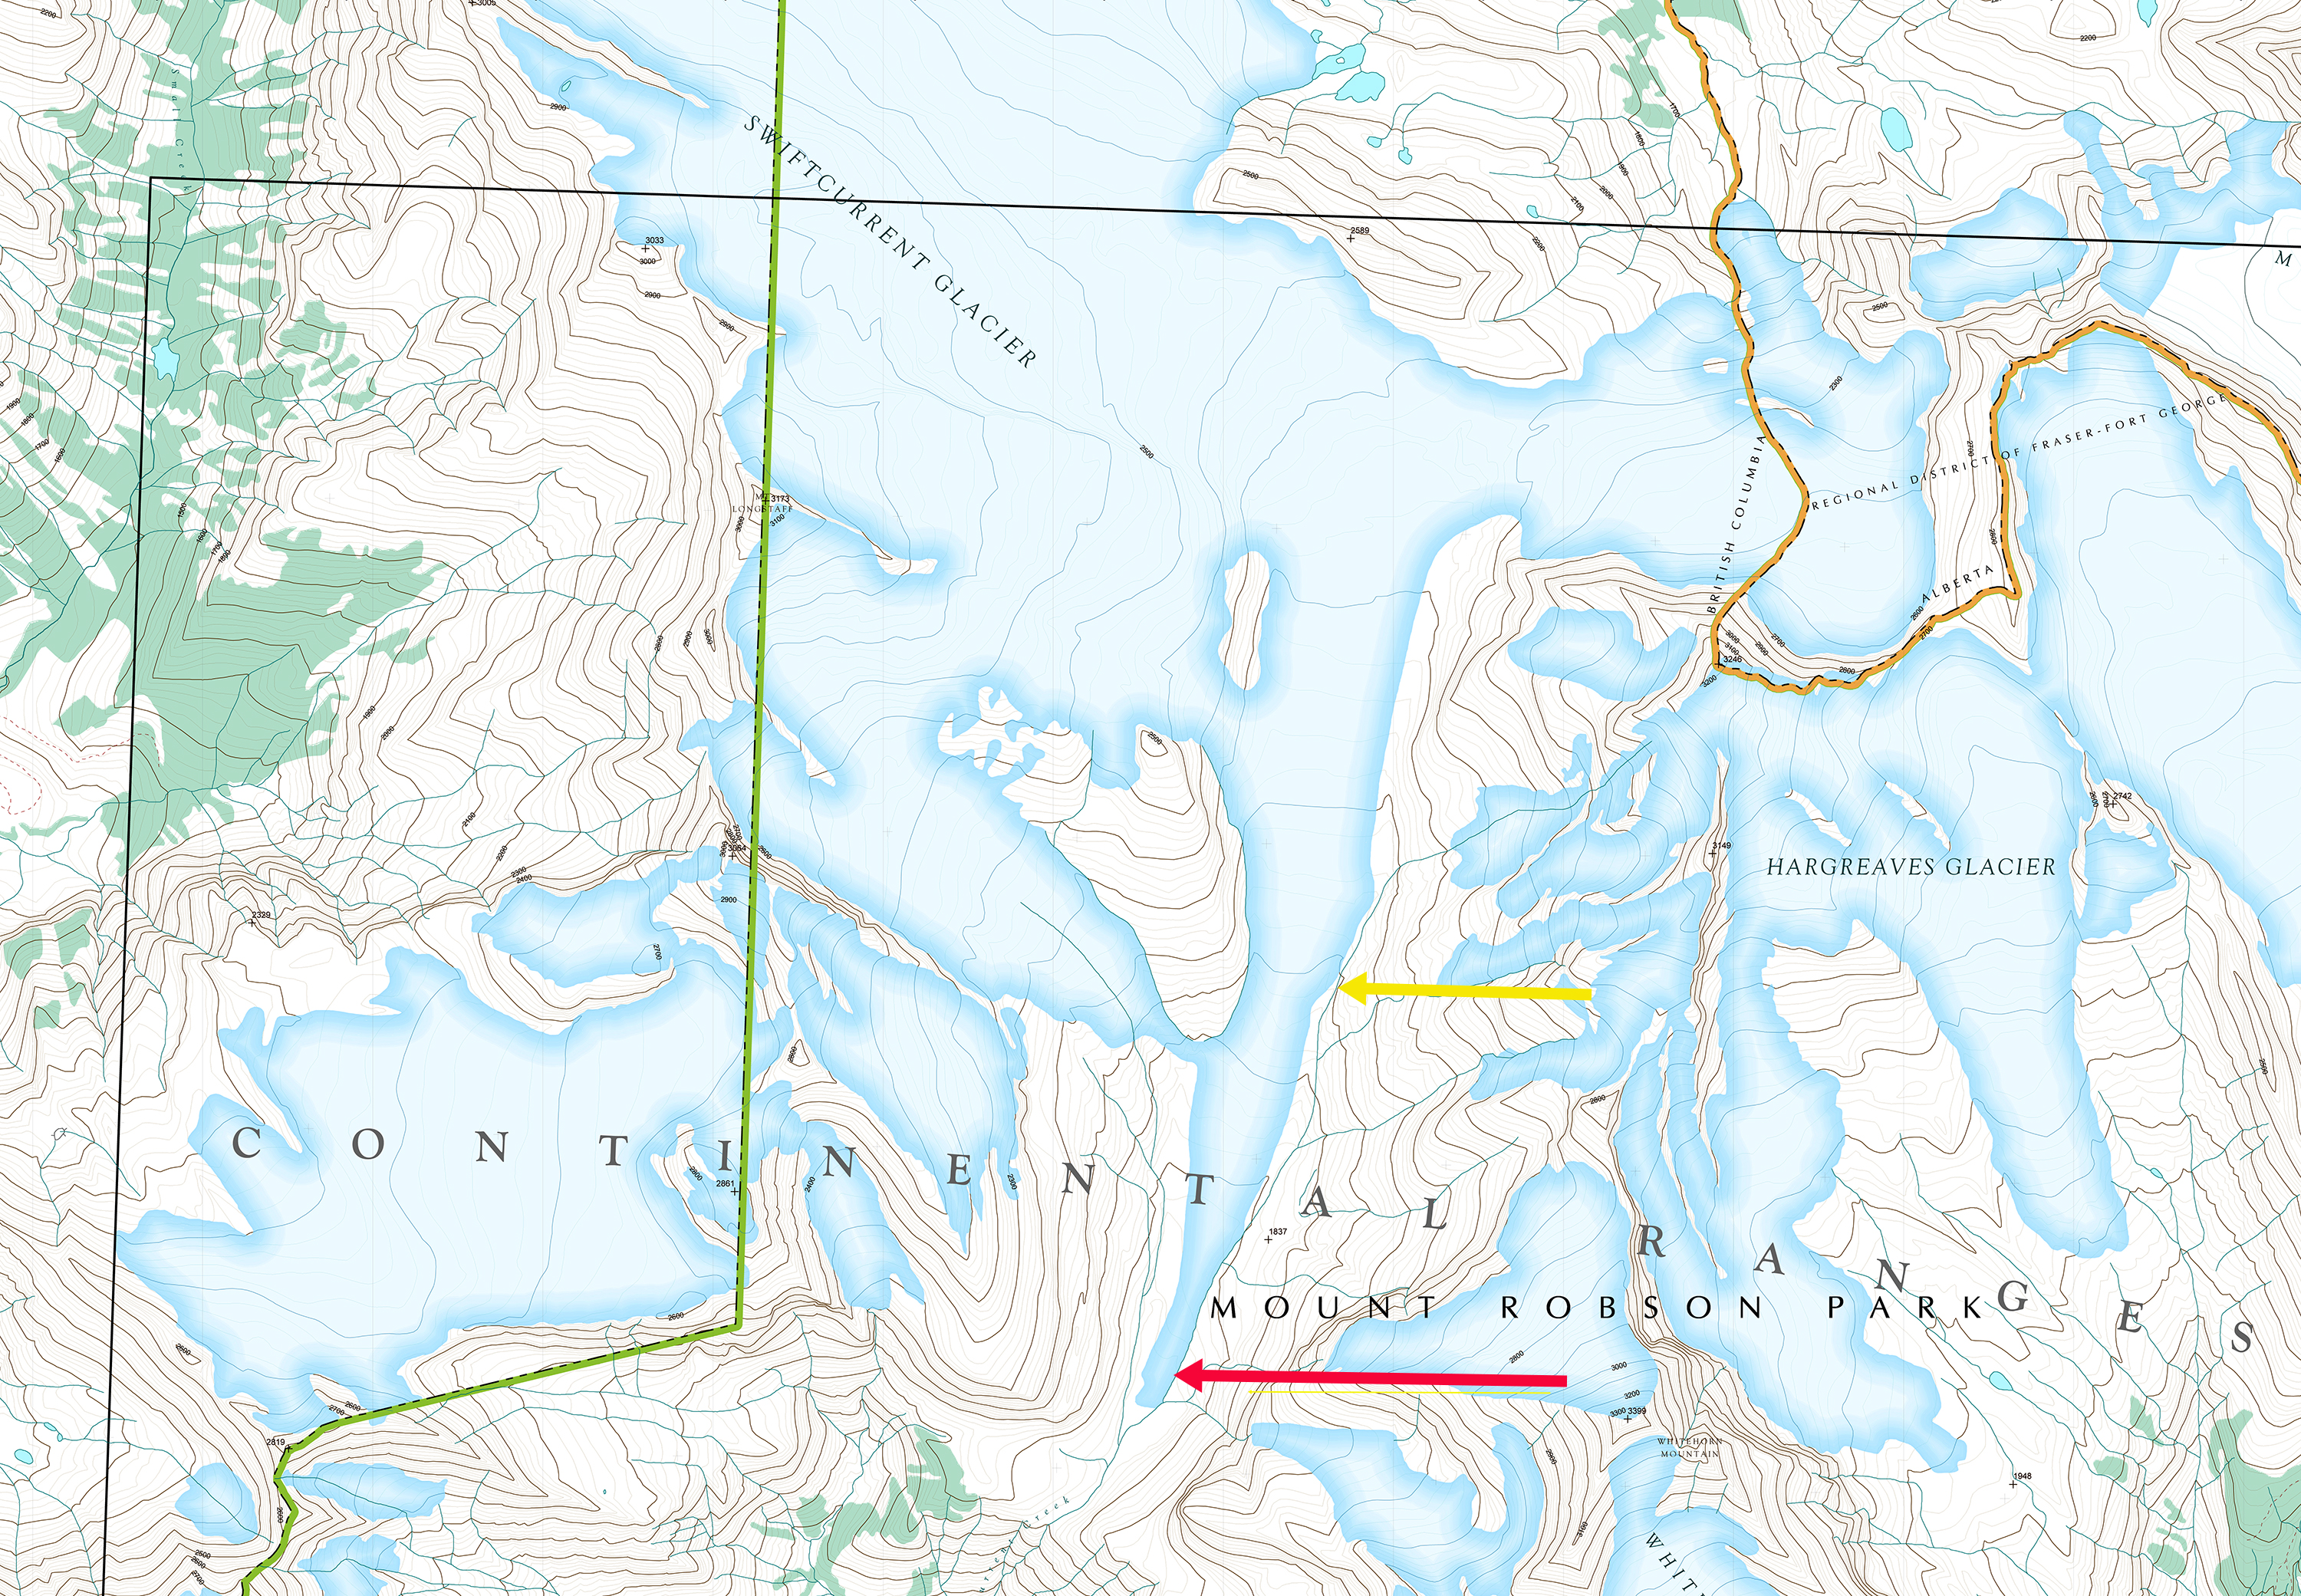
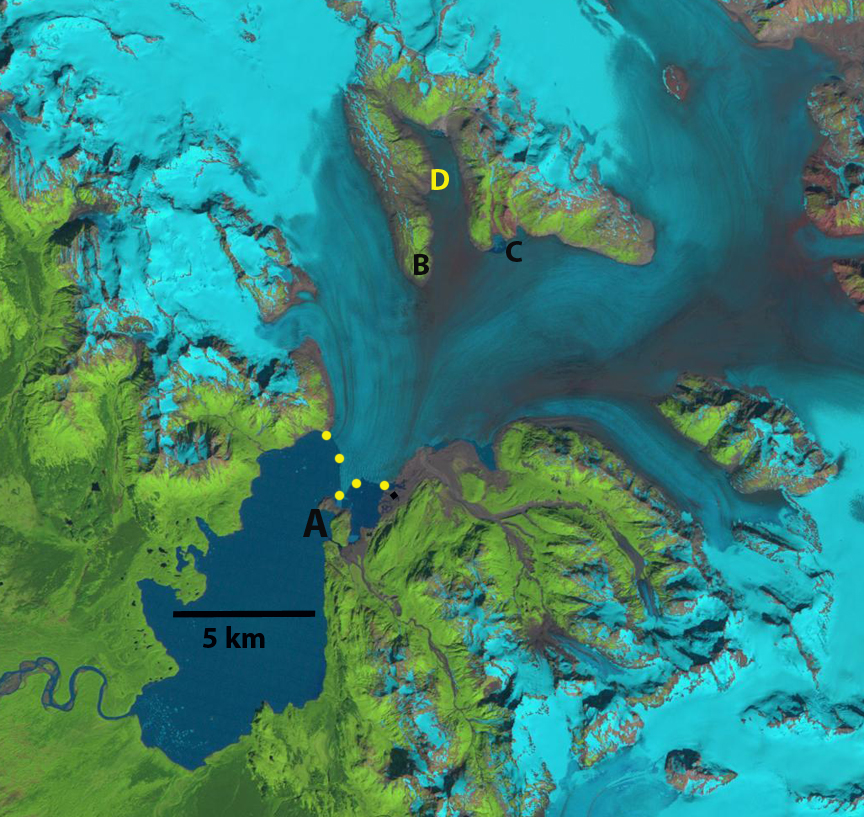
2015 Landsat Image, pink arrows indicate a bedrock rib that thinning ice is making evident. Purple dots indicate the snowline.

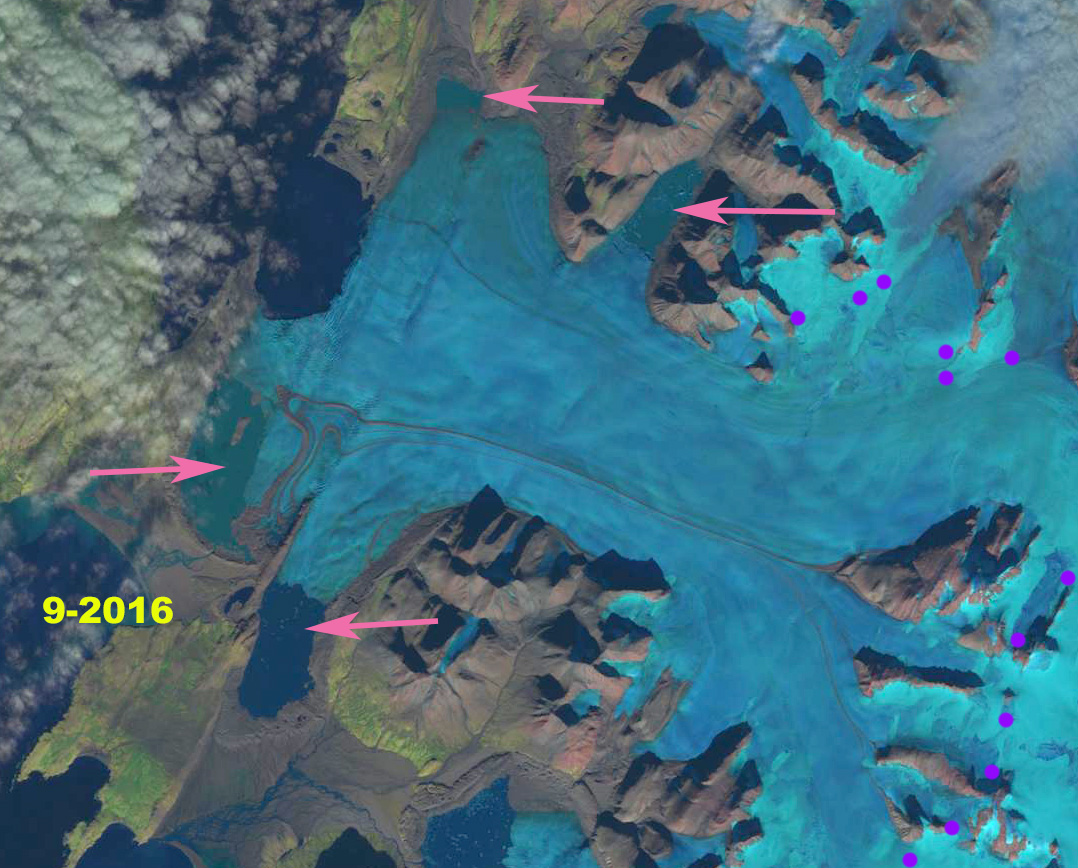
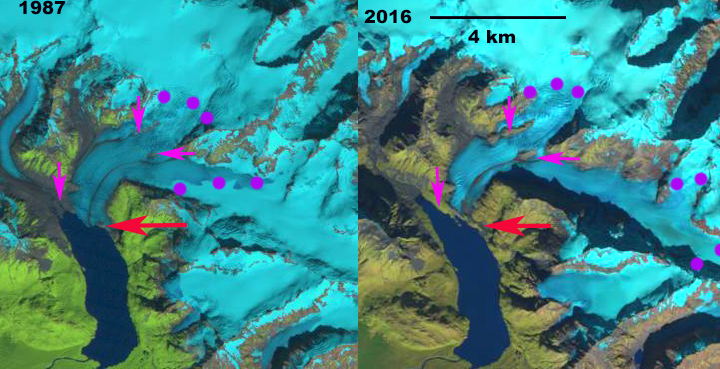
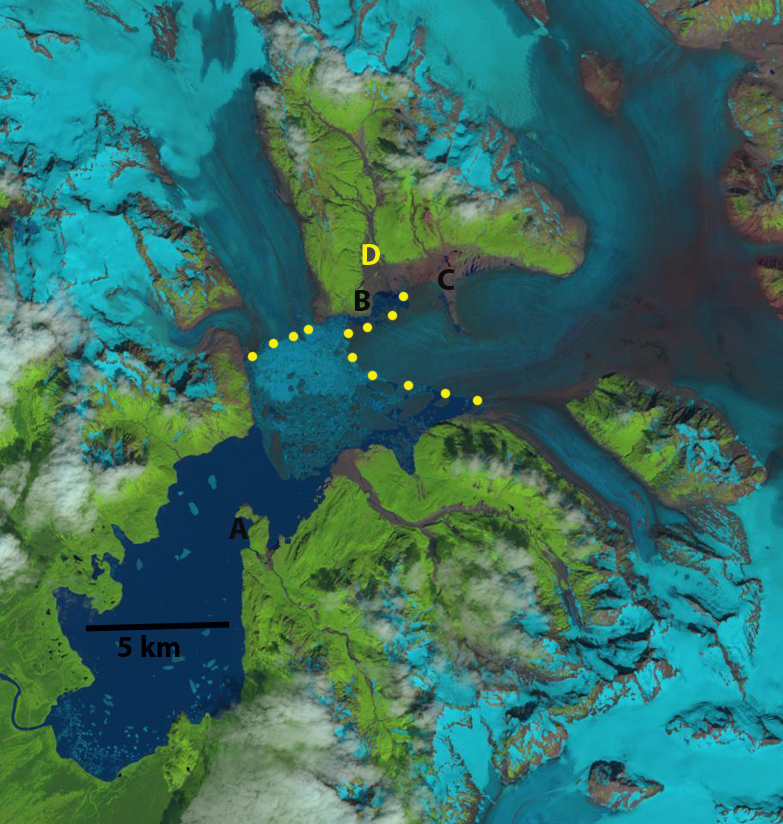
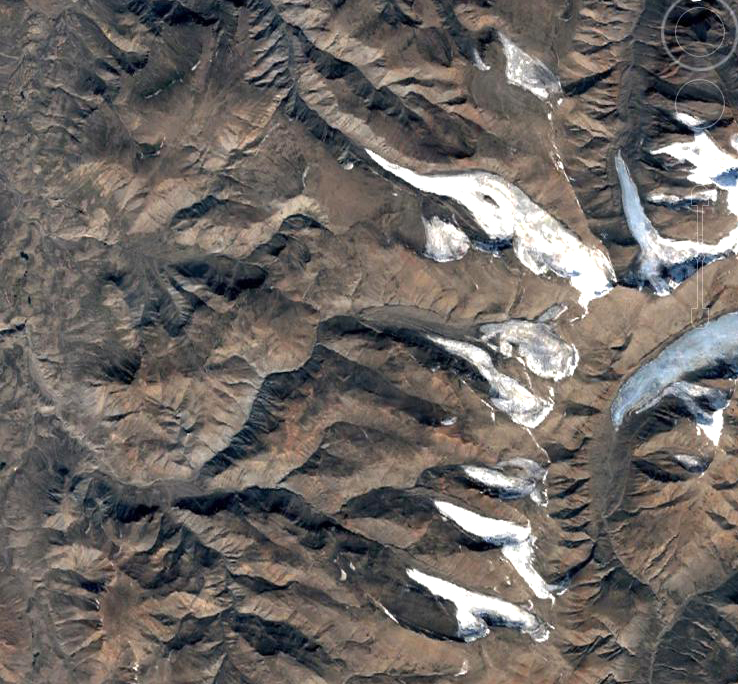
September 2016 Landsat image indicating the snowline is at a high elevation late in the summer.  Pink arrows are proglacial lakes. 

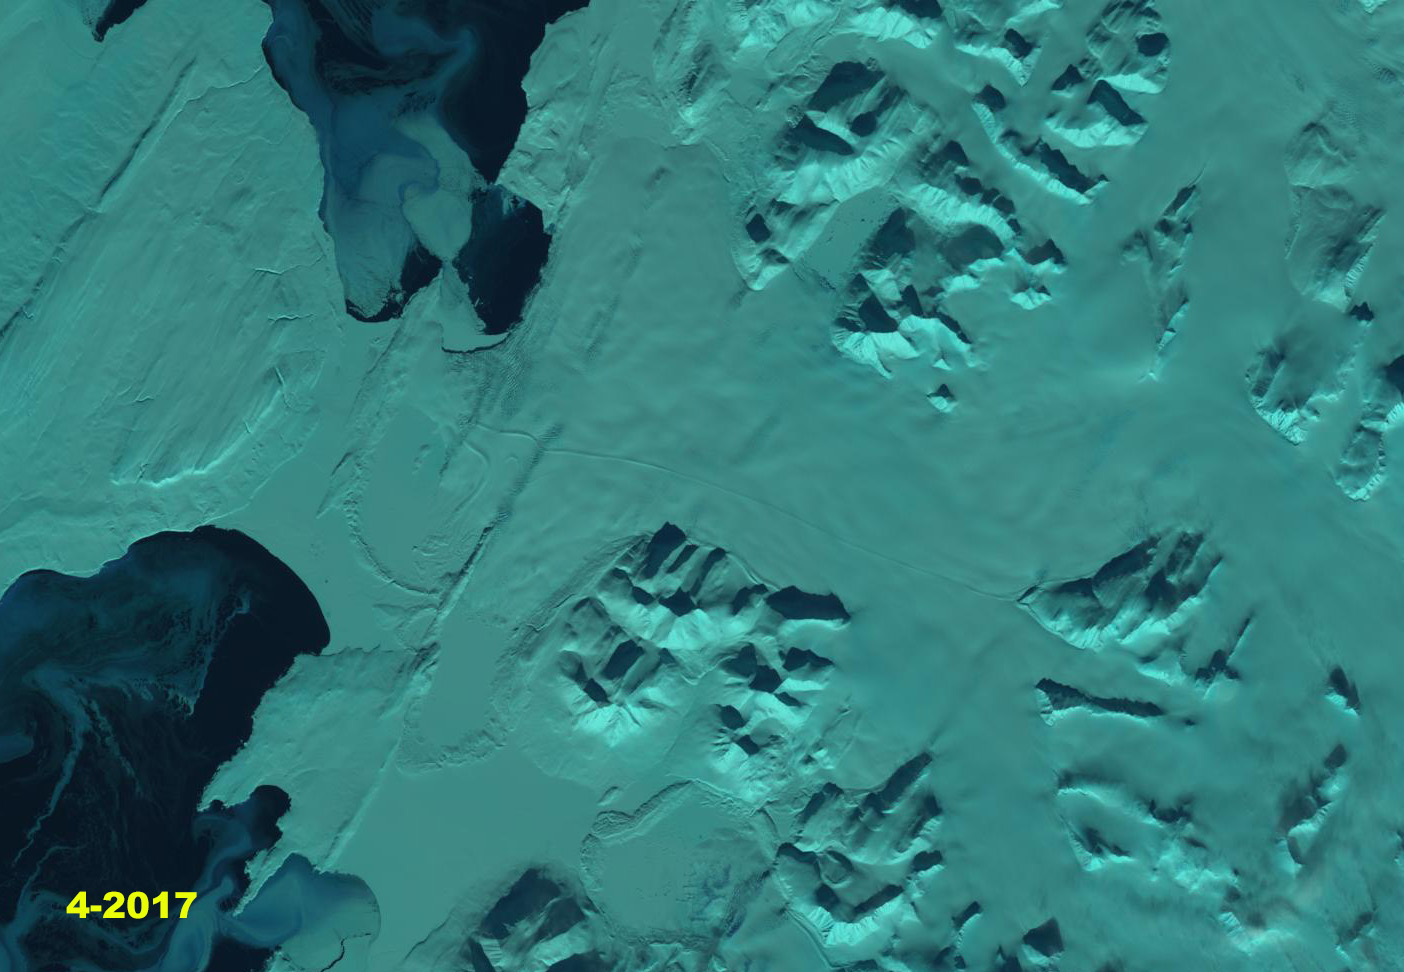
April 2017 Landsat image, note the lack of sea ice in front of the glacier. 

April Sea ice around Novaya Zemlya 2004-2012. 

Besselsbreen Retreat Glacier Wide Thinning , Svalbard

Besselsbreen (B) and Augnebreen (A) comparison in a 1990 and 2016 Landsat image. Red arrows indicate terminus position in 1990, yellow arrow indicates terminus in 2016, purple arrows indicate locations of upglacier thinning from 1990 to 2016 and the yellow line indicates the width of the tongue on the eastern side of Besselsbreen to the medial moraine with Augnebreen

Besselsbreen Glacier flows north to  tidewater from the Barents Icecap on Barentsoya Island in Svalbard.  The glacier has a low slope with the surface elevation reaching 250 m 10 km from the glacier front. The result is limited velocity and crevassing.  The lack of crevasses and flow enables formation of interesting surface stream networks as well. Here we examine Landsat imagery from 1990 to 2016 and Google Earth imagery from 2013 to identify key glacier changes. Dowdeswell and Bamber (1995) indicate the glacier has not surged since its Little Ice Age maximum and that the lowest 4 km of the glacier has a bed that is below sea level.  Gruell et al (2017) mapped the albedo of the glacier using MODIS and found it quite low all the way to the crest in the summer of 2003.  This suggests limited retained snowpack. The recent ocean and atmospheric warming (Isaksen et al , 2016) driving increased summer melt.

In 1990 Besselsbreen extended to within 1.2 km of Kap Bessels on the east side of the glacier and to the embayment widening on the west. The east side of the terminus had a 2.4 km wide tongue that extends beyond the rest of the terminus. There is no lake or tidewater at the terminus of Augnebreen.  The snowline is at 500 m near the top of the glacier. In 2000 the eastern tongue of the glacier is 2.0 km wide, the glacier has retreated a minor amount.  By 2016 the terminus on the west side of the inlet has retreated 1.9 km and 2.6 km on the east side of Besselsbreen.  The eastern tongue of the glacier is now 1.2 km wide.  The snowline in mid-August is at 400 m. Significant thinning has exposed substantial new bedrock areas at the purple arrows which are between 250 m and 350 m in elevation.   This is indicative of higher annual snowlines leading to significant surface melt driven thinning.  The glacier terminus has crevassing only near the embayment where the eastern tongue extends north from the rest of the terminus.  This suggest limited calving, no icebergs are noted in any images used. Warming sea temperatures and reduced sea ice are likely playing a role in enhanced near terminus melt rates. The lack of crevasses and extensive melting has led to substantial stream networks and surface ponds on the lower glacier as seen in Google Earth images below.  The low albedo of the relatively dark surface of the glacier even near the top underscores the failure to retain snow/firn through the summer allowing dust to accumulate on the surface. The medial moraine between Augnebreen and Besselsbreen will be a continuing location of separation.  Augnebreen is retreating less rapidly, 1.2 km from 1990-2016, but now has a significant tidewater embayment at the glacier front that should enhance retreat. 

The retreat here is less than the more calving dominated tidewater glaciers such as Hinlopenbreen, Kronebreen or Svitjodbreen.  In the case of Kronebreen that glacier has also been separating from Kongsvegen. 

Besselsbreen (B) and Augnebreen (A) comparison in a 2000 Landsat image. Red arrows indicate terminus position in 1990, yellow arrow indicates terminus in 2016 and the yellow line indicates the width of the tongue on the eastern side of Besselsbreen to the medial moraine with Augnebreen

Besselsbreen (B) and Augnebreen (A) comparison from TopoSvalbard map

Besselsbreen (B) and Augnebreen (A) comparison from TopoSvalbard image of 2013, yellow arrows indicate 2016 terminus. Note dark color of ice surface.

Besselsbreen in a Google Earth image indicating melt ponds and supraglacial streams.  Yellow dots indicate the ice front. 


Hinlopenbreen, Svalbard 7 km Retreat 1990-2016.

Hinlopenbreen, Svalbard in 1990 and 2016 Landsat imagery.  red arrow is 1990 terminus, yellow arrow is 2016 terminus,and Oslobreen is noted by Point O

Hinlopenbreen is a large tidewater glacier in northern Svalbard.  The glacier has a periodic history of surging, with the last surge occurring in 1970 (Nuth et al 2010). The glacier has the largest negative balance of -0.58 m/year from 1965-2005 (Nuth et al 2010).   The mass loss is ongoing including thinning on the upper glacier, which should be a build up period on a surge glacier.   Here we examine changes from 1990-2016 in Landsat images.

In 1990 Hinlopenbreen extended north terminating adjacent to a small tributary from the east, red arrow.  On the west side the terminus extended past the northern margin of Oslobreen (O) to a small tributary from the west.  The meltwater network is evident, though not as mature as in 2016. By 2016 the terminus has retreated 7 km south of the eastern tributary and several kilometers south of the northern edge of Oslobreen  merging from the west. The terminus of Hinlopenbreen is 5.6 km wide, exclusive of Oslobreen.  The width remains consistent for 10 km upglacier of the calving front. The retreat from 1990-2016 occurring two decades after the last surge is also indicative of a climate driven retreat not surge driven response. A surge driven retreat would feature accumulation zone thickening, such as noted by Murray et al (2012).  The meltwater network in 2016 indicates water flow through saturated firn, green arrows. The bare glacier ice is further down glacier.  Some of this meltwater will refreeze and not escape the glacier.  The snowline marks the region where the firn/snow is not saturated.  This is another glacier where we have to question whether a future surge is possible, as is the case at Fridtjovbreen.  The retreat of Hinlopenbreen Glacier is similar to that of most tidewater glaciers in Svalbard such as,  Paierbreen, Hornbreen and Svitjodbreen   Nuth et al (2013) determined that the glacier area over the entire archipelago has decreased by an average of 80 km2 per year over the past 30 years, a 7% reduction. 

Hinlopenbreen, Svalbard in TopoSvalbard aerial imagery.  red arrow is 1990 terminus and yellow arrow is 2016 terminus.

Hinlopenbreen, Svalbard in TopoSvalbard map, blue arrow indicate flow direction.  

August 20-16 Landsat imagery with the saturated firn in darker blue with meltwater channels evident. 

Azaubashi Glacier Fragmenting, Mount Elbrus, Russia

Azaubashi Glacier (W) and Azau Glacier (A) in 1985 Landsat and 2016 Sentinel Image. Orange arrows indicate particular areas of fragmentation and bedrock expansion.  Pink arrows indicate connection  with Azau Glacier the terminus of which in 1985 is at red arrow and in 2016 is at yellow arrow. 

Azaubashi Glacier is on the southwest side of Mount Elbrus, Caucasus Mountains of Russia, merging with the Greater Azau Glacier. The glacier drains east from Gora Azaubashi (3600 m).  The glacier is west of the ski complex at Prielbrusye, that has lifts from Azau at 2300 m to Krugozor at 3000 m and Mir at 3500 m.  Shahgedanova et al (2014)  report  glaciers on the mountain experienced a 5% loss in area from 1999-2012, with the Azaubashi Glacier losing a much higher percentage.

Azaubashi Glacier (W) and Azau Glacier (A) in 1998 and 2013 Landsat Images. Orange arrows indicate particular areas of fragmentation and bedrock expansion.  Pink arrows indicate connection  with Azau Glacier the terminus of which in 1985 is at red arrow and in 2016 is at yellow arrow. 

Here we examine Landsat images from 1985 to 2016 to quantify the substantial change. In 1985 the glacier extends north from Azaubashi to join with glaciers on the upper slopes of Elbrus in a 4 km continuous sweep.  At Arrow 1 and 2 the glacier is continuous and extends at least 800 m from top to bottom.  At Arrow 3 the glacier connection with Azau Glacier is extensive.  At Arrow 4 the glacier extends to the ridge.  By 1998 At Arrow 1 a bedrock arrow has nearly separated the glacier.  At Arrow 2 the glacier remains at least 700 m from top to bottom. The connection between Azaubashi and Azau Glacier remains extensive.  At Arrow 4 the glacier extends to the ridge.  By 2013, the bedrock exposed at Arrow 1 is 300 m wide.  At Arrow 2 the glacier is nearly severed with a connection of just 300 m.  At Arrow 3 the connection between glaciers is now discontinuous and tenuous.  At Arrow 4 the glacier no longer extends to the ridgeline,  The snowline on the south side of Mount Elbrus is at 3700 m. In 2016 the main change is the continued disconnection between Azaubashi Glacier and Azau Glacier, the connection that in 1985 was 1500 m long is now just 500 m long. The glacier will soon be split into three sections. The glacier did not retain any snowcover in 2016, in 1998 and 2013 less than 10% of the glacier retained snowcover.  The snowline in 2016 was at 3700 m on Aug. 28th. This indicates a glacier that cannot survive current climate as it lacks a consistent significant accumulation zone.  The retreat from 1985 to 2016 of the Azau Glacier noted at the red and yellow arrows has been 650 m.   The Azau Glacier still has an extensive accumulation zone.  TheAzaubashi Glacier is similar to the Dzhikiugankez Glacier in losing mass across nearly its entire surface.

Azaubashi Glacier in 2009 Google Earth image. Orange arrows indicate particular areas of fragmentation and bedrock expansion.  Pink arrows indicate connection  with Azau Glacier, blue arrows indicate two small lakes developing in previously glacier covered areas. 

Borden Peninsula Ice Caps, Baffin Island Snowcover Where Art Thou

Borden Peninsula Ice Cap in 1997 and 2016 Landsat images.  Purple dots indicate the transient snowline.  Orange arrows indicate specific location of glacier thinning, retreat or area loss. 

The Borden Peninsula is in the northeastern most section of Baffin Island.  Here we examine an ice cap that is on the edge of Lancaster Sound in Sirmilik National Park.  We use Landsat imagery from 1997 through 2016 to identify change.  This compliments the examination of other Baffin Island Ice Caps: Dexterity, Clephane Bay, Grinnell, Barnes and Penny.  Gardner et al (2012) and Sharp et al (2011) both note that the first decade of the 21st century had the warmest temperatures of the last 50 years, the period of record and they identified that the mass loss had doubled in the last decade versus the previous four for Baffin Island.  

In 1997 the transient snowline late in the ablation season is averages 1020 m.  Two glaciers the Ikkarlak Glacier  Point 2 and the next glacier to the southeast, downstream of Point 6 both reached tidewater. lat in the ablation season of 2001 the transient snowline again average 1020 m. In 2016 there is no retained snowpack.  At Point 1 the arrow indicates an outlet glacier than has thinned where it connects to the main ice cap from 600 m to 250 m. At Point 2 the Ikkarlak Glacier that had reached tidewater in 1997 and 2001 no longer reaches the coast. At Point 3 a tributary glacier has been reduced in length and width.  At Point 4 the width of the outlet glacier has been reduced by 50%. At Point 5 in 1997 the glacier reached within 200 m of the coast and in 2016 the glacier terminates 500 m from the coast.  At Point 6 areas of new bedrock amidst the icecap have developed and expanded.  At Point 7 two outlet glaciers merged ain 1997 and in 2016 are now separated with an expanding bedrock region between the glacier tongues. The Uqanguaq Glacier at Point 8 has retreated from a terminal moraine, indicating a retreat of 600 m from this moraine with 300 m of retreat since 1997.  The lack of retained snowcover is similar to that seen at other Baffin Island Ice Caps recently Dexterity, Clephane Bay, and Grinnell.  Way (2015) noted that summer temperatures have warmed more than 1 C after 1990 in the region and that has led to disequilibrium with climate for Grinnell and Terra Nivea Ice Cap. The Borden Peninsula Ice Cap is retreating less than the ice caps noted in the southern part of Baffin Island. 

Borden Peninsula Ice Cap in 2001 Landsat image.  Purple dots indicate the transient snowline.  


Borden Peninsula Ice Cap in  July 31, 2015 Landsat image.  Purple dots indicate the transient snowline at 1060 m.


Schlatenkees Accelerating Retreat, Austria 1988-2016

Schlatenkees comparison in 1999 and 2016 Landsat images.  Red arrow is the 1988 terminus position, yellow arrow is the 2016 terminus location, purple dots indicate the snowline. 

Schlatenkess (Glacier) is in the Venediger Alps draining into the Innergschlöss a tributary of the Isel River. The glacier is part of the network of glaciers examined by the Austrian Alpine Club annual glacier terminus survey supervised by Andrea Fisher.  Schlaten Glacier was one of the fastest of the 97 glaciers examined in 2015 and 2016 retreating 115 m in those two years. Fishcer, (2017) report that 84 of 88 glaciers observed were in retreat during 2015, and that 87 of 90 glaciers observed in 2016 were in retreat. . Bender et al (2012) provide a photo comparison of the glacier from 1890 and 2010 illustrating the loss of glacier ice.  Here we examine Landsat and Google Earth images from 1988 to 2016. In each image the red arrow is the 1988 terminus position, yellow arrow is the 2016 terminus location, purple dots indicate the snowline and J is the Innergschlöss River junction. 

Schlaten Glacier drains east from Grossvenediger and was approximately 5.4 km long terminating at 2220 m in 1988.  The snowline in 1988 is at 3050 m.  In the 1999 Google Earth image the lower 400 m of the glacier lacks significant crevassing indicating stagnation.  In 2000 the snowline is at 3000 m. In 2013 the snowline is at 3000 m, at 3050 m in 2014, at 3150 m in 2015 and 2016.  The terminus has retreated 600-650 m from 1988 to 2016 in the Landsat images, this is 12% of the glacier length gone.  The retreat rate for this periods is ~20 m/year rising to over ~55 m/year in the last two years, which also featured highs snowlines. The glacier now terminates at 2350 m , the lower 600 m has a low slope, few crevasses and one area of concentric crevasses, indicating a basin.  The basin indicates thin ice, suggesting this section of the glacier will soon be lost.  The regional retreat has been particularly fast since 1998 as Fischer et al (2015) noted with a 20% area loss in the Venediger area.  The retreat is similar to Gepatsch Glacier and Obersulzbach Kees

Schlatenkees comparison in 2000 and 2015 Landsat images.  Red arrow is the 1988 terminus position, yellow arrow is the 2016 terminus location, purple dots indicate the snowline.

Google Earth Image from 1999, above and 2015 below.  Point A and B respectively indicate the 1999 and 2015 terminus locations. 

Terminus of Schalten Glacier in 2015 note concentric crevasses indicating a basin. 

Schlatenkees comparison in 2013 and 2014 Landsat images.  Red arrow is the 1988 terminus position, yellow arrow is the 2016 terminus location, purple dots indicate the snowline.

Benito Glacier, Chile Retreats 2km 1987-2015

Benito Glacier comparison in 1987 and 2015 indicating the terminus position in 1987 red arrows, yellow arrows the 2015 terminus positions, purple arrows where glacier thinning is expanding bedrock areas, the snowline is indicated by purple dots. 

Glacier Benito is a temperate outlet glacier on the west side of the North Patagonian Icefield the glacier is south of  Fraenkel Glacier and north of Acodado GlacierLoriaux and Casassa (2013) examined the expansion of lakes of the Northern Patagonia Ice Cap. From 1945 to 2011 lake area expanded 65%, 66 square kilometers.  Willis et al (2012) noted a 2.0 m ice thickness loss per year from 2001-2011 in the ablation zone. Mouginot and Rignot (2015)  indicate that the velocity of Benito Glacier is between 200-500 m per year along the center line below the snowline.  Glasser et al (2016) note that this glacier has limited debris cover. In the last two years an expedition organized by Martin Sessions has been examining Benito Glacier and has been reporting from the field this month. 

Benito Glacier in 1987 terminated on an outwash plain.  The glacier has five key distributary termini two of which have open proglacial lakes.  By 2015 there are six tributary termini, five ending in lakes, with one having retreated out of a lake basin. The two tributaries to the north indicated with arrows each retreat approximately 1 km from 1987 to 2015 and in both cases are no longer calving termini.  The main glacier terminus has retreated into a proglacial lake, with a retreat of 2 km from 1987 to 2015. The lowest 1.5 km  has a low slope and peripheral lakes suggesting the terminus lake will expand substantially as Benito Glacier retreat continues. The transient snowline in  the two images 2015 and 2016 is at  900 m. Glasser et al (2016) note that this glacier average transient snowline in 2013-2016 is at 1000 m.  Winchester  et al. (2013) identified thinning of 150 m in the lower ablation zone from 1973-2011, with the most rapid thinning from 2007-2011.

Benito Glacier comparison in 1987 and 2015 indicating the terminus position in 1987 red arrow, yellow arrow the 2015 terminus positions, and the snowline is indicated by purple dots. 

Google Earth image in 2012 of Benito Glacier indicating proglacial lake areas at the green arrows.  


Fasset Glacier, Alaska Retreats from Tanis Lake

Fasset Glacier in 1987 and 2016 Landsat images.  Red arrow indicates glacier front in 1987, pink arrows indicates areas where glacier retreat has exposed rock/bare ground and purple dots indicate snowline.

Fasset Glacier drains west from The Brabazon Range near Yakutat and had terminated in Tanis Lake for the entire 20th century.  (Truessel et al 2013) and Truessel et al (2015) note the rapid retreat and thinning of nearby Yakutat Glacier. Here we examine Landsat imagery that illustrates the retreat from 1987 to 2016. 

The glacier extended most the way to the southern end of the Tanis Lake in the 1951 Yakutat map.  In 1987 the glacier terminated on the northeast shore of Tanis Lake. The calving front in the lake was 800 m wide.  The snowline was at 600 m.  In mid-June of 2014 the snowline was already at 600 m, by the end of the melt season it was at 900 m. In 2016 the terminus of the glacier no longer reaches Tanis Lake. The eastern side of the terminus is stagnant and ends 200 m from the shore of the lake.  The western edge terminates in a new lake that is forming.  The average retreat has been 250 m for the glacier from 1987-2016. The larger changes are upglacier of the terminus where large areas of bedrock have been exposed due to retreat, and several segments of the glacier that used to be joined have separated. The snowline is at 850 m in 2016. There are three large areas of bedrock denoted in the 2014 Google Earth image below.  The two at 500 m well above the terminus appeared as medial moraines in 1987 and are now bedrock ridges 600 m and 1100 m long. There is a group of ogives extending below these two locations indicating the annual flow rate is 100 m/year in this reach of the glacier.  The new lake is also evident in the Google Earth image. 

Walker Glacier, Yakutat Glacier and East Novatak Glacier are nearby glaciers that have experienced greater recent retreat than Fasset Glacier.  Fasset Glacier is poised to continue a moderate rate of retreat. 

USGS Yakutat map from 1951

2014 Google Earth image, pink arrows indicate three areas of thinning. 

2014 Google Earth image.

2014 June Landsat image indicating snowline. 

Yakutat Glacier Terminus Collapse, 10 km retreat 1987-2016

Landsat images from 1987 and 2016 with terminus indicated by yellow dots. Point A indicates the 1987 terminus location and Point E the 2016 terminus location. 

The Yakutat Glacier during the 1894-1895 Alaskan Boundary Survey ended near a terminal moraine on a flat coastal outwash plain. By 1906 the glacier had retreated from the moraine and a new lake was forming. Harlequin Lake. Surveys of the terminus of the glacier indicated a retreat of 1 kilometer in that decade. From 1906-1948 the glacier retreated an additional 5 km. From 1948-1958 the glacier retreated 3.6 km. The retreat is evident in comparing the Yakutat B-3 quadrangle, from 1958 photography, and Landsat imagery from 1987, 2010, 2013 and 2016. Points A-E are the same in each image and the yellow dots are the terminus. In 1987 the terminus was just retreating from a peninsula marked A, the valley at D was filled with ice, there was no break in the surface at C and B was well inland of the terminus. By 2010 the glacier had retreated from A, the valley at D was deglaciated, a small strip of bedrock-sediment was exposed at C from what had been beneath the glacier, and B was still well inland of the terminus. By 2013 the northern arm of the glacier had retreated 6.4 km from the peninsula at A toward the peninsula at B. The central arm of the glacier toward C had retreated 7.5 km and the retreat on the southern edge of the glacier was 6.5 km. The glacier had retreated on average more than 6.6 km in 27 years, a rate of 240 m/year.  From 2013 to 2016 the glacier had retreated from Point B to Point C on the northern side and to Point E on the southern side this is a distance of 10.2 km in thirty years 340 m/year. 

Recently the glacier has been the focus of a study by the University of Alaska, Faribanks they have set up a time lapse camera to record frontal changes. The goal is to understand the controls on calving into Harlequin Lake of this glacier. More amazing than the retreat has been the observed thinning of the glacier. The glacier has thinned by more 200 m on average according to the preliminary thickness change maps from the UAF project (Truessel et al 2013) and updated by Truessel et al (2015). The Yakutat Glacier does not have a high accumulation zone and the recent increase in the snowline elevation and thinning of the glacier have led to a substantial shrinking of the accumulation zone and thinning of the glacier in the accumulation (Truessel et al 2013). This glacier does not have a persistent significant accumulation zone and cannot survive (Pelto, 2010), Truessel et al (2015). modelling suggests the glacier will disappear between 2070 and 2110 depending on the warming scenario.  For a calving glacier to be in equilibrium it needs to have at least 60 % of its area snowcovered at the end of the summer. The glacier is in the midst of a large ongoing retreat. The retreat rate and calving mechanism is similar to that of Grand Plateau Glacier, Bear Lake Glacier and Gilkey Glacier. However, unlike these Yakutat Glacier lacks an accumulation zone, a better analog is East Novatak Glacier, which also has a lower elevation accumulation zone.


Yakutat terminus map


2010 Landsat image with terminus indicated by yellow dots.


2013 Landsat image with terminus indicated by yellow dots.


Nuusuaq Peninsula West Greenland Glacier Disintegration

Comparison of alpine glaciers on Nuussuaq Peninsula in 1990 and 2016 Landsat images.  Each arrow is at a specific location in both images exhibiting glacier separation/disintegration. 

The Nuussuaq Peninsula is just north of Disko Island in West Greenland and is home to many alpine glaciers and small ice caps.  Here we examine the furthest west group of alpine glaciers on the peninsula.  This group is 125 km west of the ice sheet and is not influenced directly by the ice sheet, but instead is most sensitive to the conditions over the Davis Strait and Baffin Bay just 25 km away.  The glaciers are near Snokpulen Peak, 1928 m.  Smaller ice caps around the Greenland Ice Sheet have been losing mass. Citterio et al (2011) documented the existence of 1172 glacier in 2001 on Disko Island,  Nuussuaq Peninsula and Svartenhuk Peninsula. West Greenland.  Bolch et al (2013) using Landsat imagery and  ICESat altimetry data noted that peripheral ice caps and glacier provided a significant fraction,~14 or 20% of the reported overall mass loss of Greenland to sea level.  This is equivalent to 10% of the estimated contribution from the world’s alpine glaciers and ice caps to sea level rise.  Noël et al, (2017) observed that  in ~1997 a tipping point for the peripheral ice caps/alpine glaciers of Greenland occurred in terms of  mass balance. The onset of a rapid deterioration in the capacity of the glaciers firn to refreeze meltwater led to mass losses and consequent glacier runoff increased 65% faster than meltwater production. Mittivakkat Glacier is an example of this trend. 

Here we compare 1990-2016 Landsat images indicating the changes in the alpine glaciers near Snokpulen Peak.  At Point A,B,D and F there is a glacier connection between tributaries or adjacent glaciers. At Point C and E there is an area of limited bare ground amidst the glacier.  Also notice in 1990 there is retained snowpack on the glaciers.  In the 2002 image below there is also retained snowpack.  In 2016 there is not retained snowpack on the glaciers, indicating the lack of an accumulation zone.  Without an accumulation zone there is not firn for meltwater to percolate into and refreeze. Meltwater is then not recaptured and is lost as noted by Noël et al, (2017), to be a widespread occurrence. The adjacent glaciers at Point A, B, D and F are now separated.  The extent of bare ground near point C and E has expanded significantly.  The area loss here underscores the volume loss of the peripheral ice caps that Bolch et al (2013) observed. 

2002 Landsat image indicating some retained snowpack on the glaciers.

Topographic Map of the region on Nuussuaq Peninsula.

Google Earth image of region, indicating the separation/disintegration that is occurring. 

Swiftcurrent Glacier, British Columbia, Swiftly Retreating 1986-2015

Swifttcurrent Glacier Comparison from 1986 and 2015 Landsat images.  Red arrow is the 1986 terminus, yellow arrow 2015 terminus, purple arrow significant tributaries in 1986, and purple dots the snowline.

Swiftcurrent Glacier drains the southeast side of Mount Longstaff 15 km NW of Mount Robson.  The glacier is near the headwaters of the Fraser River, and its retreat since 1986 has led to the formation of a new alpine lake. Here we examine glacier change from 1986 to 2015 in Landsat images.  Bolch et al (2010) found that from 1985-2005  BC glaciers lost 11% of their area.  Jiskoot et al (2009) examined the behavior of Clemenceau Icefield and found that from the mid 1980’s to 2001 the nearby Clemenceau Icefield glaciers had lost 42 square kilometers, or 14% of their area.  Tennant and Menounos (2012) examined changes of the Rocky Mountain glaciers in Alberta and BC finding that from 1919 to 2006 that glacier cover decreased by 590 square kilometers, 17 of 523 glaciers disappeared and 124 glaciers fragmented into multiple ice masses. 

In 1986 Swiftcurrent Glacier terminated at 1715 m, red arrow and had a snowline of 2300 m.  There is not an alpine lake at the terminus or in the map of the region.  There are two prominent tributaries evident, purple arrows. In a Google Earth image from 2005, a new alpine lake had formed and the snowline was at 2500 m.  In the 2013 Landsat image only the eastern side of the glacier is seen, the snowline is above 2600 m. In 2015 the new alpine lake is 1100 m long, the glacier terminates at the yellow area at 2000 m.  This represents a 2.8 km retreat from 1986-2015.  The snowline in 2015 is at 2650-2700 m.  The two significant tributaries have separated from the glacier at the purple arrow. The high end of summer snowlines in recent decades indicate an expanded melt zone and mass loss.  This is and will continue to drive terminus retreat.  The retreat is similar to two other headwaters glaciers in the region; Kiwa Glacier and Robson Glacier.


Map of the Swiftcurrent Glacier  region  from GeoBC, this is a 1983 base map.

2005 Google Earth image of Swiftcurrent glacier, purple dots indicate snowline.

2013 Landsat image of Swiftcurrent Glacier.

Beautiful British Columbia Land of Many Mountains & Dwindling Glaciers

[ngg_images source=”galleries” container_ids=”4″ display_type=”photocrati-nextgen_basic_imagebrowser” ajax_pagination=”1″ template=”/nas/wp/www/sites/blogsorg/wp-content/plugins/nextgen-gallery/products/photocrati_nextgen/modules/ngglegacy/view/imagebrowser-caption.php” order_by=”sortorder” order_direction=”ASC” returns=”included” maximum_entity_count=”500″]

British Columbia is host to many mountain ranges; Purcell, Monashee, Bugaboo, Selkirk, Cariboo, Coat Range, Kootenay, Kwadacha are just some of the diverse mountain ranges  that host glaciers and span climate zone. A shared characteristic today regardless of climate zone or mountain range is dwindling glacier size and volume.  Bolch et al (2010) found that from 1985-2005 Alberta glaciers lost 25% of their area and BC glaciers 11% of their area.  Tennant and Menounos (2012) examined changes of the Rocky Mountain glaciers including Alberta finding that between 1919 and 2006 glacier cover decreased by 590 square kilometers, 17 of 523 glaciers disappeared and 124 glaciers fragmented into multiple ice masses.  Jiskoot et al (2009) examined the behavior of glaciers of the Clemenceau and Chaba Icefield and found that from the mid 1980’s to 2001 the Clemenceau Icefield glaciers had lost 42 square kilometers, or 14% of their area. Pelto (2016) reported on specific retreat of many of these BC glaciers. Below are links to 31 detailed post examining the changes in recent decades of British Columbia glaciers in response to climate change.

In the summer glaciers in many ranges are crucial water resources for aquatic life and hydropower.   In BC 92% of electricity is generated by hydropower mainly from large projects.  BC Hydro has 31 such large projects, including several heavily fed by glaciers: Bridge River, Mica, Cheakamus, Ruskin and Stave Falls. There are also run of river hydroprojects with a new one constructed by AltaGas, the 195 MW Forrest Kerr Project on Tahltan First Nation land on the Iskut River. The Iskut River like the Stikine River is heavily glacier fed. As spring begins glaciologists will be heading out to measure glacier mass balance a critical input to understanding current and future glacier runoff, such as the Columbia Basin Trust sponsored project overseen by Brian Menounos at UNBC, and field operation direct by Ben Pelto at UNBC.


Forrest Kerr Hydro is a run of river project relying on a weir instead of a dam to divert water into the intake.
There are also numerous salmon fed streams with critical glacier input, such as the Skeena River and Rivers Inlet. Stahl and Moore (2006) identified that discharge from glacierized and nonglacierized basins in British Columbia indicates the negative August streamflow trends illustrate that the initial phase of increase runoff causing by climate warming has passed and runoff is now declining. This is similar to further south in the North Cascades of Washington (Pelto, 2015).

Shatter and Shudder Glacier
Snowcap Creek Glacier
Stave Glacier
Helm Glacier
Warren Glacier
Galaxy Glacier
Icemantle Glacier
Big Bend Glacier
Kokanee Glacier
Toby Glacier
Conrad Glacier
Vowell Glacier
Bridge Glacier
Klippi Glacier
Yoho Glacier
Des Poilus Galcier
Haworth Glaciers

Apex Glacier
Kiwa Glacier
Dismal Glacier
Cummins Glacier
Coleman Glacier
Swiftcurrent Glacier
Bromley Glacier
Sittakanay Glacier
Nass Peak Glacier
Porcupine Glacier
Great Glacier
Hoboe Glacie
Tulsequah Glacier
Melbern Glacier