Landsat image of the transient snow line on Mont Blanc Glaciers, France on 8/19/2017. The average snow line (Purple dots) is at 3100 m. Glaciers on Mer de Glace (M), Argentiere (A), Tour Glacier (L), Trient Glacier (T) and Saleina Glacier (S).
This has been a warmer summer in the Alps with reports emerging of various summer ski areas that take advantage of glaciers closing early or adding snow guns to stay open, Molltal Glacier, Les2Alpes,, Stelvio Glacier Here we compare in Landsat images the transient snow line on five Mont Blanc glaciers from 1985, 1988, 2003, 2014, 2015 and 2017. The transient snow line is indicated with purple dots in each image. A comparison of the transient snow line on Mont Blanc glaciers on 8/19/2017 to other years indicates it is already higher than all other years examined, but a month remains in the melt season.
Rabatel et al (2013) examined the equilibrium line altitude (ELA) of glaciers in the region from 1984-2010. The ELA is the snowline at the end of the summer melt season. The transient snow line is simply the snow line altitude on a specific day during the melt season. Rabatel et al (2013) found the average snow line of 3000 m on Trient Glacier, 2900 m on Tour Glacier, 2800 m on Argentiere Glacier and 2975 m on Saleina Glacier. They also observed the maximum snowline occurred in the western Alps in 2003 with an average of ~3250 m, this average is higher than for just the Mont Blanc glaciers.
On August 11, 1985 the snow line averages 2800 m on the five glaciers. In 1988 on Sept. 12 the snowline averages 2900 m. On August 5, 2003 the average snow line is at 3025 m. On Sept. 12 2014 the average snow line is at 2850 m. On Aug. 31, 2015 the average snow line is at 3050 m. On Aug. 19th 2017 the average snow line is at 3100 m. This is the highest observed August snow line on Mont Blanc. With several weeks to go the snow line is competition with 2003 for the highest snow lines on Mont Blanc glaciers in the last 50 years by the end of the melt season.
Six and Vincent (2014) noted for Argentiere Glacier that for each 1 C rise in temperature the ELA rises 50 m. The higher snow line in 2017 indicates a year of significant negative mass balance, which will further enhance retreat of the the Mont Blanc glaciers, such as Mer de Glace and Tour Glacier.

Landsat image of the transient snow line on Mont Blanc Glaciers, France on 8/5/2003. The average snow line (Purple dots) is at 3000 m. Glaciers on Mer de Glace (M), Argentiere (A), Tour Glacier (L), Trient Glacier (T) and Saleina Glacier (S).

Landsat image of the transient snow line on Mont Blanc Glaciers, France on 8/11/1985. The average snow line (Purple dots) is at 2800 m. Glaciers on Mer de Glace (M), Argentiere (A), Tour Glacier (L), Trient Glacier (T) and Saleina Glacier (S).

Landsat image of the transient snow line on Mont Blanc Glaciers, France on 9/12/1988. The average snow line (Purple dots) is at 2900 m. Glaciers on Mer de Glace (M), Argentiere (A), Tour Glacier (L), Trient Glacier (T) and Saleina Glacier (S).
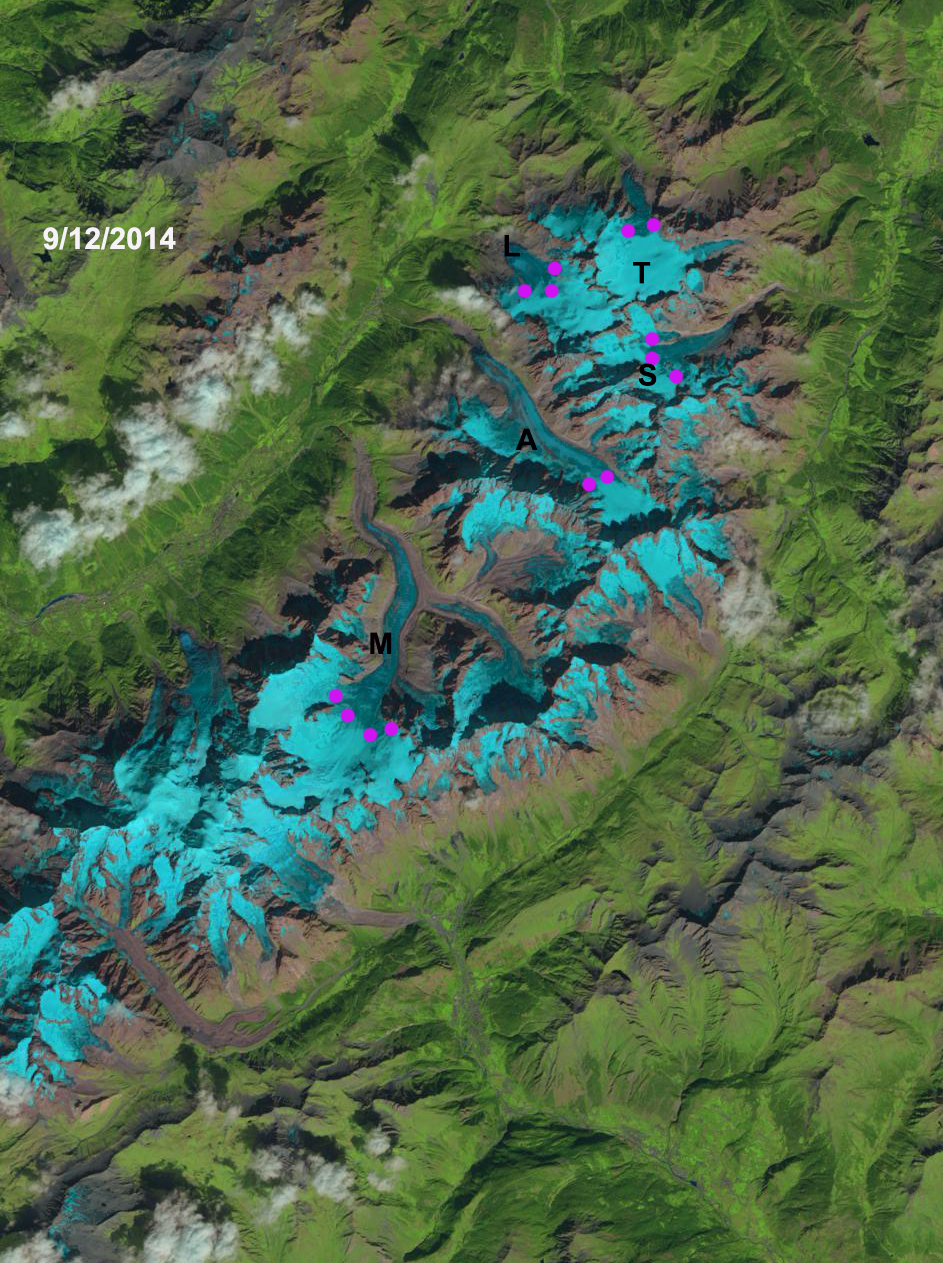
Landsat image of the transient snow line on Mont Blanc Glaciers, France on 9/12/2014. The average snow line (Purple dots) is at 2850 m. Glaciers on Mer de Glace (M), Argentiere (A), Tour Glacier (L), Trient Glacier (T) and Saleina Glacier (S).
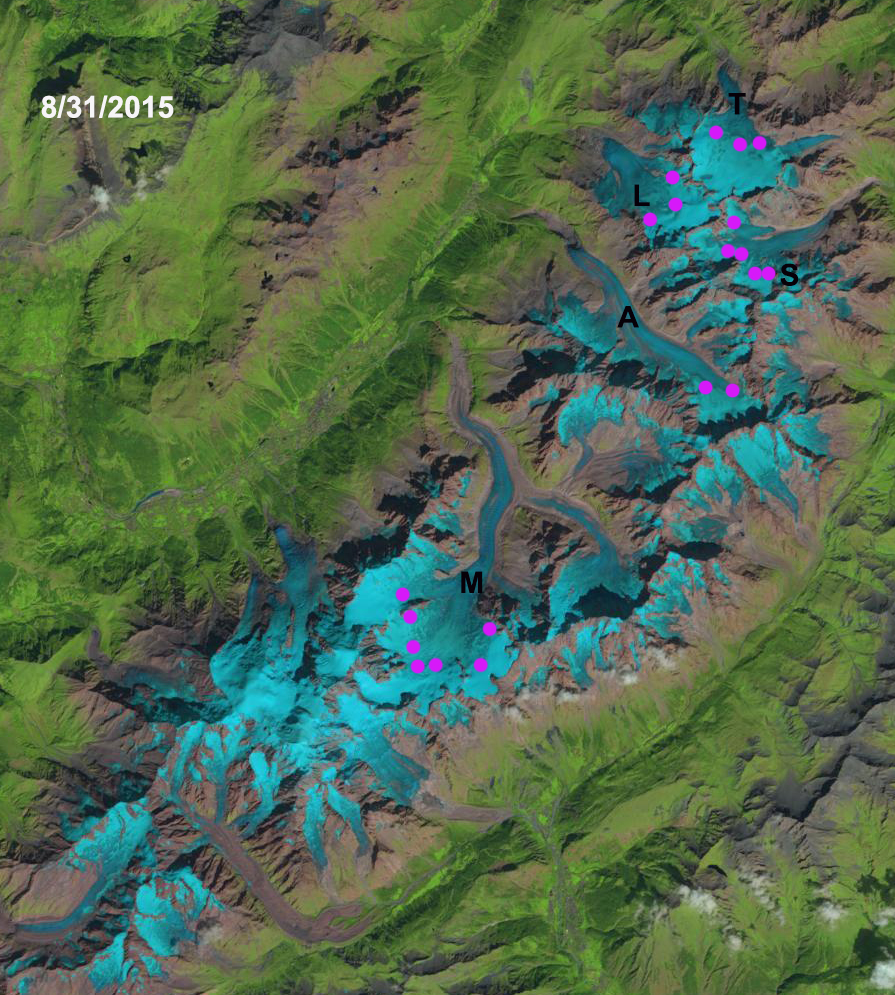
Landsat image of the transient snow line on Mont Blanc Glaciers, France on 8/31/2015. The average snow line (Purple dots) is at 3050 m. Glaciers on Mer de Glace (M), Argentiere (A), Tour Glacier (L), Trient Glacier (T) and Saleina Glacier (S).