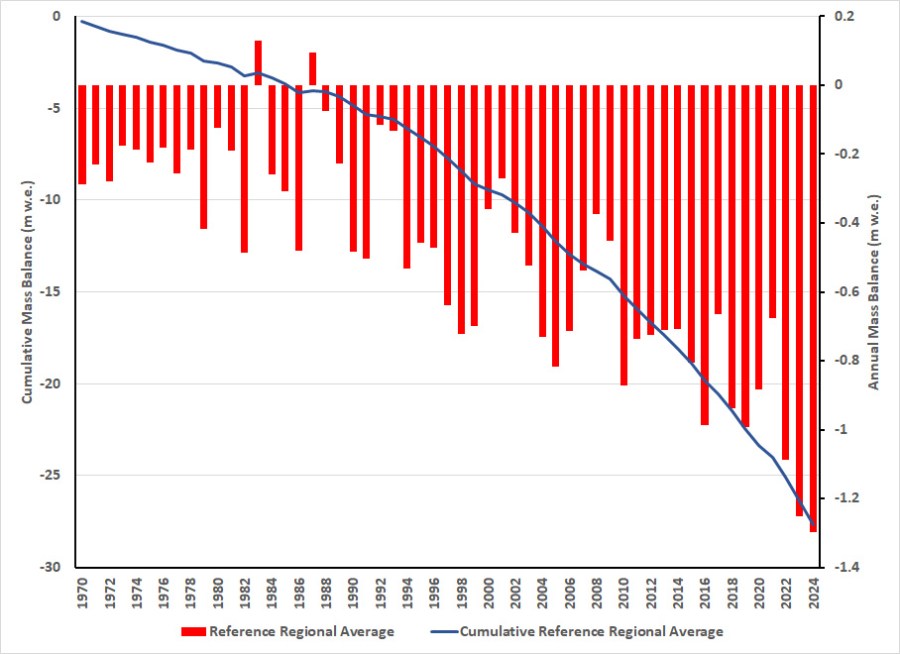
Global alpine mass balance in 2024 as reported to the World Glacier Monitoring Service. Solid line is the cumulative balance, bars are the annual balance.
Each of the last 15 years I have summarized the annual mass balance of alpine glaciers globally for the Bulletin American Meterological Society-State of the Climate report,. Below is the 2024 section on alpine glaciers with a few added figures.
ALPINE GLACIERS
M. Pelto
In 2024, all 58 global reference glaciers reported a negative annual mass balance. This is only the second year in the 1970–2024 period with all negative annual balances, following 2023. The global average annual mass balance based on equal weighting of 19 regions is −1.30 m water equivalent (w.e.), the most negative value in the record
The 2024 dataset of submitted glaciological observations includes 142 glaciers from six continents and 27 nations, with 140 reporting a negative balance and 2 a positive balance. In 2024, the mean annual mass balance of the 58 global reference glaciers was −1.44 m w.e. and −1.36 m w.e. for all 142 reporting glaciers. This is a similar result to 2023, which saw a mean reference glacier balance of −1.62 m w.e. and −1.35 m w.e. for all 116 reporting glaciers.
The 2024 regionalized global average of −1.30 m w.e. exceeds the previous most negative year in 2023, which saw a regional-ized global average of −1.25 m w.e. This makes 2024 the 37th consecutive year with a global alpine mass balance loss and the 15th con-secutive year with a regionalized global mass balance below −0.5 m w.e. The acceleration of mass balance loss indicates that alpine glaciers are not approaching equilibrium. The acceleration of mass balance loss is apparent regardless of datasets used to determine it, including glaciological, geodetic, altimetry, and gravimetric observations (The GlaMBIE Team 2025). The intercomparison assessment identified that global glaciers annually lost 273+26 gigatons (Gt) in mass from 2000 to 2023, with loss having been 36% greater in the second half than in the first half of this period (The GlaMBIE Team 2025).
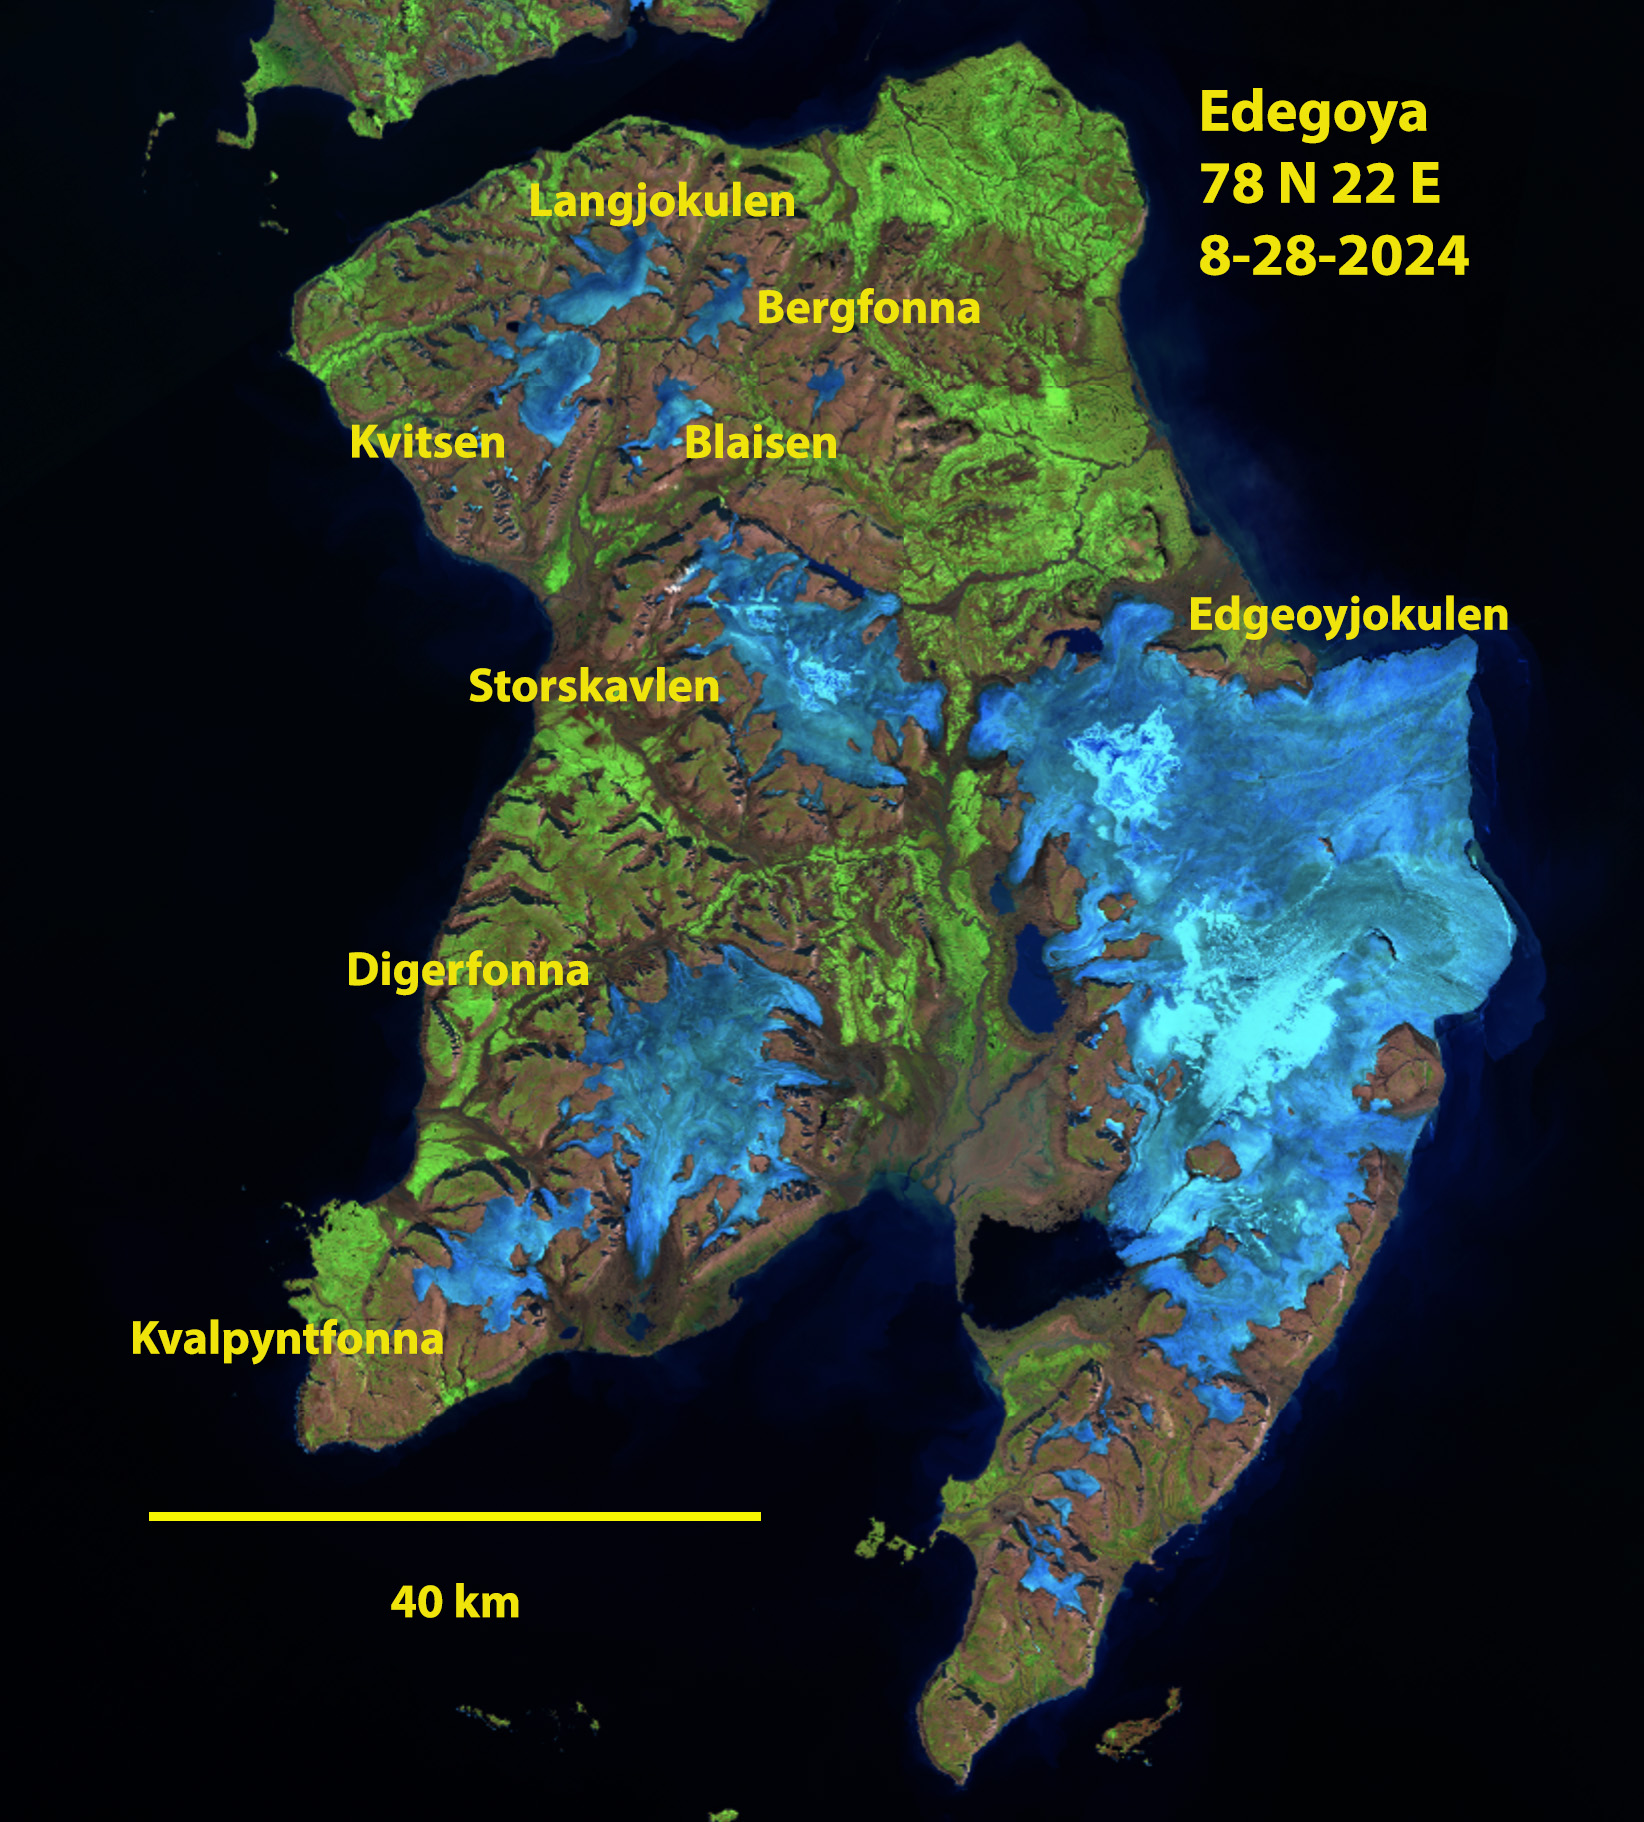
In the European Alps, all 49 glaciers reported negative mass balances, with 45 losing over 1 m w.e. All 10 Icelandic glaciers had negative balances. In Svalbard, all seven had negative balances exceeding an exceptional loss of 1.25 m w.e. This was the result of near complete snow cover loss across most glaciers (Fig. 2.20) following record temperatures in August (see section 7f5 for details). Twelve of the 13 glaciers from Norway and Sweden had mass losses of more than 1.0 m w.e.
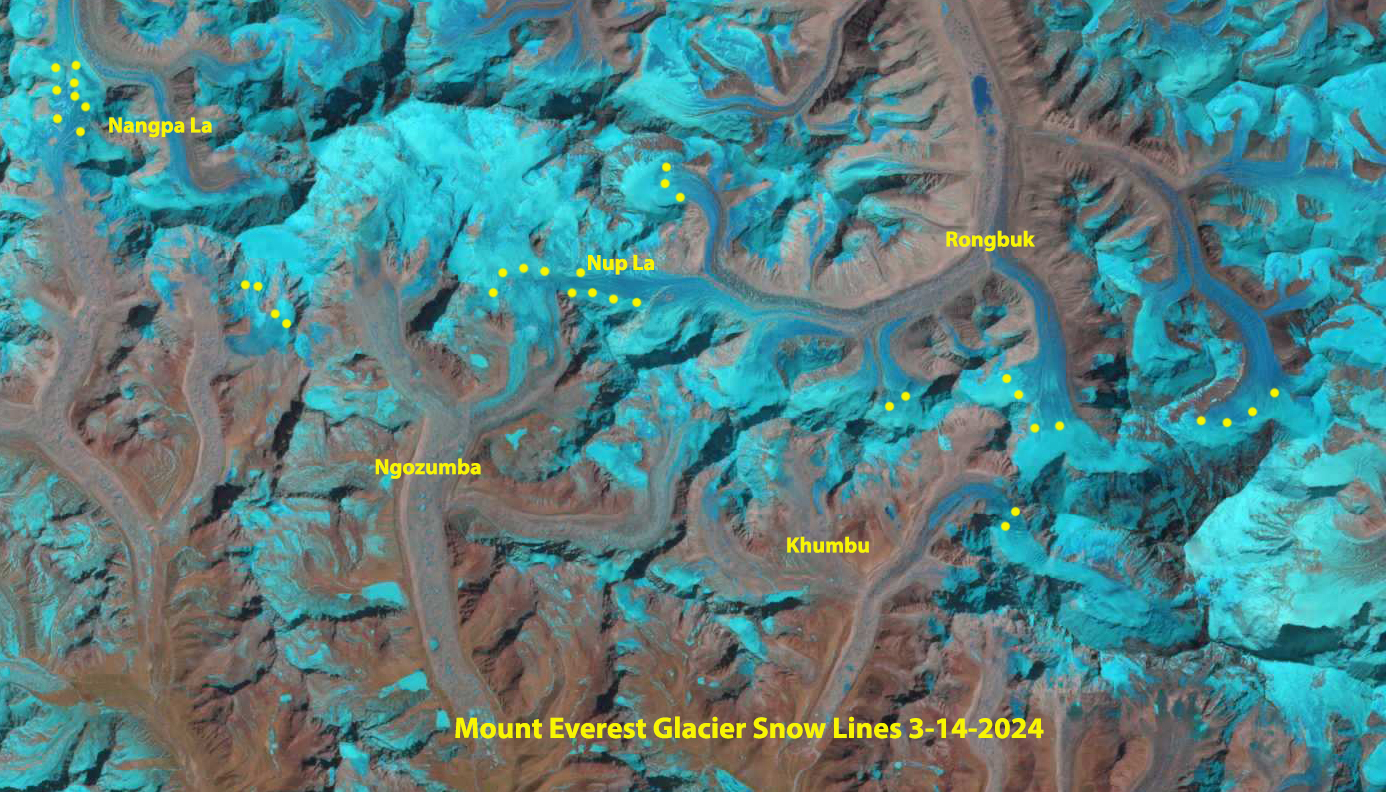
High snow line persisted through the winter on Mount Everest glaciers.
Across High Mountain Asia, 20 of 21 glaciers, reporting from seven nations, had negative balances. The highest average losses were in the Himalayas of Nepal and the lowest in the Pamir Range of Tajikistan.
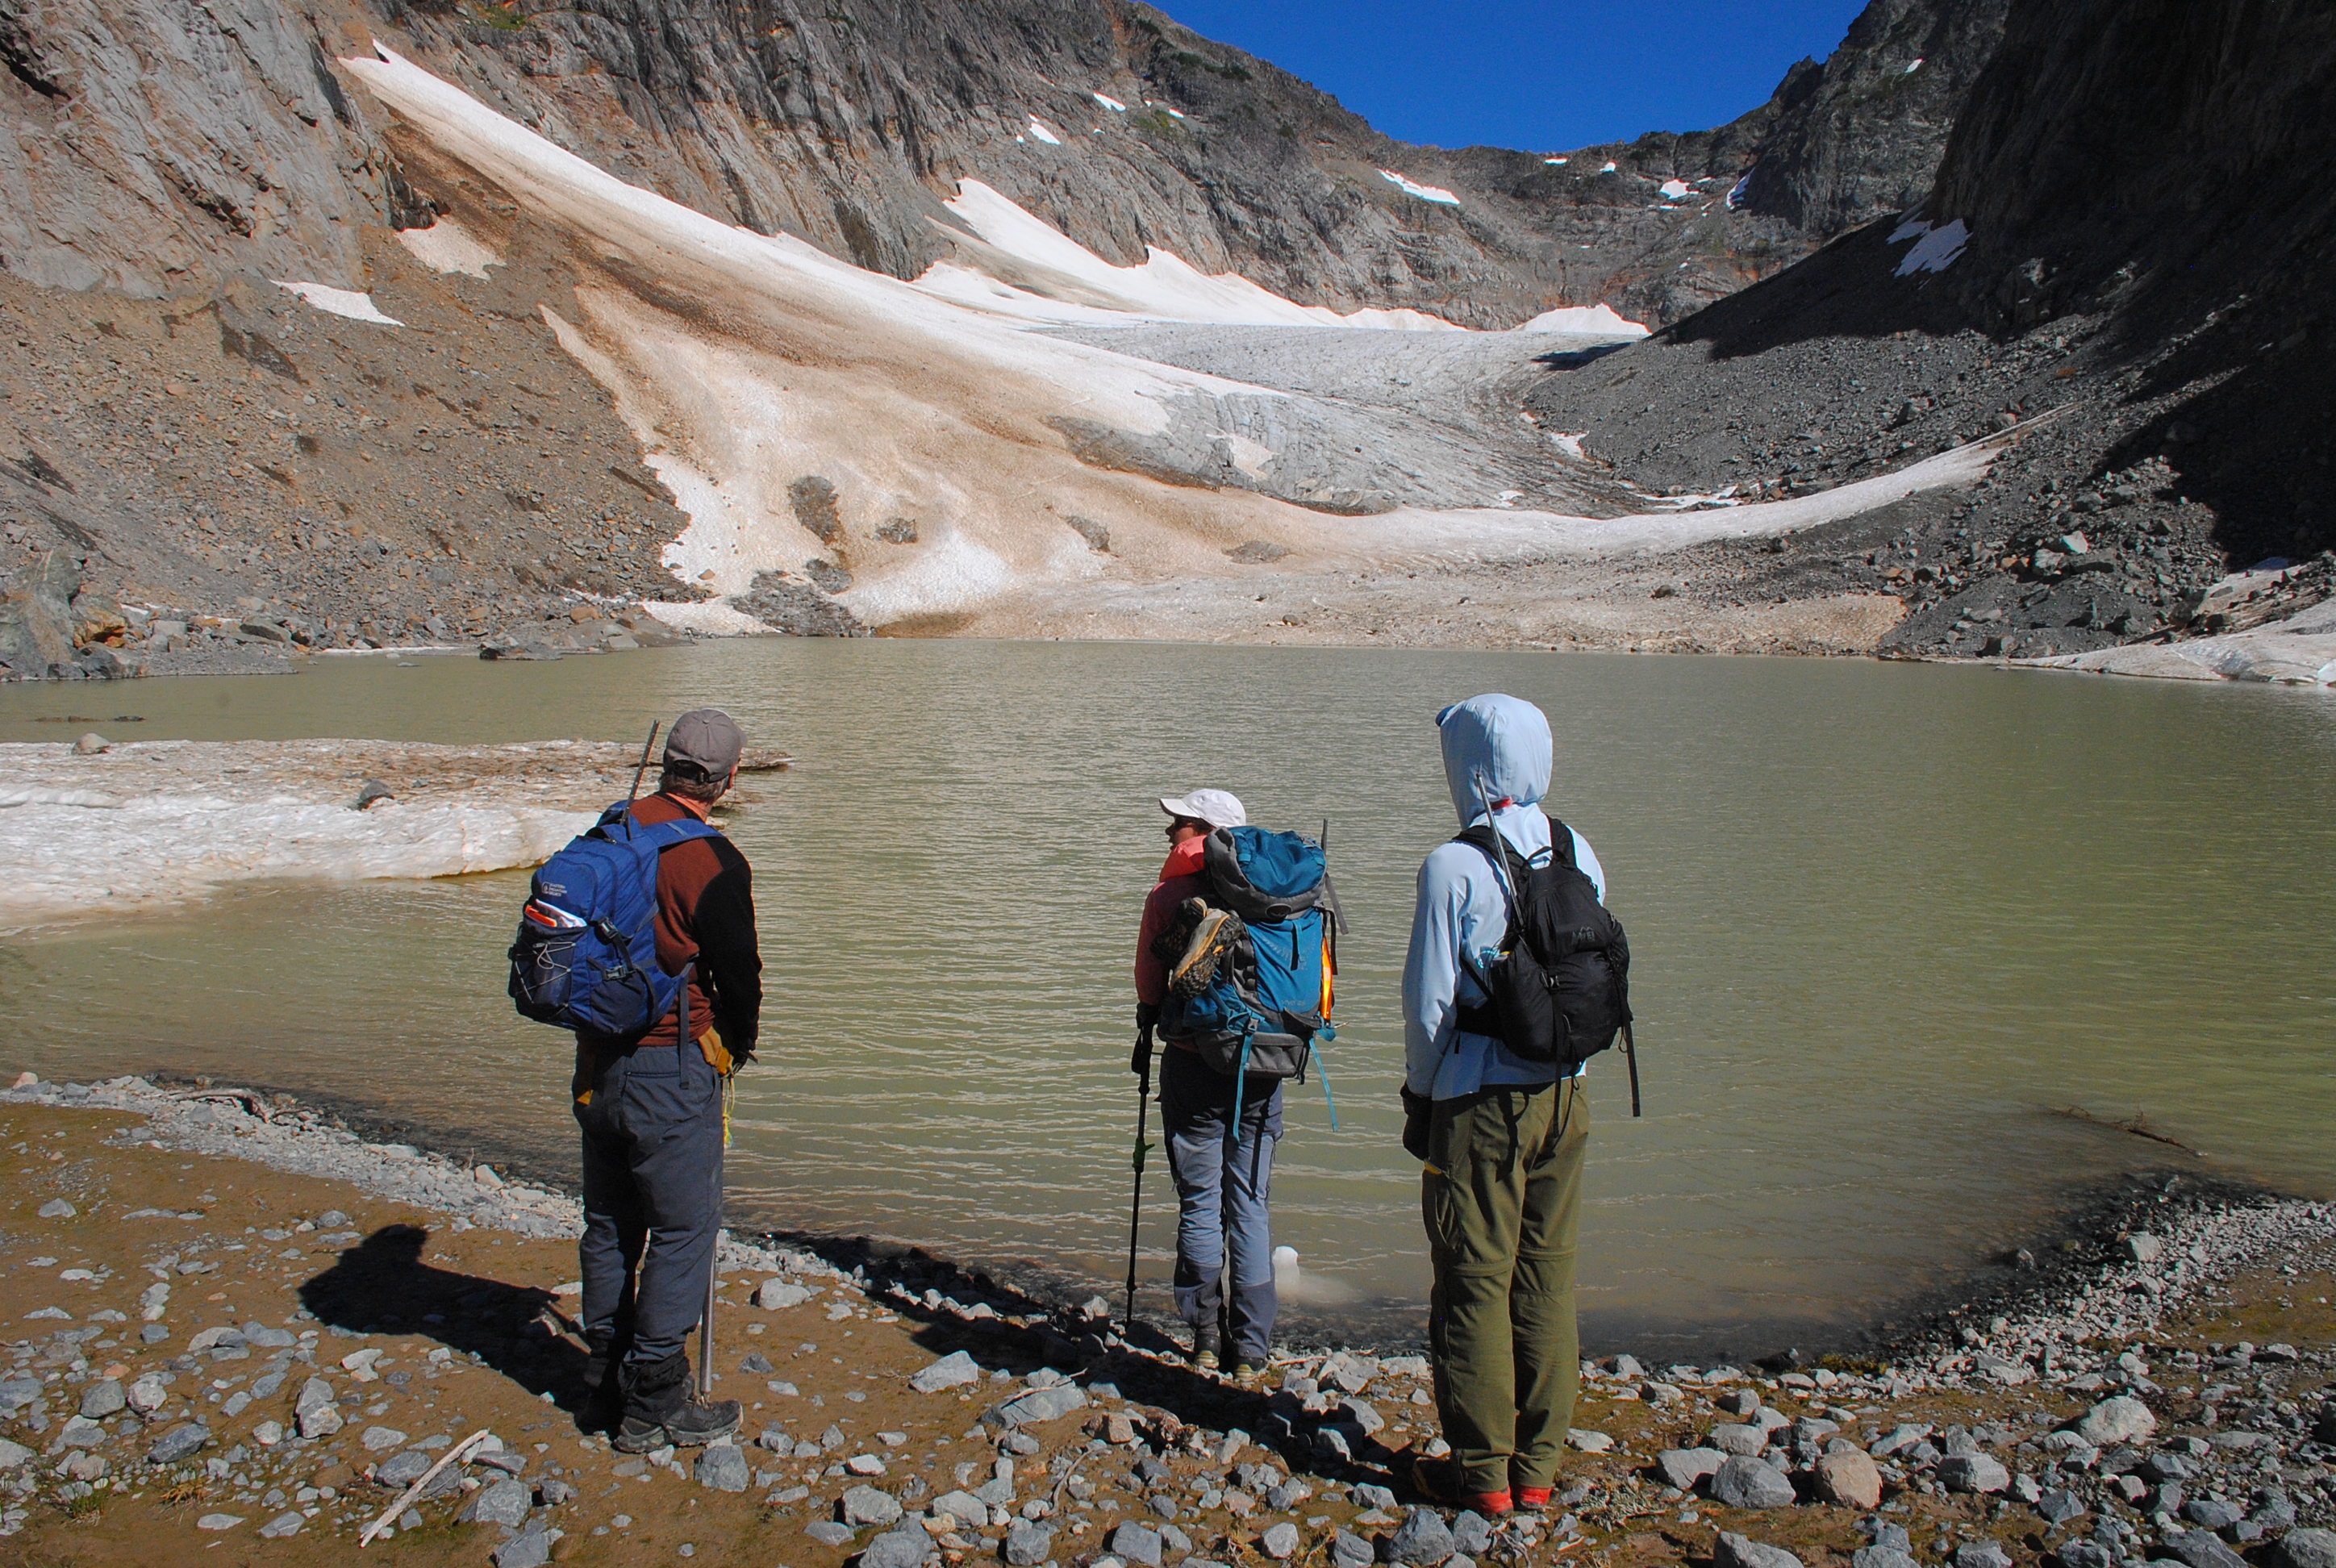
In the Andes Mountains of South America, all 14 glaciers, reporting from five nations, had negative balances. Conejeras Glacier (Colombia), following a 5.04 m w.e. loss in 2023, was declared extinct in 2024. The daily hydrograph below this glacier changed from a predominanceof days with a purely melt-driven hydrograph from 2006 to 2016 to an increase in the frequency of days with flows less influenced by melt after 2016 (Morán-Tejeda et al. 2018).
All 16 glaciers in North America had negative balances. All four glaciers in Arctic Canada had mass balance losses under 1 m w.e. In western Canada and Washington and Montana (United States), all 16 glaciers reporting had losses exceeding 1 m w.e. The Ice Worm Glacier (Washington) was listed as extinct in 2023 after 40 years of continuous observations (Pelto 2024). In 2024, loss from the relict ice (ice that is no longer moving or part of a glacier) was 2.4 m and melt runoff below the glacier had decreased similar to Conejeras Glacier (Pelto and Pelto 2025). In Alaska, all three glaciers had mass balance losses. Davies et al. (2024) examined the Juneau Icefield, the most observed icefield in Alaska in terms of mass balance, and found an acceleration of mass loss with a doubling after 2010 compared to 1979–2010.
Easton Glacier, Washington extensive retreat since 1990, with last five years being the most rapid. Terminus and mass balance surveyed annually and reported to WGMS.
Alpine annual mass balance glaciological observations are reported to the World Glacier Monitoring Service (WGMS) by national representatives with a 1 December annual submission deadline. WGMS reference glaciers have at least 30 continuous years of mass balance observa-tion. Benchmark glaciers have at least a 10-year mass balance record and are in regions that lack sufficient reference glaciers. The combination of benchmark and reference glaciers is used to generate regional averages (WGMS 2023). Global values are calculated using a single averaged value for each of 19 mountain regions, limiting bias from observed regions (WGMS 2023). As this dataset expands, the annual values are reanalyzed and updated.
The lack of snow pack at the end of summer is evident across Edgeoya in Svalbard, blow a closeup of Digerfonna further illustrates with lettered points indicating new bedrock areas that are expanding amidst the ice cap.
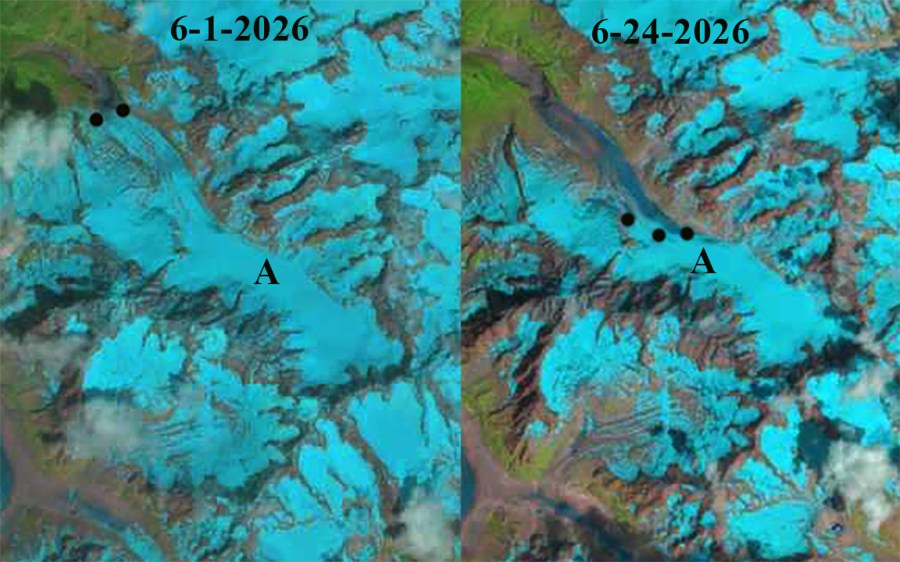
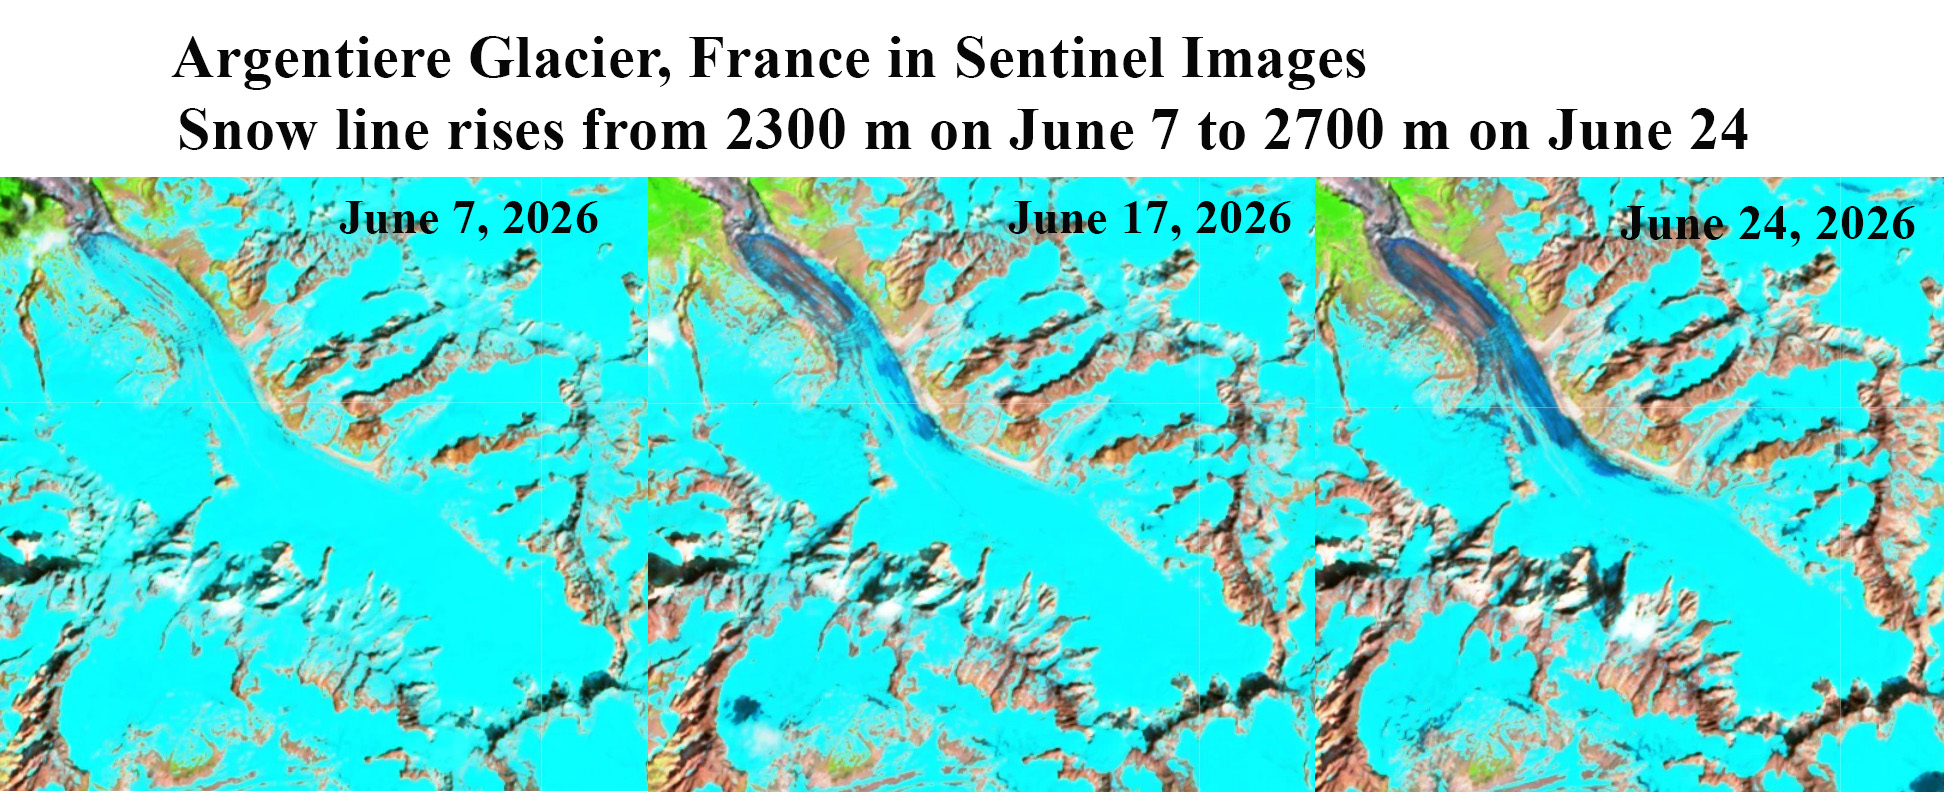
On June 1, 2026 the snowline is near the terminus of Argentiere Glacier at 2300 m, by June 24, 2026 the snowline has rise upglacier 3.3 km to 2700 m.
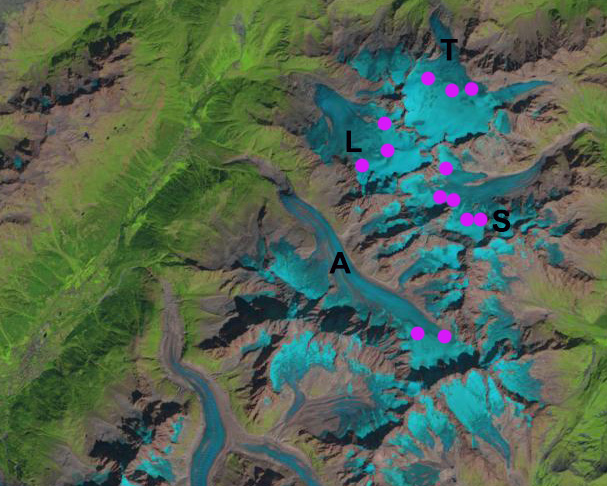
The French Alps have expereienced a significant June heat wave that has driven a rapid rise in glacier snow lines. Rabatel et al (2013) examined the equilibrium line altitude (ELA) of glaciers in the region from 1984-2010. The ELA is the snowline at the end of the summer melt season. Rabatel et al (2013) found the average snow line of 3000 m on Trient Glacier, 2900 m on Tour Glacier, and 2800 m on Argentiere Glacier.
On June 1st and 7th 2026 the snow line on Argentiere Glacier was near the terminus at 2300 m, by June 24th the snow line risen to 2700 m. This is 100 m shy of the average end of summer snow line, with 25% of the glacier losing its snowcover in this period. In 2015 and 2017 the snowline reached a record height of 2950 m in late August. This snow line rose to 3000 m again in August of 2022 and to 2900 m in August 2023. The snow lines from these years are in images below
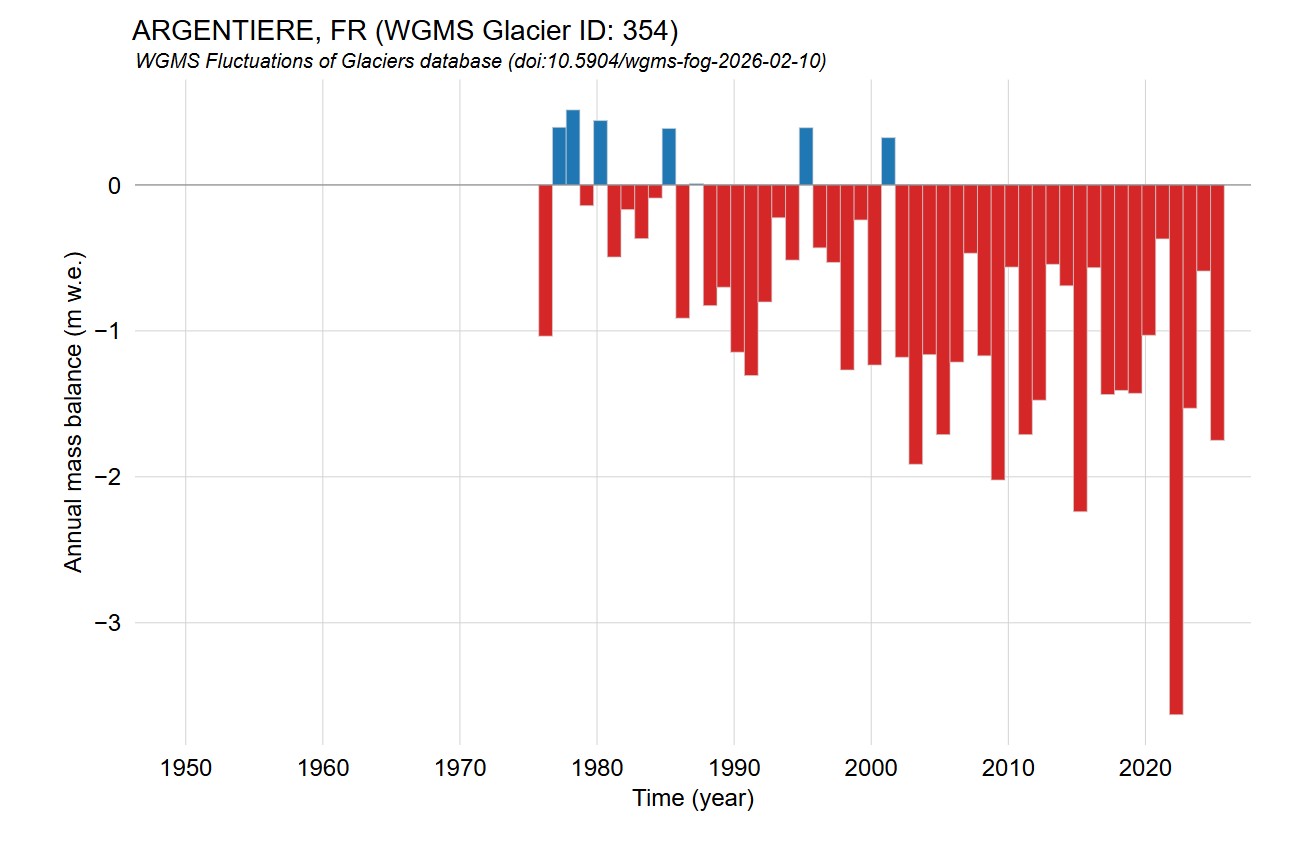
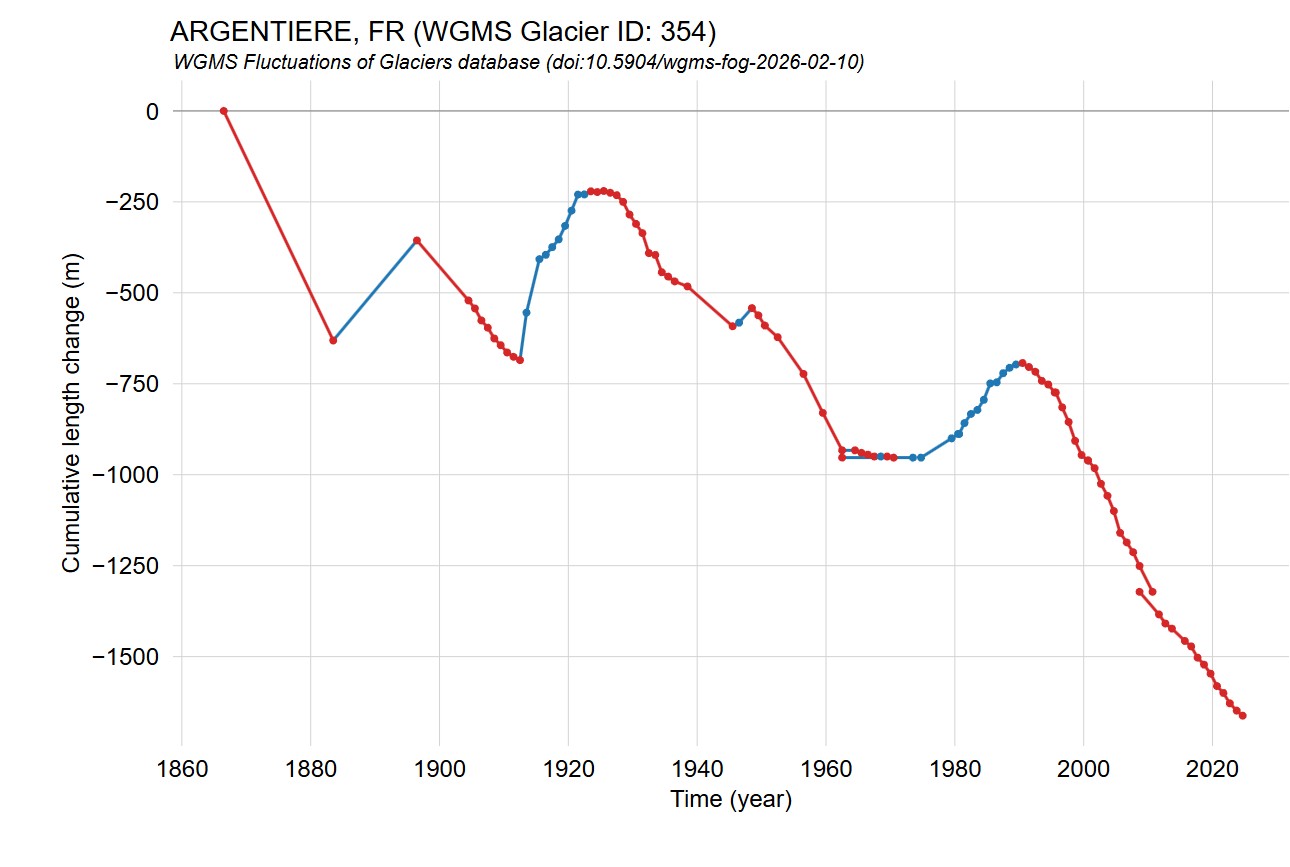
The high snow lines result in a limited accumulation zone and an expanded ablation area leading to mass balance losses and terminus retreat. Argentiere Glacier is a World Glacier Monitoring Service reference glacier, with the data indicated in the images below. The glacier advanced from the early 1960s to early 1990s and since driven by negative mass balances in all but one year this century has retreated ~ 1 km. The mass balance loss has exceeded 1 m in most years this century and will again this year.
Annual mass balance reported to WGMS for Argentiere Glacier.Terminus change reported to WGMS for Argentiere Glacier.Argentiere Glacier snow line at end of 2015 melt season at 2950 m in Landsat image.Argentiere Glacier snow line at end of 2017 melt season at 2950 m in Landsat image.Argentiere Glacier snow line at end of 2022 melt season at 3000 m in Sentinel image.Argentiere Glacier snow line at end of 2023 melt season at 2900 m in Sentinel image.
March 21, 2026 was World Day for Glaciers, telling this story is an ongoing four decades long project for us. The North Cascade Glacier Climate Project began in 1984 to identify the response of Washington’s North Cascade glaciers to climate change. The 2026 field season will mark our 43rd year of observations.
I co-direct the project as the science director, with Jill Pelto as the art director. We strive to create a diverse and collaborative portfolio of impactful observations connecting people to science through art and data publication. Our theory of change is that art has the power to inspire people by including the emotional context behind the science research. We seek collaborators who are passionate about contributing to and sharing this work. Here we reflect on some of the stories we have shared in the last 12 months that chronicle the rapidly melting reality of glaciers.
In April, 2025 the “Shaped by Ice” exhibit coordinated by Jill Pelto opened at the Slip Gallery in Seattle. This featured work from nine artists, eight of whom had been in the field with us and was the focus of a Seattle Magazine article.
In May we worked with Protect Our Winters to explore what the loss of glaciers, “Beyond the Ice” means for specific regions.
In June, High Country News focused on the use of art to preserve the legacy of glaciers, given the glaciers themselves are not being preserved.
In March through July we worked with the Global Glacier Casualty List to the tell the story of specific glaciers in the United States that are disappearing, including Ice Worm Glacier in the North Cascades, Darwin Glacier in the Sierra Nevada, Twins Glacier in Wyoming and Burroughs Glacier in Alaska.
In August our field season coincided with a Seattle Time report, on Melting Mountains in the Pacific Northwest means, that we collaborated on.
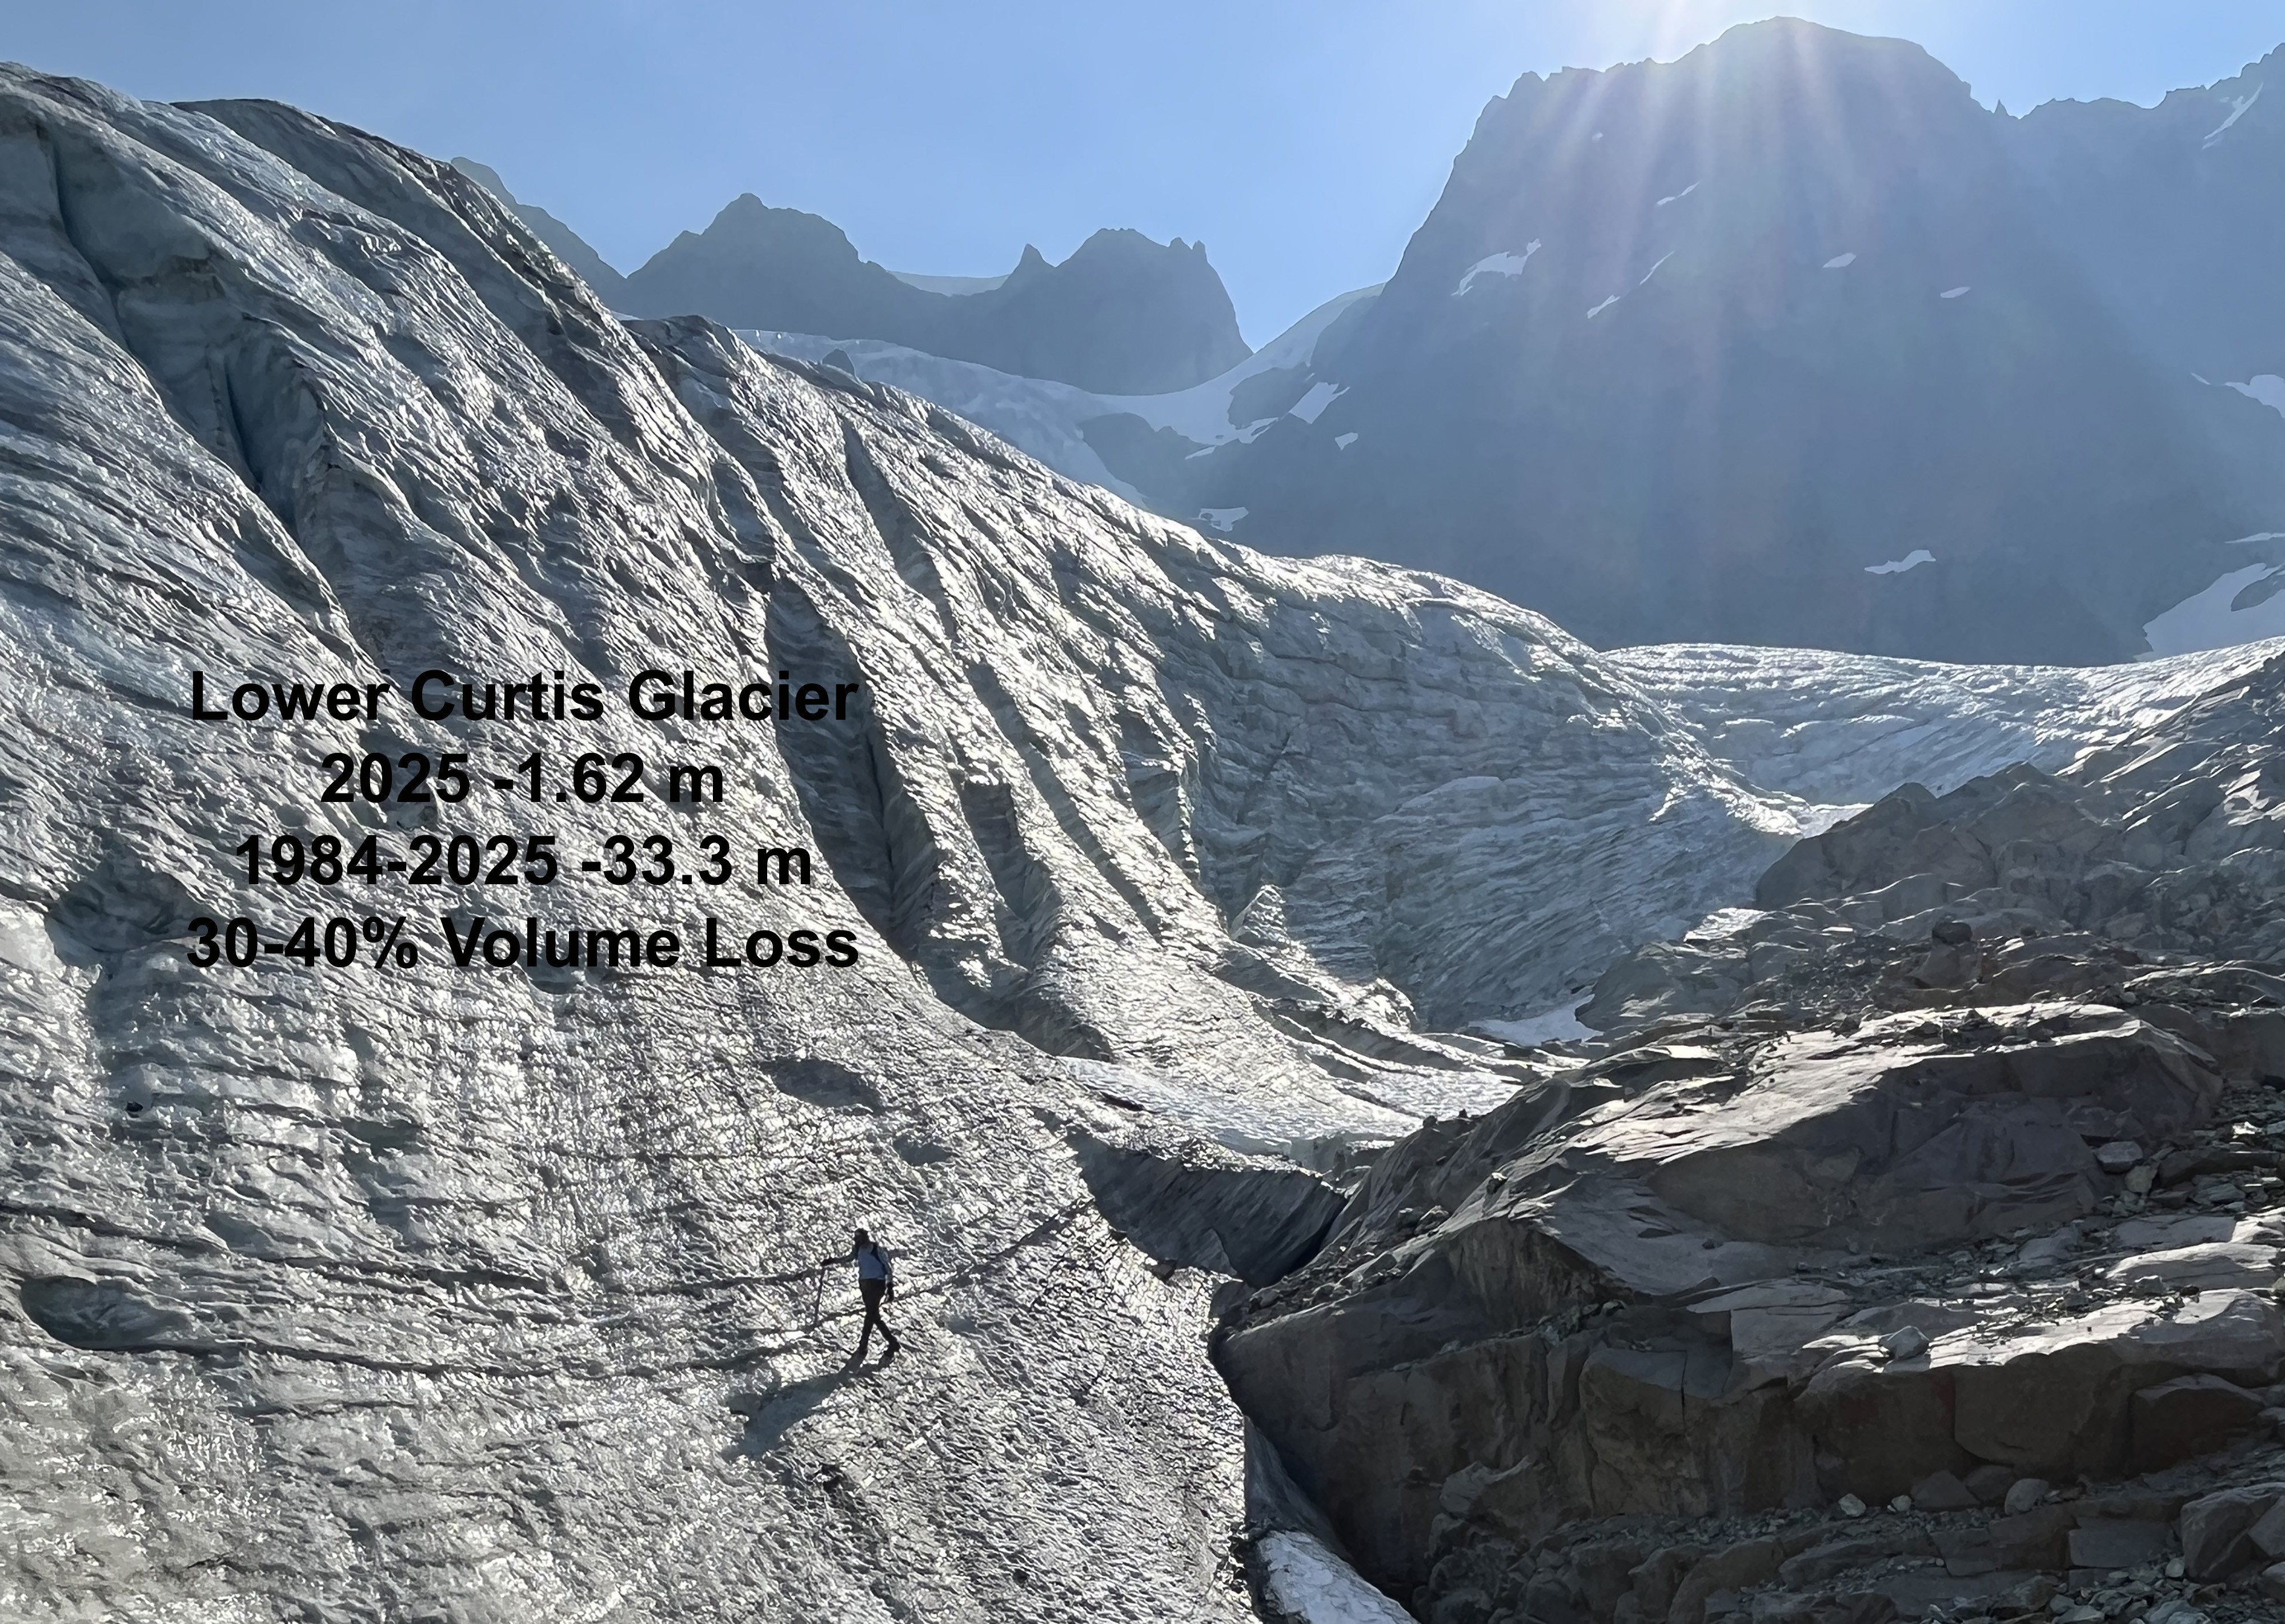
Joining us in the field on the Lower Curtis Glacier, Mount Shuksan was KING5 NBC-Seattle affiliate, led by Meteorologist Leah Pezzetti who backpacked with us into her first glacier. The logistical preparation for this by KING5 was thorough, and we provided guidance and support to them. The resulting feature was released while we were still in the field.
Upon returning to the trailhead from Lower Curtis Glacier a CBS Sunday Morning News team met us and travelled into the field with us to Sholes Glacier, Mount Baker. The overnight trip into the backcountry was a first for this news team and required extensive collaborative support. The results were shared just two weeks after the filming, and right after our field season.
We worked for a second year with Dan MacComb on a short film for the UN International Year of Glaciers’ Preservation called “Shaped by Ice”. This film published by Protect our Winters has been featured in tfour film festivals during 2025.
In January through February a second “Shaped by Ice” gallery event was held in at the Confluence Gallery in Twisp WA. This was spearheaded by Jill Pelto, Margaret Kingston, and Claire Waichler.
A poor winter snowpack will certainly lead to another year of extensive glacier loss across the Pacific Northwest and we will be there to observe it.
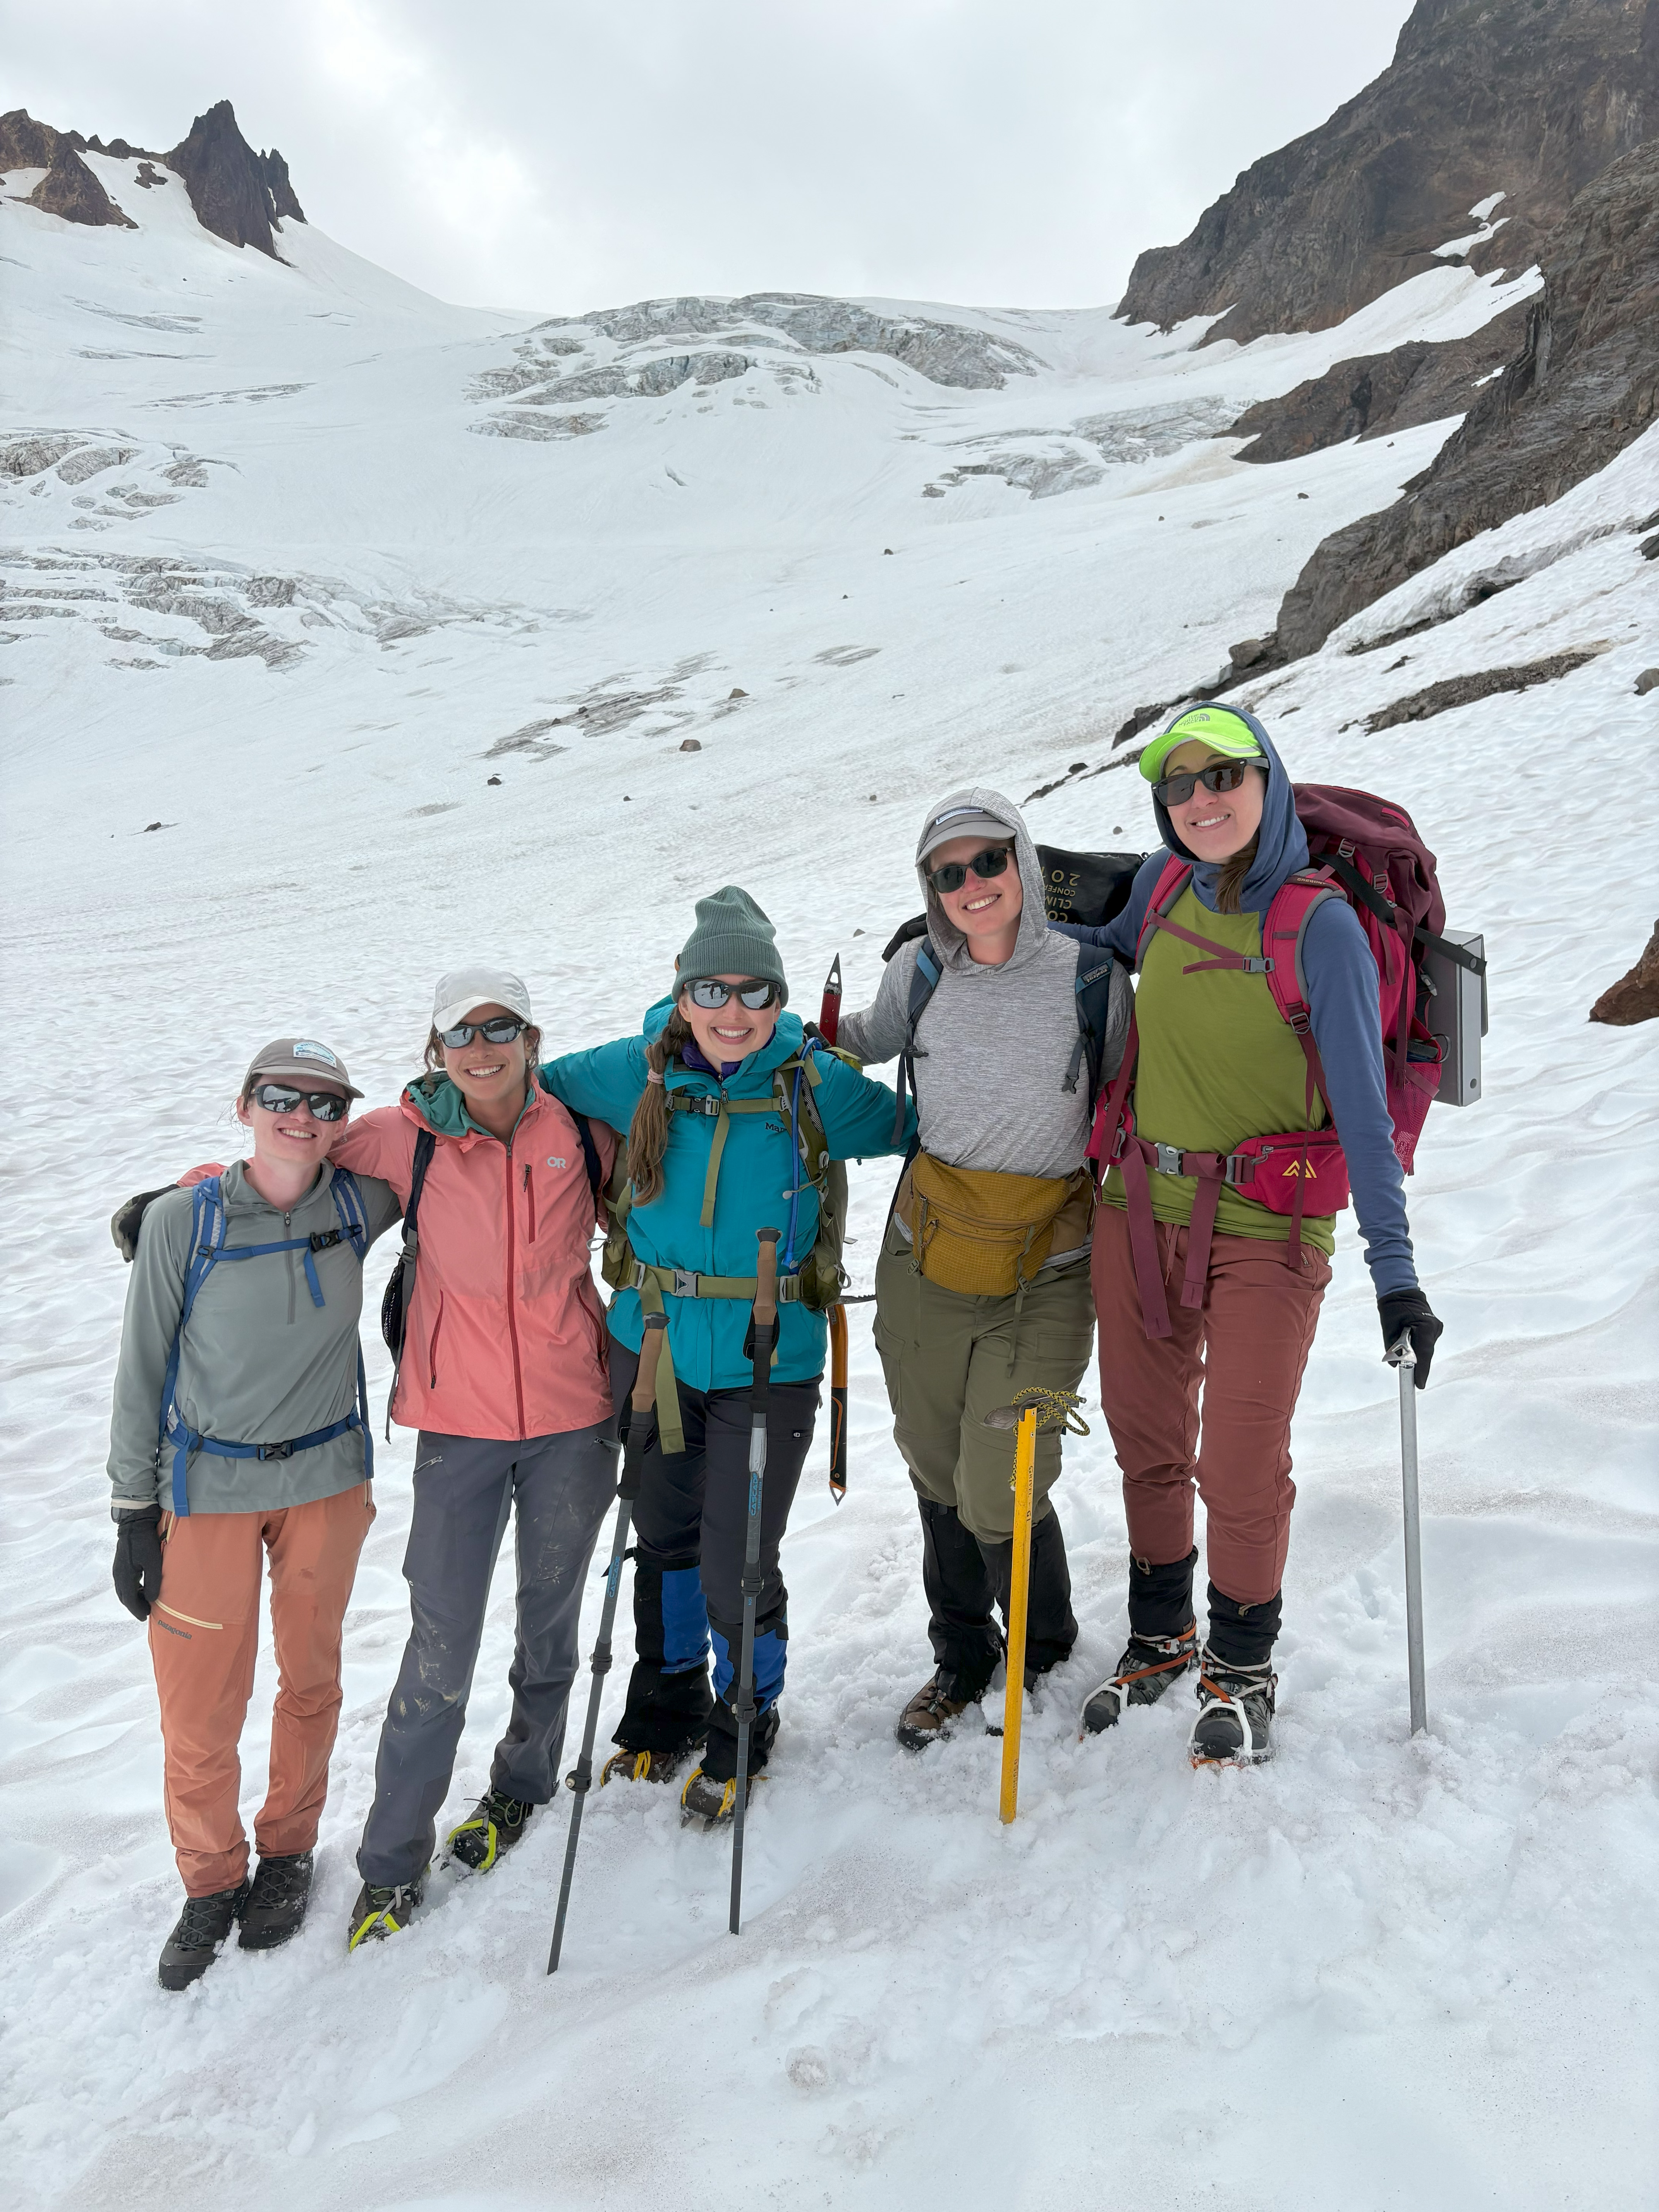
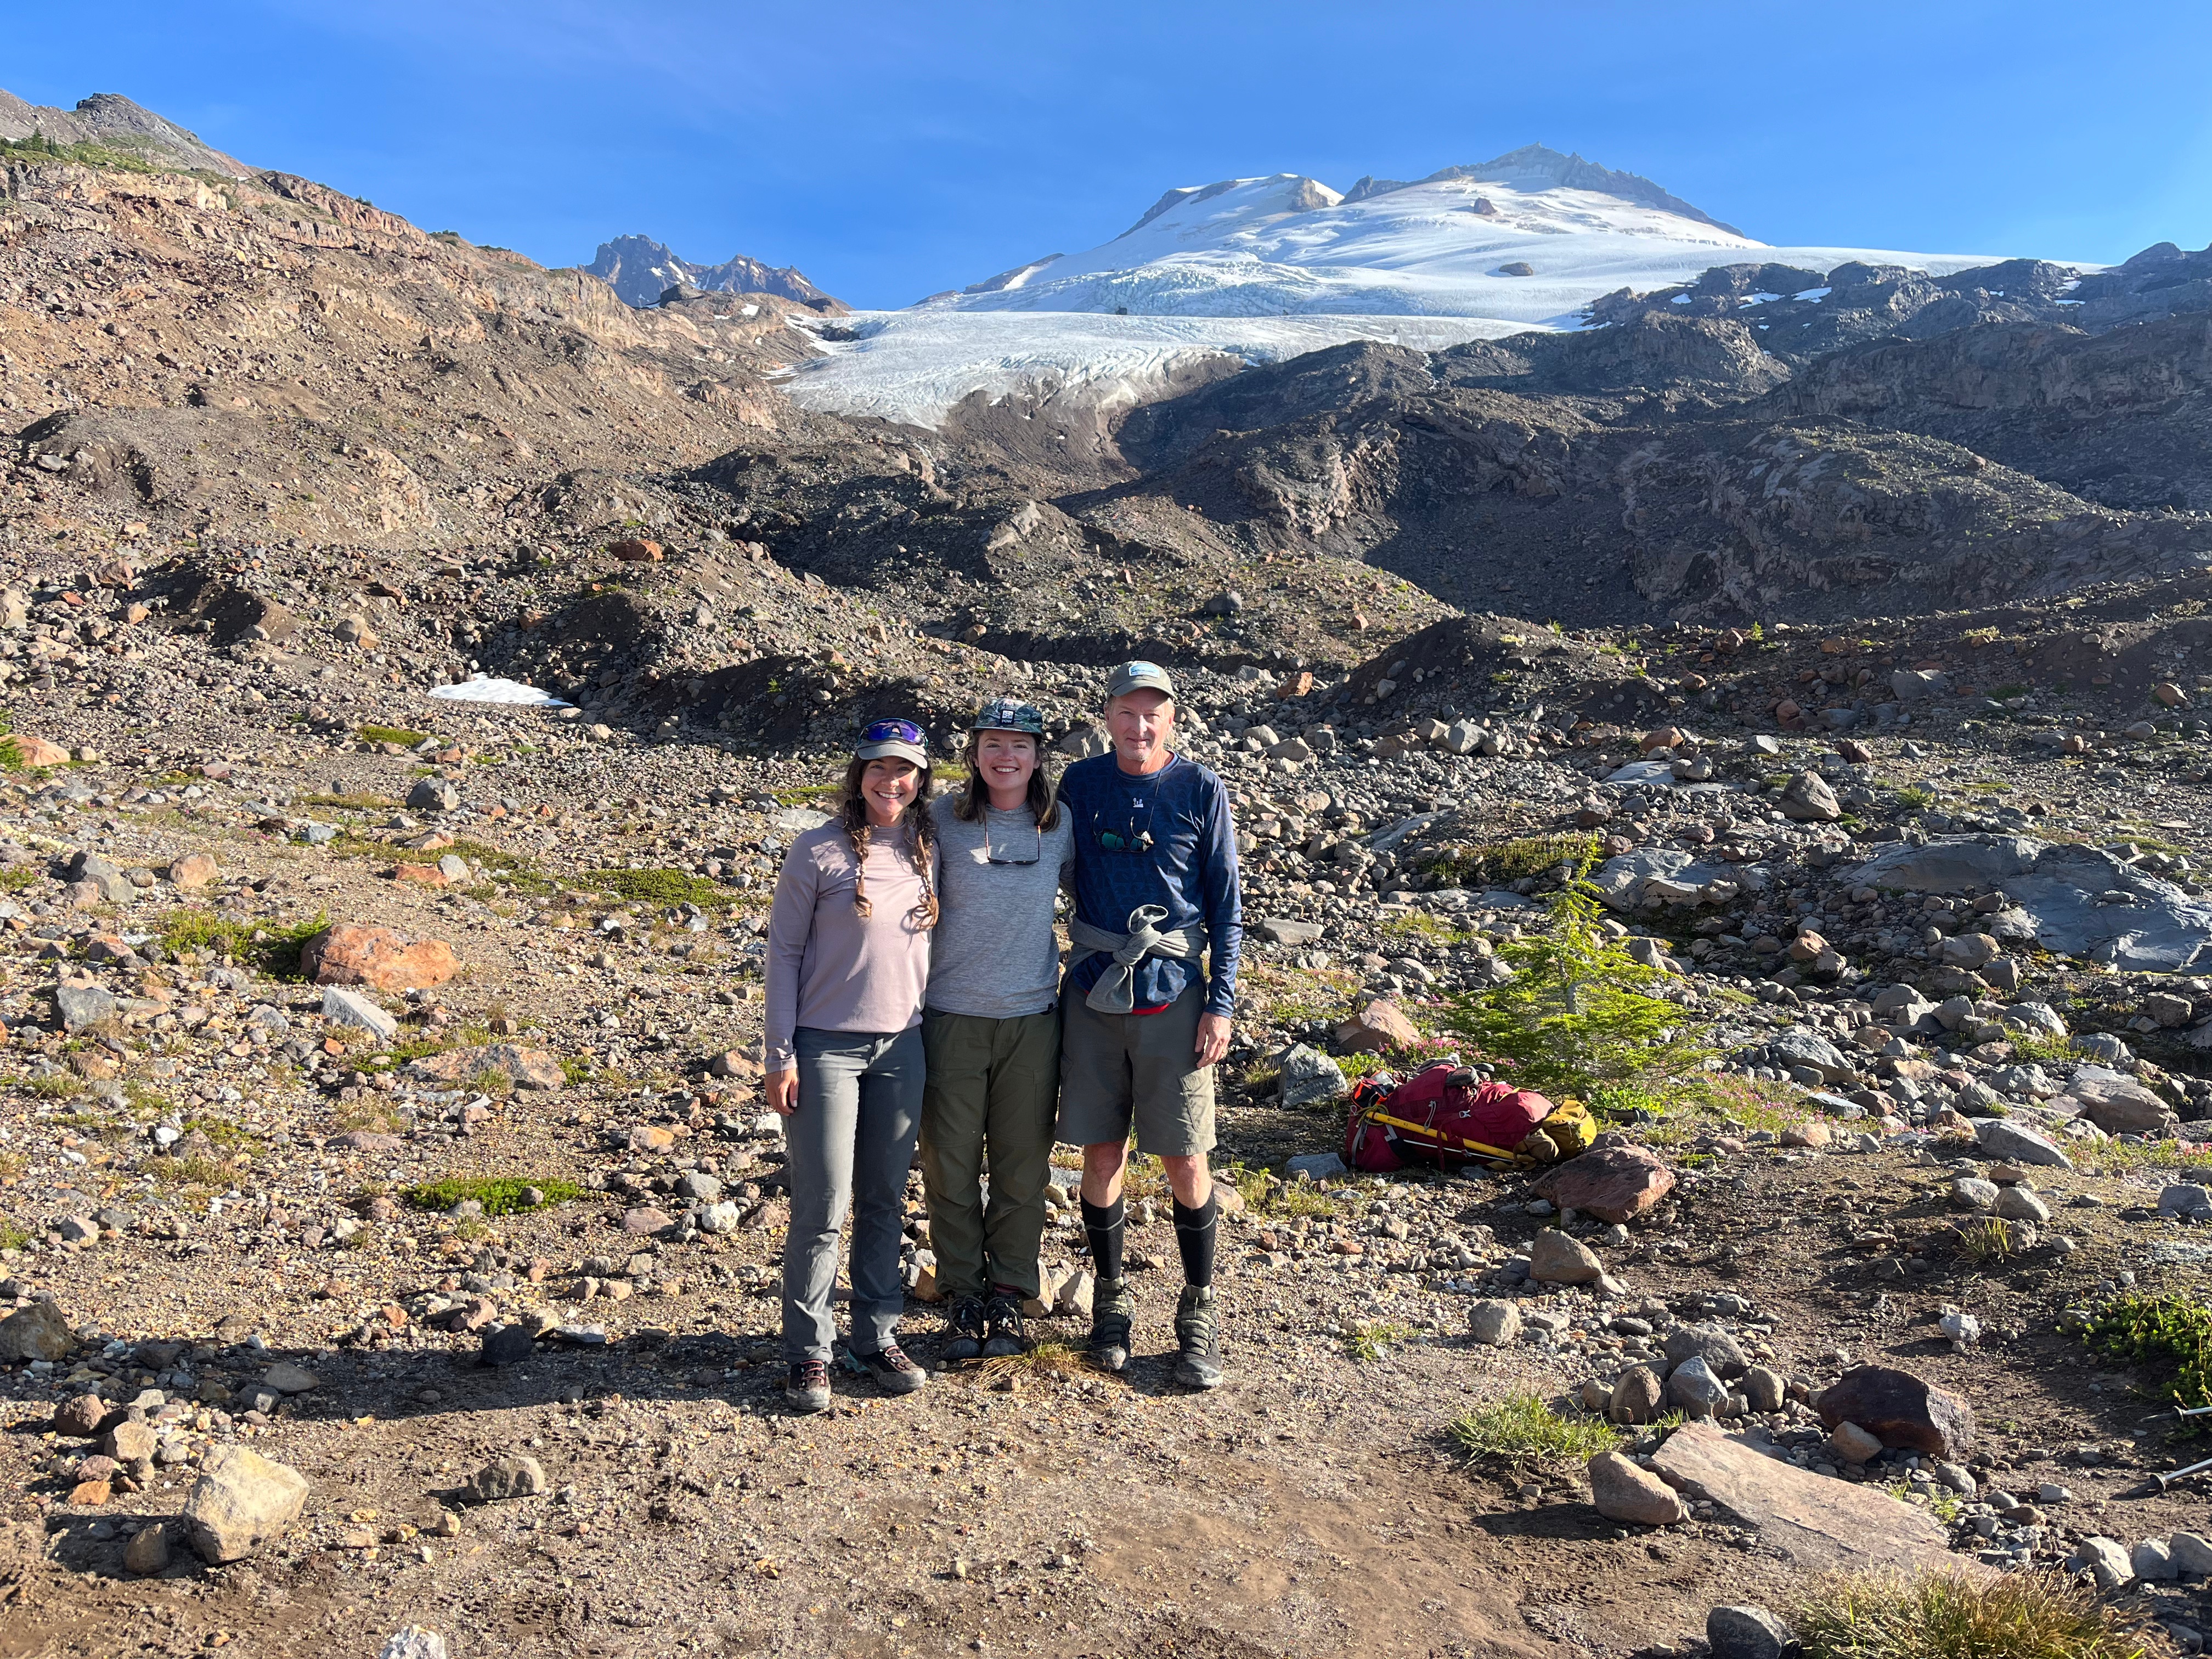
Core field team in 2025 Emmett Elsom, Mauri Pelto, Jill Pelto and Caitlin Quirk.
We hiked into North Cascade glacier to complete detailed observations for our 42nd consecutive year. These annual observations provide a detailed assessment of their response to climate change. For the third consecutive year North Cascade glacier on on average lost more than 2 m of glacier thickness. This cumulative loss of 7-8 m on most of the ranges glaciers that average 25-40 m in thickness represents 20% of their volume lost in just three years. On a few of the largest glaciers, such as those on Mount Baker that average 40-60 m in thickness the loss represents 12% of their volume lost.
The consequence is an acceleration of the collapse of the North Cascade glacier system. This landscape that has for long been shaped by ice is rapidly losing that glacier element. The rate of retreat for the glaciers we work on has accelerated so quickly that we are faced each year with changing terrain and new challenges. Beyond that, we are starting to really see the effect this retreat and the decrease in water has on the ecosystems both near the glaciers and further downstream. During the field season we love seeing the wildflowers, eating blueberries, and counting mountain goats. These are all parts of a habitat that is built around glaciers and snowpack. Seeing these shifts has been really difficult, but it helps to still return to these landscapes and continue to tell their stories through science and art. Below the story is told in images with captions by each of us who participated.
Two things that stood out during the 2025 field season were the strength of our collaborations, and the changing resources the glaciers are able to provide to the surrounding ecosystem. This visible change attracted the attention of KING5-Seattle NBC affiliate and CBS Morning News. At the bottom of this post the resulting footage is embedded. The film “Shaped By Ice” Jill and I worked on with Dan McComb has been a finalist in two recent film festivals, this footage also at bottom of this long read post.
Working on Rainbow Glacier from left-Katie Hovind, Caitlin Quirk, Claire Seaman, Jill Pelto and Margaret Kingston
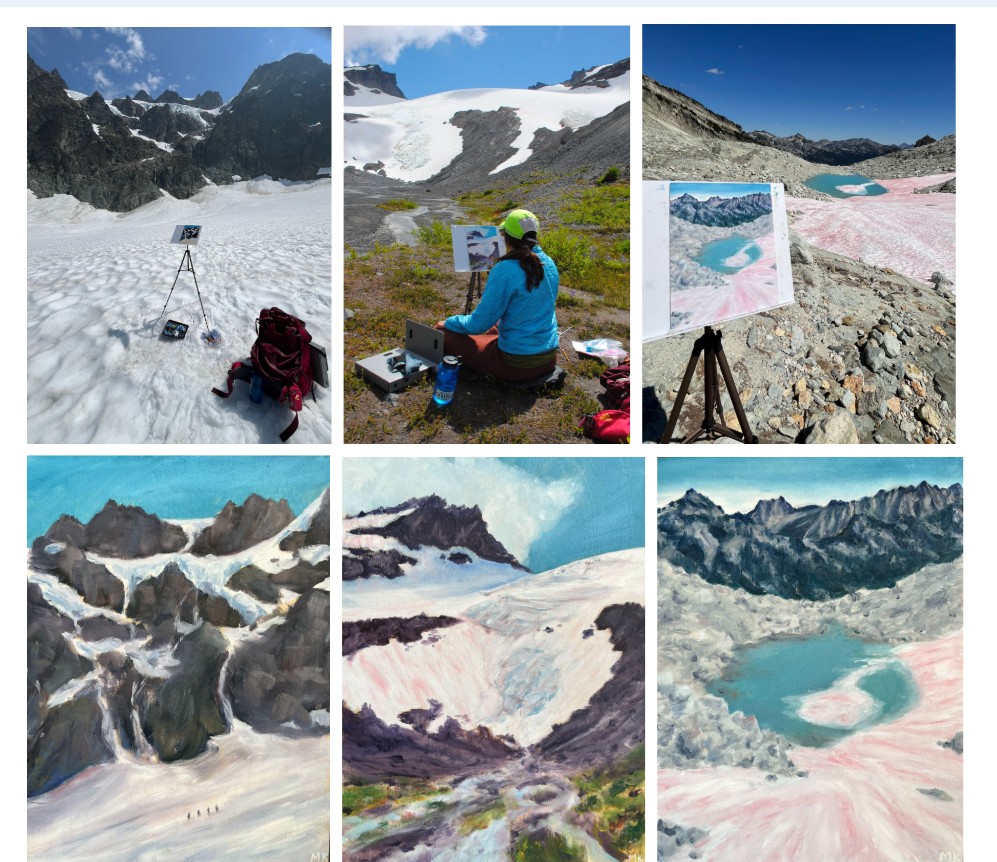
We worked with two oil painters, one watercolor painter, one printmaker, two news film crews, a team of botanists, and more. The result of all these collaborations has led to so many great stories being created and shared about our collective work. It also meant our core group of field assistants had to be flexible to a changing group and the sometimes difficult and imperfect logistics that accompany that. -Jill Pelto
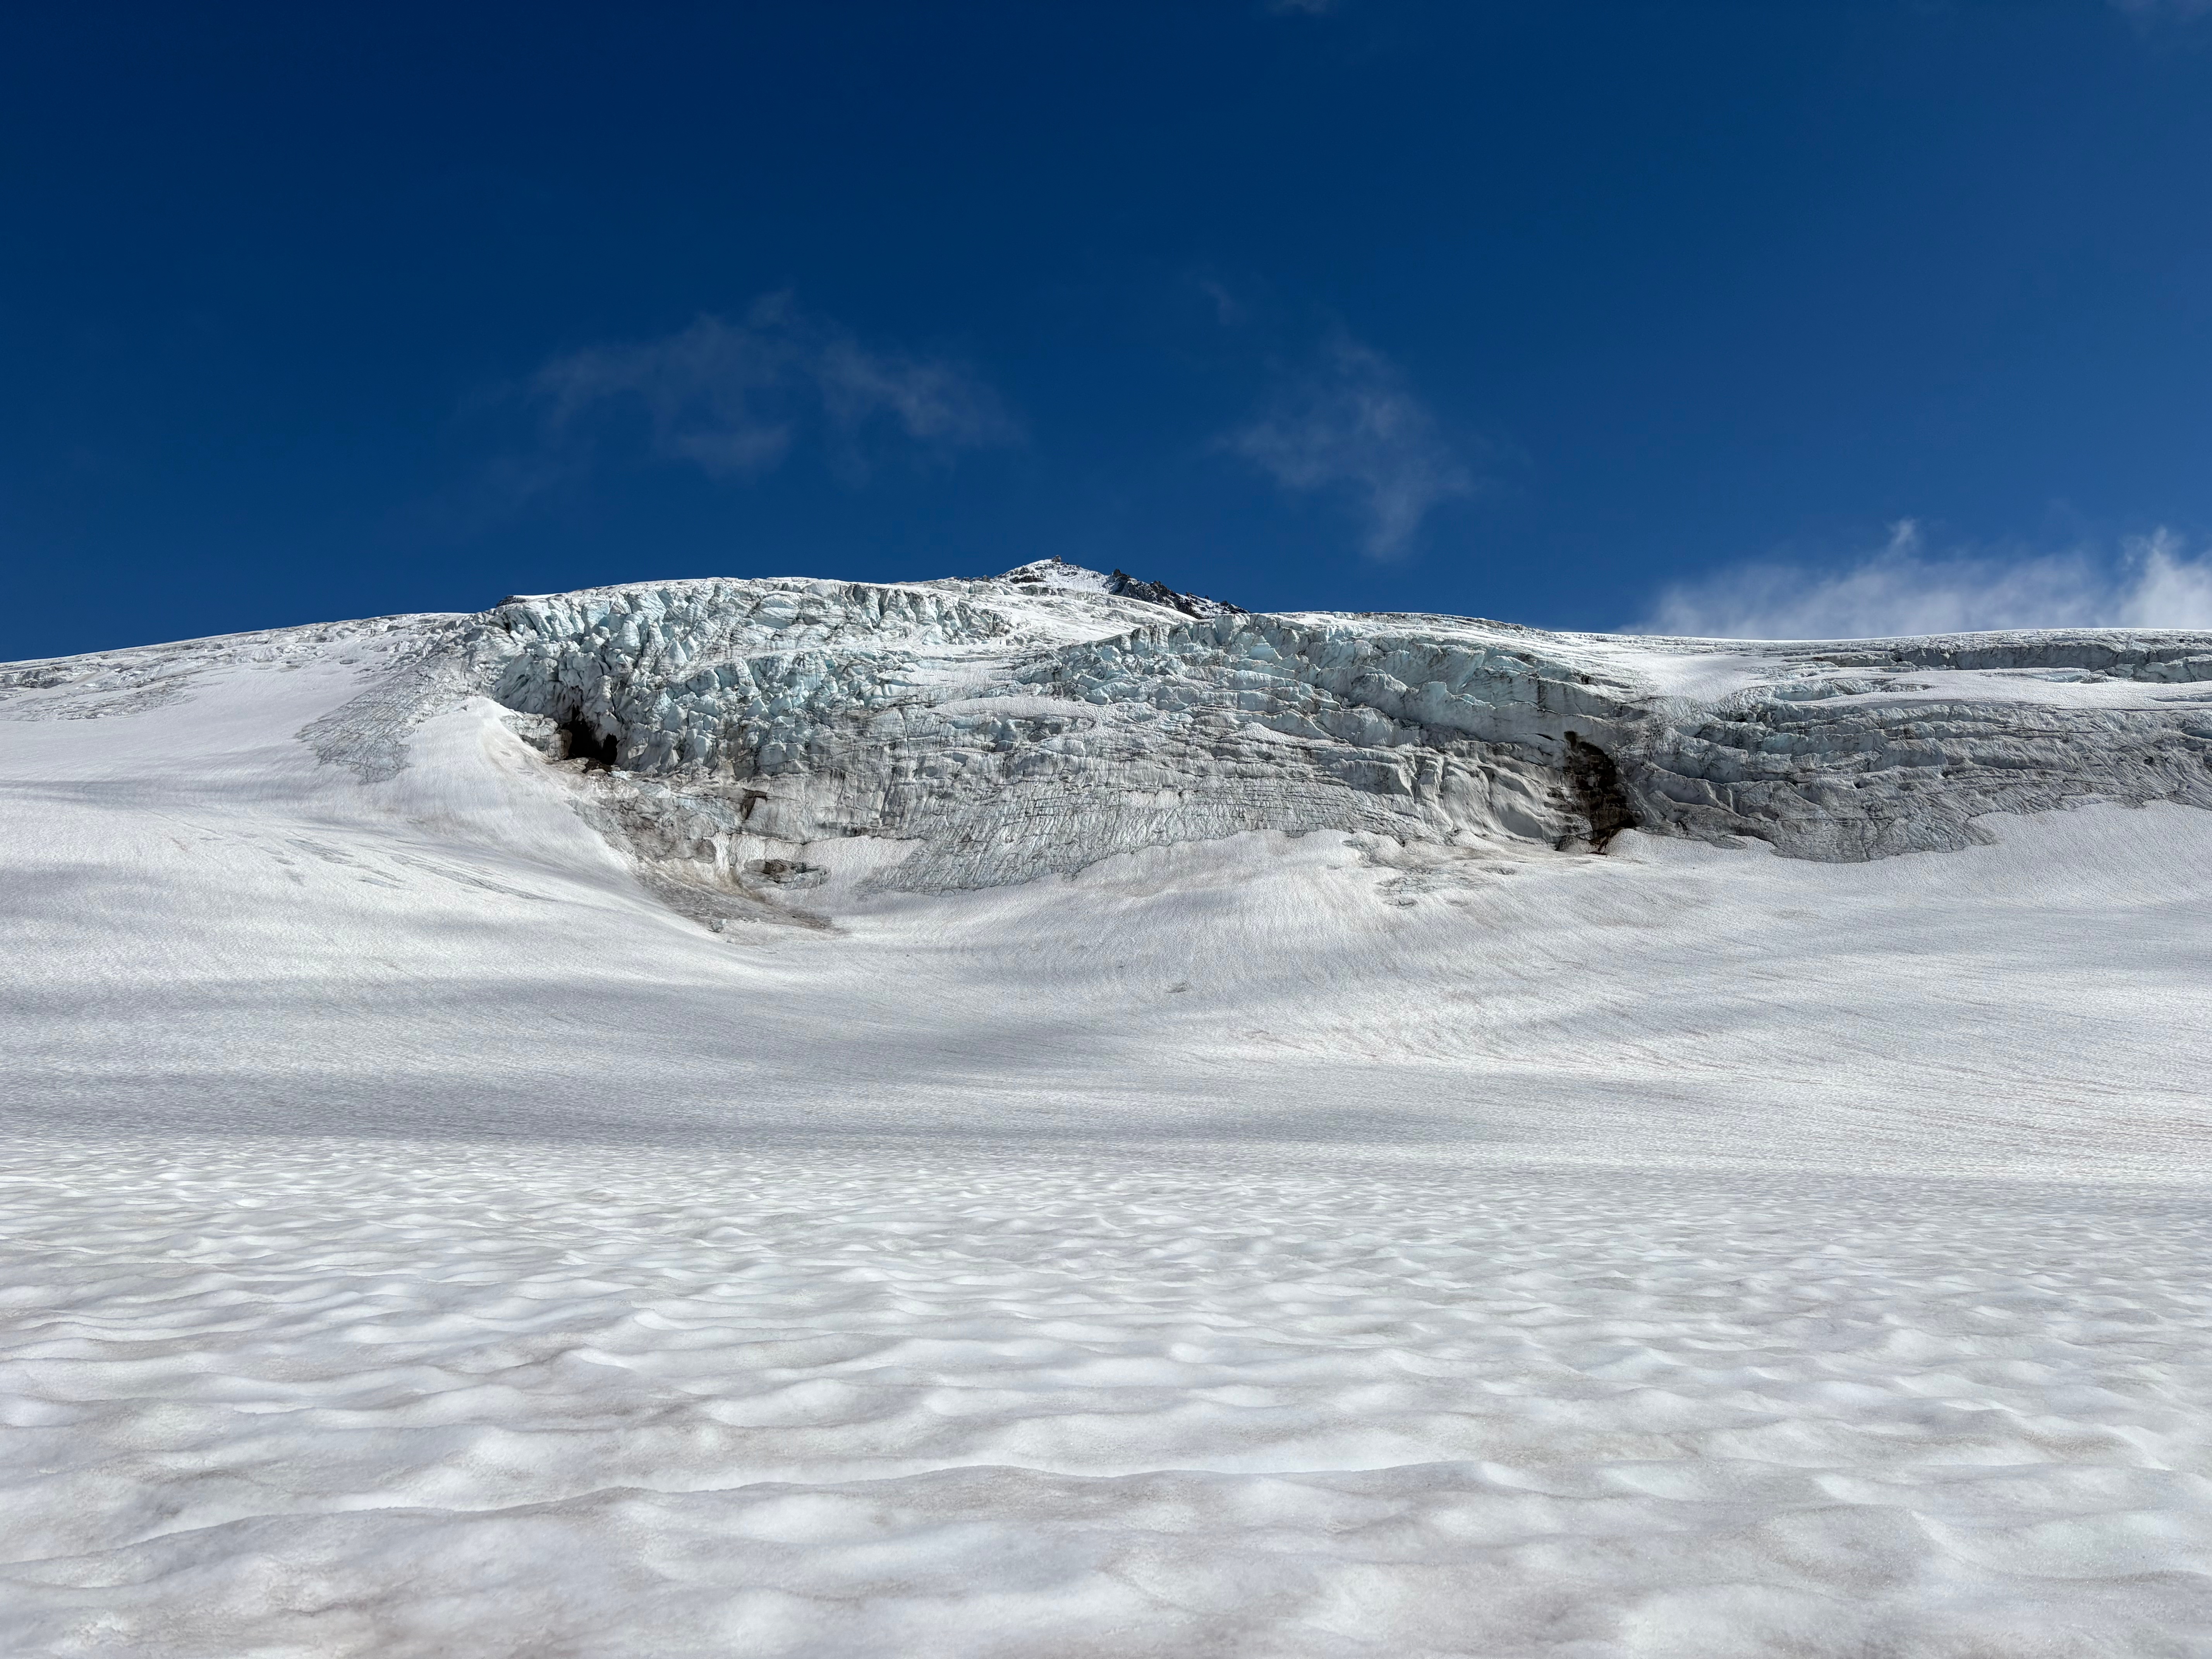
This photograph of an icefall at 2000 m (6700 ft) on the Easton glacier encompasses the wide range of emotions that I felt working on these glaciers this summer. The focal point of the picture is the wound inflicted upon the glacier by our changing climate. Bedrock and sediment creep through the gaping wound in the lowest icefall of the Easton, the opening visible for the first time in the project’s 42-year history. The place also holds a beauty, a sense of majesty that cannot be diminished by the tragic context of our work. The seracs at the top of the scene lean at impossible angles, destined to crash down onto the slope below, piercing the quiet of the snowy expanse in dramatic fashion. The dark annual layers in the glacier speak to the age of the ice, flowing down the flank of Mt. Baker over decades. The landscape has been a facet of my life for the past few years, as it falls upon the Easton Glacier route to the mountain’s summit. The icefall has always drawn me in as I pass, sparking a profound sense of wonder. It makes me deeply sad to see the beauty of such special places diminished, sad in a way that little else does. Over the past few years, I’ve come to like visiting these places to visiting an elderly loved one. While time may change them and even take them away from us, their beauty and meaning to me will hold true.-Emmett Elsom
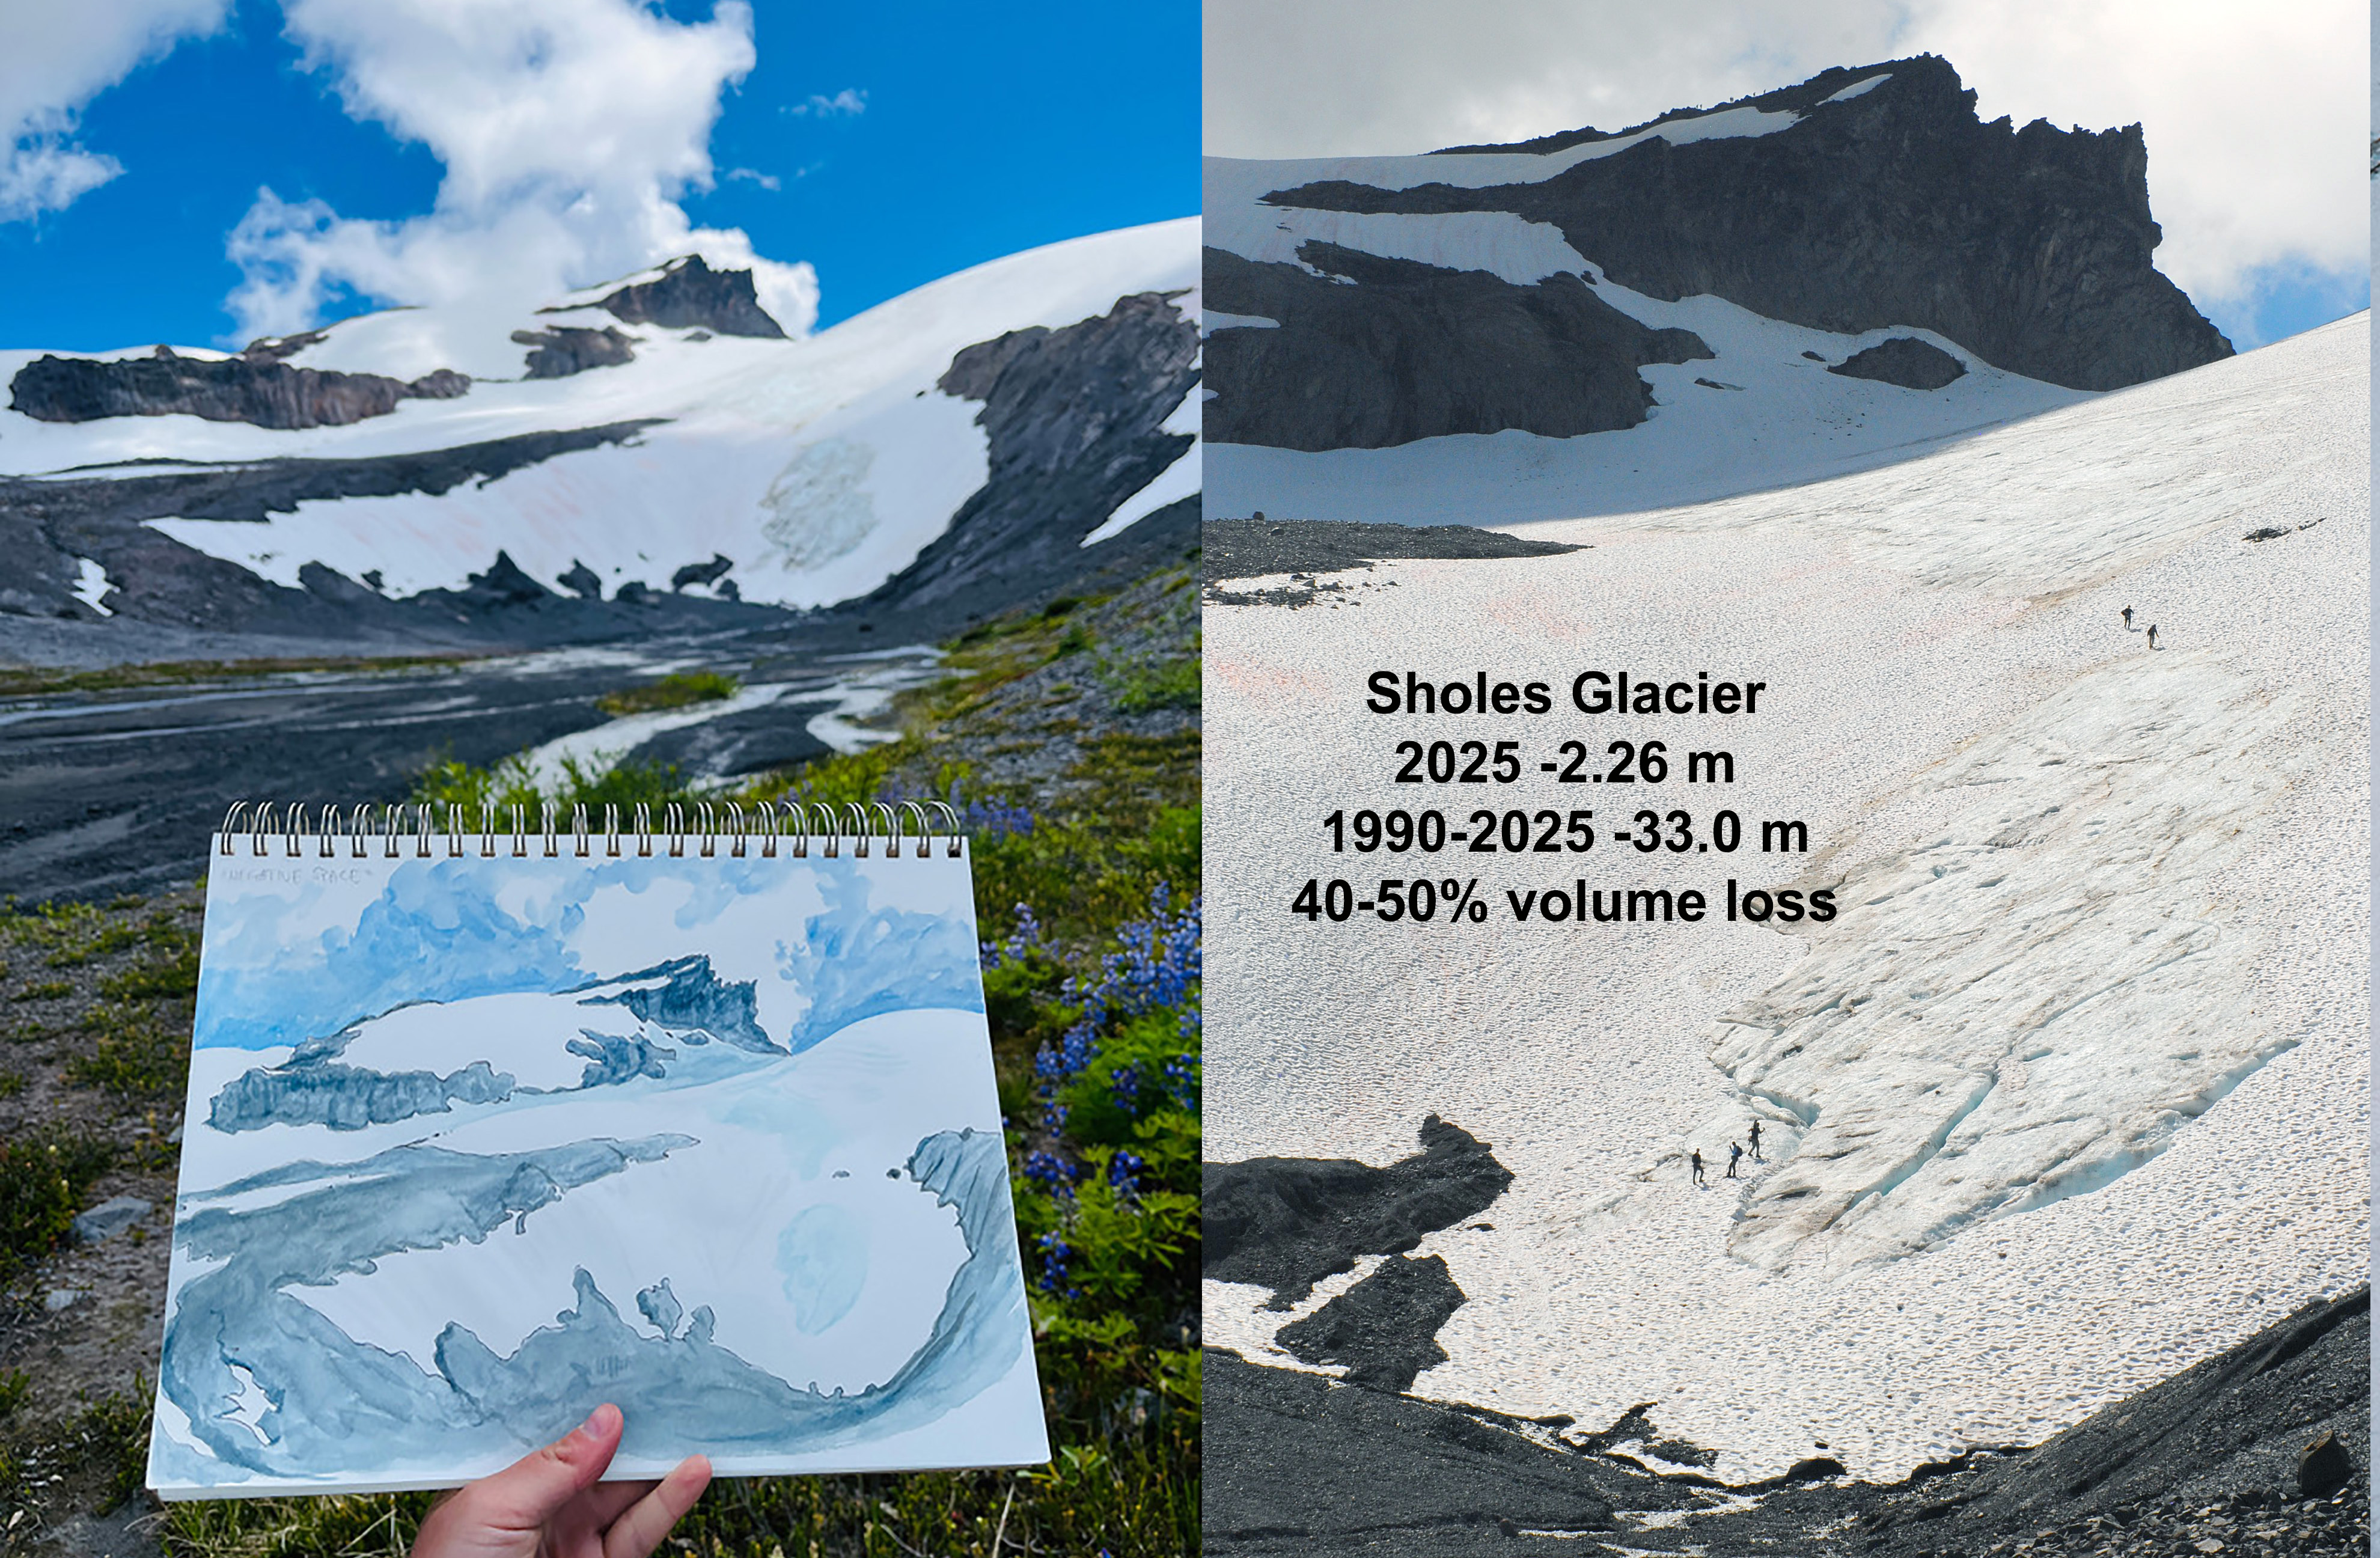
How does being present in a place shape our understanding? To the left is a view of Sholes Glacier, complete with my on-site rendition. I can’t express how lucky I feel to have had the chance to experience these places first hand. To interact with a place by attempting to capture its likeness — paying attention to the negative space not only between the white snowpack and black exposed rock, but in the empty, carved-out area that used to be filled with ice. Experiencing the texture of the glacier under your feet, the cool air drifting off the snow, the good tired feeling of your body after physically traversing top to bottom. This is what you don’t get from a photo. To know places such as these is to love them and see their role in the world, and want to protect them. But so many never get the chance to understand them this way.-Claire Seaman
This field season I focused on exploring the once-barren foreland a glacier leaves behind. Studying the plants growing in the wake of the Easton Glacier made me reflect on the way life responds to these major changes. This photo of a bright monkeyflower cluster in the streambed of the nearby Sholes Glacier exemplifies this resilience and optimism to me. The Sholes, in the background, drains a lifeblood that will feed the watershed downstream into the Nooksack, supporting people, fisheries, and a whole riparian ecosystem. The eventual loss of glacial ice feeding the river will be catastrophic, yet the scarred space left behind will blossom with vegetation. Witnessing firsthand how staggering the extent of glacial retreat is can be overwhelming, but that bright patch of flowers stands as encouragement. Alone in an altered landscape, those flowers will pave the way for more to follow. Change is nuanced, and as we watch it occur we can change, sharing stories of the beauty of this environment supported by ice, and adapting our lives and policies in a way that can be the difference which keeps glaciers flowing.-Katie Hovind
As a backcountry skier and oil painter focused on winter landscapes of the North Cascades, the idea of painting glaciers in the field was a dream come true! I knew what we would see and learn about the health of our glaciers from the scientists would be highly emotional, but the power of these environments disappearing in our lifetimes is something my words fail to communicate how devastating that feels. During the study on Rainbow glacier I caught on film the moment a serac collapsed, loudly crashing, crumbling from a newly melted out rock knob down the mountain splitting into smaller and smaller pieces. It looked sickly as it broke before our eyes. Another unique experience was going into a teal, translucent, otherworldly ice cave. I have started 2 paintings to capture this vanishing environment. My goal is to assist the project in translating the study’s findings through landscape paintings that communicate the beauty of these places with titles that call attention to the retreating glaciers in the North Cascades. We all have a responsibility as humans to make individual changes to combat climate change and vote like fresh water and air depends on it, because it does. -Margaret Kingston
The pace of glacier change struck me hard this summer. Never before have humans lived with such a deglaciated Cascades mountain range. Not the settlers, not the fur trappers, not the first people who have been here for 13,000 years or more. Cultures and ecosystems spawned from the retreating edge of the Cordilleran Ice sheet into the Puget Sound area. Alpine glaciers fed streams, rivers, salmon, all kinds of human projects in Washington State. Our societies are shaped by the ice and now we are experiencing glaciers disappear.
I write this at the end of the 2025 hydrological year, waiting for winter snow to shelter the land I love in a cool white blanket. The devastation of the alpine glaciers has surfaced so frequently in conversation these last couple months. Those who have seen the mountains are alarmed as beds of ice they once knew to be hundreds of feet thick look shallow and frail, ice pitches that were once climbed are now grey gullies of rock, and volcanoes which have always been white are unnervingly gray and shrouded in smoke. The realities of climate change in the Northwest are clear.
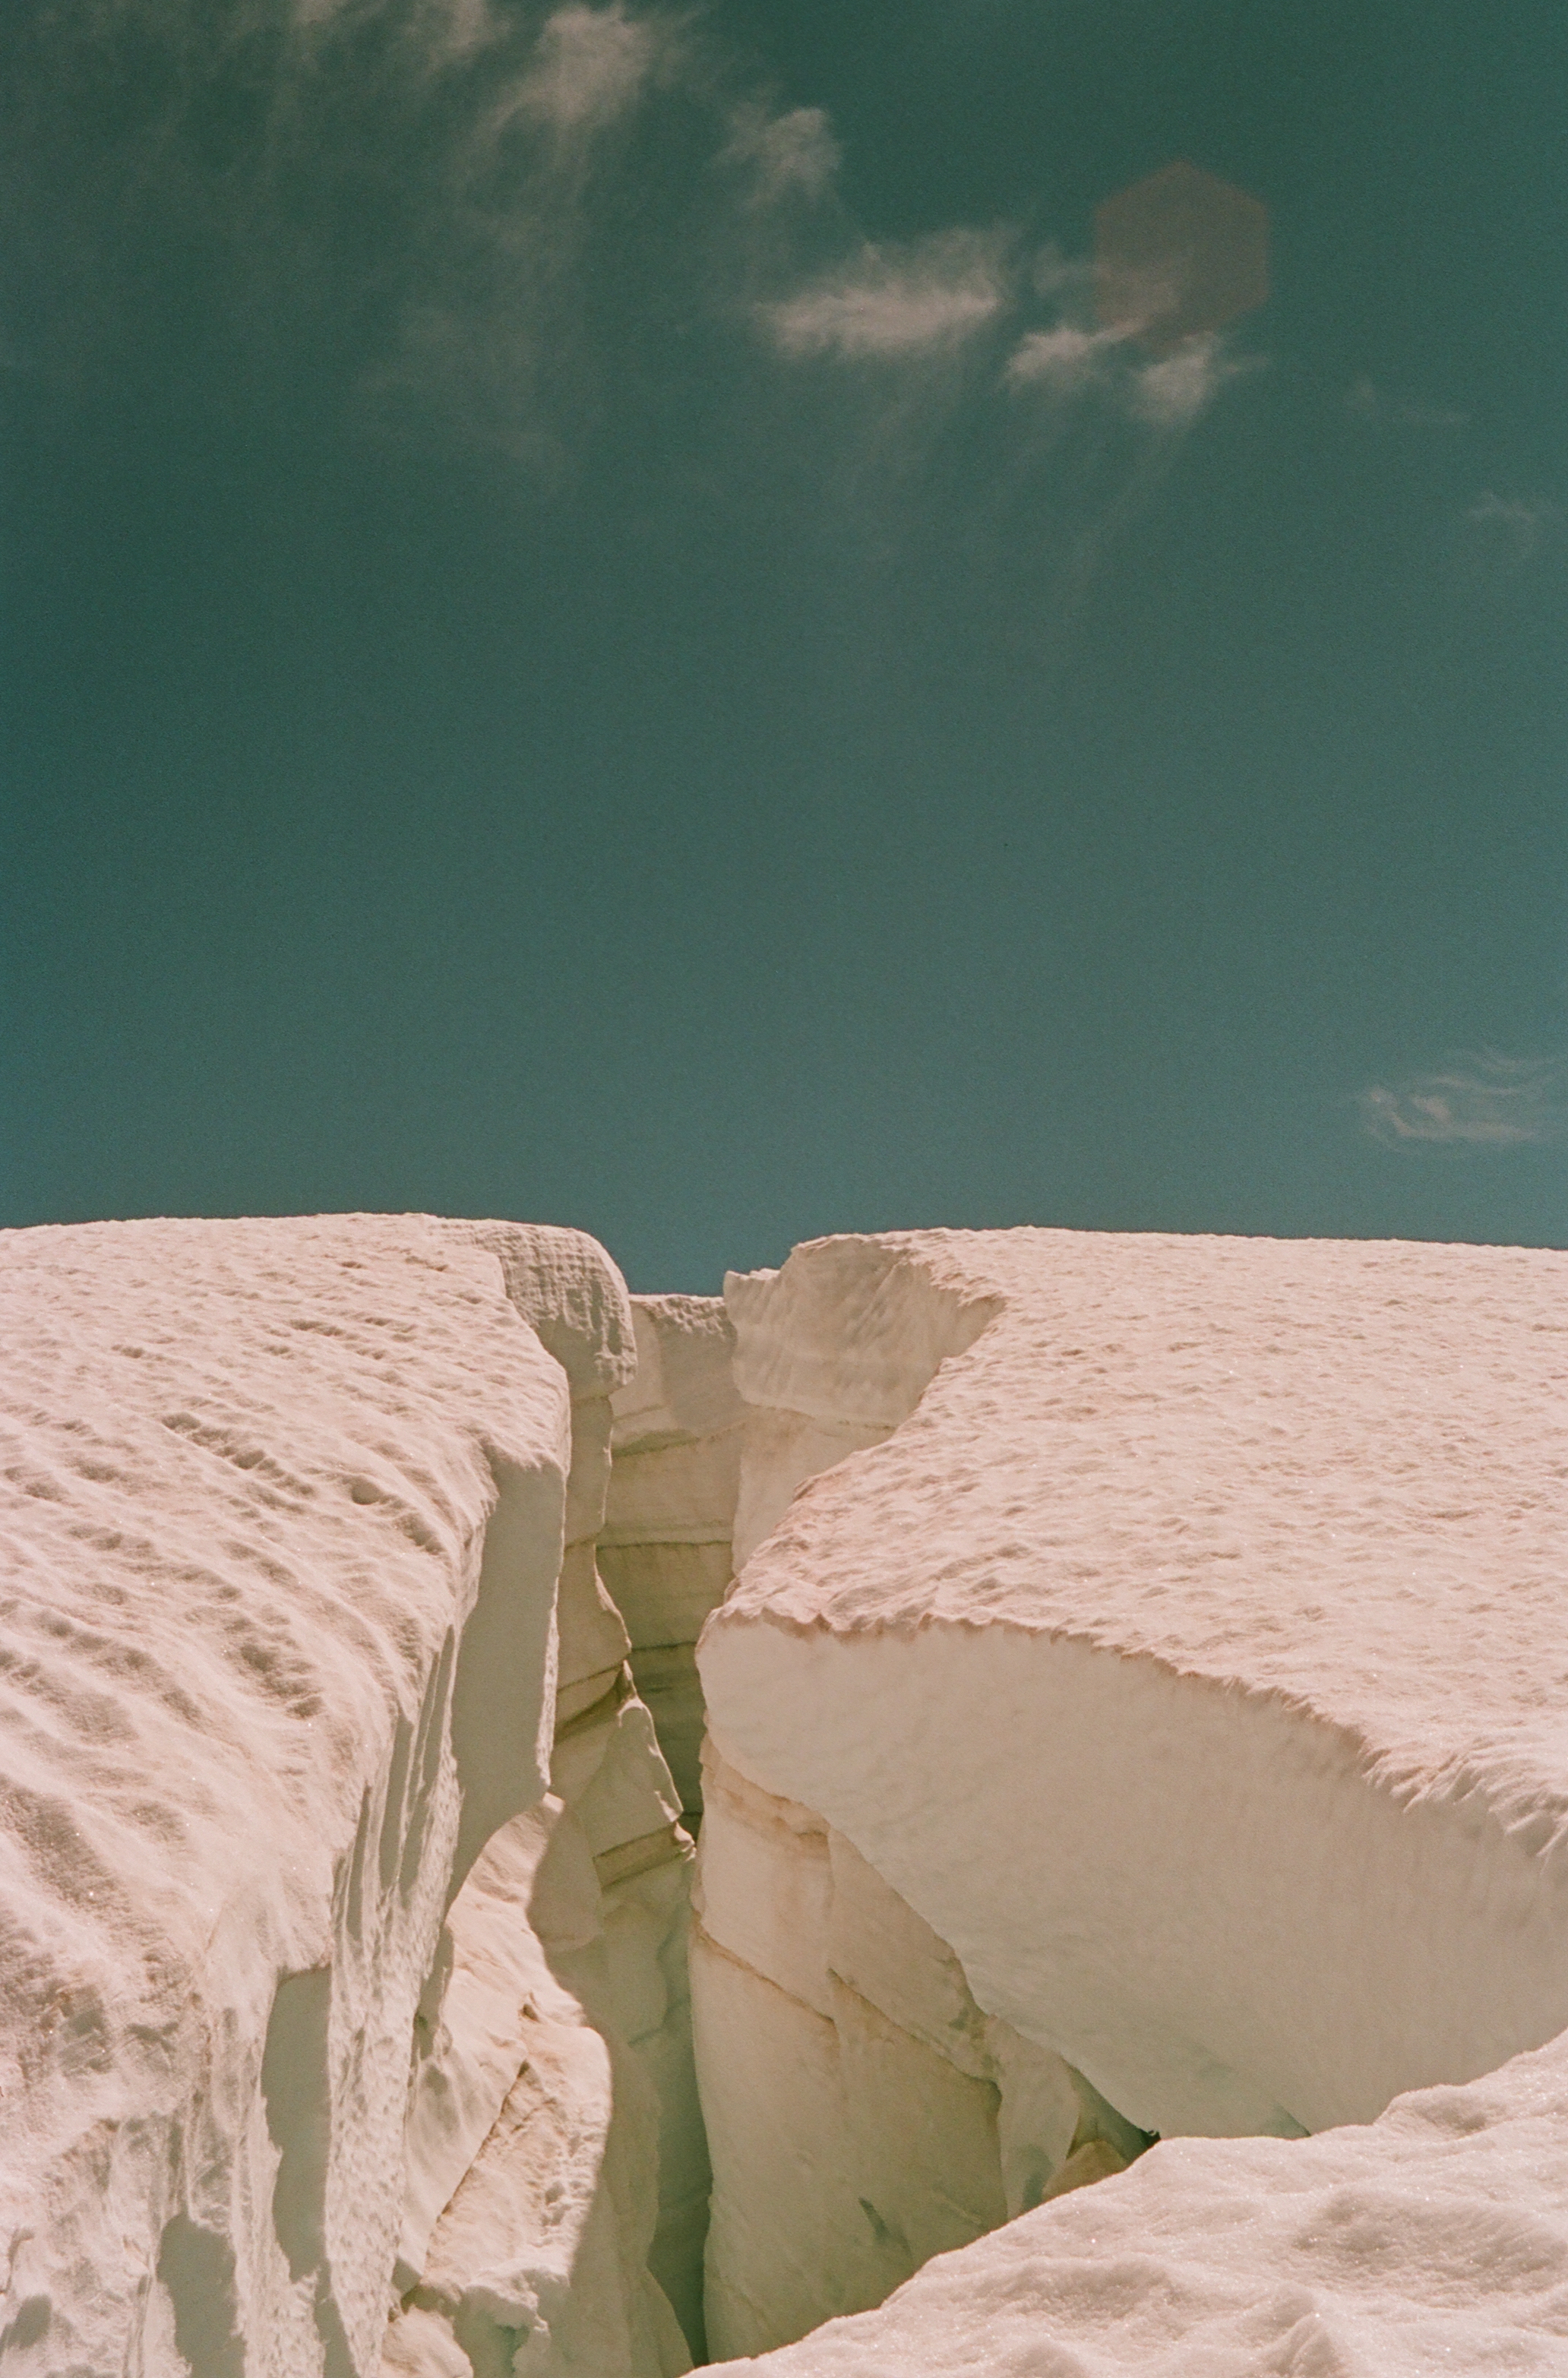
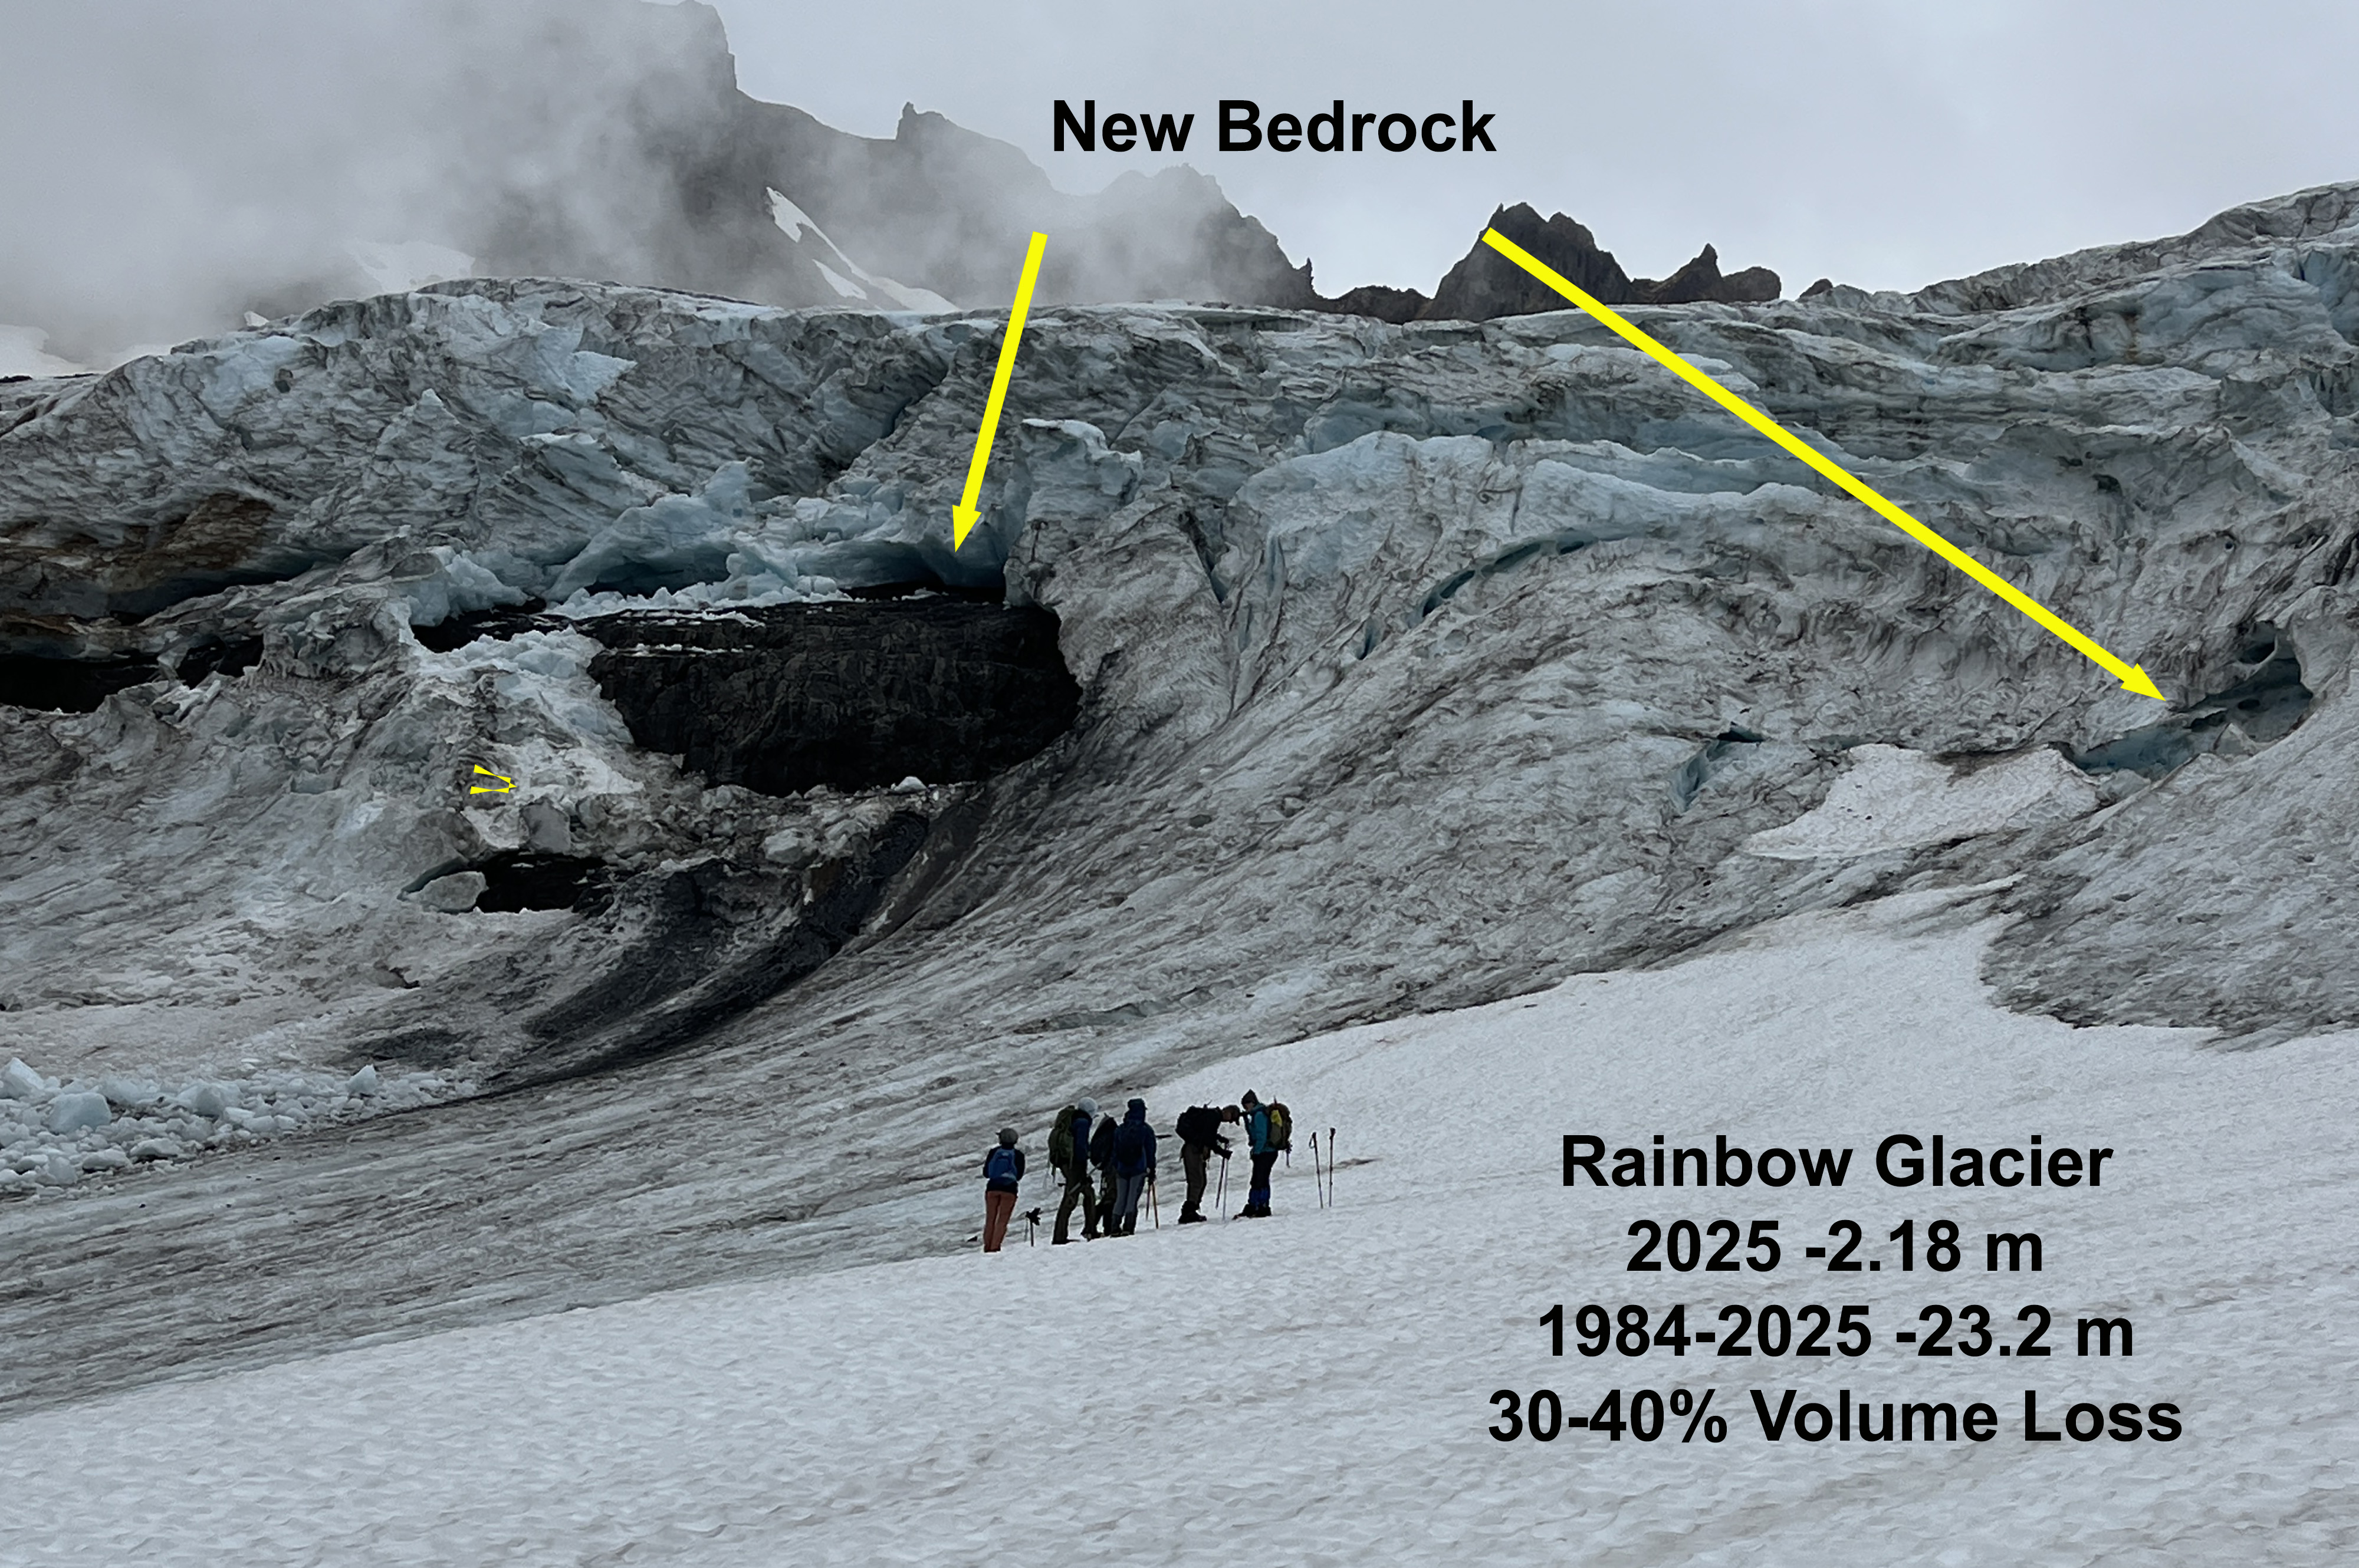
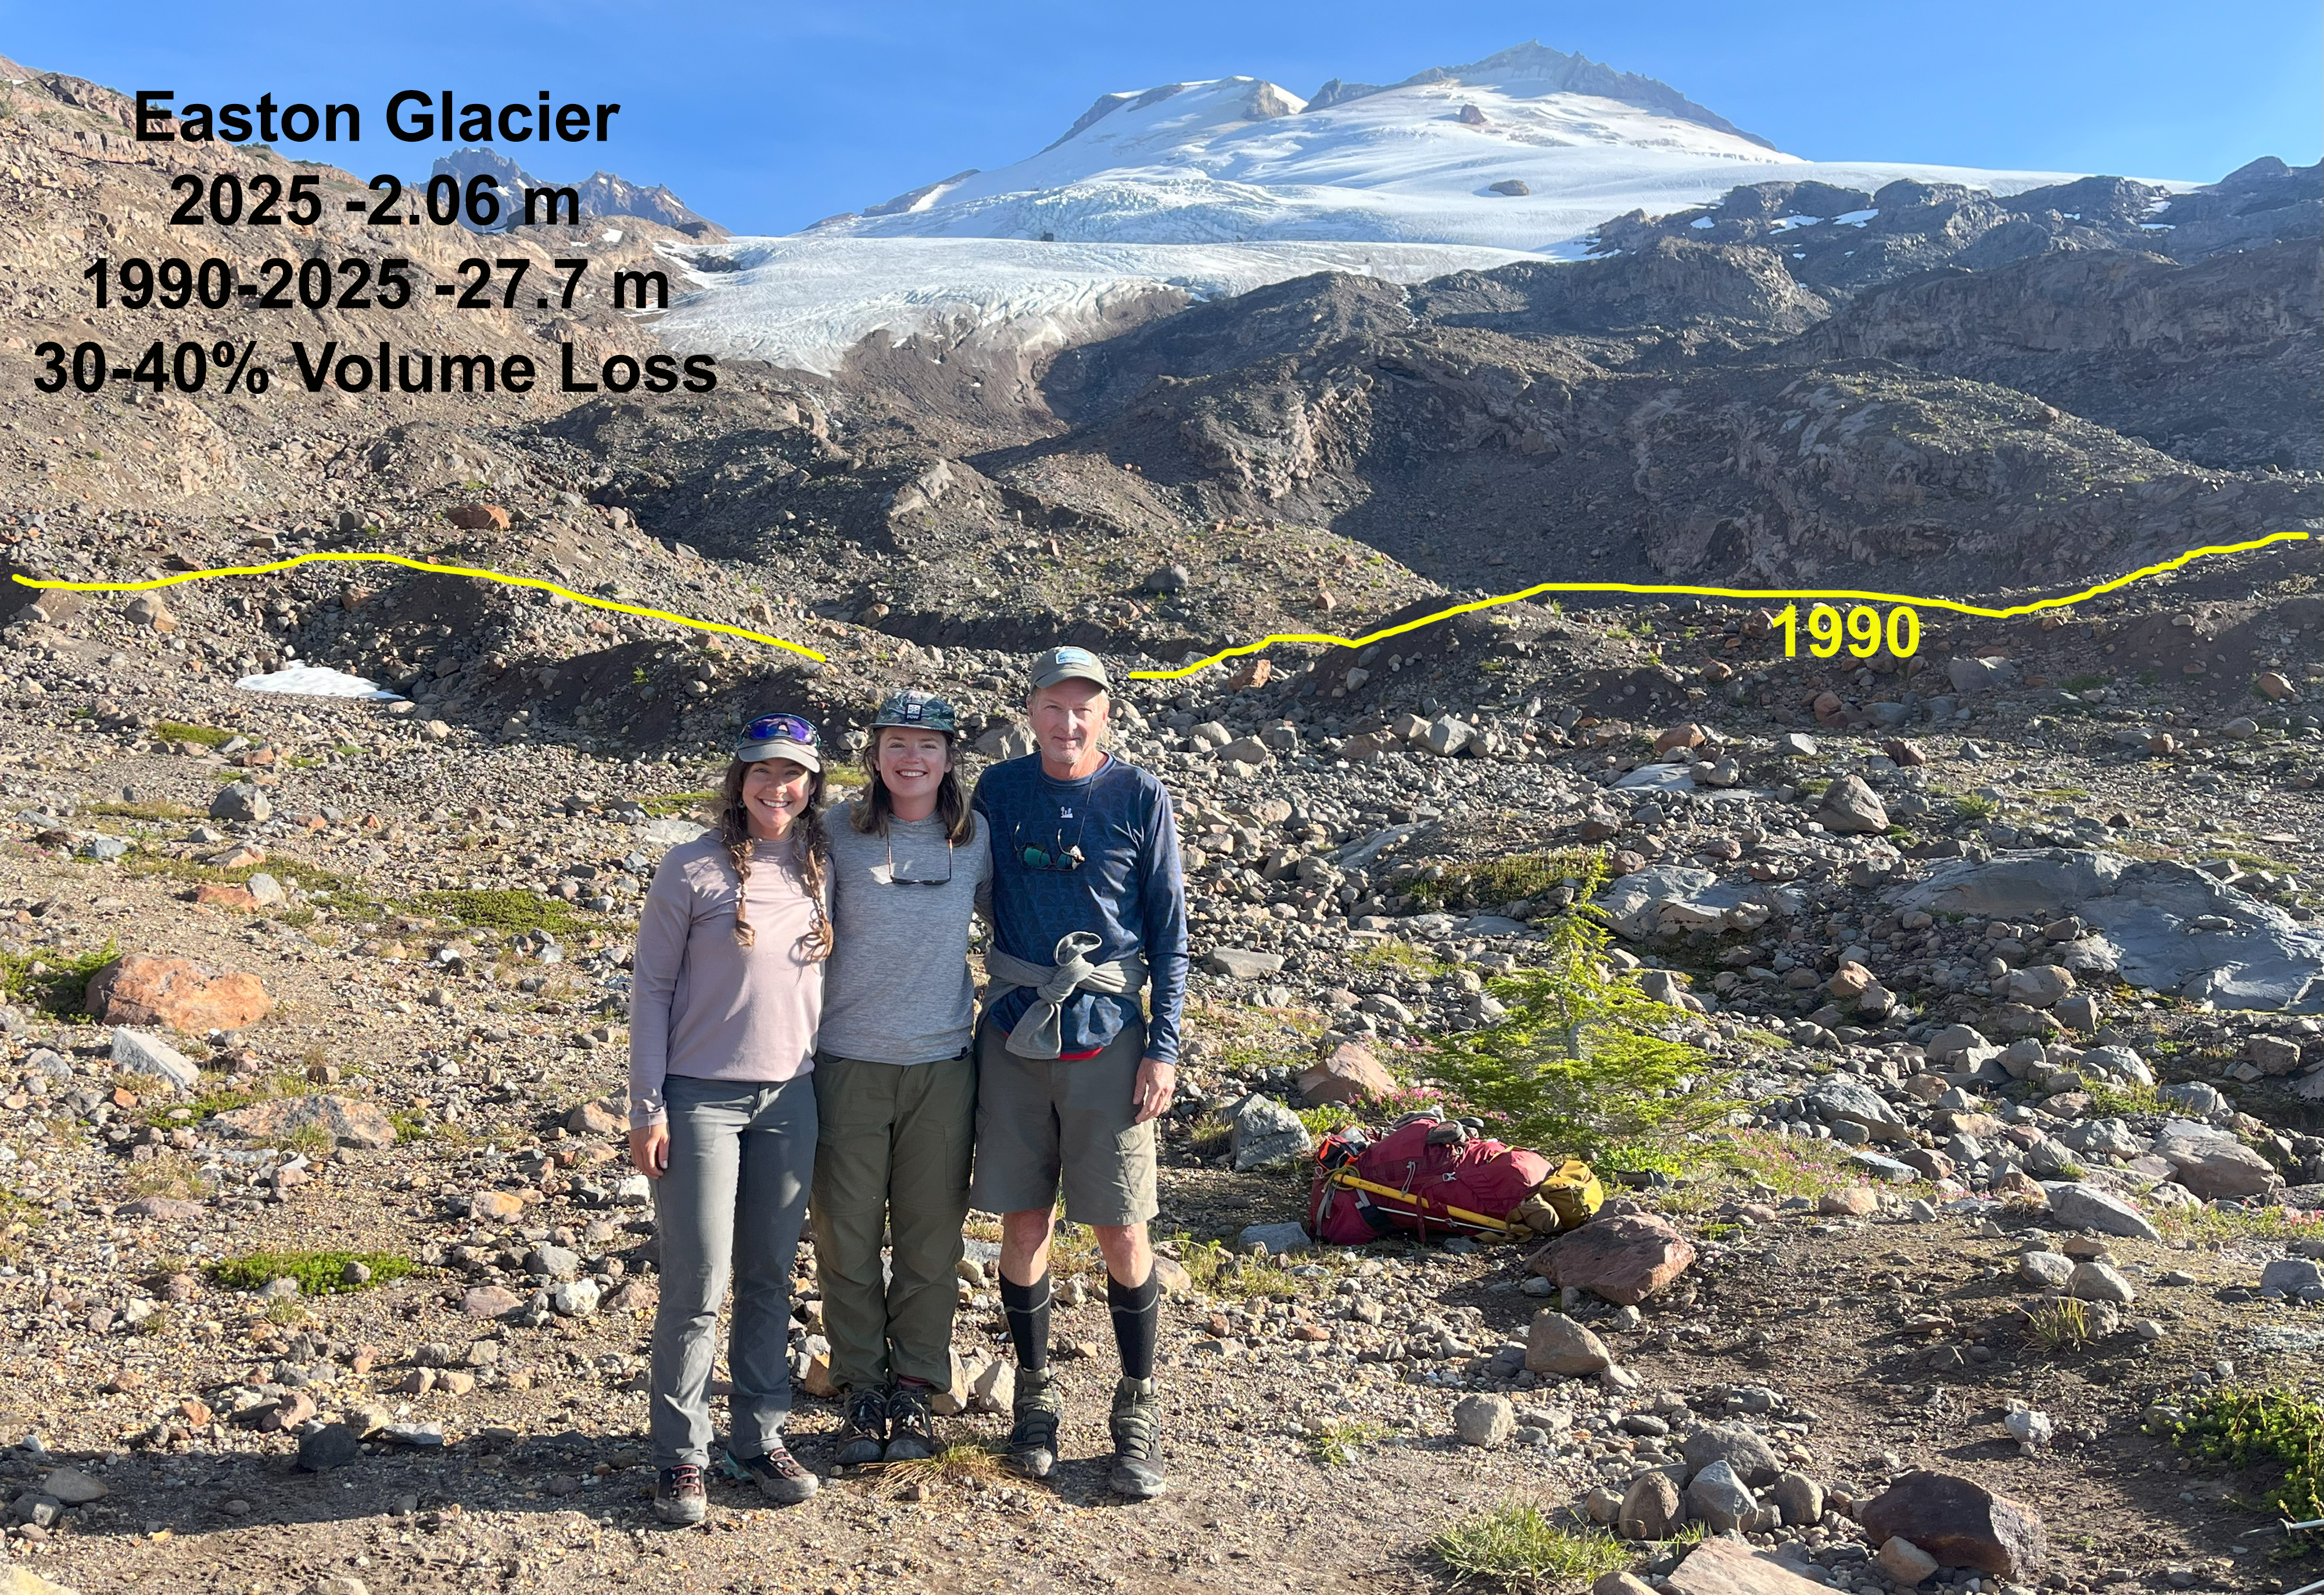
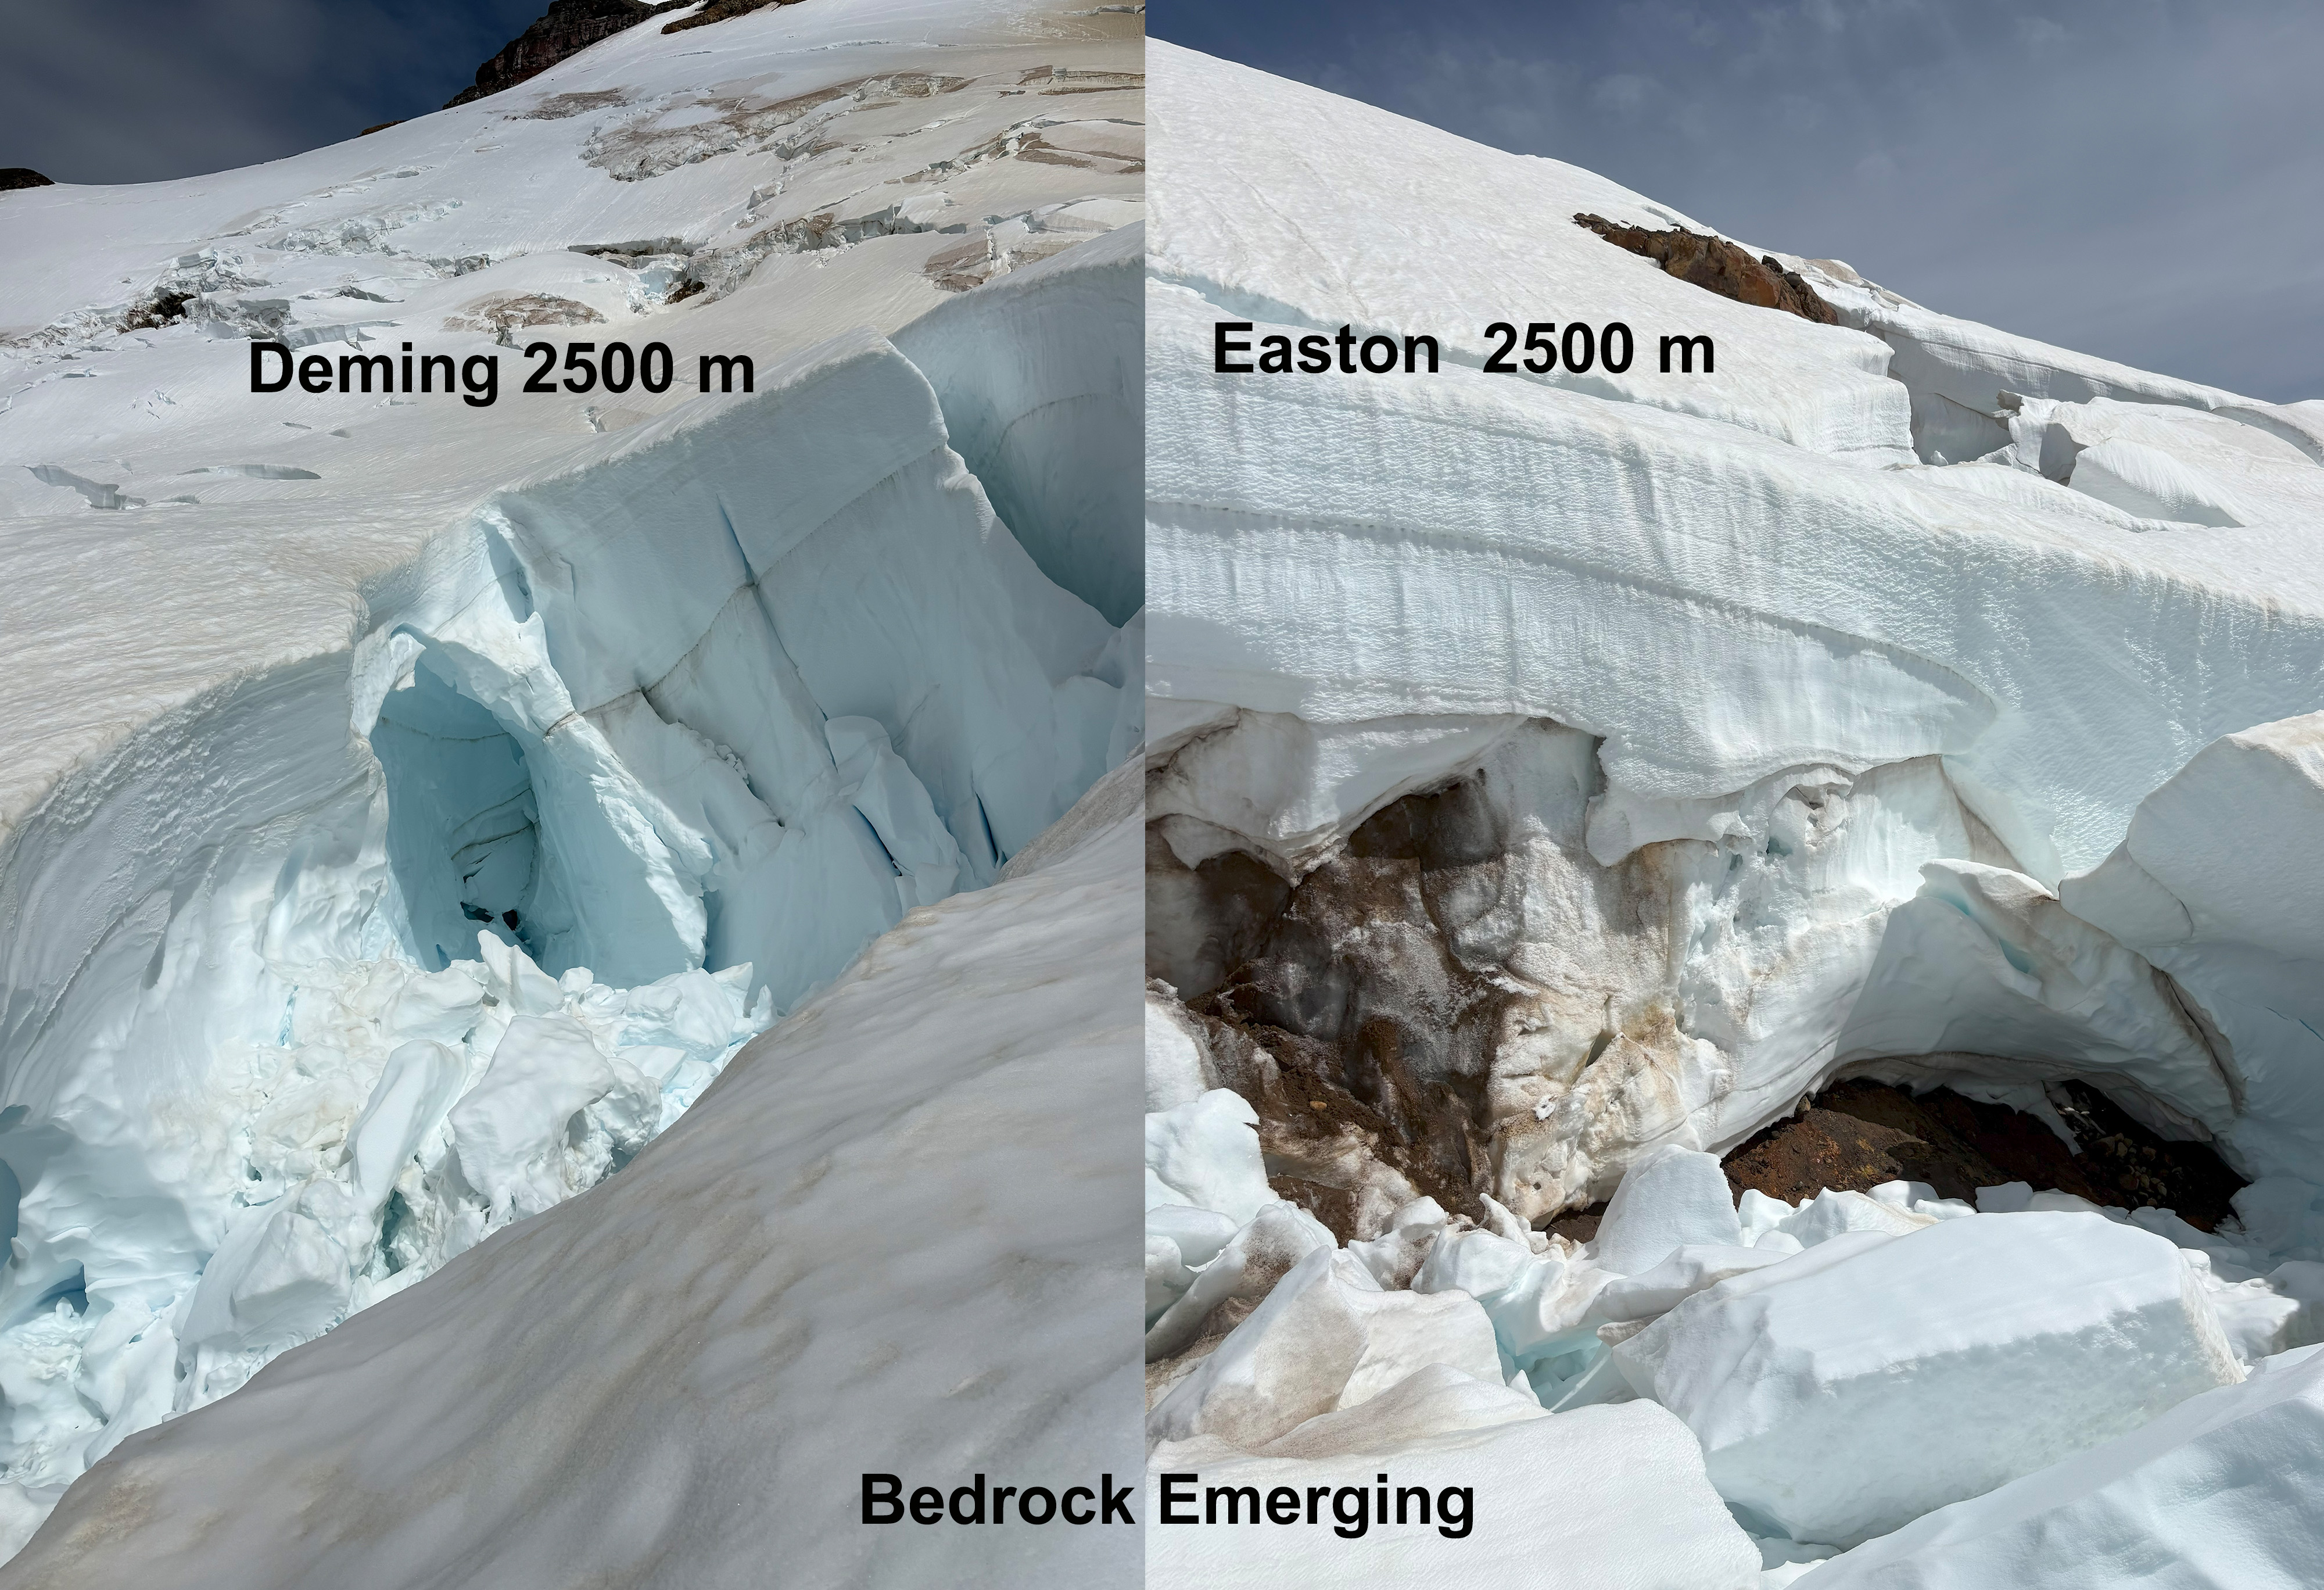
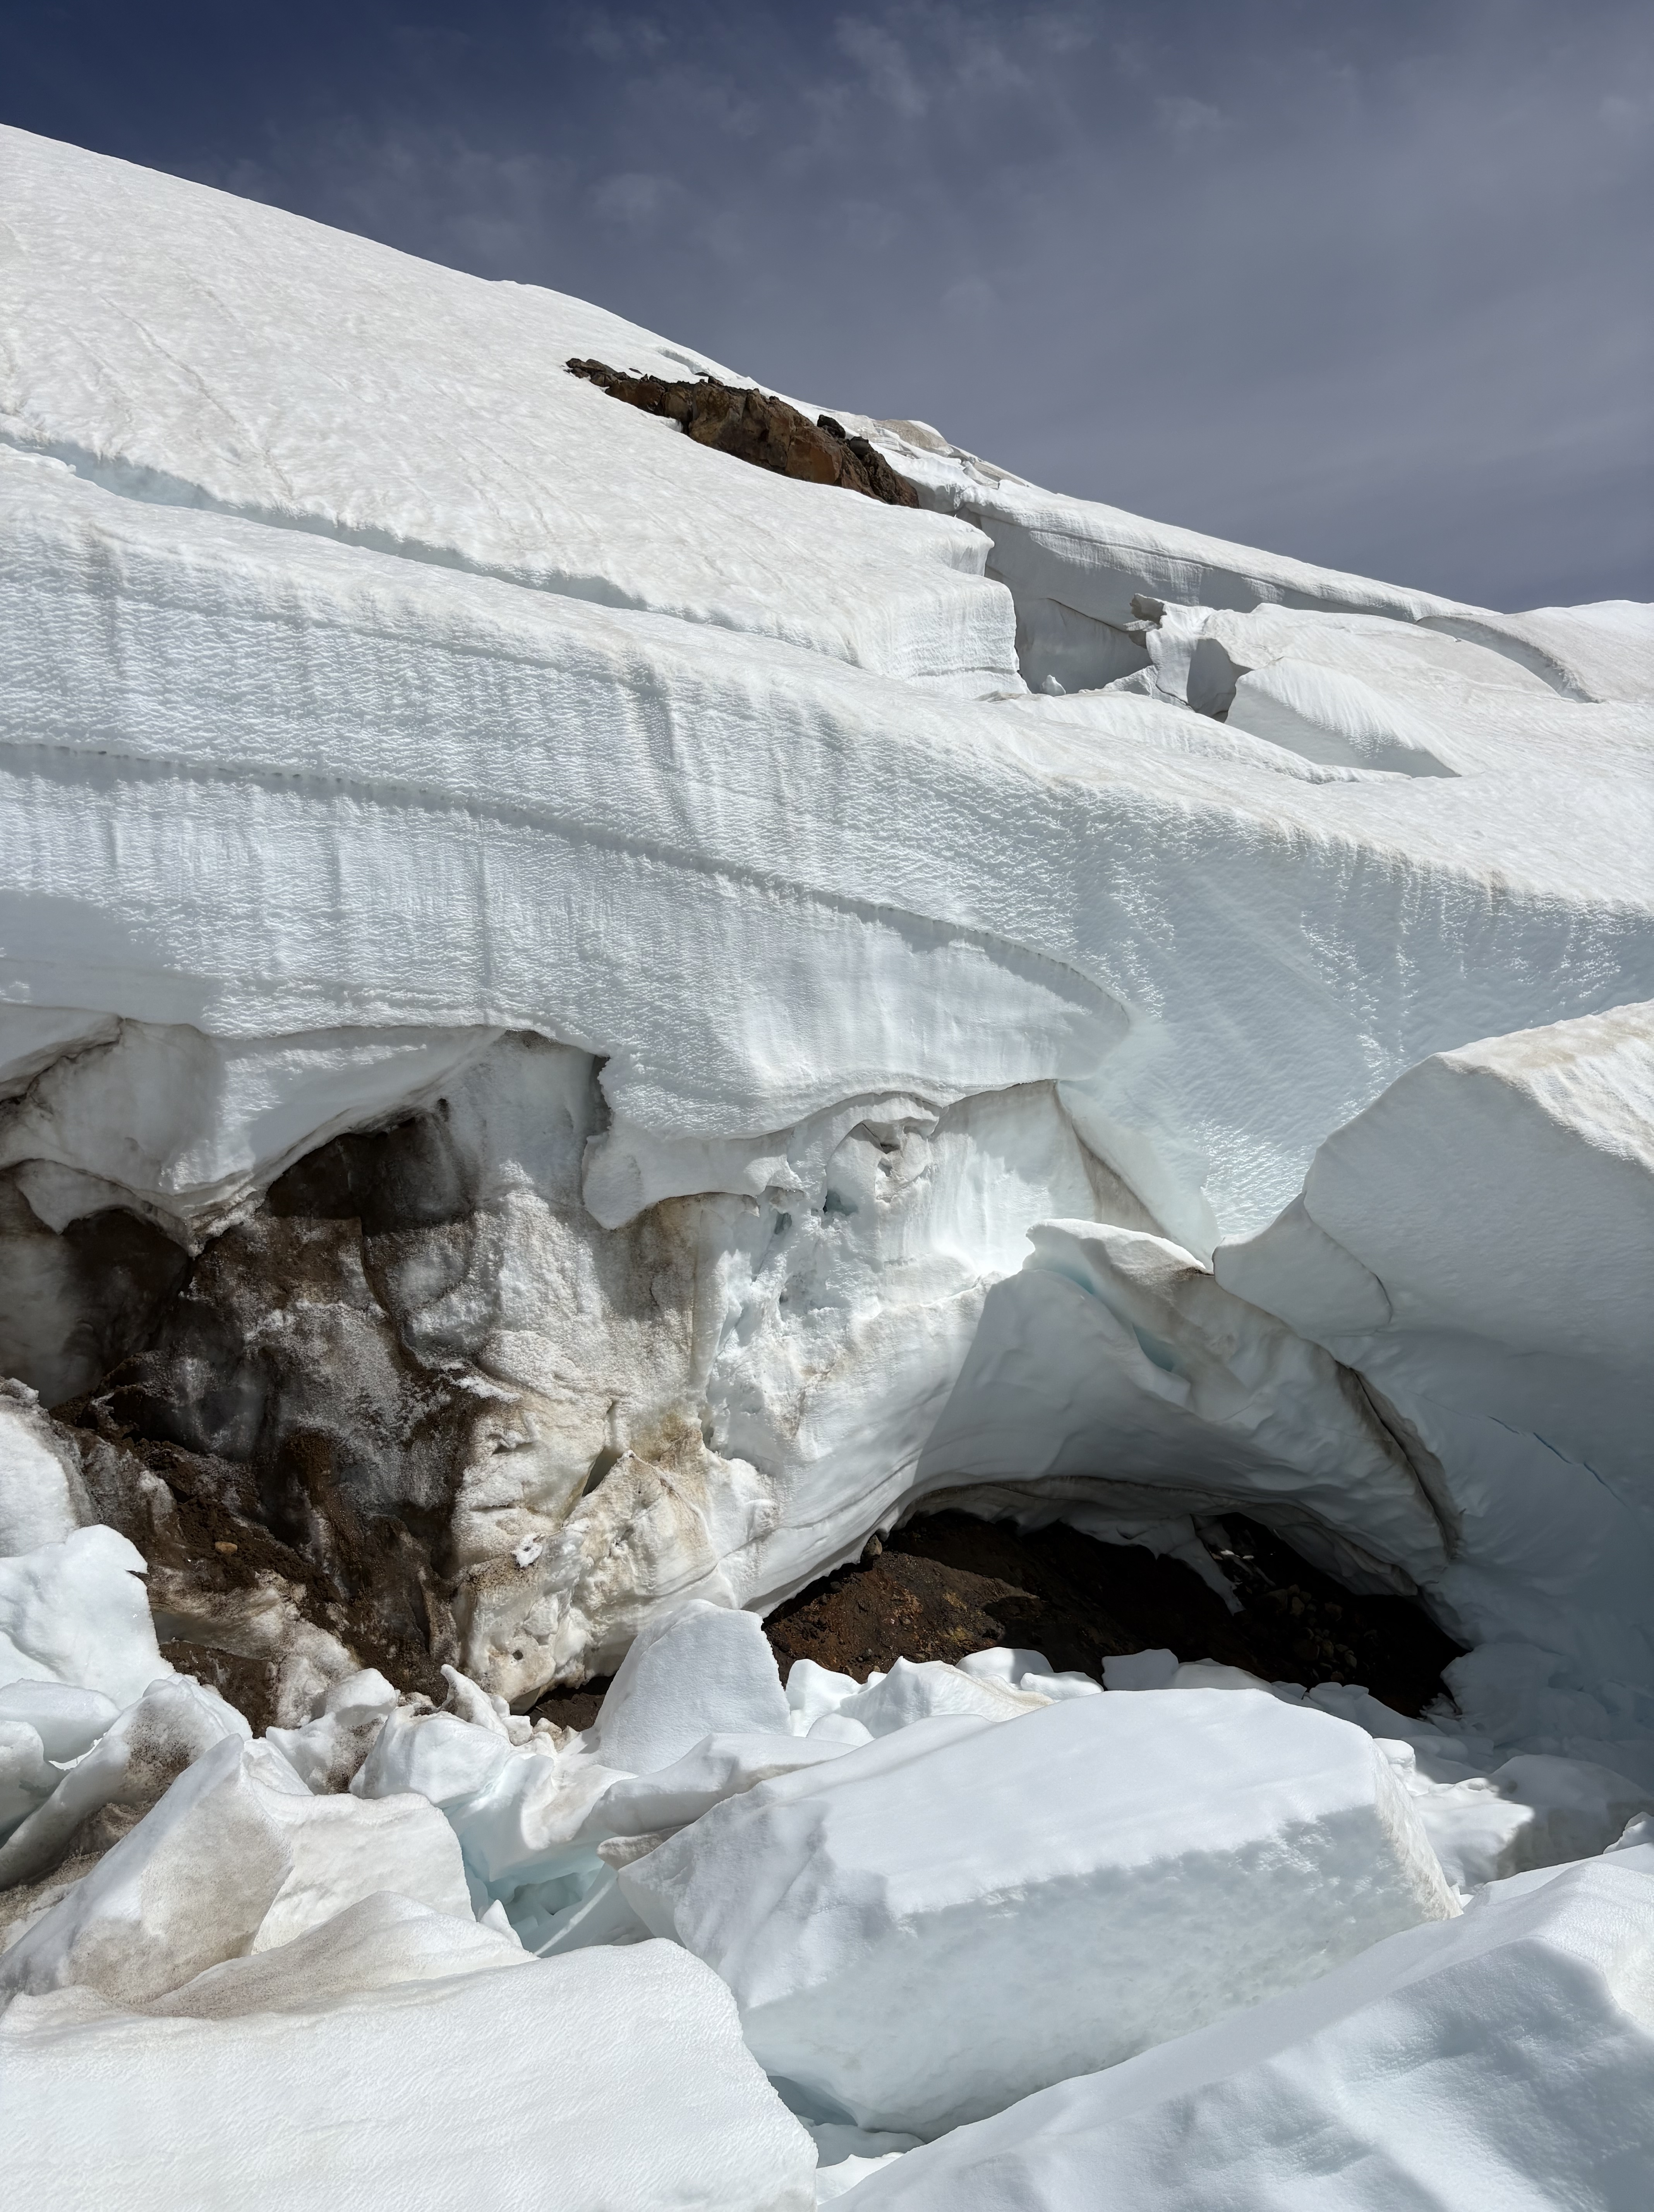
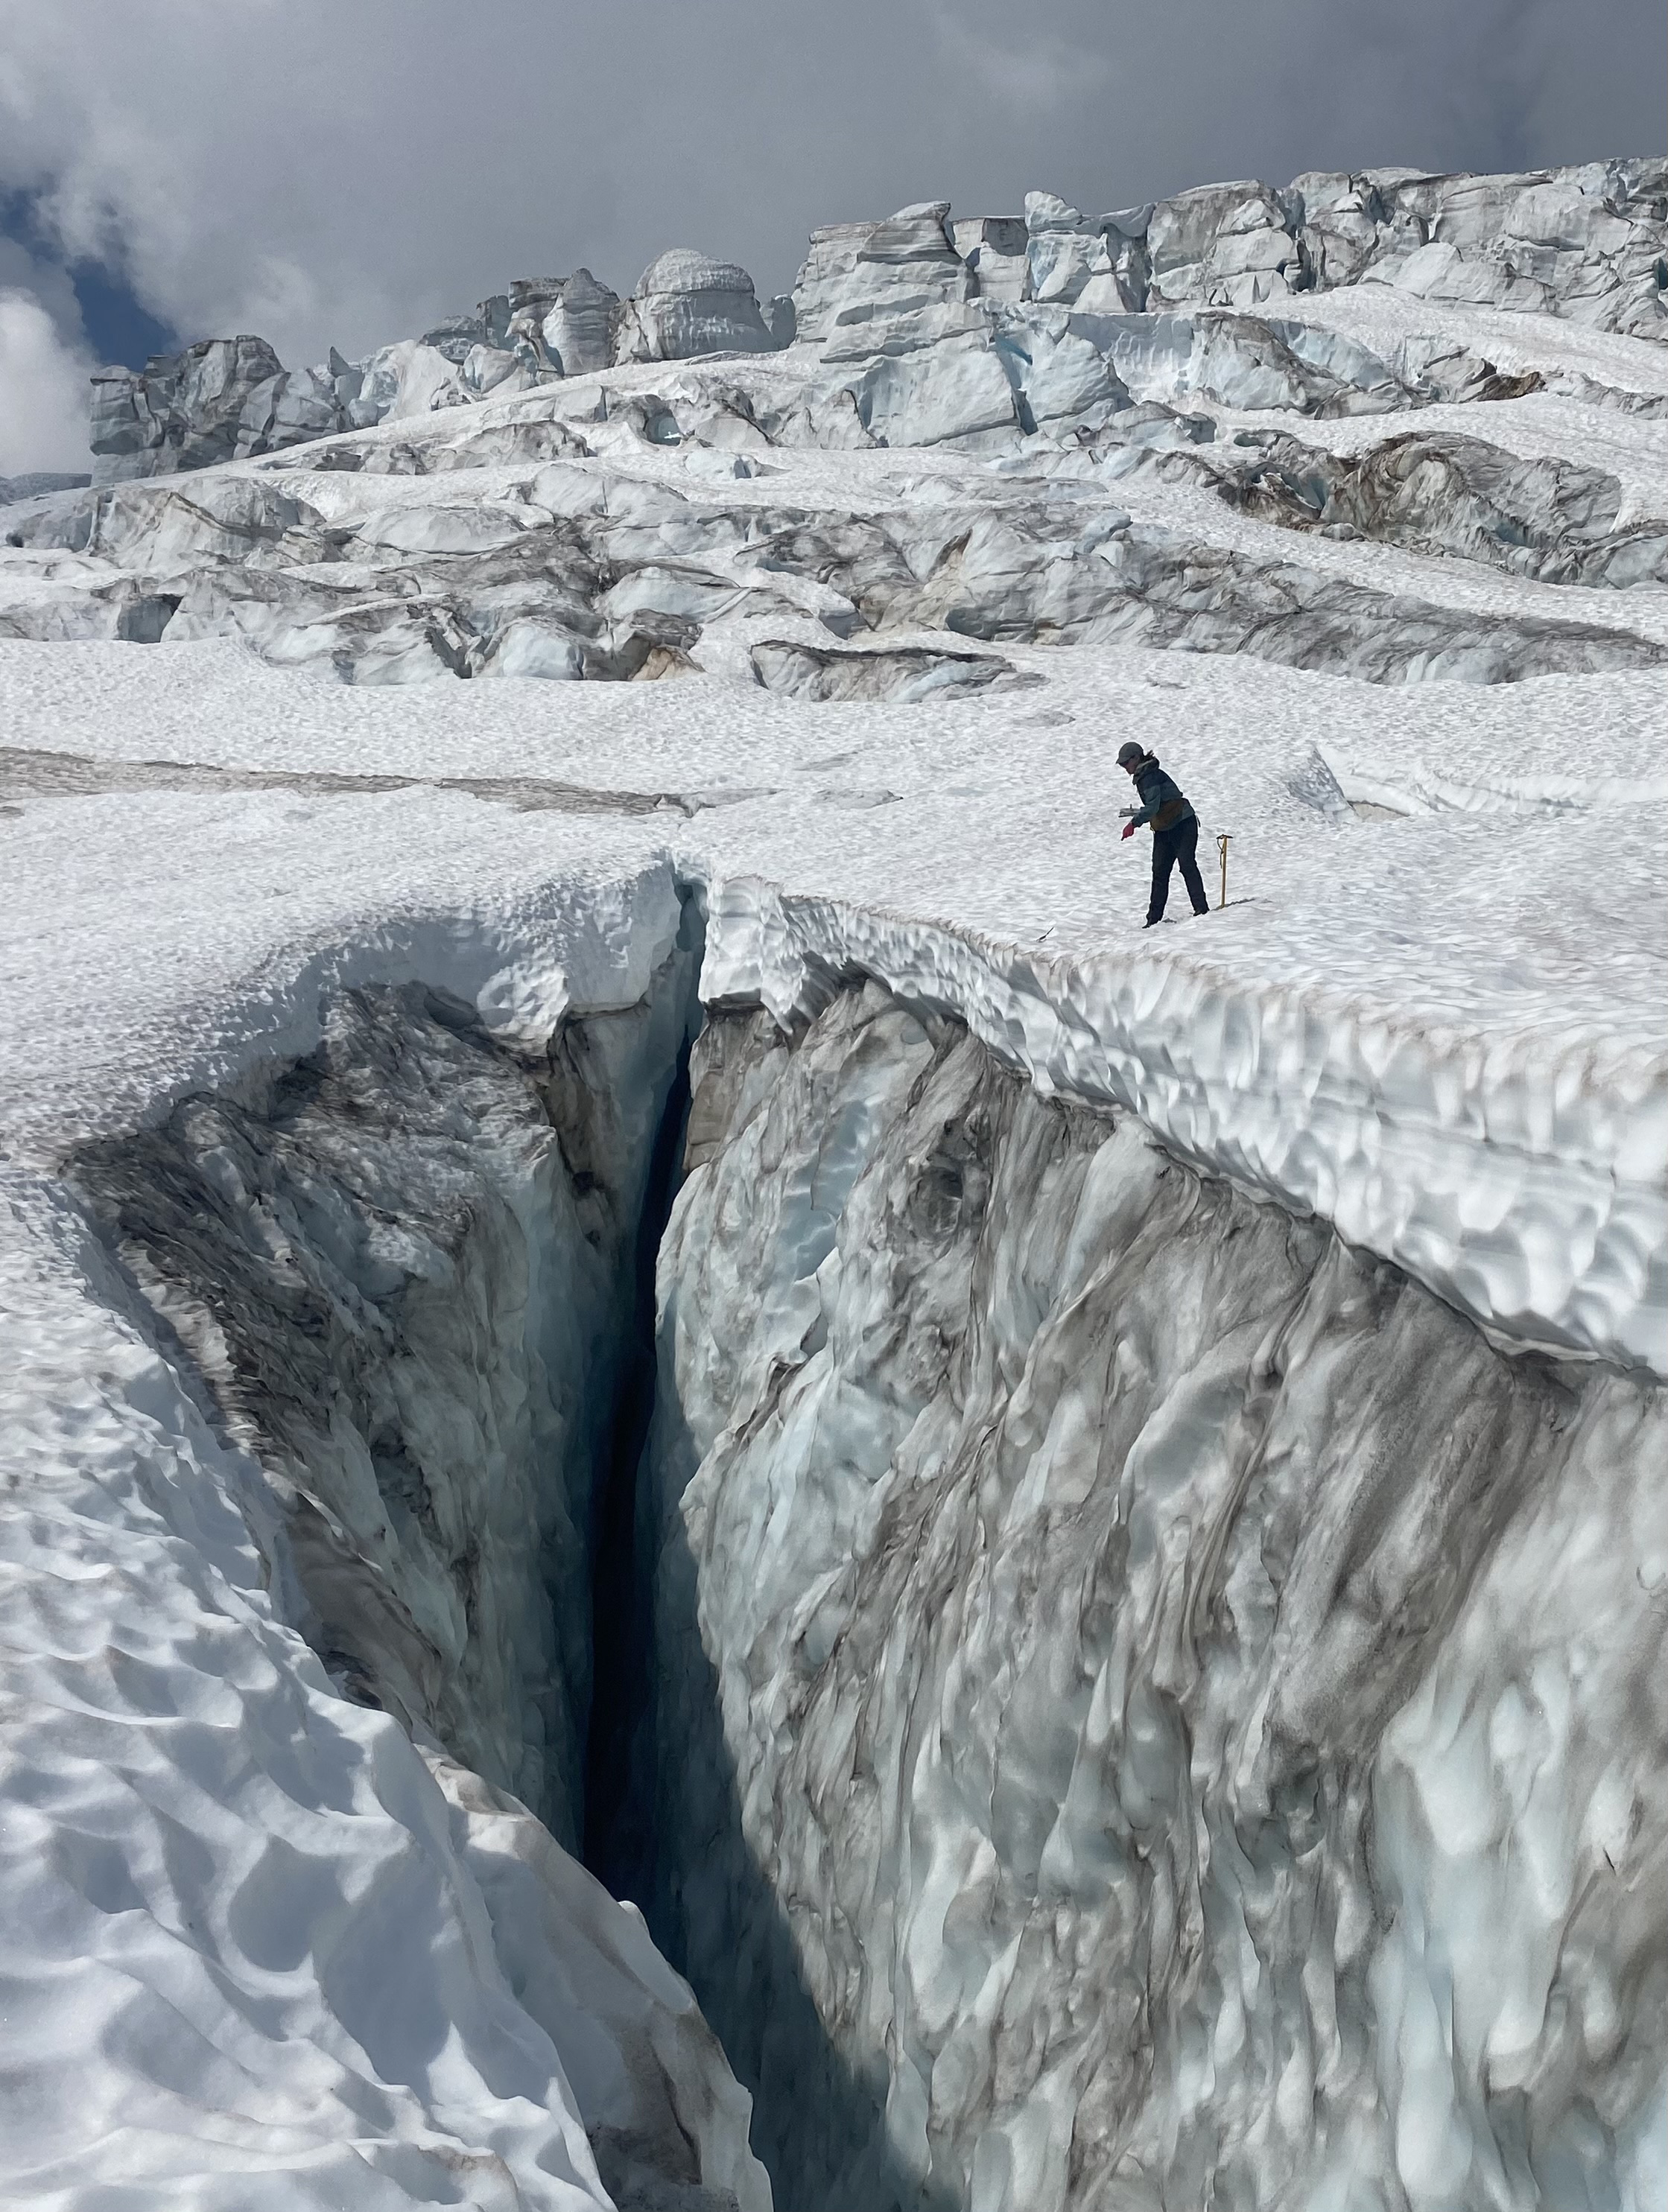
It is a painful time to care about the glaciers of the Cascades. Witnessing the erosion of something so much older and bigger and impactful than myself is staggering. There is much action to be done in this new terrain but for now, I come back to this: I sit in the dying glaciers warm light as the sun rises, summon the deepest snowfall in years and tell the glacier that we care, that we were grateful for all the help watering our food and feeding our oceans and making sure our salmon had somewhere to live. We are here because of you. -Cal WaichlerImage description: This image shows a crevasse on the Easton Glacier of Mount Baker. The saturation is distorted because I shot this photo on 35mm and pre-exposed the film to light and heat to parallel the material effects of global warming on our glacier systems. The Easton glacier is a source of water for Baker Lake, which provides recreation and hydropower to the region. When I see this photo, I think of the impacts of glacial melt to water, energy, cultural, and economic resources in Washington. -Caitlin QuirkColumbia Glacier is one of sixty global reference glaciers. This summer it lost 5% of its volume.Lower Curtis Glacier continues to rapidly thin at the top of the glacier as well as at the terminus. The glacier retained additional avalanche accumulation, leading to a less negative balance than other glaciers.Rainbow Glacier is one of the sixty global reference glaciers. This year new bedrock began to emerge and expand in several icefalls, leading to serac fall.Easton Glacier has retreated 700 m since 1990 and has a number of bedrock areas emerging in icefall up to 2500 m.Lynch Glacier east and west side are separating. The upper basin did retain some snow in 2025.Daniels Glacier lost all snowpack by the end of the summer and bedrock is quickly expanding amongst the glacier.
The trajectory for most North Cascade glaciers is one of fragmentation. This is illustrated by Foss Glacier on the east flank of Mount Hinman, that we began observing annually in 1984 but stopped measuring as it fragmented.Foss Glacier from the top was a 1 km long and nearly 600 m wide glacier. In Sept. 2025 Cal Waichler captured view from the top with the two main fragments now less than 50 m wide and 300 m long.-Mauri Pelto
Leah Pezzetti KING5 meterologist hiked in with us to Lower Curtis Glacier.
The CBS team hiked into Sholes Glacier with usspending the night, and we had three generations of Pelto’s.
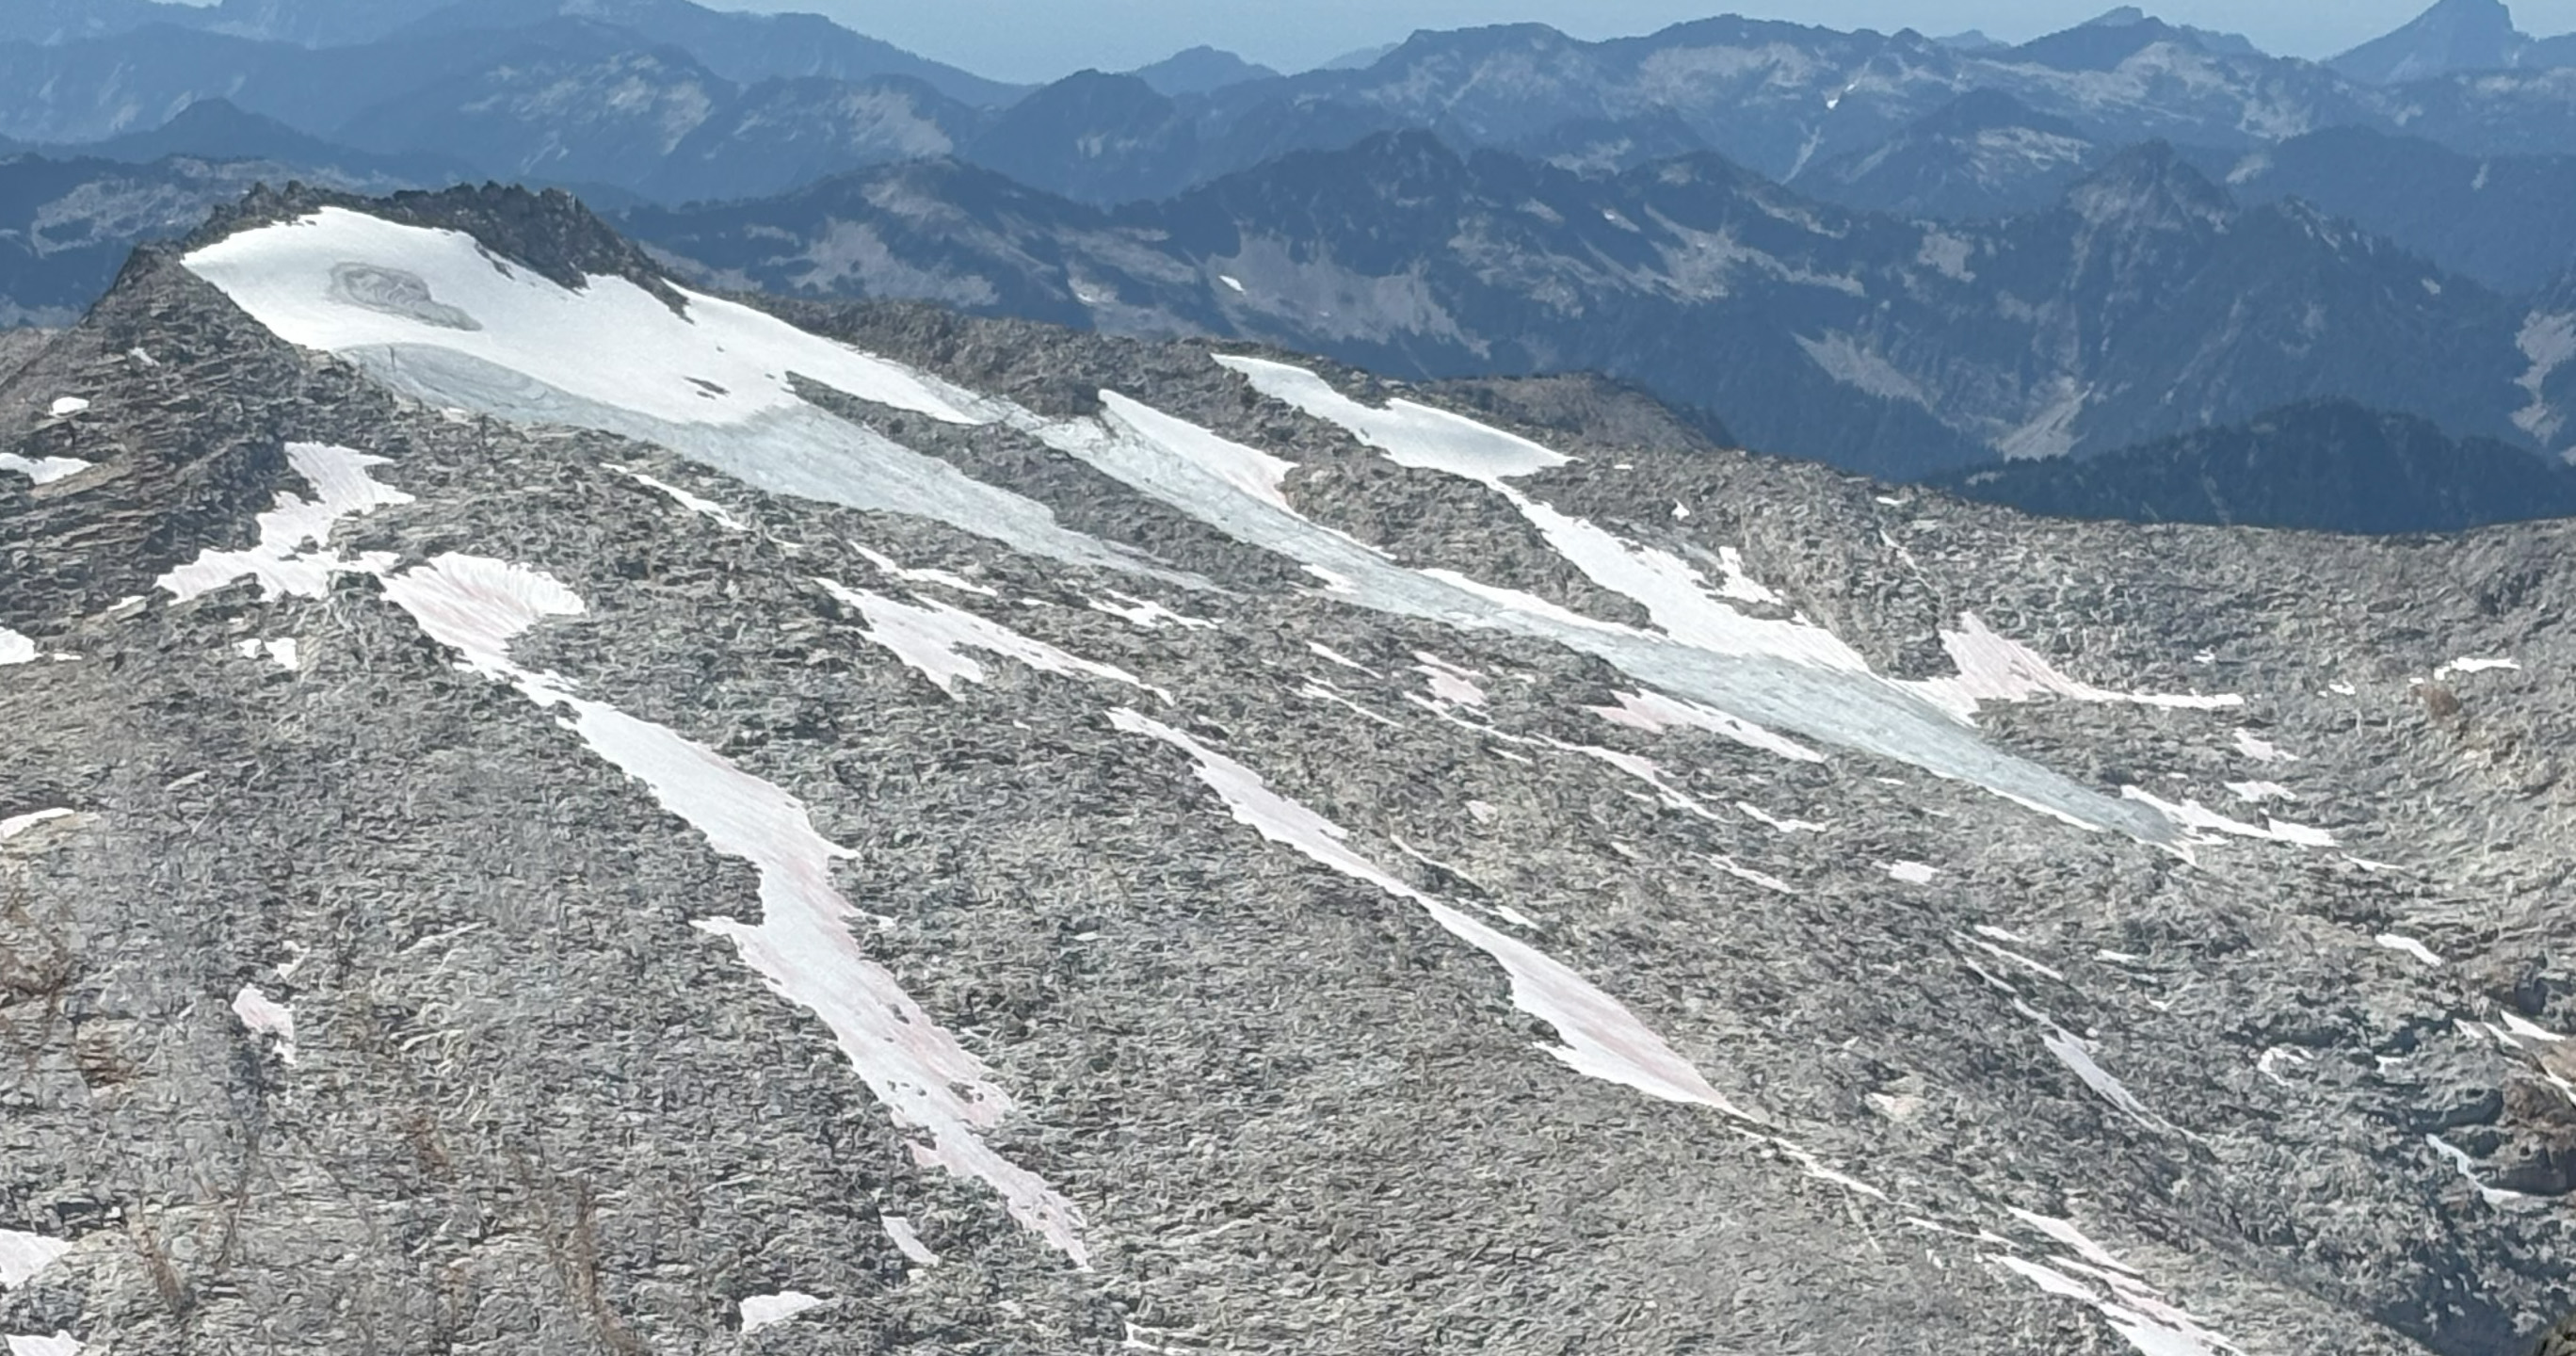
Hofsjokull East is snow free on 8-17-2025 in this false color Sentinel image. This leads to ice melt, thinning and bedrock expansion at Point A-D.
Hofsjokull East, Iceland is a small ice cap east of Vatnajokull with a summit elevation of 1100 m. In the last decade the snow line has often been above the ice cap. The ice cap had an area or 4.97 km2 in 2003 declining to 2.51 km2 in 2023 (Iceland Glacier Viewer). In 2024 all 10 glaciers in Iceland had significant mass loss (Pelto, 2025).
In August 2020 the ice cap has lost nearly all of its snow cover, this occurred again in 2023 and 2024. The result in 2025 when the ice cap again lost all its snowcover, is significant glacier surface melt and thinning. This leads to expansion of bedrock. At Point A there has been rapid expansion of the bedrock knob. At Point B and C new bedrock has been exposed and rapidly expanded. At Point D a bedrock rib at the edge of the ice cap has spread into the ice cap.
The lack of snow cover indicates the ice cap no longer has an accumulation zone and cannot survive. In 2025 the ice cap area is 2.10 km2 . Ice cap area has declined by ~60 % in the last 22 years. The story here is similar to that at the larger Prándarjökull 10 km to the northeast. The summer of 2025 in Iceland was exceptional beginning with a May heatwave, followed by a July heatwave. The May heat wave led to high snow lines as summer began on Vatnajokull.
Hofsjokull East is nearly snow free on 8-14-2020 in this false color Sentinel image. Contrast the area of bedrock at Point A-Dto the 2023 and 2025 images.
Hofsjokull East is nearly snow free on 9-3-2023 in this false color Sentinel image. Point B and C now have evident bedrock areas.
Field team Emmett Elsom, Mauri Pelto, Jill Pelto and Caitlin Quirk at Rainbow/Mazama Glacier saddle.
For the 42nd consecutive year we were in the field observing North Cascade glaciers. Our expedition of scientists and artists observes the response of the glaciers to climate change. In the last five years the glacier system in this mountain range is showing signs of collapse. The signs range from vanished glaciers, dwindling summer runoff, increased rockfall and serac instability.
Our first field area was Columbia Glacier, which feeds the North Fork Skykomish River. This is the largest glacier in the Skykomish River Basin and a World Reference glacier. We have observed ongoing retreat and accelerated volume loss, 50% of its volume lost in 42 years. The primary field team consiste of Emmett Elsom (field scientist), Caitlin Quirk (field scientist), Jill Pelto (art director) and Mauri Pelto (science director). In 2025 the new glacier lake that developd in 2010 continue to expand, a warmer Blanca Lake supported more algae, and the reduced glacier area provided notably less streamflow dring this the late July-August period.
Columbia Glacier 7-29-2025 with the expanding new lake and the thinning glacier that used to have a steep high terminus (Jill Pelto).
We next headed north to Lower Curtis Glacier on Mount Shuksan, which feeds into Baker Lake. We were joined by Katie Hovind (field scientist) and Margaret Kingston (oil painter). Leah Pezzetti, meteorologist and Nick Goldring videographer from KING5 in Seattle joined us.
The terminus of this glacier continues to thin, with the seracs becoming less imposing. The terminus front has diminished from over 45 m high, to 25 m. The glacier is thinning almost 1 m per year even in the accumulation area of the cirque basin. Glacier retreat has been 225 m since retreat began in 1986 across the wide terminus front.
Next up was Sholes and Rainbow Glacier, both accessed from our camp on Ptarmigan Ridge. Claire Seaman (oil painter) joined our crew for both. Ben Pelto and Margot Pelto joined us for Sholes Glacier, along with their nine-month old daughter Wren, (my granddaughter). The Sholes Glacier has been rapidly thinning and losing area along its broad lower margin particularly in the last 5 years. The glacier has lost 0.25 km2 in this century along this margin, or 30% of the total glacier area. In 2023 we explored an ice cave that was over 100 m long. In 2025 this entire slope is devoid of ice. CBS Sunday News joined us on Sholes Glacier and captured well, what we do and how we combine art and science.
Rainbow Glacier descends from a saddle with the Mazama Glacier. This area consistently retains deep snow. This year the snowpack was 3.5-4.75 m deep in early August. Further down glacier, a series of bedrock knobs continue to emerge from beneath the ice, leading to steeper, thinner icefalls that leads to unstable serac conditions. The collapse of these seracs is predictable in terms of where. We did observe a large one. We descended to the terminus of the glacier. The glacier continues to retreat, with a retreat of 890 m since 1986. The glacier had been advancing prior to 1986.
Easton Glacier on August 9, 2025 from our research camp. In 1990 glacier ended at small ridge right behind our hats. Now glacier has receded 700 m (Abby Hudak, Jill Pelto and Mauri Pelto)
We circled to the south side of Mount Baker to examine Deming, Easton and Squak Glacier. Easton Glacier has retreated 705 m since retreat began in 1990. This year we continued to observe new bedrock emerging from beneath the glacier, including in the main icefall at 2000 m and as high as 2800 m on the glacier. This is also occurring on Deming Glacier. In both cases there is oversteepening in icefall areas leading to unstable seracs. On Squak Glacier we descended, what had been a crevassed icefall, that now is a steep ice ramp, to the terminus. This indicates limited velocity feeding the now nearly stagnant glacier tongue.
New areas of rock exposure emerging at base of main Easton Glacier icefall for the first time, at 2000 m.
Bedrock emerging at 2800 m on Easton/Deming Glacier. These features illustrate thinning is extensive even near the top of Mount Baker glaciers.
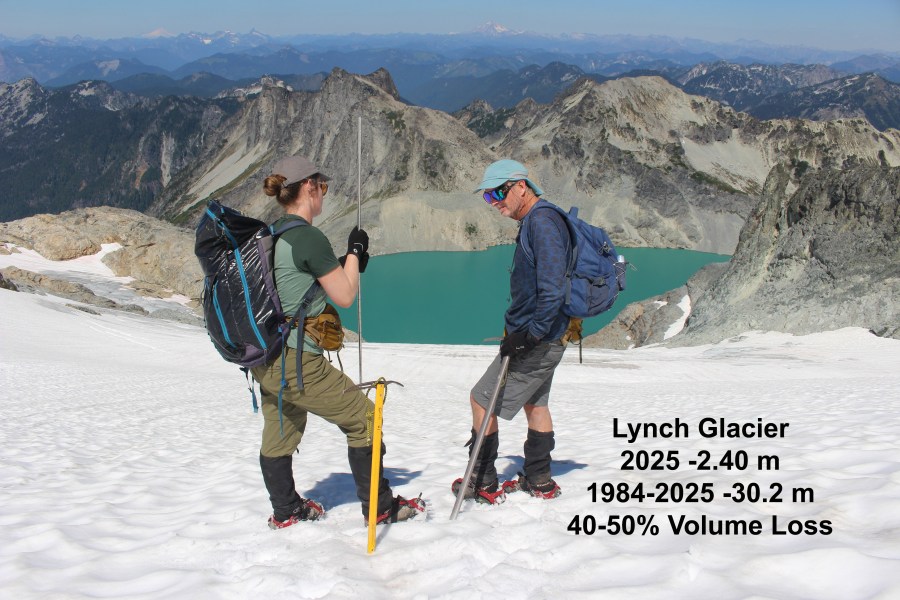
Our last stop was in the Alpine Lake Wilderness, and we were joined by Cal Waichler (wood cut printing) and Margaret Kingston. The glaciers of Mount Daniel and Mount Hinman have been in rapid decline this century. With six of the nine ceasing to exist by 2024. We continue to monitor Lynch and Daniels Glacier each year. Lynch Glacier continues to retain snowpack on the upper portion of the glacier, while losing 50% of its area since 1984. Daniels Glacier has lost 60% of its area since 1984 and is no longer retaining significant snow pack by the end of the summer. The retreat of area loss on Daniels Glacier has been 5% per year in the last five years. The runoff from glaciers into the Cle Elum Reservoir has diminished markedly in late summer reducing both runoff and increasing water temperatures. By late August Cle Elum Reservoir had dropped to 7% full, which will curtail water allocation to downstream Yakima Basin agriculture.
Descending onto Lynch Glacier, with Pea Soup Lake below. The glacier filled the lake until 1978.Daniels Glacier in 2025, illustrating the bare rock slope that was almost entirely covered by the glacier in 1984.The remaining fragments of Foss Glacier that has lost 80% of its area since we first mapped it in 1986.
Prándarjökull on August 20, 2025 has no retained snowpack-with weeks left in the melt season (Sentinel false color image)
Prándarjökull is an icecap northeast of Vatnajokull that has a summit elevation of 1215 m, and a margin between 875 and 925 m. In 2003 the ice cap had an area of 17.3 km2, declining to 12.8 km2 by 2023 (Iceland Glacier Viewer). In 2024 all 10 glaciers in Iceland had significant mass loss (Pelto, 2025)
In 2021 the ice cap lost at least 90% of its snow cover as noted in the Sentinel image from 8-24-2021. In 2023 The ice cap again lost nearly all of its snow cover.
Prándarjökull on August 31, 2023 has only 5-10% retained snowpack-with weeks left in the melt season (Sentinel false color image)
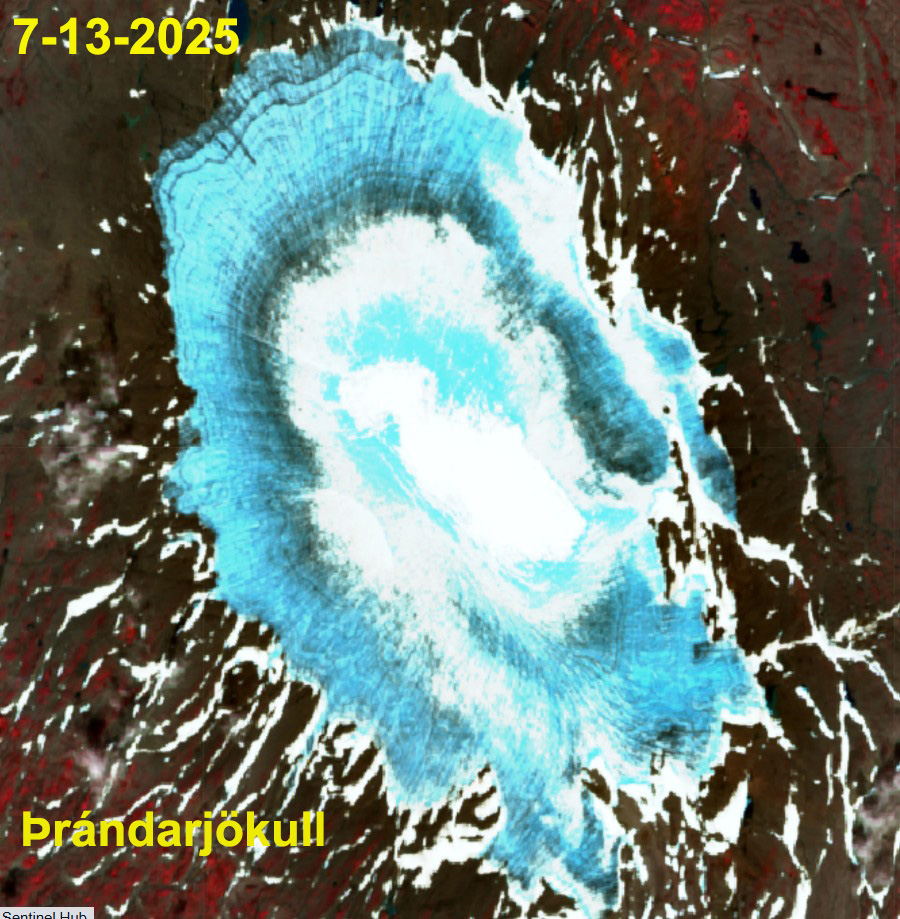
The spring and early summer of 2025 was one of record warmth for Iceland. This led to a rapid rise of the snowline to 900-1000 m on Vatnajokull. By mid-July 60% of the Prándarjökull was snow free. There is an area of water saturated snow-light blue amidst the snowpack.
Prándarjökull on July 13, 2025 the ice caphas 40% retained snow cover-with weeks left in the melt season (Sentinel false color image)
By August 20, 2025 the ice cap had no snow cover. The early exposure of ice in recent years is leading to the continued recession of the ice cap and the intrusion of bedrock areas into the ice cap at Point A and B. At Point C in 2021 recent firn is exposed, that has melted away by 2025. The area of the ice cap has declined to 11.5 km2. There is no recent retained firn-indicating that in the last five year no snow cover has persisted to the end of this summer. This indicates the lack of an accumulation zone, without which the glacier cannot survive.
Prándarjökull on August 31, 2023 has only 5-10% retained snowpack-with weeks left in the melt season (Sentinel false color image)
2025 Field Season: For the 42nd consecutive summer we are heading into the field to measure and communicate the impact of climate change on North Cascade glaciers. This year an overall focus of the project is supporting the UN’s “International Year for Glaciers’ Preservation”. This means focusing on glaciers that have disappeared and are in critical danger of disappearing in the next decade. Jill Pelto, Art Director and Mauri Pelto, Science Director
This field season follows the 2021-2024 seasons that featured either historic heat waves and/or periods of extended warm weather. The heat led to a greater exposure of bare ice on glaciers with a higher albedo and greater density. The observed melt rates are 7-9 cm/day water equivalent during warm weather events vs 4-6 for snow surfaces. This led to substantial mass losses on North Cascade glacier for the four years of over ~6 m.
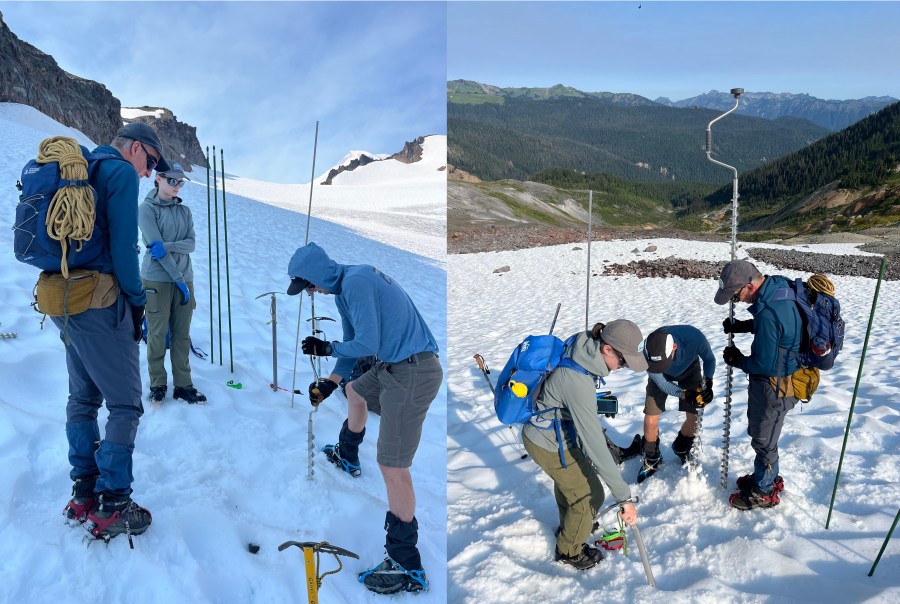
Science objectives: We will complete detailed measurements on 10 glaciers, three of which are part of the World Glacier Monitoring Service reference glacier network (48 glaciers globally), which have 30+ consecutive years of mass balance observations. This summer we will have an opportunity to assess the long-term ramifications of the 2013-2024 period of unprecedented mass balance losses and associated glacier changes, with detailed mass balance, crevasse depths and glacier surface elevation profiling. We also focus on the impact of diminishing glacier size on downstream runoff.
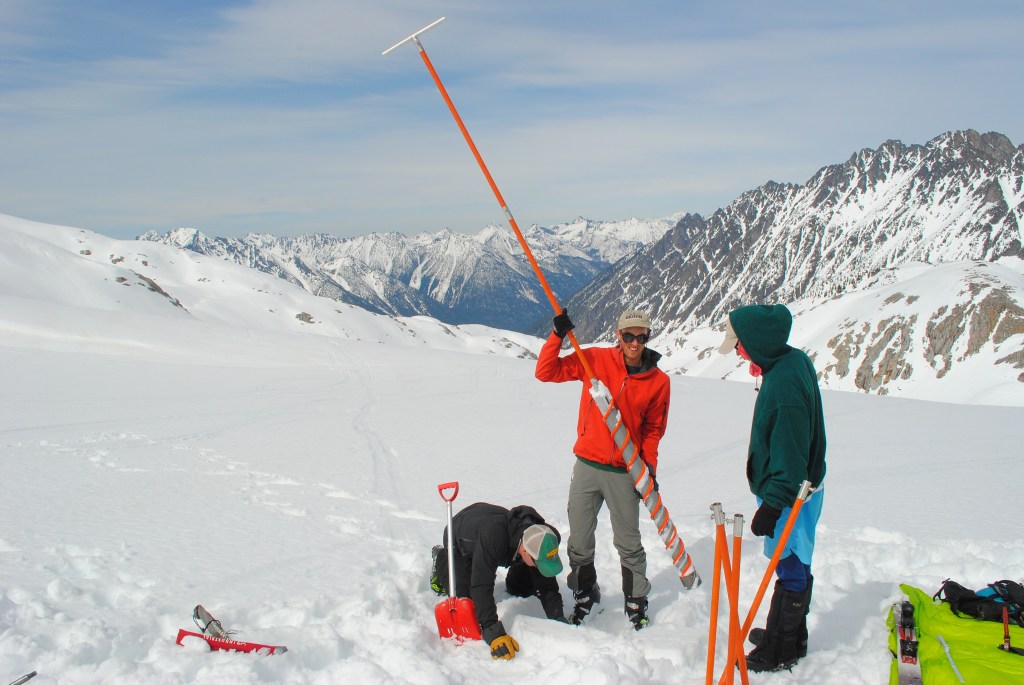
Drilling and emplacing ablation stakes on Sholes Glacier.
Art Objectives: We will collaborate with several artists who will join us for a portion of the field season. They will be able to create their own work about the landscape and the science or may join us for fieldwork and make plans for future artwork. We hope to use this art to share our research with a broader audience and highlight the beauty and importance of these places.
Cal Waichler Sketch of Lower Curtis Glacier.
Communication Objectives: We will leverage the brands of our expedition sponsors and the focus on vanishing glaciers that the UN brings this year. These organizations can help spread our message. We will utilize a combination of artists and scientists to tell the story.
From the Glaciers to the Sea: this is one of two paintings that tells stories of watersheds fed by North Cascade glaciers that flow out into the Puget Sound. The snowpack and glaciers in the mountains in this region provide crucial meltwater to river systems, many of which connect critically to the ocean.
Field Team 2025:
Jill Pelto (she/her) is an artist and scientist from New England who grew up loving winter sports and trips to the mountains. She incorporates scientific research and data into paintings and prints to communicate environmental changes. Her multi-disciplinary work weaves visual narratives that reveal the reality of human impacts on this planet. She completed both her B.A. degrees in Studio Art and Earth and Climate Science, and her M.S. focused on studying the stability of the Antarctic Ice Sheet at the University of Maine, spending two field seasons at a remote camp in the southern Transantarctic Mountains. Jill will be joining the project for her 15th field season. She is excited about continuing to document the change in North Cascade glaciers that she has witnessed each of the last ten years — through science and art.
Mauri Pelto (he/him)has directed the project since its founding in 1984, spending more than 800 nights camped out adjacent to these glaciers. He is the United States representative to the World Glacier Monitoring Service. For 15 years he has been author of the blog “From a Glacier’s Perspective”, and associate editor for three science journals. He is on the Science Advisory Board for NASA’s Earth Observatory. His primary position is Associate Provost at Nichols College, where he has been a professor since 1989. He either runs on trails or skis on alpine and cross country trails every day.
Emmett Elsom (he/him) is an environmental science student at Western Washington University from Portland, Oregon. Growing up mountaineering and backpacking in the Cascade Range, he developed a love for the region and a fascination with the complexities of its ecosystems. In 2024 he had an opportunity to work In the field with the Oregon Glaciers Institute, assisting with SNOTEL data collection and fieldwork. This year, he is looking forward to broadening his understanding of the ecological role of glaciers and their melt across the Pacific Northwest, and the power of utilizing art in science.
Caitlin Quirk (she/her) is a Masters student of Environmental Humanities at the University of Utah. She writes essays and poetry about socio-environmental justice, land relations, and political ecologies of climate change. Before graduate school, Caitlin worked as a mountaineering instructor and environmental researcher. Through these roles, she formed deep relationships with glaciers throughout the Pacific Northwest.
Katie Hovind (she/her) is an environmental science student at Western Washington University. She feels a deep connection to the Cascade mountains and their watersheds from growing up in this region, and hopes to share their beauty and importance with others. She was a field assistant with NCGCP last year, and is excited to continue collaborating this year to explore ways science and art can evoke caring—for protection of natural spaces and response to the climate crisis. This season, she will help conduct a vegetational succession study at the Easton’s terminus to observe the changing alpine plant growth in the wake of a receding glacier.
Margaret Kingston: is an oil painter and art educator from Winthrop, Washington. Originally from New Hampshire, she moved 3000 miles with her husband Jonathan Baker to the Methow Valley after visiting the North Cascades National Park. Landscapes of the Pacific Northwest have been her inspiration for the past 13 years, captured first through a photo then realistically painted on canvas. As a backcountry skier, hiker, and biker she captures the energy of places these activities take you. With funding from the Mary Kiesau Fellowship Grant, Margaret will plein air paint on site in honor of her friend Mary Kiesau. Her observations during time spent with the North Cascade Glacier Climate Project will be shared through the resulting artwork and at a community event in the Methow Valley. Learn more about Margaret Kingston’s work at MkOilPaintings.com
Claire Sianna Seaman (she/her) is a painter, filmmaker, and printmaker from Leavenworth, WA. She holds a BA from Smith College in Studio Art, with a concentration in Climate Change. She is currently earning her MA in Human Geography at the University of British Columbia. Claire has been featured in the Wild and Scenic Film Festival Art Exhibition and received an Artist Trust GAP Award. She worked with scientists from the University of Washington Climate Impacts Group to create an art piece that imagined climate resiliency in the Pacific Northwest. This piece is currently part of the 5th National Climate Assessment Art x Climate Gallery on display at the Smithsonian Natural History Museum in Washington, D.C https://www.clairesianna.com/
2025 Schedule
July 28: Hike In Columbia.
July 29: Columbia Glacier survey
July 30: Hike Out Columbia/Hike in Lower Curtis
July 31: Lower Curtis Glacier Survey
Aug. 1: Hike out, Hike in Ptarmigan Ridge
Aug. 2: Sholes Glacier
Aug. 3: Rainbow Glacier
Aug. 4: Rainbow Glacier
Aug. 5: Hike out. Hike in Easton Glacier (Resupply in Bellingham WA)
As April ends there is a sharp snowline ranging from 1200 m at Mount Baker to 1400 m at Cascade Pass. Above 1500 m the melt season is just getting started.
As the accumulation season comes to an end for North Cascade glaciers it is worth reviewing this winter and looking ahead with a forecast for glacier mass balance by the end of summer 2025. The winter of 2025 at NOAA’s Washington Cascade Mountain West Division 5 records indicate that this winter was below the declining trendline of total precipitation with a mean of 54.8 inches, down slightly from last year. Winter temperatures were again warm at 33.2o F but close to the expected rising trend line average.
The 1946 to 2025 winter (November-March) mean temperature and total precipitation for the Western Cascade Mountains-Division 5 weather stations.
The mean April 1 snow water equivalent (swe) at the six North Cascade Snotel sites with a consistent long term record was 0.72 m. This is below the declining trend line and 31% below the long term average for the 1946-2025 period. This is above the 2024 value, but in the lowest quintile. Mount Baker ski area has reported 585 inches of snowfall through April 21, which is ~30% percentile. April 1 swe is the key date for asssessment for winter snowpack water resources. For glaciers the accumulation season typically continues until the end or April or early May. This year snowpack depth at Mount Baker Ski Area (1280 m) increased from 148 inches on April 1 to 164 inches on April 9 and then declining to 119 inches by May 1 (80% of normal). A similar pattern was seen at Stevens Pass-Grace Lake station (1460 m) with snowpack depth on April 1 of 107 inches, increasing to 114 inches by April 9 and decreasing to 82 inches by May 1. These stations are several hundred meters below glacier elevations. At Lyman Lake Snotel (1800 m) snowpack SWE which most closely matches the glacier elevations was 40.1 inches rising to 42.5 inches by April 11 and declining to 35.9 inches by May 1, ~60% of normal. At the Middle Fork Nooksack site (1520 m) snowpack was 44.8 inches SWE on April 1, rising to 49 inches by April 11 and declining to 46 inches on May 1, 67% of normal . This illustrates that at glacier elevations snowpack would have also increased in mid-April, before a slow decline in the latter part of the month. There were a number of atmospheric rivers that drove a higher snowline than usual as May starts, but also led to a rapid increase in snowpack above the snowline.
The mean April 1 SWE from 1946-2025 at six long term SNOTEL stations: Stampede Pass, Fish Lake, Stevens Pass, Lyman Lake, Park Creek and Rainy Pass.
As the melt season begins, based on the above the winter snowpack on glaciers on May 1 are 70-80% of normal. Eric Gilbertson measured snowpack on the summit Colfax Peak at 17.3 ft (5.27 m) on April 18, 2025. This is a location that is to some extent wind scoured and would be less than the depth on the adjacent glacier, a normal year there is 8-9 m of snowpack at 2300-2800 m. On Eldorado Peak they found 25.3 feet on April 27, 2025. This is the depth expected for this location in a year with 75-80% of normal snowpack. It is a location that appears to balance enhanced deposition and scour. Weather conditions in the Pacific Northwest are forecast to have above average temperatures for the upcoming 90 day period. This combined with the below average snowpack on glaciers on May 1, will yield another year where ice thickness loss exceeds 1 m across the glaciers, as each of the last four years have. The average from 2014-2024 has been -1.41 m, which is a 1.5 thick slice of the glacier lost each year. The range expected this year is -1.2 m to -2.4 m. How much will depend on the specific weather and the frequency and intensity of heat waves.
Mean mass balance observed in the field annually by the North Cascade Glacier Climate Project.
Columbia Glacier in 2015 viewed from the ridge above the glacier. The firn line is marked by blue dots. The age of the snow surface of 2015 and the firn surfaces of 2011-2014 are noted.
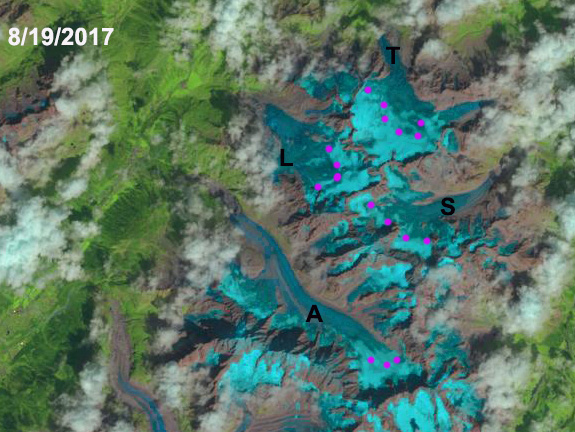
For an alpine glacier to be in equilibrium at the end of summer the glacier needs to be 50-70% covered in snow from the previous winter. This is the accumulation area ratio (AAR). AAR is a good measure of mass balance, which is why AAR is reported for WGMS reference glaciers. In recent years we have seen periodic strongly negative balance years that have removed all or nearly all of the snowpack from a glacier leaving an AAR of less than 10%, and considerable exposed firn. This typically occurs in assocation with a year that feature prolonged dry warm conditions in winter that limit snow accumulation or even reduce it, and/or summers with heat waves and extended warm periods that melt away the snowpack rapidly, particularly early in the melt season. This leads to exposure of firn, which is the snowpack retained from previous winters, hence more than a year old, but not yet glacier ice and significantly dirtier/darker than snow from the most recent winter. This firn melts more rapidly than snow, largely because it is darker. This leads to additional mass loss for the glacier. By the end of summer in strongly negative years we can see where the firn area boundary with glacier ice. This marks the region below which no accumlation has been retained in recent years, hence older ice is exposed. As such it delineates the multi-year accumulation area, the effective accumulation zone of the glacier. This would not be accuately determined from an simple average of annual AAR values. It is also readily visible in aerial or satellite imagery.
This scenario played out both in the Pacific Northwest in summer 2021 and in the Central Andessummer 2022. Pelto et al (2022) examine the impact of the heat waves on glacier runoff specifically. In New Zealand the 2022 NIWA annual snowline survey also indicate exposed firn below the annual snowline.
The blue dotted line on Columbia Glacier marks the accumulaiton zone for the 2011-2015 period, below that line no snow or firn was retained during that five year period. The is was a year of exceptional mass balance loss in the North Cascade Range (Pelto, 2018). Below is an example from Sholes Glacier in 2014 indicating the snow line in August and again in September now with a separte firn line apparent. Note the difference between the snowline for 2014 and the firn line for the 2011-2013 period. Below that point no firn has been retained.
Sholes Glacier snowline and firn line in August and September of 2014.
High negative balance years exposing significant firn areas at he surface have played out with increasing frequency in glaciated mountain regions from the North Cascade Range north through British Columbia to Alaska and across continents to the Alps, Canadian Arctic, Himalaya, and Andes. Glaciers where much of their snow cover is lost by mid-summer, then have the darker firn and ice exposed for enhanced ablation for the rest of the summer. There is no sunscreen they can apply for protection.
For Blackfoot and Jackson Glacier in Glacier National Park, Montana just one small area of snow remained on Blackfoot Glacier in early September of 2021. The area of firn on both glaciers is extensive nearly 50% of the glacier indicating overall an accumulation area of significant size. For Adams Glacier in late summer 2021 there is ~10% snowcover (A), while firn cover is 40% at the end of August.
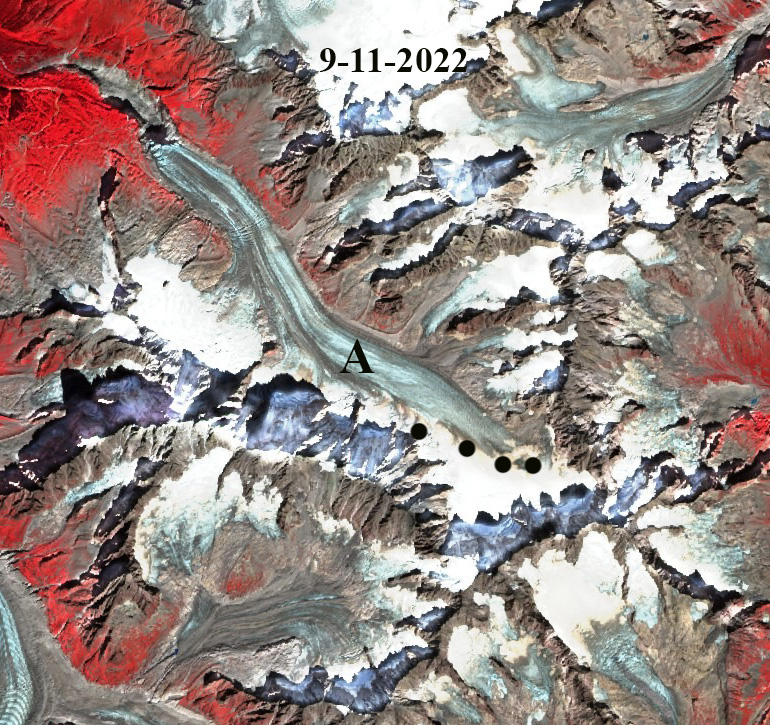
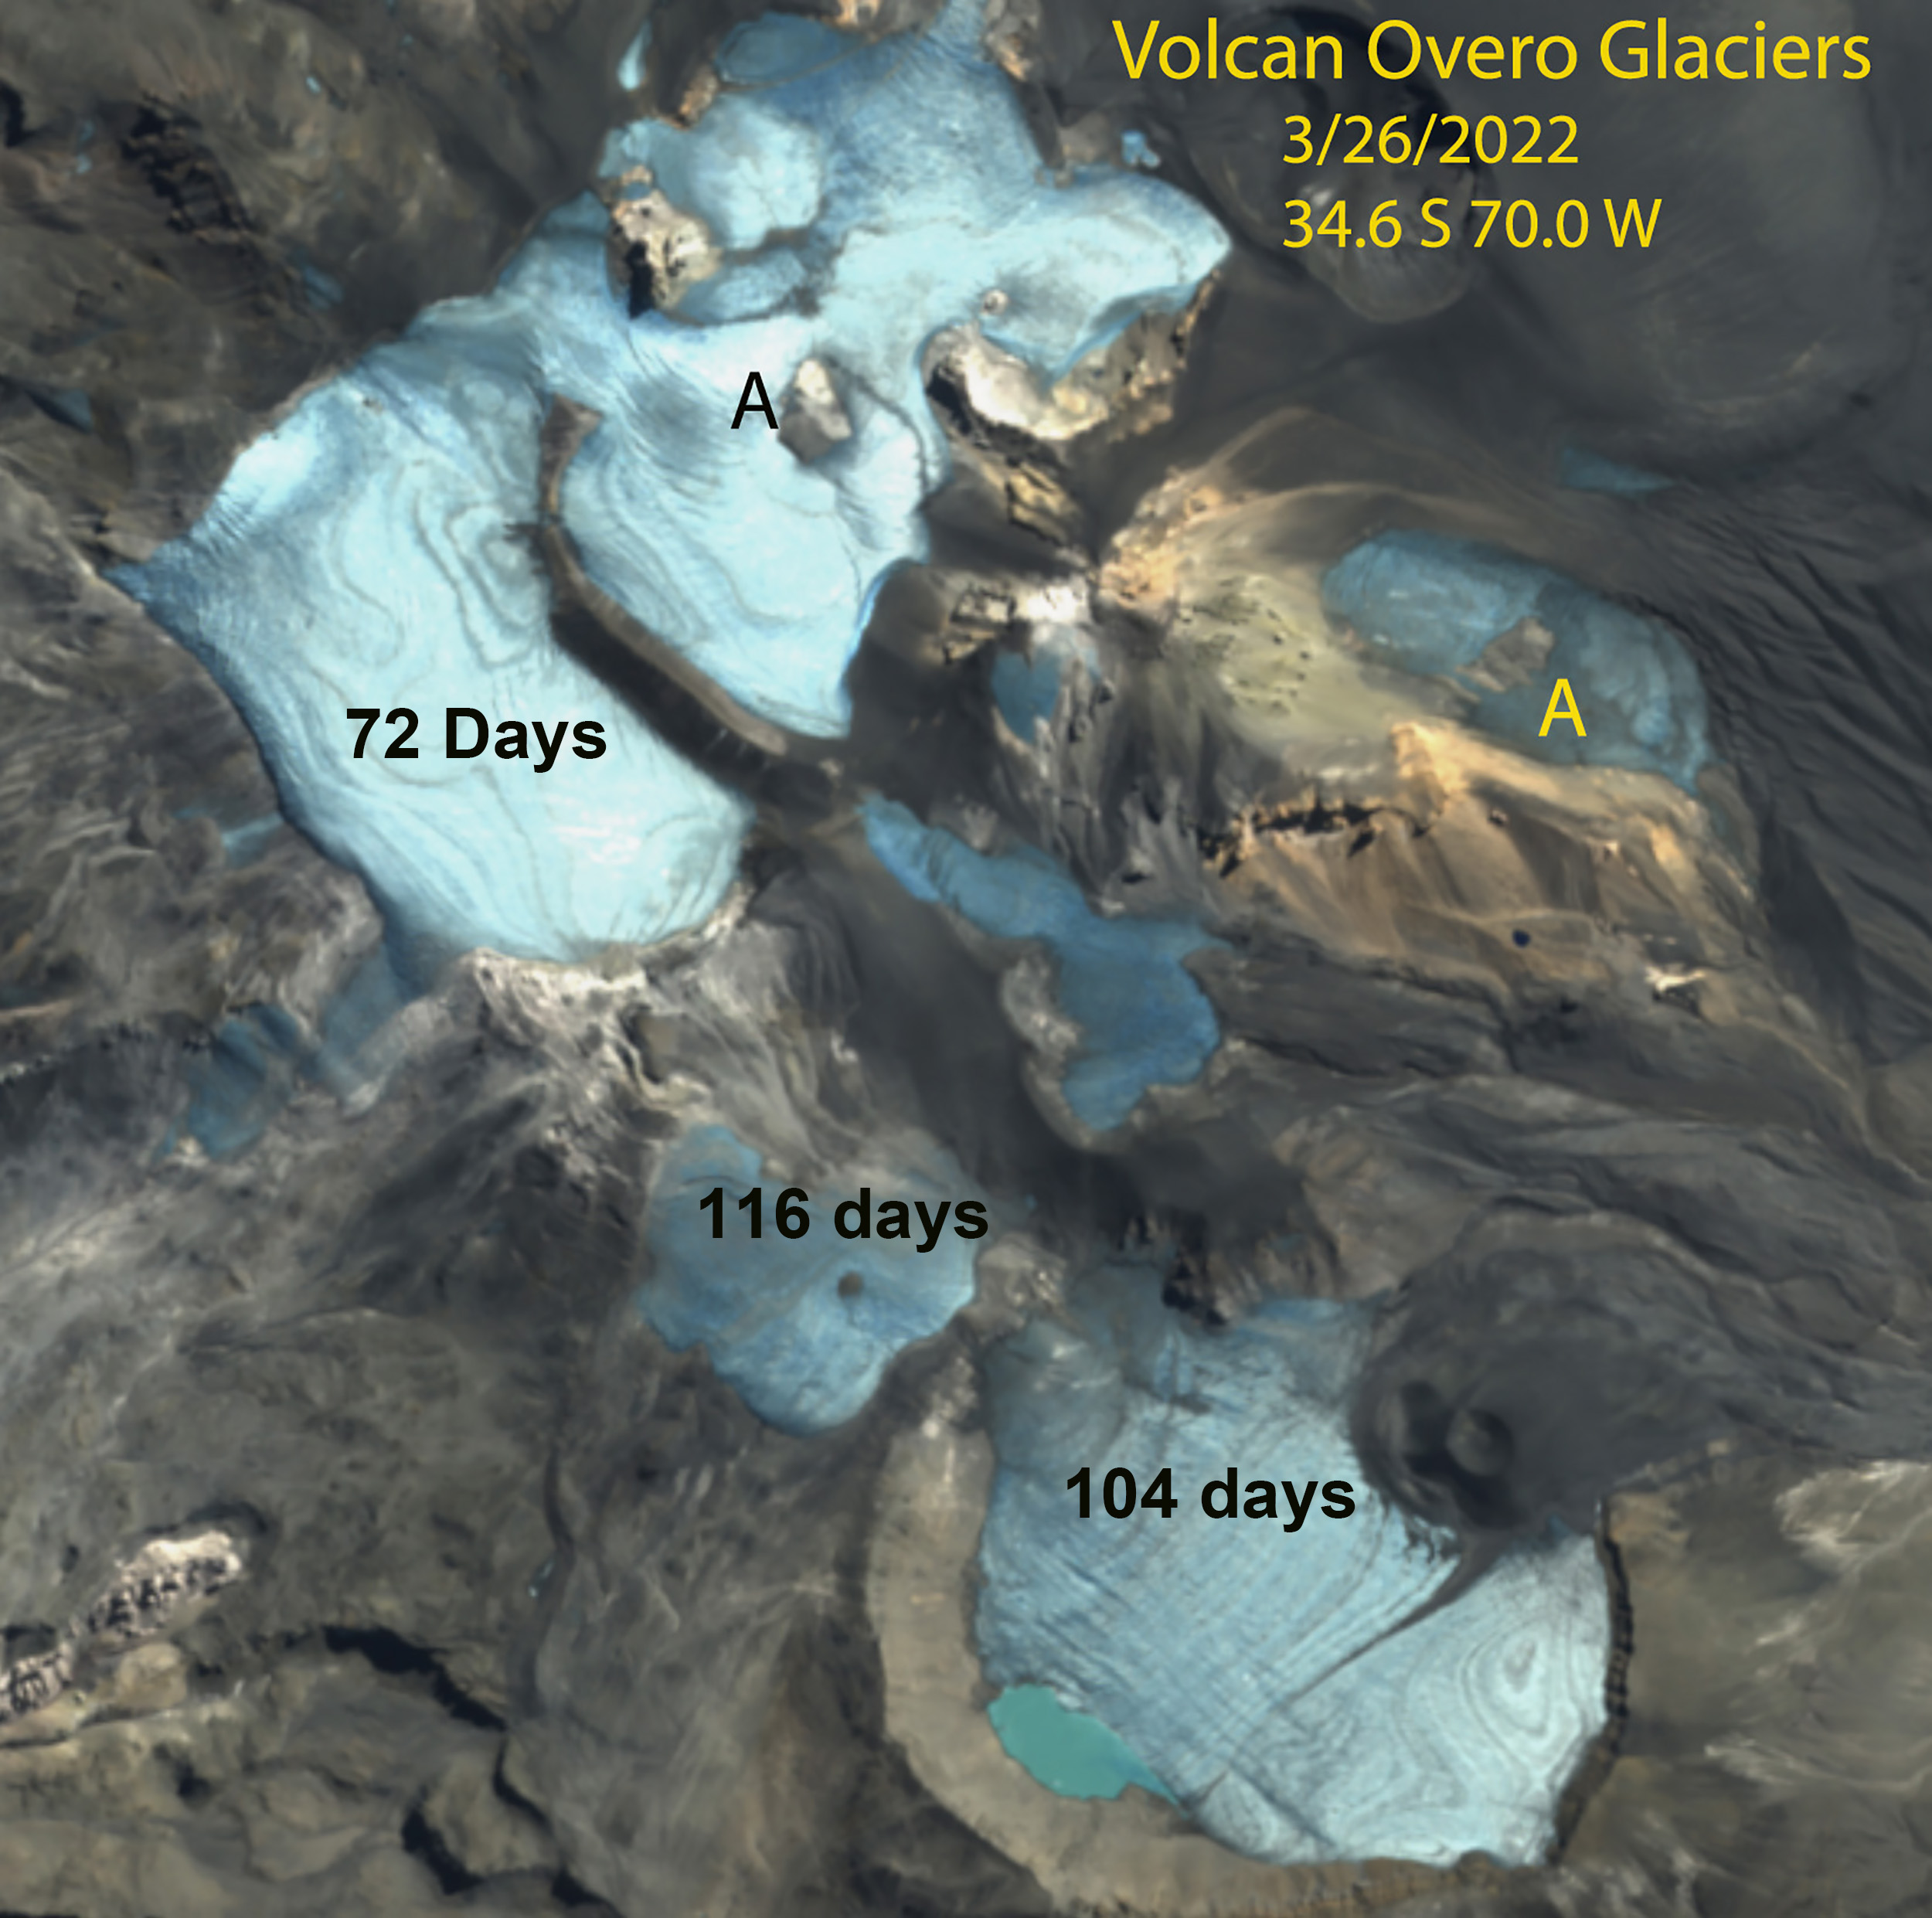
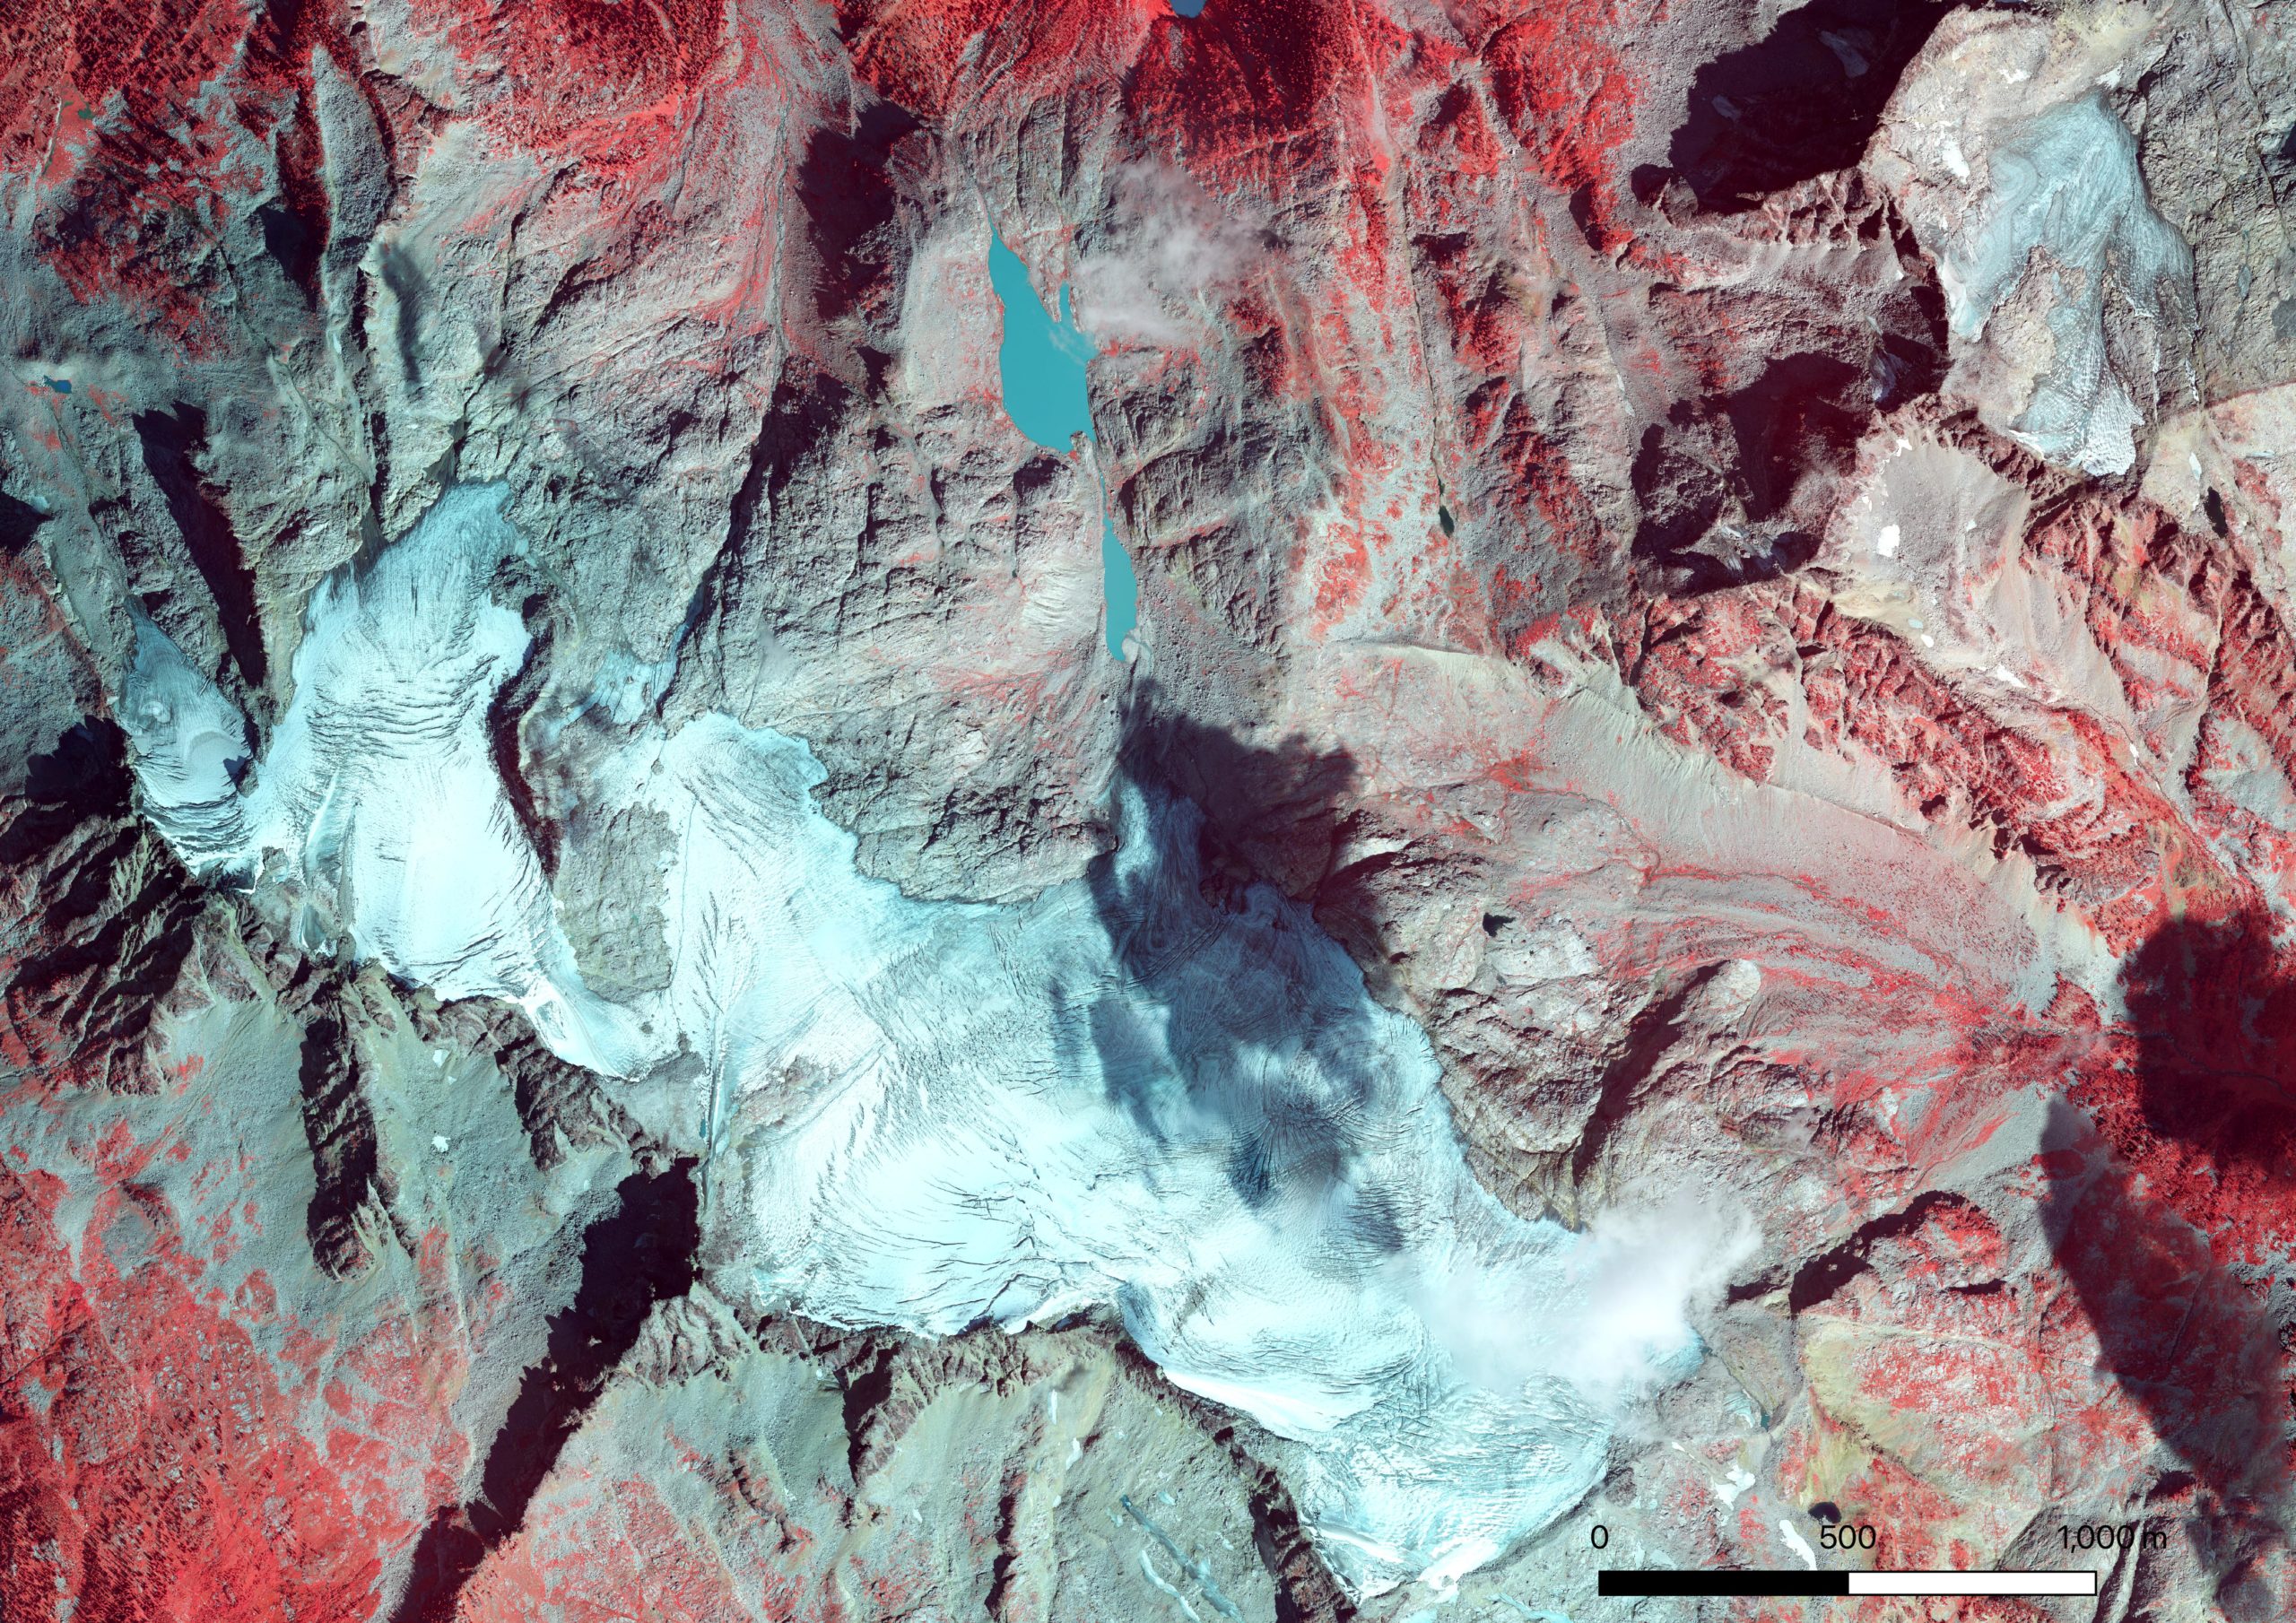
In January 2022 the Central Andes of Argentina and Chile have experienced nearly complete snowcover loss on many glaciers. Volcan Overo, Argentina has four ice masses A-D with limited firn or remaining snowpack. Ice mass E has limited snowcover, but reasonable firn cover extent, not blue dots between firn and bare ice. On Olivares Beta and Gamma Glacier, Chile almost no snowcover remains from Winter 2021, the firn line is limited to the upper portion of both glaciers. This indicates less than 30% of the glacier is an accumulation zone during recent years. There is still six weeks left in the melt season to further reduce this area. The bare surfaces lasted from mid-January into late March leading to extensive mass loss.
For each of the glaciers illustrated here the firn area can be delineated accurately due to the glacier having a significant mass balance loss. The age of the firn cannot be determined without specific knowledge of the glacier or area, but for temperate alpine glaciers firn typically is converted to ice is 5-7 year
The snow cover (S) reamining on Jackston and Blackfoot Glacier in a Sentinel image by early September of 2021 is minimal. The firn area (F) in gray is more extensive.
Adams Glacier with areas of acccumulation (A) and firn (F) in a Sentinel image from Aug. 30, 2021. Green dots indicate the glacier boundary.
Olivares Beta and Gamma Glacier in Sentinel image, with ~10% snowcover remaining and 30% firn cover (blue dots) on January 20, 2022.
Olivares Beta and Gamma Glacier in Sentinel image indicating days of exposure at surface of firn and ice , March 26, 2022.
Volcan Overo, Argentina in January 13, 2022 Sentinel image, with negligible snowcover remaining in mid-summer and firn cover remaining on 30% of the Glacier E.
Volcan Overo in Sentinel image indicating days of exposure at surface of firn and ice , March 26, 2022.
Honeycomb Glacier (H) with evident firn lines below the annual snowline on Oct. 19, 2022 in a Sentinel image.
The southwest side of Kokanee Glacier from the ridge with Cond Peak at the Right and Sawtooth Ridge at center.
By Ben Pelto, PhD, UBC Mitacs Elevate Postdoctoral Research Fellow
Since 2013 I have been working on the Kokanee Glacier. Located just outside of Nelson in southeastern British Columbia (BC), the Kokanee Glacier is due north of the Washington-Idaho border. This work began as part of a five-year study of the cryosphere in the Canadian portion of the Columbia River. This project was carried out by the Canadian Columbia River Snow and Glacier Research Network — spearheaded by the Columbia Basin Trust. The glacier research, which included the Kokanee Glacier, was led by my former PhD supervisor at the University of Northern British Columbia Dr. Brian Menounos and myself. At the culmination of the project, we published a technical report, and a plain language summary of that report. When the five-year project officially ended in 2018, I learned of a BC Parks program called Living Labs, which offers funding for climate change research in BC Parks, particularly research which documents change and guides protected area management. With Living Labs funding in 2019-2021, I have kept the annual mass balance trips going — now a continuous nine-year record — and a winter mass balance trip in 2021. In conjunction with this, Brian Menounos has secured continued funding (continued from our 5-year project) from BC Hydro for LiDAR surveys of the glacier every spring and fall. These surveys are carried out by the Airborne Coastal Observatory team from the Hakai Institute.
During the 2021 spring trip, we found that the Kokanee Glacier had an average snow depth of 4.4 meters. Using snow density measurements collected with a snow-corer, we found that the winter balance for 2021 was 1.91 meters water equivalent (m w.e.). This value was lower than the 2013-2020 average of 2.18 m w.e. (Pelto et al. 2019).
Ali Schroeder probing snow depth on the Kokanee Glacier while Joel McBurney and Drew Copeland look on.
Ben Pelto with the snow corer with Tom Hammond and Micah May on Kokanee Glacier. Photo: Jill Pelto
With a below average winter balance, 2021 would need to feature a cool summer. Instead, multiple heat waves occured, with temperature records being broken across the province. Wildfires burned all over BC and the neighboring US states of Washington and Idaho, swamping the region in smoke for weeks on end. Rather than mitigate for a slightly-below-normal snowpack on the Kokanee, summer 2021 took a blow-torch to glaciers across the region.
We hiked into the Kokanee Glacier on September 12, stopping under a boulder to wait out proximal booms of thunder and flashes in the clouds. We got pelted with bursts of both hail and graupel, and soaked in the rain, before gingerly working our way up boulder field and talus that is climbers route up the Keyhole to the Kokanee Glacier. Like the satellite imagery had shown, there was no snow in sight on the glacier — bare ice only. Instead of my usual camp on the snow, we chose a climbers bivy site to set our tent.
Camp in the Keyhole — a total lack of snow forced us to skip camping on-glacier.
The Keyhole route, a challenging scramble with 43 lb packs.
Stepping out onto the glacier, we immediately ran into difficult terrain, crevasse bridges of snow or firn had collapsed, leaving bedroom-width crevasses gaping open, necessitating an exercise in maze navigation. Our first stop was a stake at 2600 m which typically retains snow (50 to 100 cms), but this year had lost 1.6 meters. In fact, two stakes drilled at the site in 2015 and subsequently buried by snow had melted out, demonstrating that all snow/firn from the intervening years had been lost. This observation clued me in to the magnitude of melt to expect this year.
The first stake visited, showing 1.6 m of melt
Exposed layers of firn in a crevasse by the stake, showing 1.5 m-thick annual layers — now being eaten away by melt.
Travel on the glacier was more challenging in spots, but overall faster, as the total lack of snow meant that most crevasse bridges were gone, requiring less probing of crevasse bridges and roped-travel. Later, using a satellite image from the dates of our visit, I mapped the retained snow cover, limited to two tiny patches high on the glacier’s east side. The accumulation area ratio (AAR), or the ratio of snow cover to bare ice/firn was <0.01, meaning that under 1% of the glacier was covered in snow.
The upper reaches of Kokanee Glacier to Cond Peak (2800 m) with no retained snow in 2021. Bare ice is exposed on the lower half of the image, and firn, or multi-year snow above
The brown surface is multi-year firn, exposed by the loss of snow. In a typical year, the snow line would be visible here. The white surface below the brown is bare glacier ice.
Near infrared-Red-Green 30 cm resolution ortho image of Kokanee Glacier from the Hakai Geospatial/ACO team on Sept. 2, 2021. Note how badly crevassed the glacier is, most crevasses are exposed with no retained snow. The white color and mottled appearance over the upper glacier is a skiff of overnight snow just a few centimeters thick that melted off the next day. Also note bare ice patches exposed under formerly perennial snow patches that have shrunk in recent years and now are disappearing.
Visiting the toe of the glacier, our lowest stake indicated just under 5 m of ice melt, double that of 2020. In May, this location had 3 m of snow; the combined melt of snow and ice (loss of winter snow and glacier ice) is termed the summer mass balance, and at this site was -6.2 m w.e., far higher than the usual -4 m w.e. I also noticed that much of the thin ice along the margin of the toe was gone, and a little rock nunatak (rock island) that appeared in 2015 (images below) became a bite out of the glacier rather than a island. We estimated that the toe experienced 60 m of retreat. Over the past 5 years, the Kokanee has lost an average of 16 m in length annually. Expecting to see above average thinning and retreat, I was still startled to see how diminished and thin the toe looked.
2015: a small hole forms in the glacier margin above the toe, Jesse Milner in the foreground
2021: the hole is now a bite out of the glacier with two prominent rock knobs
A week prior to my field visit, the Hakai Institute ACO team flew a LiDAR survey of the Kokanee Glacier as part of their work with Brian Menounos at UNBC. Comparing this year’s glacier surface with that from last year’s survey, Brian found a whopping 2.55 m of thinning. After mapping the glacier facies (ice/firn/snow) to represent on the density of the observed thinning, this equates to a glacier mass balance of -2.16 m w.e., higher than the previous record loss of -1.20 m w.e. in 2015.
LiDAR-derived height change 2020 to 2021 from 1 m resolution DEMs from Brian Menounos and the Hakai Institue ACO team. The black line is the 2021 glacier outline, note the bite out of the glacier above the toe to the NE corner of the glacier. Small red patches off-ice are seasonal snow patches losing mass. Points represent mass balance observation locations.
Kokanee Glacier terminus from 2015 to 2021. 140 meters of retreat for 23 m/yr. Data in the GIF are from Hakai Institute and Brian Menounos of UNBC ACO glacier surveys.
Back home, I crunched the numbers from our glaciological observations of mass balance (consisting of 14 ablation stakes this year) and calculated a mass balance of -1.97 m w.e. With Brian, I published a paper in 2019 (Pelto et al. 2019) comparing glaciological (field) and geodetic (LiDAR) mass balance estimates and found them to be similar — if some factors like snow and firn density were carefully considered. The small difference between estimates is likely due to timing (the LiDAR mass balance is from 8/26/2020 to 9/3/2021, while the field mass balance is 9/12/2020 to 9/13/2021), and that there was a skiff of fresh snow (likely 5-10 cms) on the glacier during the 2020 LiDAR survey.
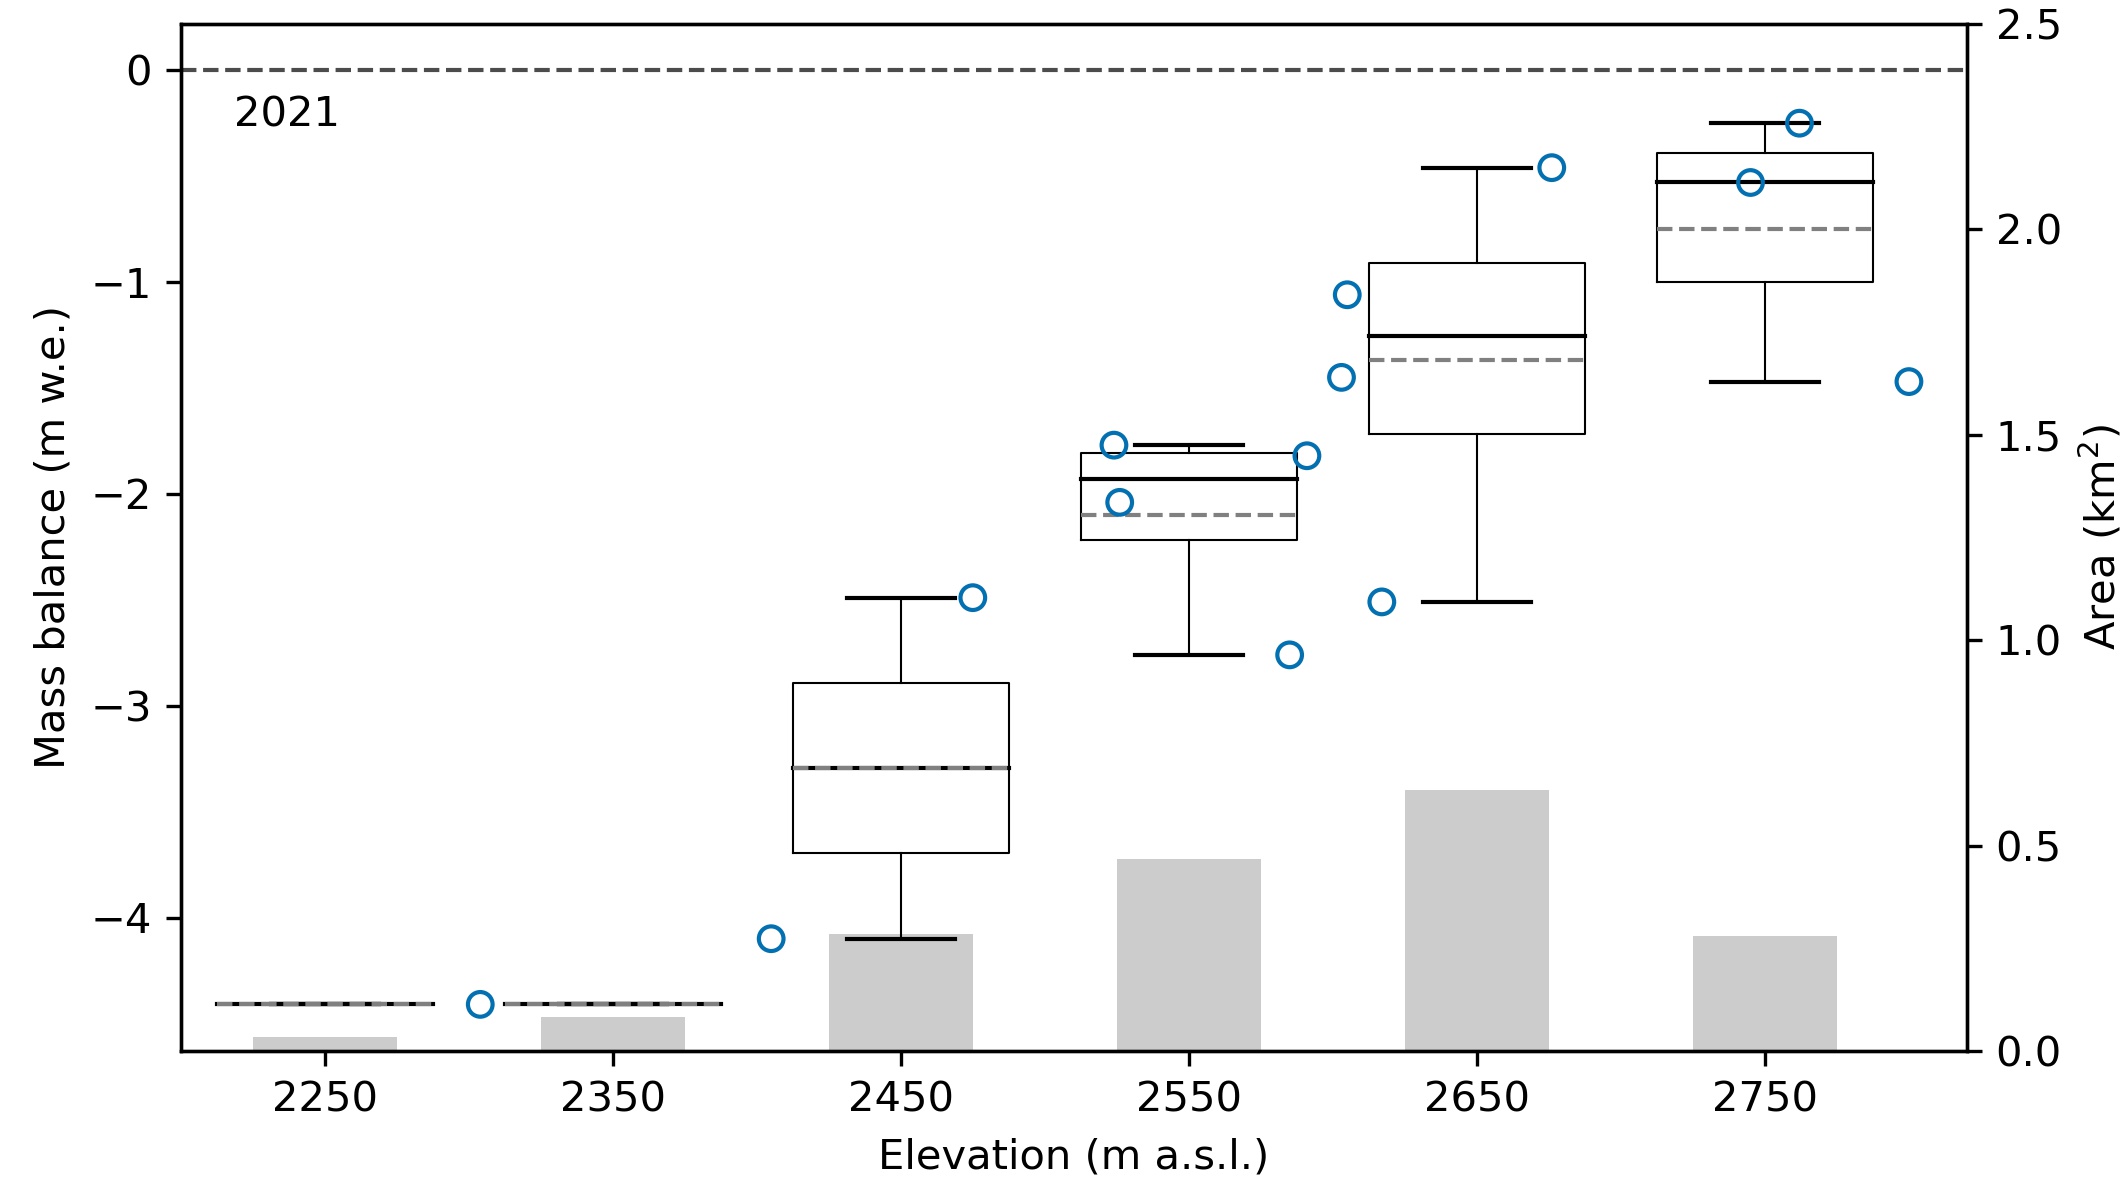
Kokanee 2021 glacier mass balance. Blue dots are observations. The boxplots show the 100 m bins used to estimate glacier-wide mass balance (median line in black, mean dashed grey line). The grey bars depict the area of the glacier for each 100 m elevation-band
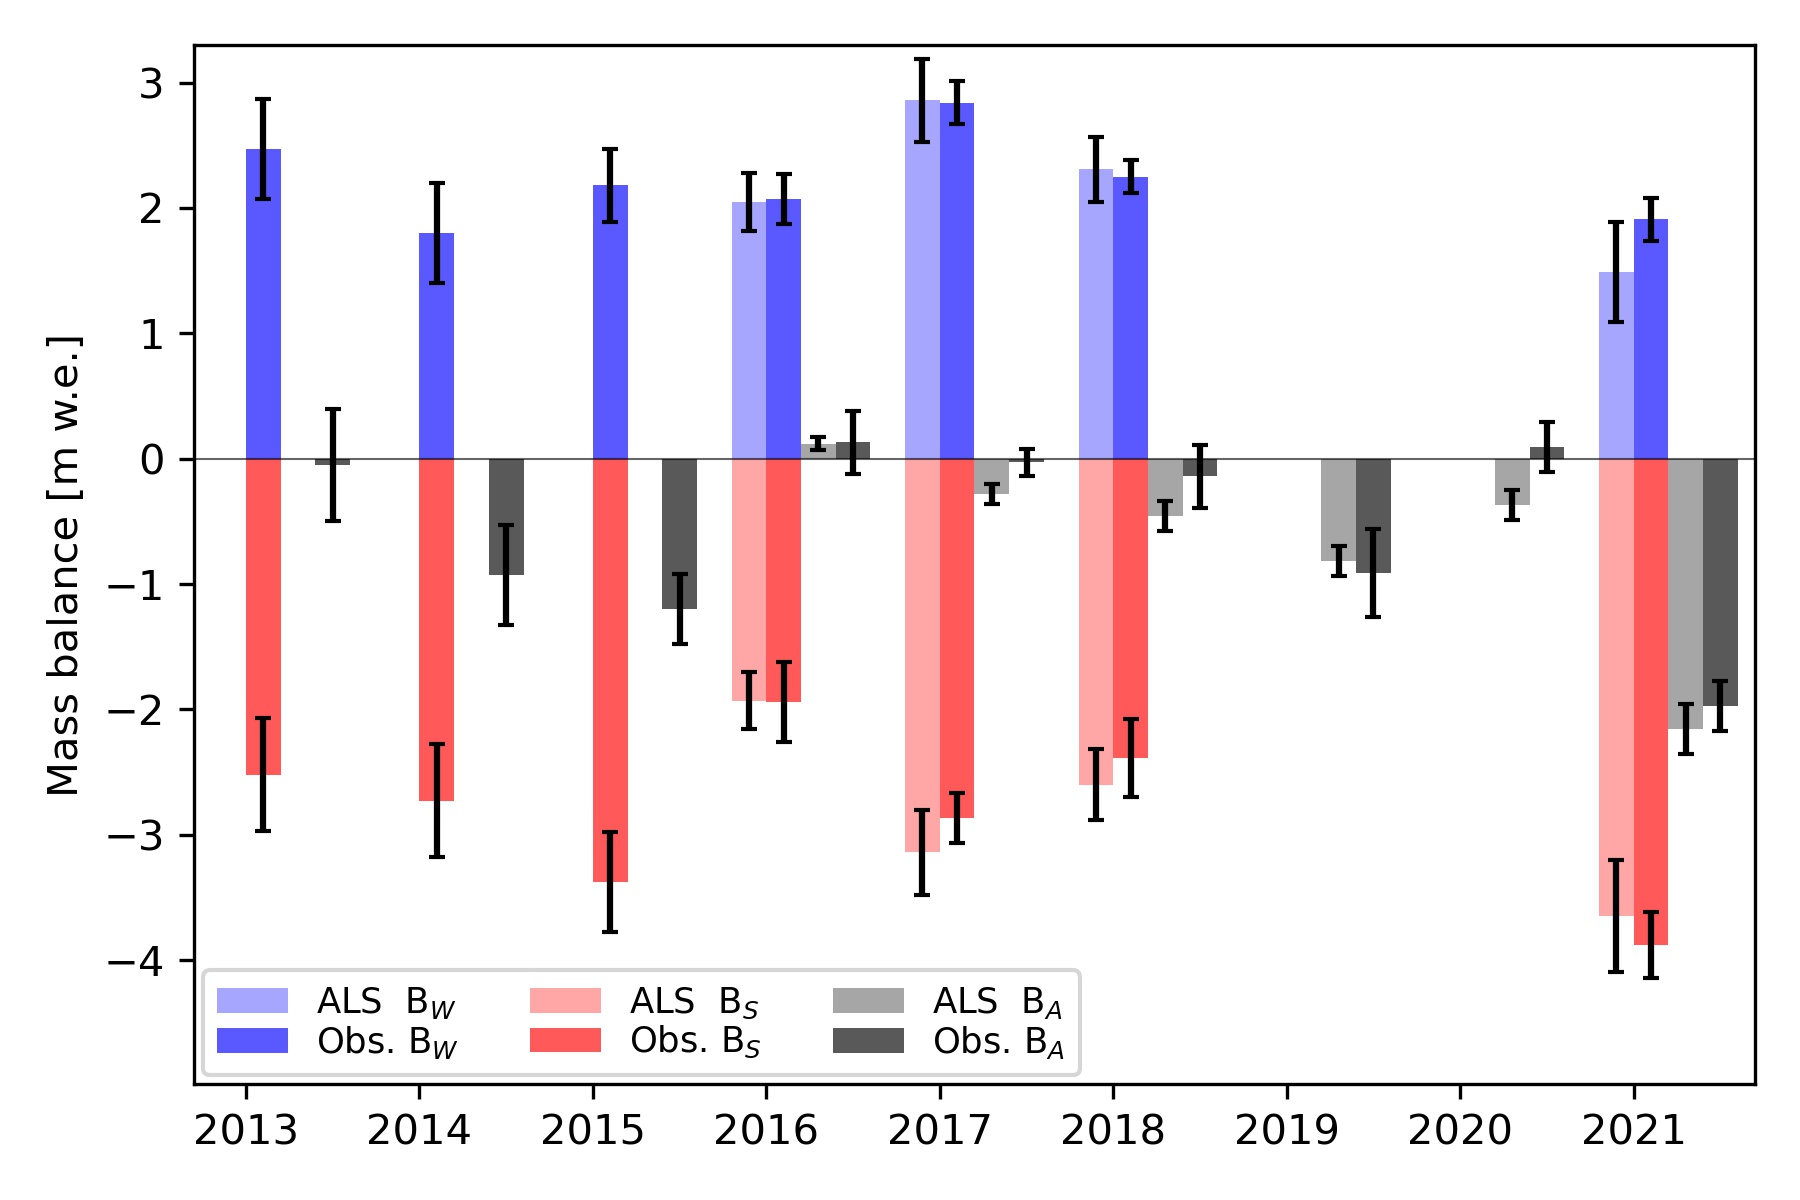
Seasonal and annual mass balance for Kokanee Glacier from LiDAR and glaciological measurements for each balance year from 2013 to 2021 with 2σ uncertainties.
In 2017, I visited the Kokanee Glacier to measure it’s ice thickness using ice-penetrating radar. I found that the glacier on average was 43 m thick using my measurements to tune a glacier model. I published these results in the Journal of Glaciology (Pelto et al. 2020). In the five years since that work, the glacier has lost over 4.8 m of total thickness. That equates to a loss of over 11% of its total volume. 2021 alone wasted away 6% of the glacier’s total volume — an eye-watering number for a single year.
Cumulative mass balance for Kokanee Glacier 2013-2021 from both field and LiDAR measurments. LiDAR-derived mass balance began in 2016.
The heat of 2021 was an outlier, but years like 2021 and 2015 take a toll on the glaciers. Currently, glaciers in western North America are losing around 0.75 m of thickness per year (according to my work in the Columbia Basin (Pelto et al. 2019) and work by Brian Menounos for all of western North America (Menounos et al. 2018)). The better years for Kokanee Glacier (2016 mass balance: +0.12 m w.e.) pale in comparison. That meager surplus was lost the very next year (2017).
Herein lies the issue, positive mass balance years in recent decades are not large enough to offset even average years; hot dry summers take years off the lifespan of glaciers across western North America.
Losing 6% of it’s total volume in 2021, the best we can hope for Kokanee Glacier is a few near-neutral or positive mass balance years to cover back up the exposed firn, to keep the glacier albedo from becoming too dark and increasing the rate at which ice can melt.
The video is of a single day of field work on Rainbow Glacier on 8-7-2018. This was our 702nd day of fieldwork during the project that began in 1984. On this day the field team consisted of Mariama Dryak, Erin McConnell, Jill Pelto and Mauri Pelto. Rainbow Glacier is a valley glacier on the northeast flank of Mount Baker, a stratovolcano and the highest mountain in the North Cascade Range, Washington. The glacier begins at a saddle at 2200 m sharing a divide with Mazama and Park Glacier. The glacier descends from the saddle through an icefall at 1950 m into the Rainbow Creek valley terminating at 1400 m. The consistent accumulation area extends from 1800 m to the saddle region above 1950 m. The glacier tongue features a deeply incised supraglacial stream channel. From 1984-2018 cumulative mass balance loss has exposed several bedrock knobs along the southern margin of the glacier.
Runoff from the glacier drains into Baker Lake, a reservoir for the Baker Dam hydropower facilities that have a generating capacity of 215 MW. Rainbow Glacier advanced during the 1950-1979 period building a terminal moraine. At the time of the first field season in 1984 the glacier was still in contact with this moraine. From 1984-2018 the glacier has retreated 620 m. In 2018 the mass balance was -0.53 m.
Terminus of Rainbow Glacier in 2018
Figure 1 is a map of the Rainbow Glacier indicating the mass balance measurement network.
Mass balance map of Rainbow Glacier in 2017 with mass balance isoline in m of water equivalent (Map by Ben Pelto)