The 2024 field season was our 41st, from the glaciers perspective it was the fourth consecutive year of exceptional mass loss, leading to thinning, retreat and glacier loss. Below are images from the field season and reflections on each from the varied perspectives of our field team and field partners.

Jill Pelto: During the field season our typical day involves getting up with the sun and working out on a glacier until early evening. Going to Coleman Glacier on Mt. Baker this year was special because we got to work on it during golden hour, a rare thing to experience. We had the glacier to ourselves, and the nearby big camping area — despite this being a popular destination for ice climbers. This is only my third time in sixteen years working on this glacier, and its significant loss since we last saw it in 2019, when I sat and painted on it, was so apparent. But in spite of that, I was feeling joyful to be there — something about four of us out there on our own taking measurements as the summer sun set was so magical. I was so grateful to be there at that moment and experience this landscape as it is now.

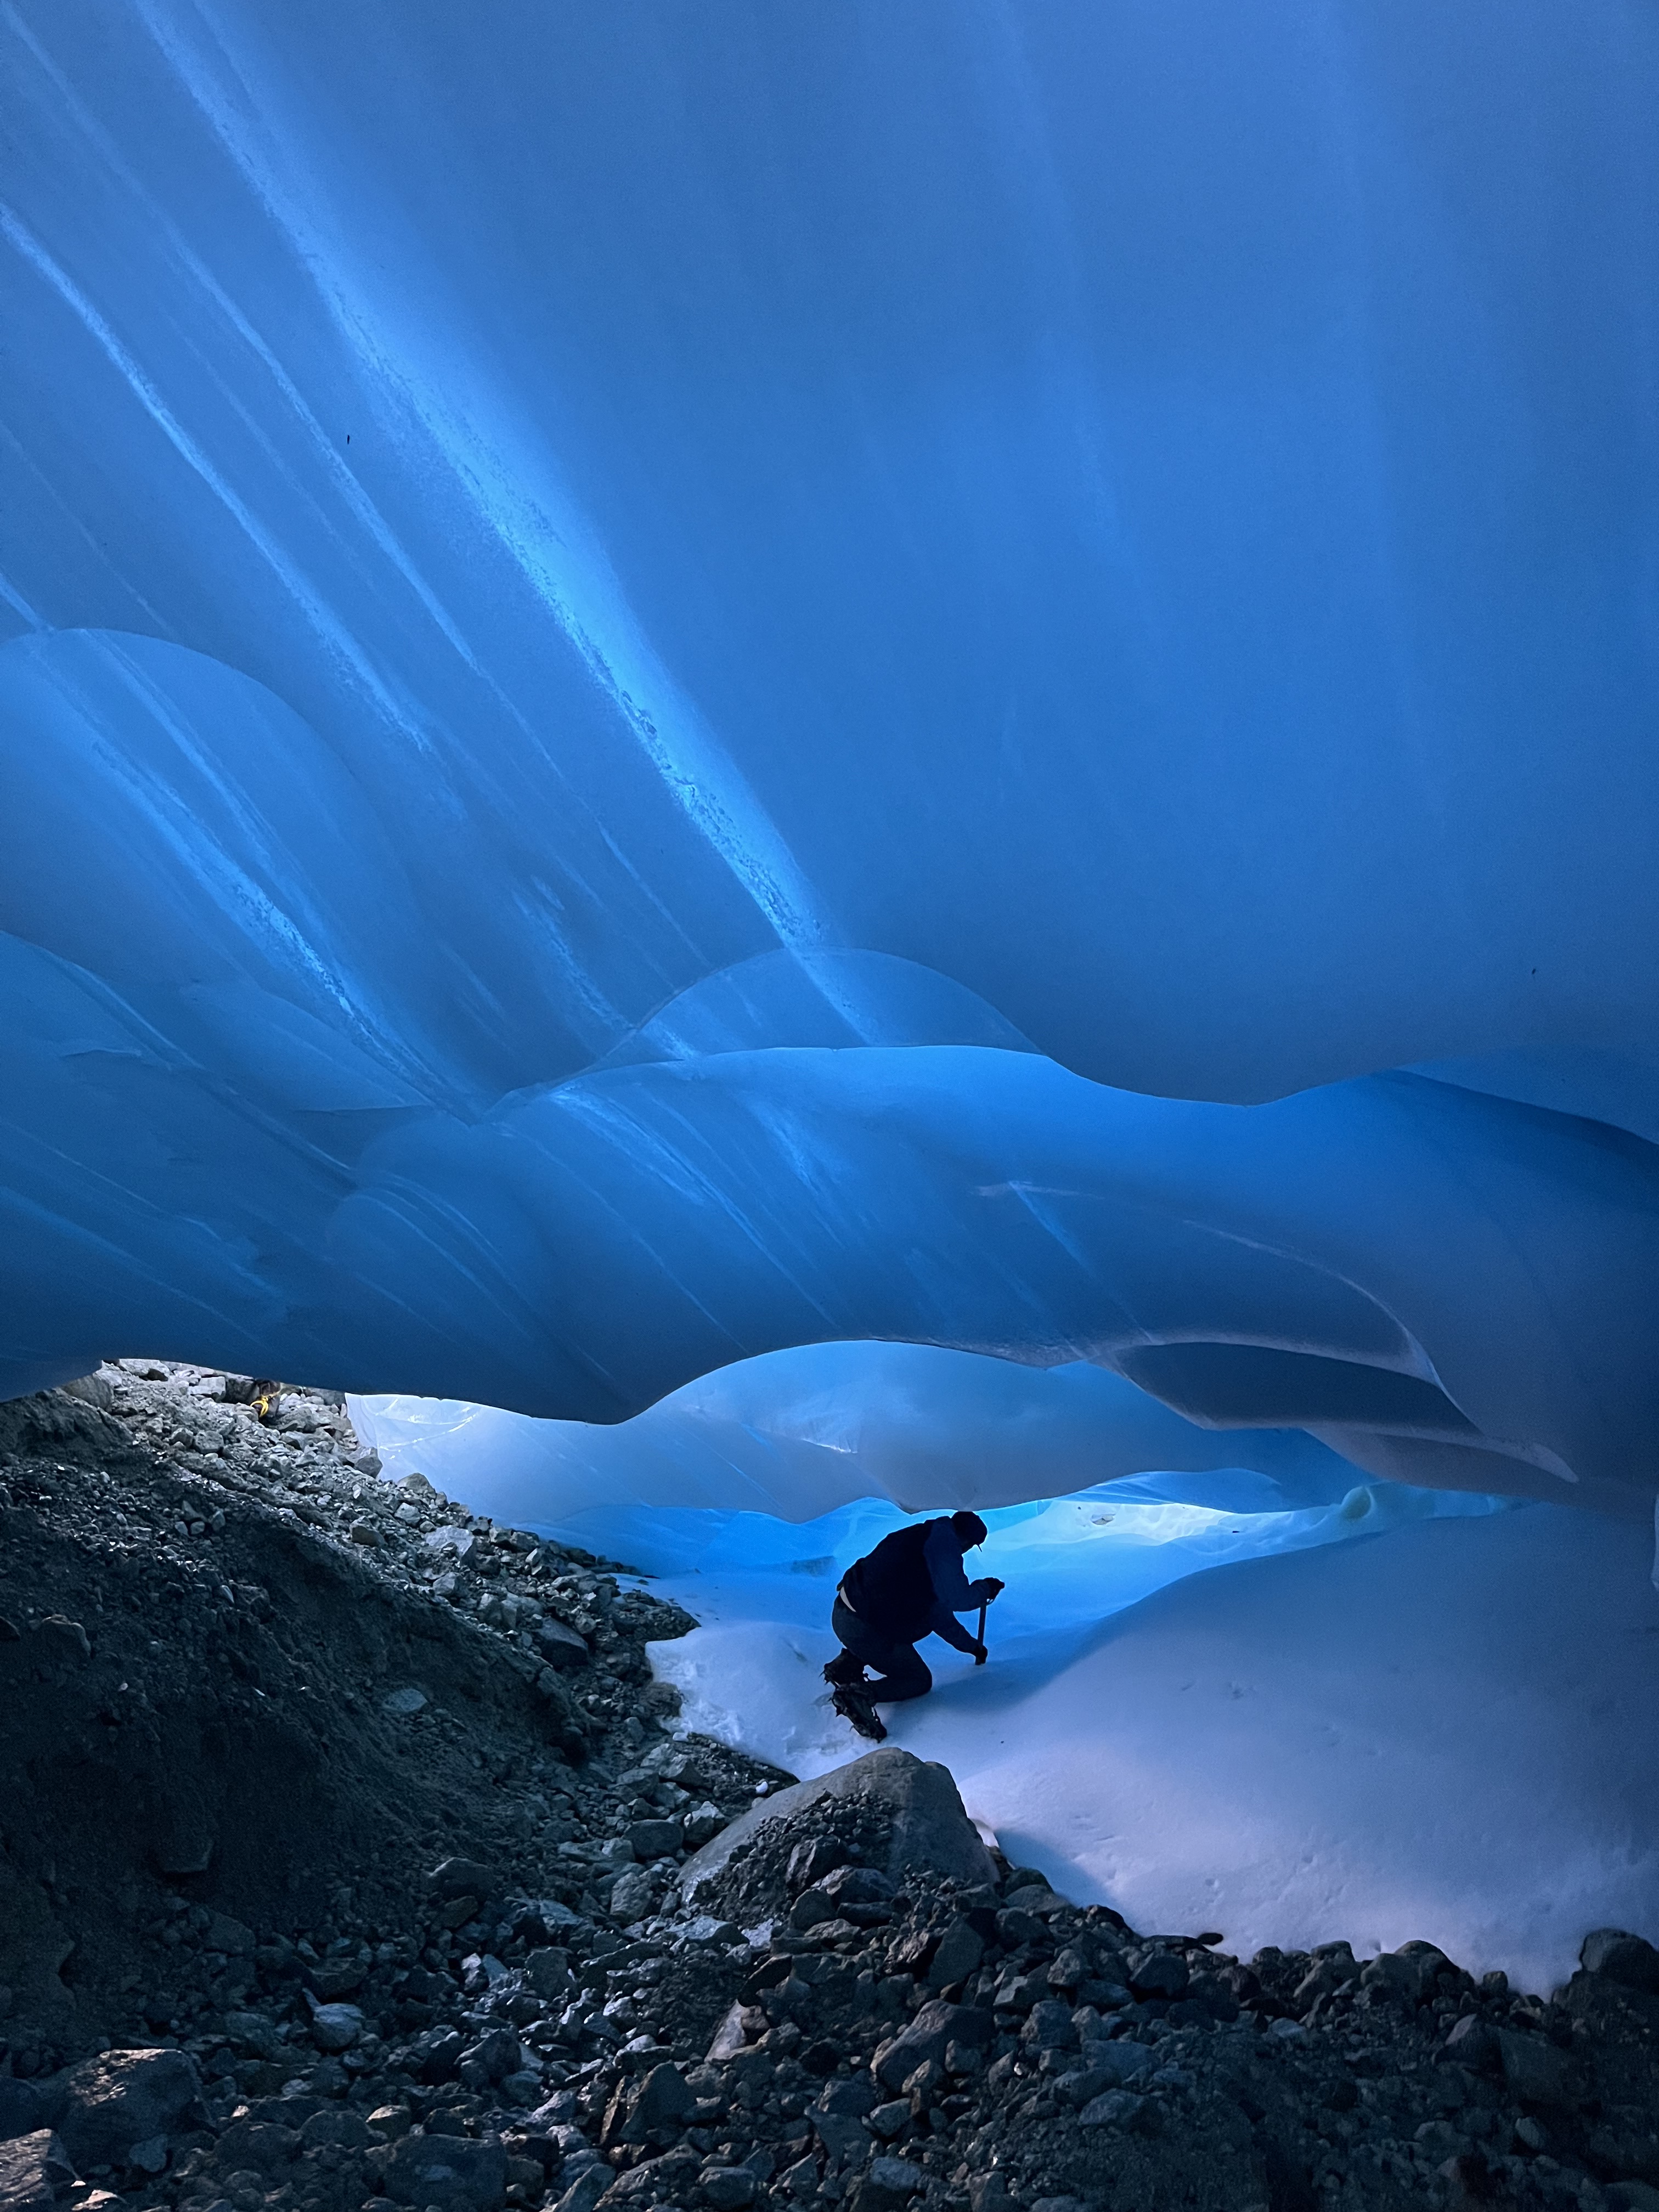
Mauri Pelto: Climate change has led to increased glacier melting on all of the glaciers we have observed. A combined 70+ years of field experience that Ben, Jill and I have provides a context that is crucial. The increased melt is apparent in the streams flowing across the surface very few meters carrying meltwater to the rivers and then the sea. This summer we saw the beauty of the final stages of decay of a glacier melting away in the ice caves that transected the former Ice Worm Glacier (image below). The cave started at the top of the glacier and continued right to the bottom, by next summer that too will be gone. The colors and atmosphere in the cave were spell binding. The landscape remains beautiful, but is losing the glaciers that are a powerful, beautiful and dynamic part of this landscape.
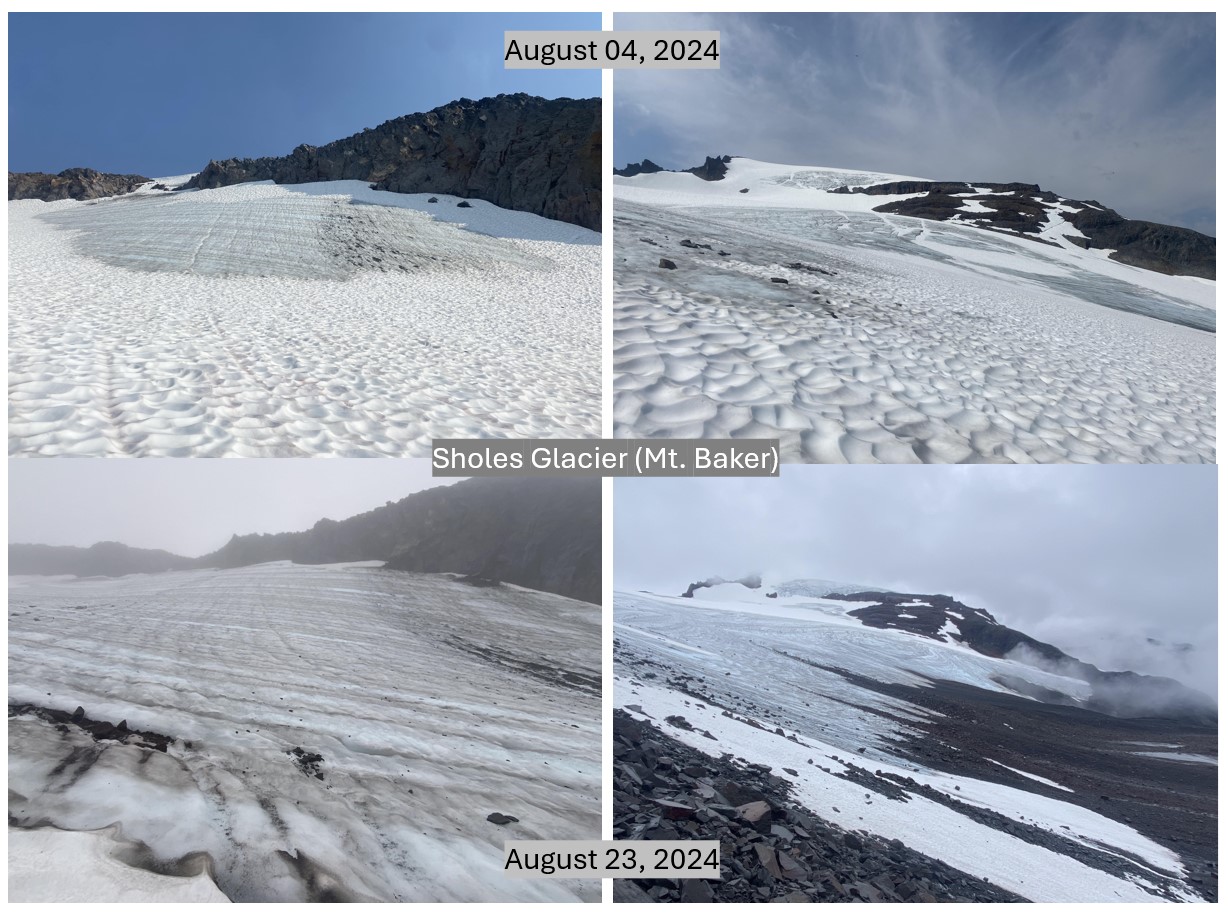
Katie Hovind: Nestled along Ptarmigan Ridge, overlooking Kulshan’s glacier-flanked slopes, was our longest campsite of the field season. Unzipping my tent to an increasingly familiar skyline four mornings in a row, I found myself developing a relationship with this place. I noticed patterns and changes alike, discovering not just the place but a sense of home in it. We followed transects across the Sholes, probing up and down the glacier; we explored a collapsed ice cave near its terminus, blue ice towering over me, ancient wisdom frozen in the dripping layers I ran my hands along; we took water measurements from the stream it feeds, pausing for a break next to the fresh melt as I sketched the textures of rock and snow and ice. We commuted across it twice to the Rainbow Glacier, a trek familiarizing me with the Sholes’ sweeping slopes and views; and we screwed an ice auger deeper than we could see, dropping stakes 3-4 feet below the surface. 19 days later, I returned to the coordinates of those four stakes, which were now all exposed, one sticking up to just over 3 feet above the surface. Reeling as I walked across the glacier I’d gotten to know, the near-incomprehensible volume of loss I saw. A feeling of belonging is so integral to caring. And then comes the question of how to transmit that connection, to spread to others the same sense of responsibility to protect a place? Being lucky enough to experience even a handful of days taking in just a small degree of the Sholes’ nuances, I felt deeply just how wrong and quick the melt is. But from the outside looking in, without any prior reference points, the severity of the glacier shrinking could be overlooked. Through these comparison photos, I hope to share just a glimpse, beauty and grief and all, of what it means to understand and love a glacier.
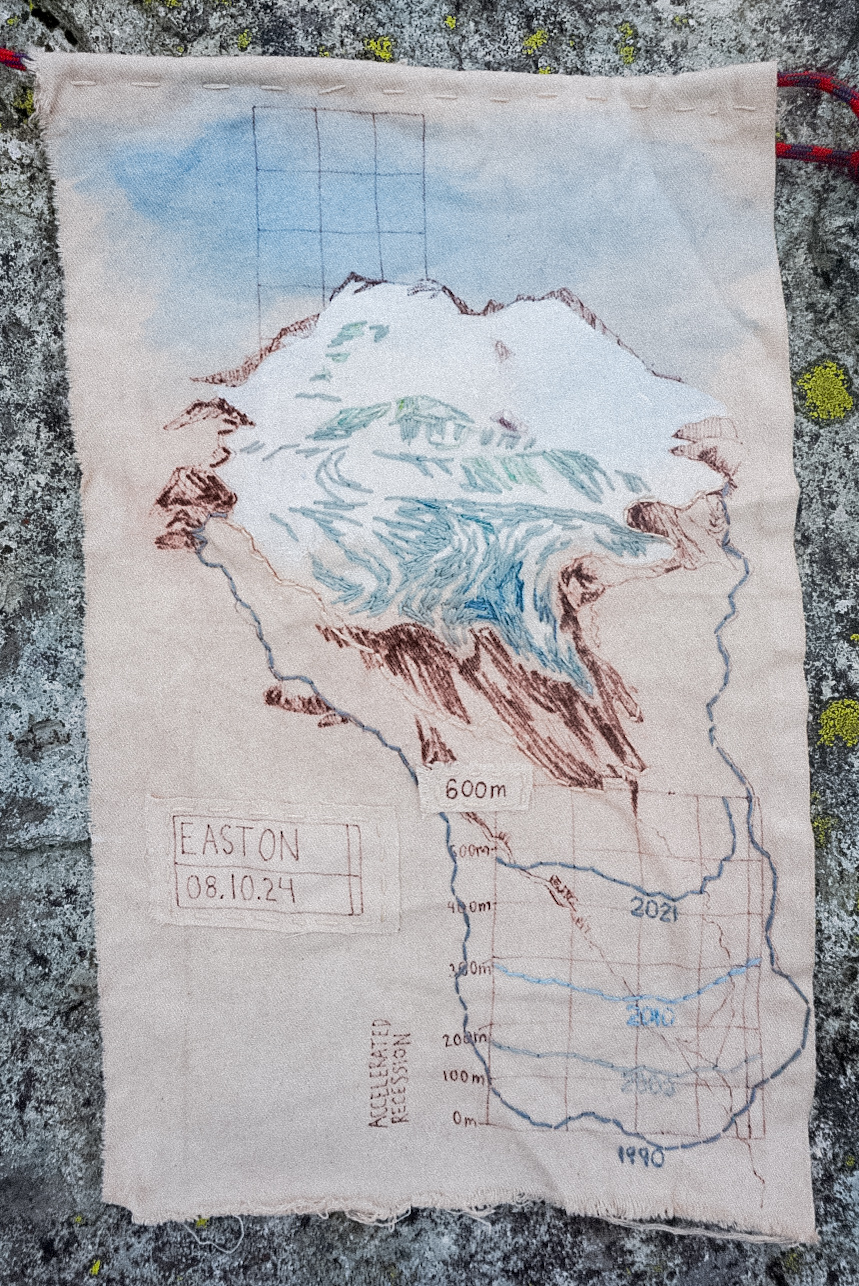
Emma Murray: Just a few minutes into our hike from camp to the Easton glacier, Science Director Mauri Pelto pointed out the rock that marked the spot where he put his crampons on in 1990. Looking up the valley, the ice felt SO far away. This glacier has retreated almost 600m in my lifetime already. In response to the melting at each of the six glaciers I visited during my time with the Project, I added paint, pen, and thread to canvas. These flags are both white-flag surrenders to all the melting we cannot stop and blowing-in-the-wind prayers for us all to act in the ways we can. I hope these pieces help people to visualize and feel the difference between where the ice was and where it is now. I think feeling that loss is groundwork for our urgent conversations about climate solutions, which can be uplifting and cool and pragmatic and creative!

Shari Macy: Mauri Pelto, peers into the melting terminus of the Lower Curtis Glacier; located on the southern slopes of Mount Shuksan in the North Cascades of Washington State. As founder of the North Cascade Glacier Climate Project, he has been measuring these shrinking giants since 1984. This image, to me, shows a man and what he dedicated his life to studying. A passion that drove him to spend over 700 nights in tents, camped out next to the glaciers of the North Cascades. These glaciers could use a lot more people like Mauri. Does everyone need to backpack to remote glaciers every summer? No. He already does. However, we could all be a little more dedicated to the health of our planet, our home. Our one and only. Our children’s one and only.
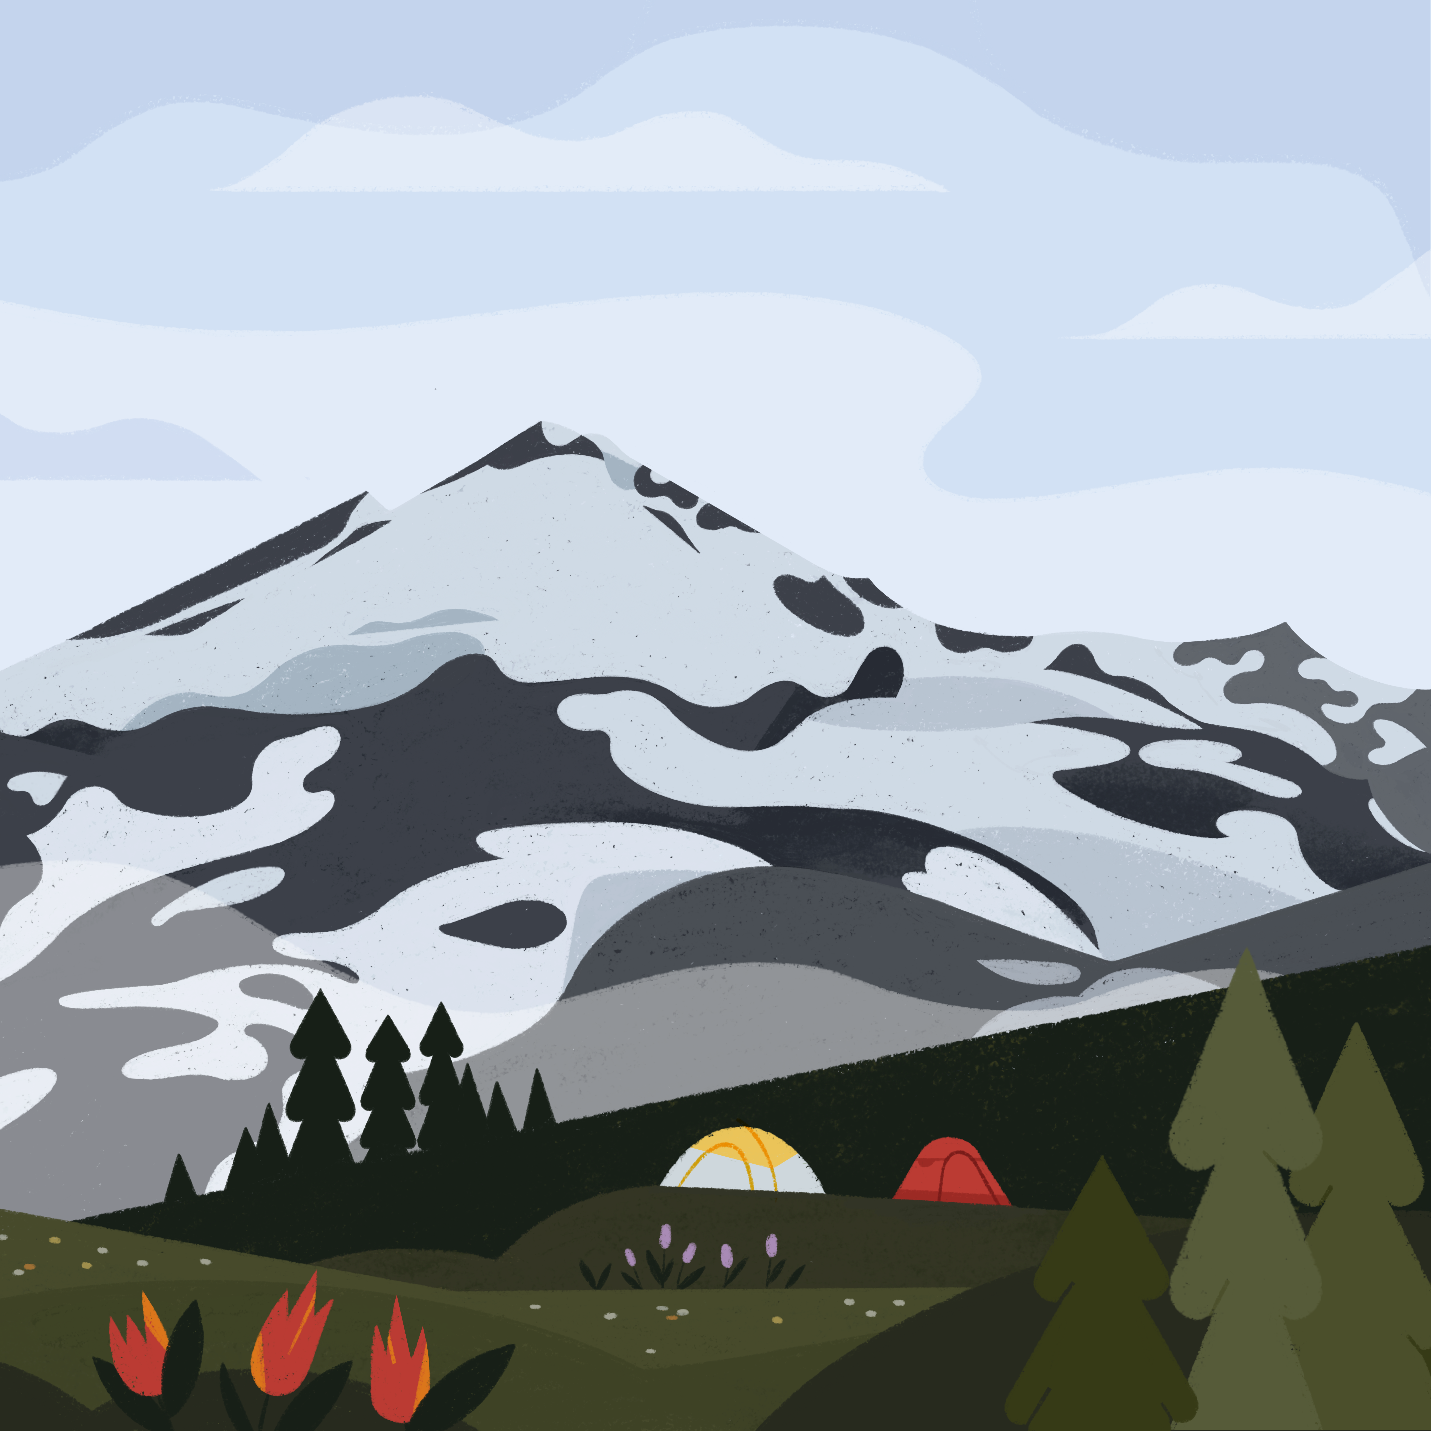
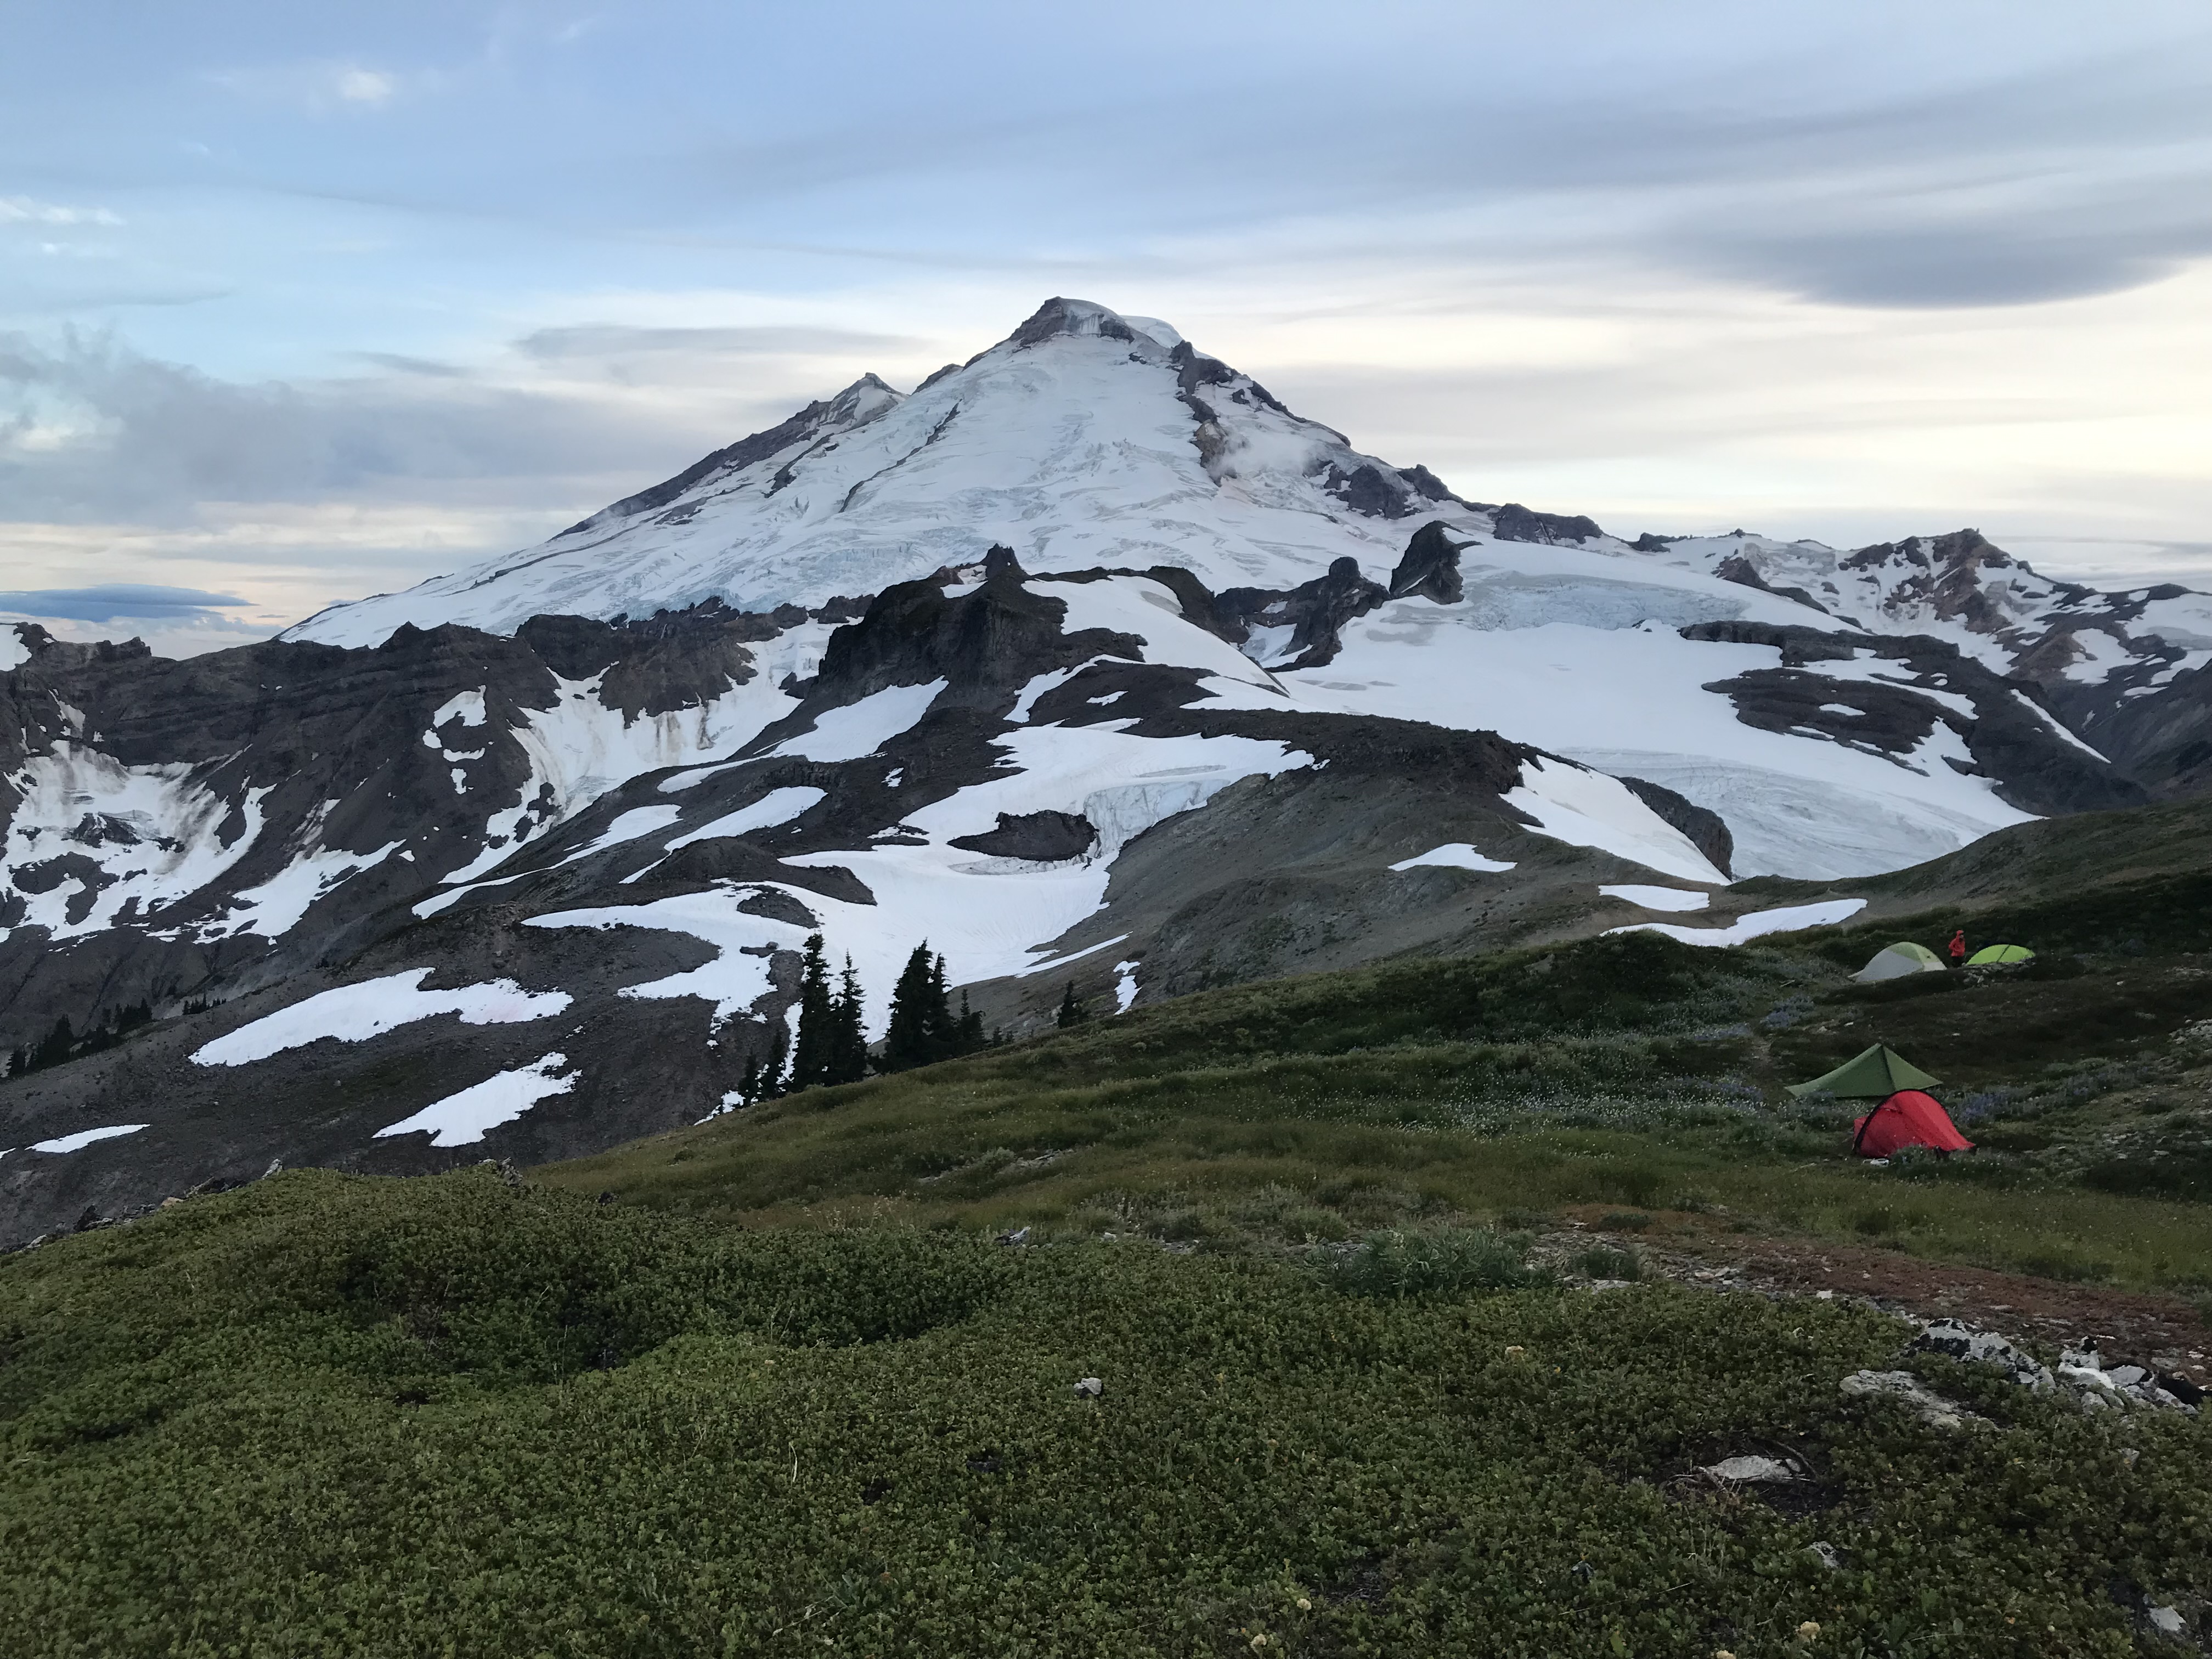
Megan Pelto: To me, Mt. Baker represents the North Cascades. Camping next to its looming presence makes me aware of how impactful it is, its glaciers helping support the ecosystem and the wildlife that surround it. Getting to be present in this wilderness feels like a gift and a chance to both disconnect and reconnect. Everything you have is contained in one little tent and the experience of camping in this landscape is magical. I wanted to capture that with our colorful little tents tucked into grassy hills with Baker above us. I have been able to visit this landscape over the past 10 years, and while the glaciers change each year, many things have remained peacefully the same.

Ben Pelto: Disappearing glaciers remind me of grandparents—I’m saddened by their decline, yet deeply grateful for the time I still have with them. This year, being in the field was especially meaningful, surrounded by an incredible group of people, just experiencing the mountains and soaking it all in. What I find hardest about glaciers vanishing is not just the loss of ice, but the disappearance of their dynamism and beauty from the landscape. These ancient giants bring a sense of magic and power to the mountains, and it breaks my heart to think that my children or grandchildren might never witness them as I have.

Cal Waichler: This season I ask what it means to be a voice for glaciers. How can I transmit my gratitude that I can stand on this earth, breathe glaciers’ breezes, seep in icy blue and alpenglow rose, pop alpine huckleberries in my mouth, and notice the shrinking snow and dissolving ice, while also alerting people to their vulnerabilities? Glaciers are a throughline in my explorations and art. I am so utterly enchanted by them. The awe and creative inspiration they bring to my life is a great gift. As a voice for shrinking glaciers, what stories can I share that will enchant other people with them? What will make us care enough to enact climate change mitigation and adaptation, and vote for climate leaders? Here, a snapshot of those most transient and irreplaceable things.