West Ganglung Glacier, Tibet Glacier Loses 20% of Length

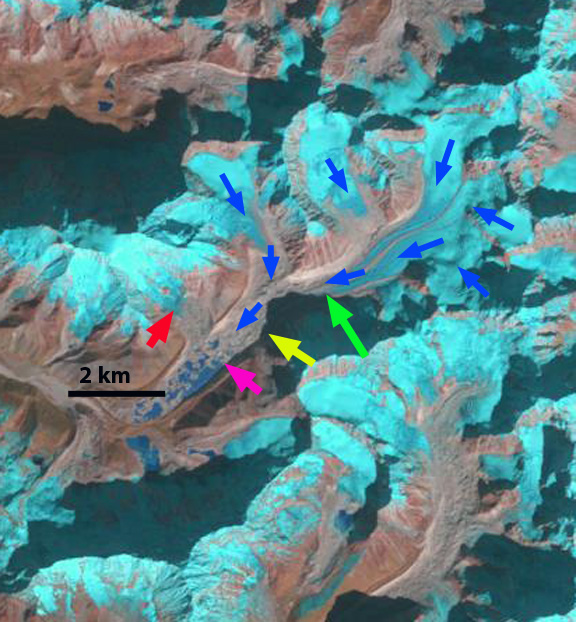
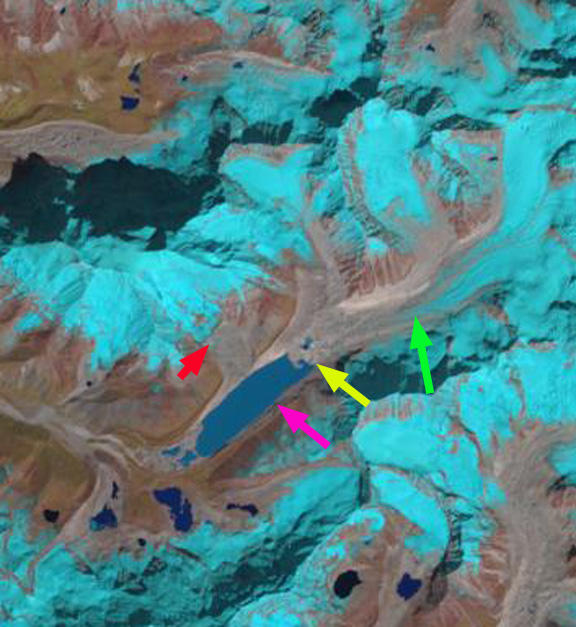
Landsat image comparison from 1991, 2001 and 2016 of West Ganglung Glacier, red arrow is the 1991 terminus, yellow arrow the 2016 terminus, green arrow the eastern glacier proglacial terminus lake and purple arrow expanding zone between a former tributary and West Ganglung Glacier

West Ganglung Glacier is on the China-India border 6 km west of Ganglun Grangri Peak meltwater enters the Sultej River and then Mapam Tso.  the glacier terminates in a proglacial lake at 5200 m with its head on the border at 5750 m. This region is part of the Indus Basin, the second China glacier inventory noted a 23% decline in glacier area from 1970 to 2007 (Guo et al 2015) Assessing the sensitivity of the Sutlej River basin to climate change Miller et al (2012) noted that with a warmer climate melt contributions from lower parts are reduced because of decreased snow cover and a shorter melting season.  Significant glacier area loss will also lead to less runoff despite an increase in rate. Singh et al (2012) noted a decline in runoff from the Sutlej basin after 2000, whereas there had been a rise before that. 

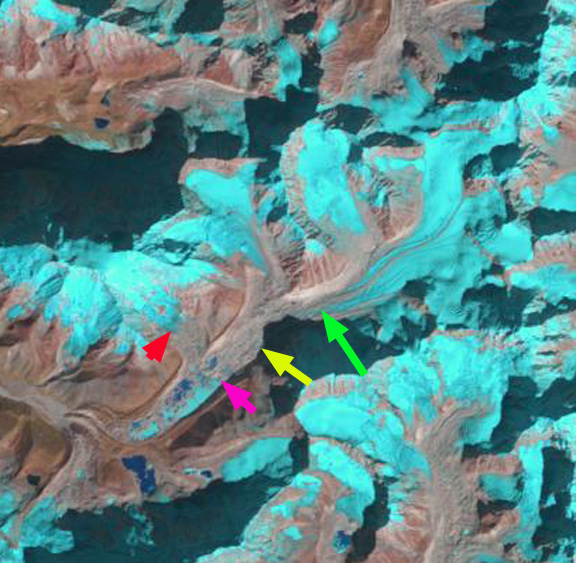
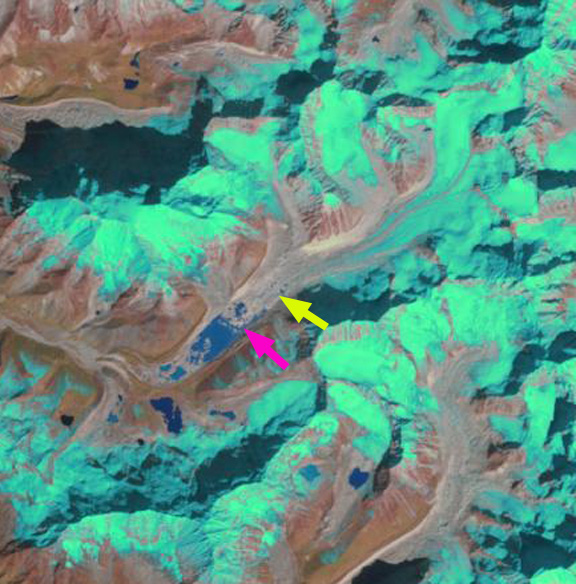
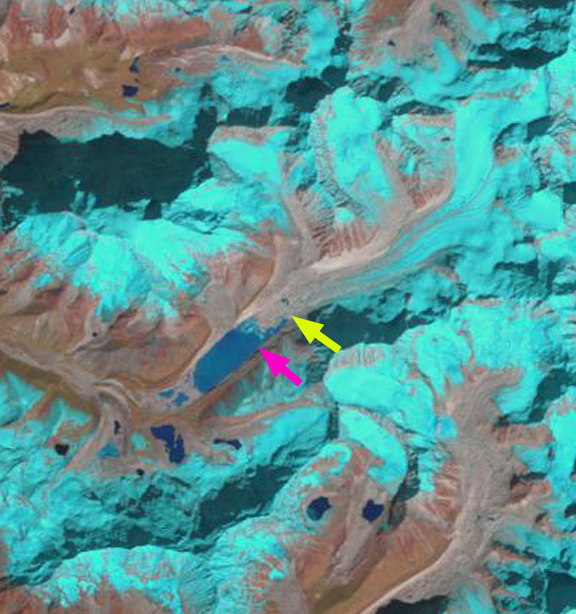
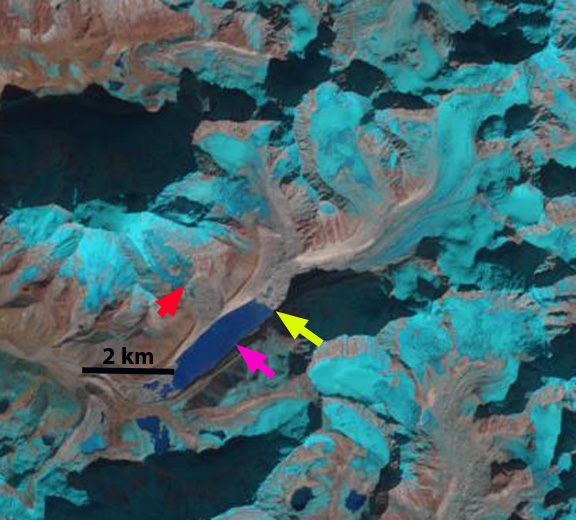
Here we examine teh unnamed West Ganglung Glacier change from 1991 to 2016 in a series of Landsat images. In 1991 the glacier terminates at the red arrow, and the lake is 1050 m long. At the glacier just to the east there is a small proglacial lake 200 m long. By 2001 glacier retreat had led to lake expansion to 1400 m long. The proglacial lake at the end of the eastern glacier is now 350 m long. By 2016 the proglacial lake at the terminus had expanded to a length of 1850 m, a retreat of 800 m in 27 years.  The proglacial lake at the terminus of the eastern glacier in 2016 is 650 m long, indicating a retreat of 450 m.  In both case the retreat is a significant loss of overall glacier length, ~20%.  The purple arrow indicates the increasing separation between a tributary and the West Ganglung Glacier glacier.

Google Earth image of West Ganglung Glacier, red arrow is the 1991 terminus, yellow arrow the 2016 terminus, green arrow the eastern glacier proglacil terminus lake and purple arrow expanding zone between a former tributary and West Ganglung Glacier


Landsat image from2014 of West Ganglung Glacier, red arrow is the 1991 terminus, yellow arrow the 2016 terminus, and green arrow the eastern glacier proglacial terminus lake.

Lumding Glacier Rapid Retreat, Nepal 1992-2016

Landsat comparison of Lumding Glacier terminating in Lumding Tsho. Red arrow on each Landsat image indicates 1992 terminus and yellow arrow 2016 terminus location.

Lumding Glacier, Nepal terminates in Lumding Tsho, a proglacial lake, in Dudh Khosi Valley in the Mount Everest region of Nepal. This lake poses a hazard for a glacier lake outburst flood in the Dudh Khosi valley. The lake expansion results from retreat of the Lumding Glacier. International Centre for Integrated Mountain Development (ICIMOD) study examined the changes in Lumding Tsho from 1962-2000 and found the lake grew from 0.2 km2 in 1962 to 0.77 km2 in 2000. ICIMOD has an ongoing specific focus on assessing glacier lake outburst flood potential. The lake growth was the result of a retreat of 40 meters/year from 1976-2000 and 35 meters/year from 1962-2007, as noted in figure below from Bajracharya  & Mool (2009). Here we update the changes to 2016 using Landsat imagery.

The lake begins at the end of the heavily debris covered Lumding Glacier draining east from Numbur Himal . Red arrow on each Landsat image indicates 1992 terminus and yellow arrow 2016 terminus location. The lake was 1675 meters long in 1992, 1950  meters long in 2000, 2350 meters long in 2009 and 2800 meters in 2016. This 1100 m retreat in 25 years is a retreat rate of 45 meters/year. The lake at 2.8 km in length now has an area of over 1 square kilometer. The glacier is fed largely by avalanching off the flanks of Numbur, blue arrows. King et al (2017) noted a mean mass balance of all 32 glaciers examined in the Mt. Everest region from 2000-15 was  −0.52  water equivalent per year. The mean mass balance of nine lacustrine terminating glaciers, like Lumding Glacier, was 32 % more negative than land-terminating debris-covered glaciers.  An additional problem for the glacier in the future is the retreat of the terminus of the tributary glaciers that avalanche onto the lower Lumding Glacier. The yellow letter A in the 2016 Sentinel images indicates the retreat of a feeder glaciers, 300 m since 1992.  The lower section of the Lumding Glacier is heavily debris covered, noted best in Google Earth image, which insulates the underlying ice, reducing melting and retreat. This also indicates the avalanche source of much of the accumulating snow and ice. The increased distance to the feeding snow and ice slopes will reduce this input.  The two blue arrows indicate plumes of glacier runoff into the lake.  This glacier loss in mass driving the retreat is like that on Hinku Nup Glacier and Middle Lhonak Glacier

A 2016 Sentinel image of Lumding Glacier with avalanche paths shown by blue arrows, and retreating tributary above Point A.

Google Earth image of Lumding Glacier front.  This illustrates the debris cover and also meltwater plumes entering lake. 

Samudra Tapu Glacier, India Accelerated Retreat 1998-2016

samudra-tpa-compare

Landsat Comparison from 1998 and 2016 of Samudra Tapu Glacier, India.  Red arrow is the 1998 terminus, yellow arrow the 2016 terminus, green arrow a subsidiary glacier tongue, red line and dots the snowline and pink arrow an area indicating a water level decline in the lake. 

Samudra Tapu Glacier is one of the largest in the Chenab Basin, India. Maanya et al (2016) indicate the glacier terminates at 4150 m and is 16 km long and has an area of 62.5 square kilometers. In a glacier inventory in the basin by Kulkarni et al (2007) the 466 glaciers in the basin were observed to have lost 21% of their total area from 1962 to 2001. This study coordinated by the Space Applications Centre of the Indian Space Research Organization, has combined field observations of the glacier with remote sensing to observe the changes in area and length of the glaciers. The Chenab River also provides 690 MW of hydropower at the Salal Hydroelectric Project

In this post we use 1998, 2002 and 2016 Landsat imagery to examine the terminus of this glacier.  The terminus in 1998 is in an expanding proglacial lake and the snowline is at 5200 m.  In 2002 the glacier has retreated a short distance since 1998 and the snowline is at 5300 m.  Note that the smaller glacier tongue at the green arrow is disappearing. An October 2016 image indicates a further lake expansion and a glacier retreat of 600 m since 1998.  The lake level has also fallen as evident by the expansion of peninsula areas in the lake, pink arrow. A Sentinel 2 image from November 11, 2016 indicates the snowline is higher than in October or during the other years observed at 5400 m. The lower glacier is heavily debris covered, has a low slope and is essentially stagnant in its lowest 1 km, note image below from Anil Kulkarni. These factors will lead to continued retreat. There are some remarkably long supraglacial streams, the longest is 3.5 km long, that further illustrate the slow velocity of the lower glacier.  This is in a region where ice thickness is 100-200 m, see image below  Maanya et al (2016). Neither glacier is at the end of the melt season.   The glacier at the green arrow has retreated well upvalley from the green arrow.  This glacier is not calving into a lake and is retreating faster than Samudra Tapu.  This suggests that the debris cover is reducing melting more than the lake is enhancing melting. In November 2016 the snowline is at 5400 m.  An ELA of 5300+ meters leaves an accumulation area insufficient to maintain the current glacier size. In 1970 the ELA was at 4900 meters Kulkarni et al (2007) .  The retreat of Samudra Tapu is noted by Kulkarni (2006) as 20 meters/year during the 1962-2000 period. From 1998 to 2016 the glacier retreated nearly 600 m, closer to 30 meters/year. The retreat of this glacier is less than that of other large glaciers nearby Sara Umaga and Gangotri, but similar to Durung Drung Glacier.

samudra-tupa-sentinel-11-11-16

Sentinel 2 image from 11/11/16.  Red arrow is the 1998 terminus, yellow arrow the 2016 terminus, red dots the snowline.

sumadra-tupa-2002

Landsat image from 2002.  Red arrow is the 1998 terminus, yellow arrow the 2016 terminus, green arrow a subsidiary glacier tongue, red  dots the snowline.

sumadra-tupa-kulkarni-300x224

Image of the debris covered stagnant terminus of Samudra Tapu from Anil Kulkarni taken in 2006

samudra-tupa-supraglacial


samudra-tupa-depth

The above figure is from Maanya et al (2016).

Laigu Glacier, China Retreat Lake Expansion

laigu-compare

Landsat image comparison of the Laigu Glacier in 1988 and 2015.  The red arrow indicates the 1988 terminus and the yellow arrow the 2015 terminus location.  The purple dots in 2015 indicate the snowline.

Laigu (Lhagu) Glacier, China is in the Kangri Karpo Mountains of the Southeast Tibet Plateau and drains into the Salween River.  This is the largest glacier in its region at 32 km in length.  The glacier terminates in an expanding proglacial lake, Laigu Lake.  Here we examine changes in Landsat imagery from 1988 to 2015 to identify response to climate change. Wang and others (2011) note that glacial lakes have expanded from 1970-2009 by 19% and the area that is glacier covered has decline by 13% during the 1970-2009 period in the nearby Boshula Range. At the AGU this week research based on Landsat imagery indicates a 20% per decade velocity decline on the glacier (Landsat Science, 2016).

In 1988 Laigu Glacier terminated in the proglacial lake that was 2 km across from north to south and 1.3 km from east to west. By 2001 the lake had expanded to 1.6 km from east to west.  The transient snow line is at 4300 m.  In November, 2014 the snowline is at 4700 m. In October, 2015 the snowline is at 4700 m again.  The glacier has retreated 1900 m from its 1988 terminus along the southern shore of the expanding lake and 900 m along the northern shore.  The expansion of the lake along the southern shore is evident in the 2004 and 2014 Google Earth segmented image below, note the pink arrows.  The high snowline indicate a reduced accumulation, which reduces the flux into the ablation zone, this is evident in the reduced glacier velocity noted by Dehecq (2016).  The reduced velocity will lead to a continued retreat of the glacier and expansion of the lake. This region has experienced a sustained rise in summer temperatures (Wang and others, 2011).  The snowlines remaining high into November indicates warmer conditions in the post summer monsoon season also.  The high snowlines and lake expansion due to glacier retreat is a familar story in the region, Chutanjima Glacier and Menlung Glacier.

laigu-2001

Landsat image comparison of the Laigu Glacier in 2001.  The red arrow indicates the 1988 terminus and the yellow arrow the 2015 terminus location. The purple dots in 2001 indicate the snowline.

laigu-2014

Landsat image comparison of the Laigu Glacier in 2014.  The red arrow indicates the 1988 terminus and the yellow arrow the 2015 terminus location.  The purple dots in 2014 indicate the snowline.

laigu-ge

Google Earth image of the region indicating the lake expanding from the pink arrow at right to the pink arrow at left from 2004 to 2014.boshula-climate

Summer temperature rise form Wang and others (2011)

Bailang Glacier and Angge Glacier Retreat, China 1995-2015

bailang compare

Comparison of 1995 and 2015 Landsat image illustrating 1995 (red arrows) and 2015 terminus locations (yellow arrows) of Bailang Glacier (B) and Angge Glacier (A).  Purple arrows indicate areas upglacier of expanding bedrock due to glacier thinning. Head of Chubda Glacier (C), Bhutan indicated. 

Bailang Glacier and Angge Glacier, China are adjacent to the Chubda Glacier, Bhutan.  Despite being in a different nation on a different side of the Himalaya, the behavior is the same. These are both summer accumulation type glaciers that end in proglacial lakes.  Both lakes are impounded by broad moraines that show no sign of instability for a potential glacier lake outburst flood. The number of glacier lakes in the adjacent Pumqu Basin to the west has increased from 199 to 254 since the 1970’s with less than 10% deemed dangerous  (Che et al, 2014) Here we compare Landsat images from 1995 and 2015 to identify their response to climate change.   The second Chinese Glacier inventory (Wei et al. 2014) indicated a 21% loss in glacier area in this region from 1970 to 2009.

Bailang Glacier in 1995 terminated in a proglacial lake that was 2.1 km long at an elevation of ~5170 m, red arrow. Angge Glacier terminated in a lake that was 1 km long at an elevation of ~5020 m.  By 2001 both glaciers had experienced minor retreat of less than 250 m.  By 2014 both lakes had expanded considerably due to retreat, no significant change in water level had occurred. By 2015 Bailang Glacier had retreated  800-900 m and the lake was now 3 km long.  A key tributary on the west side near the yellow arrow had also detached. There is no significant slope change in the lower 1 km of the glacier indicating retreat should continue enhanced by melting in and calving in the proglacial lake.  For Angge Glacier retreat from 1995 to 2015 was 700 to 800 m, with the glacier retreating to a westward bend in the lake basin.  The glacier has an icefall just above the current terminus suggesting the lake basin will soon end, which should slow retreat. The pattern of retreat and lake expansion is quite common as is evidence by Gelhaipuco, Thong Wuk and Longbashaba Glacier.

bailang glacier 2001

2001 Landsat image illustrating 1995 (red arrows) and 2015 terminus locations (yellow arrows) of Bailang Glacier (B) and Angge Glacier (A).  Head of Chubda Glacier (C), Bhutan indicated. 

bailang glacier 2014

2014 Landsat image illustrating 1995 (red arrows) and 2015 terminus locations (yellow arrows) of Bailang Glacier (B) and Angge Glacier (A).  Head of Chubda Glacier (C), Bhutan indicated. 


Kanchenjunga Glacier, Nepal Volume Losses

kanchenjunga compare
Figure 10-16. Kanchenjunga Glacier (K) from 1991 to 2015, green arrows indicate locations of enhanced supraglacial lakes since 1991. Purple arrow indicates areas of thinning at higher elevations in the region. Location 2 is the main junction area. 

Kanchenjunga Glacier is the main glacier draining west from Kanchenjunga Peak, also listed on maps as Kumbukarni. The glacier is similar to Zemu Glacier flowing east from the same mountain into Sikkim, in the heavy debris cover that dominates the glacier in the ablation zone extending from the terminus for 15 km and an altitude of 5600 m. Identifying the retreat is difficult due to the debris cover. Racoviteanu et al (2015) examined glaciers in this region using 1962 and 2000 imagery. They found area losses of 14% for debris covered glacier and 34% for clean glaciers. The debris covered glaciers terminus response is even more muted indicating why terminus change is an easy measure of glacier change but not always the best. For Kanchenjunga Glacier Racoviteanu et al (2015) indicate the glacier area declined by just 4-8% from 1962-2000.

What is apparent in the Landsat images at the green arrows is the increase from 1991 to 2015 of supraglacial lakes. Also features of thinning are evident in the mid reaches of the glacier, purple arrows, where tributaries have narrowed and detached from the main glacier. A closeup of the main glacier junction 12 km above the terminus indicates the number of large supraglacial lakes. These cannot form in a region where melting does not dominate over glacier motion. The Google Earth image from 2014 of the terminus area indicates a patchwork of moraine cored ice dotted with supraglacial lakes and dissected by the glacial outlet river in the lower 3 km of the glacier. This is clearly not an active portion of the glacier, it is thin not moving and does not fill even the valley floor. An overlay of images indicates the lack of motion. The heavy debris cover has slowed retreat and thinning, however, the lower glacier is poised for an increased rate of retreat with merging of supraglacial lakes, which will lead to further area losses. The Kanchenjunga Glacier is losing volume like all other 41 glaciers examined in detail and linked at the Himalayan Glacier Index page. 

kanchenjunga glacier jct

Google Earth image of the main glacier junction region (2) Supraglacial lakes in the area of at 5200 m. 


kanchenjunga glacier

Google Earth image of supraglacial lakes 2-5 km above the terminus and the region along the north margin of the glacier where the glacier is receding from the lateral moraine. 

kanchenjunga terminus

2014 Google Earth image of terminus reach.  Black arrows indicate ice cored moraine, blue arrow the lowest large supraglacial lake, 2.5 km above the terminus and red arrow the last remnant of ice. 

Midui Glacier, Tibet, China: Retreat and Terminus Collapse 1995-2014

Midui Glacier is 7 km from the G318 National Highway in China and 2 km from Midui village, hence the lake near the terminus is often visited. The glacier is near the headwaters of Yarlung Tsangpo. Glaciers in this region have experienced significant retreat and area loss as noted by the second China Glacier inventory. This compared glacier area from the 1950’s, 2002 and 2010, Liu et al (2013) noted that glacier area has declined 13%. The Midui Glacier was advancing as recently as 1964 when it emplaced an advance moraine (Xu et al, 2012).  This is a region where Li et al (2011) noted that increasing temperature, especially at altitude, the fronts of 32 glaciers have retreated, mass losses of 10 glaciers have been considerable, glacial lakes in six regions have expanded and melt water discharge of four basins has also increased. This is further documented by an inventory of 308 glaciers in the Nam Co Basin, Tibet, where an increased loss of area for the 2001-2009 period, 6% area loss (Bolch et al., 2010) was observed. The nearby Yemayundrung Glacier retreat is similar. Here we examine changes in this glacier using Landsat imagery and Google Earth from 1995-2014.

midui glacier 1995
1995 Landsat image

midui glacier 2014 landsat
2014 Landsat image

In the Landsat images above in 1995 the glacier terminates in a proglacial lake at the red arrow. A ridge separates two tributaries each with an icefall creating ogives, purple arrow. There are ogives below a pair of icefalls at the yellow arrow. The tributaries are separated by a medial moraine orange arrow. By 2014 retreat has led to expansion of the lake at the terminus. The retreat is 300 meters during this 20 year period. The icefall on the right, east side of the glacier, is no longer producing significant ogives and the bare glacier ice has been replaced with extensive debris cover, yellow arrow. Both the ridge and medial moraine separating the tributaries have expanded in width as the glacier has thinned.

A series of comparison images from Google Earth in 2001 and 2014 further illustrate the changes noted above.

In the first pair the terminus change and lake expansion is evident at the red arrow. Debris cover expansion at the lateral moraine area with thinning of the eastern tributary is notable at the yellow arrow.

The second pair is the terminus reach. A series of depressions are noted with each yellow arrow, indicated by concentric crevassing. This indicates collapse due to a subglacial basin/lake. Further this indicates a stagnant collapsing terminus area in the lower 1.5 km of the glacier.

The last pair is the icefall region indicating reduced crevassing below the lefthand icefall, pink arrow and the expanding medial moraine yellow arrow. It is clear that this glacier is going to continue to retreat in the coming decades, and the rate is going to increase in the near future as the collapsing sections of the terminus melt away. There is still considerable glacier area that remains snowcovered each year, and it can survive current climate and some additional warming. The snowline on the glacier is at 5000-5100 m and the head of the glacier is at 6100 m.
midui glacier comp
Midui Glacier comparison from Google Earth

midui terminus comp
Midui Terminus comparison from Google Earth

midui icefall
Midui Icefall comparison from Google Earth

Menlung Glacier Rapid Retreat & Lake Expansion, Tibet, China 1992-2014

Menlung Glacier is one valley north of the China/Tibet border with Nepal and on the south side of Menlungste Peak. Menlung Glacier has a glacier lake at its terminus that is dammed by the glacier’s moraine. The glacier began to withdraw from the moraine and the lake began to develop after the 1951 expedition to the area. The glacier lake is at 5050 meters, the glacier descends from 7000 meters with the snowline recently around 5500 meters. The lower section of the glacier is heavily debris covered, which when the debris is more than several centimeters thick as in most areas here, reduces the rate of glacier melt. Melt is highest around the supraglacial lakes (shallow lakes on glacier surface), which can lead to the lakes expanding and coalescing. Benn (2001) examined the process on nearby Ngozumpa Glacier, Nepal. This region has experienced significant mass loss of -0.25 m/year from 2000-2010 (Gardelle et al, 2013). The Japanese Aerospace Exploration Agency has a side by side 1996 and 2007 satellite imagery that indicates the Menlung Glacier Lake developing in 1996 that still has remnant glacier ice in it, that is melted by 2007. Here we use Landsat imagery and Google Earth imagery to identify the changes from 1992-2014.

menlung glacier 1992
1992 Landsat image: In each image the pink arrow is the 1992 terminus, the yellow arrow the 2014 terminus, the green arrow the furthest downglacier extend of clean glacier ice and the red arrow the lower margin of a tributary glacier in 2014.

In Landsat imagery from 1992 the lake is still developing from a system of supraglacial lakes interspersed with debris covered stagnant glacier sections. In 1994 there is little change, other than some of the lakes are frozen. In 2001 a contiguous lake has formed that is 500 m long and 600 m wide, though the main glacier front has changed little. The lake rapidly expanded to a length of 1900 meters by 2009. The glacier retreat is 500 meters, the other 300 meters of lake expansion is a continued growth at the moraine end of the lake as ice cored moraine continues to melt. By 2013 the lake has extended to a length of 2250 m, due solely to further glacier retreat. In 2014 has experienced a further 50-100 m of retreat from 2013. The lake is now 2300 m long, and is turning a darker blue color as the amount of glacier flour in it diminishes. A comparison of the terminus and lake using Google Earth images from 2005 and 2014 indicate the rapid lake growth in the last decade. The lower portion of the glacier remains debris covered, and appears stagnant, but has significant supraglacial lakes only with 400 meters of the 2014 terminus, suggesting the period of rapid retreat is nearly over. The region above the terminus in 2014 is dissected by a significant surface glacier stream that extends 2.5 km upglacier to the beginning of the first sections of debris free ice. That the river stays on the surface so long indicates the lack of crevassing and the stagnant nature of the ice. From 1992 to 2014 the area of clean glacier ice has also migrated 1 km upglacier, green arrows. The red arrows indicate a smaller glacier that has retreated further from the lake and has developed some substantial bedrock areas amidst the lower glacier between 1992 and 2014. The retreat and lake expansion parallels that seen at Longbasba, Reqiang, Sepu Kangri and Ngozumpa Glacier.

menlung glacier 1994
1994 Landsat image

menlung glacier 2001
2001 Landsat image

menlung glacier 2009
2009 Landsat image

menlung glacier 2013
2013 Landsat image

menlung glacier 2014
2014 Landsat image

menlung glacier compare
2005 and 2014 Google Earth image comparison
menlung terminus 2014
2014 Google Earth images. Black arrows indicate supraglacial stream.

Himalayan Glacier Change Index

Himalaya Range Glacier Change Below is a list of individual glaciers in the Himalaya that illustrate what is happening glacier by glacier. In addition to the individual sample glaciers we tie the individual glaciers to the large scale changes of approximately 10,000 glaciers that have been examined in repeat satellite image inventories. In the Himalayan Range, stretching from the Karokaram Range in NW India east south east to the border region of Bhutan and China,  detailed glacier mapping inventories, from GLIMS: (Global Land Ice Measurements from Space), ICIMOD (International Centre for Integrated Mountain Development), ISRO ( Indian Space Research Organisation) and Chinese National Committee for International Association of Cryospheric Science (IACS) of thousands of glaciers have indicated increased strong thinning and area loss since 1990 throughout the the Himalayan Range. The inventories rely on repeat imagery from ASTER, Corona, Landsat, IKONOS and SPOT imagery. It is simply not possible to make observations on this number of glaciers in the field.  This is an update to the assessment by Pelto (2012) in the BAMS State of the Climate, which was the source of a Skeptical Science article as well

Kali Gandaki Headwaters, Nepal——–Ngozumpa Glacier, Nepal

Khumbu Glacier, Nepal ————         West Barun Glacier, Nepal 

Imja Glacier, Nepal ——–                       Nobuk Glacier, Nepal

Lumding Glacier, Nepal———-

Milam Glacier, India————                Samudra Tupa, India

Ratangrian Glacier, India———–       Khatling Glacier, India

Satopanth Glacier, India———-         Durung Drung Glacier, India

Gangotri Glacier, India————         Warwan Basin, India

Sara Umaga Glacier, India—–          Malana Glacier, India 

Jaonli Glacier, India——–                  Kalabaland Glacier, India  

Jaundhar Barak, India———–         Burphu Glacier, India

Changsang Glacier, Sikkim—–     Zemu Glacier, Sikkim 

South Lhonak Glacier, Sikkim——North Lhonak Glacier, Sikkim

Theri Kang Glacier, Bhutan———-Luggi Glacier, Bhutan

Mangde Chu Glacier, Bhutan——–Thorthormi Glacier, Bhutan

Menlung Glacier, Tibet———-       Yejyumaro Glacier, Tibet

Lumding Glacier, Tibet—-             Rongbuk Glacier, Tibet

Sepu Kangri, China———–          Longbasba Glacier, Tibet

Jiongla Glacier, Tibet———-        Bode Zanbo Headwaters, Tibet

Zayul Chu Headwaters, TibetBoshula Glaciers, Tibet

Matsang Tsanpo Gl, Tibet—–    Reqiang Glacier, Tibet 

Himalaya-Small

In Garhwal Himalaya, India, of 58 glaciers examined from 1990-2006 area loss was 6% (Bhambri et al, 2011). They also noted the number of glaciers increased from 69 (1968) to 75 (2006) due to the disintegration of ice bodies. Examination of 466 glaciers in the Chenab, Parbati and Baspa Basin, India found a 21% decline in glacier area from 1962 to 2004 (Kulkarni, 2007). Glacier fragmentation was also observed in this study, which for some fragments represents a loss of the accumulation area, which means the glacier will not survive (Pelto, 2010). The India glacier inventory (ISRO, 2010) identified glacier area losses and frontal change on 2190 glaciers and found an area loss rate of 3.3% per decade and 76% of glaciers retreating. (Kulkarni, 2014) reports on Indian Himalyan glaciers  that 79 of 80 with terminus change records have been receding.

In the Nepal Himalaya area loss of 3808 glaciers from 1963-2009 is nearly 20% (Bajracharya et al., 2011). The Langtang sub-basin is a small northeast-southwest elongated basin, tributary of Trishuli River north of Kathmandu and bordered with China to the north. The basin contained 192 km2 of glacier area in 1977, 171 km2 in 1988, 152 km2 in 2000 and 142 km2 in 2009. In 32 years from 1977 to 2009 the glacier area declined by 26% (Bajracharya et al., 2011). In the Khumbu region, Nepal volume losses increased from an average of 320 mm/yr 1962-2002 to 790 mm/yr from 2002-2007, including area losses at the highest elevation on the glaciers (Bolch et al., 2011).  The Dudh Koshi basin is the largest glacierized basin in Nepal. It has 278 glaciers of which 40, amounting to 70% of the area, are valley-type. Almost all the glaciers are retreating at rates of 10–59 m/year and the rate has accelerated after 2001 (Bajracharya and Mool, 2009).  ICIMOD (2013) completed an inventory of Nepal glaciers and found a 21% decline in area from the 1970’s to 2007/08.  ICIMOD has developed an  map viewer application for examining the changes through time.

An inventory of 308 glaciers in the Nam Co Basin, Tibet, noted an increased loss of area for the 2001-2009 period, 6% area loss (Bolch et al., 2010). Zhou et al (2009) looking at the Nianchu River basin southern Tibet found a 5% area loss. 1990-2005. In the Pumqu Basin, Tibet an inventory of 999 glacier from the 1974 & 1983 to 2001 indicated the loss of 9% of the glacier area and 10% of the glaciers disappeared (Jin et al, 2005). The high elevation loss is also noted in Tibet on Naimona’nyi Glacier which has not retained accumulation even at 6000 meters. This indicates a lack of high altitude snow-ice gain (Kehrwald et al, 2008).

A new means of assessing glacier volume is GRACE, which cannot look at specific changes of individual glaciers or watersheds. In the high mountains of Central Asia GRACE imagery found mass losses of -264 mm/a for the 2003-2009 period (Matsuo and Heki, 2010). This result is in relative agreement with the other satellite image assessments, but is at odds with the recent global assessment from GRACE, that estimated Himalayan glacier losses at 10% of that found in the aforementioned examples for volume loss for the 2003-2010 period (Jacobs et al, 2012). At this point the detailed glacier by glacier inventories inventories of thousands of glaciers are better validated and illustrate the widespread significant loss in glacier area and volume, though not all glaciers are retreating. This page will continue to be updated as new inventory data is published and new individual glaciers are examined herein. Yao et al (2012) in an examination of Tibetan glaciers observed substantial losses of 7090 glaciers.  Bolch et al (2012) in a report on the “State and Fate of Himalayan Glaciers” noted that most Himalayan glacier are losing mass and retreating at rates similar to the rest of the globe.  ICIMOD has also developed an application illustrating changes of glaciers in Bhutan.

Menlung Glacier Retreat, Tibet Glacier Moraine Dammed Lake Expansion

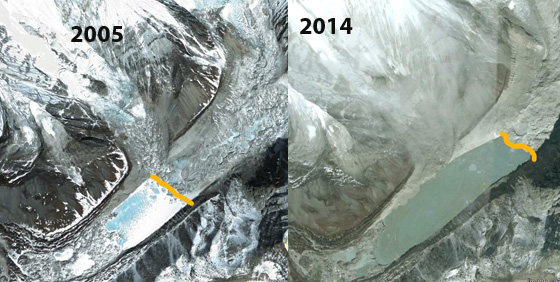
Menlung Glacier is one valley north of the Tibetan border with Nepal and on the south side of Menlungste Peak. Menlung Glacier has a glacier lake at its terminus that is dammed by the glaciers moraine (27.95 N, 86.45 E). The glacier began to withdraw from the moraine and the lake form after the 1951 expedition to the area. The glacier lake is at 5050 meters, the glacier descends from 7000 meters with the snowline recently around 5500 meters. The Japanese Aerospace Exploration Agency has a side by side 1996 and 2007 satellite imagery that indicates the Menlung Glacier Lake developing in 1996 that still has remnant ice masses in it, that are gone by 2007. In Landsat imagery from 1992 the lake is still developing from a system of supraglacial lakes. Turning to better imagery available to the public in Google Earth in 2005 the lake has a contiguous area of with a length of 1100 meters and width of 700 meters (top). The lake rapidly expanded to a length of 1900 meters by 2009. The glacier retreat is 500 meters, the other 300 meters of expansion is a continued growth at the moraine end of the lake as ice cored moraine continues to melt (bottom). The lake is now substantial and still growing rapidly, with the rapidly melting terminus (black arrow). A look at the glacier surface indicates a large stream on the surface of the glacier that extends 2000 meters up glacier from the terminus (green arrow). This type of feature can only form on stagnant ice, otherwise movement generating crevasses would give a path for the stream to drain to the glacier bottom as is typical. The snowline in this 2009 image is at the blue arrow. . The retreat and lake expansion parallels that seen at Theri Kang and Imja Glacier.

Satopanth Glacier Retreat-Debris Cover and Hydropower

Satopanth and Bhagirath Kharak glaciers are located at the headwaters of the Alaknanda River, Uttarakhand, India. Satopanth glaciers has been assessed for the 1962-2006 period by Nainwal and others 2008 . This is accomplished through a comparsion of the 1962 Survey of India map and a total station survey completed in 2006 since 1962. Examination of satellite imagery indicates a retreat of 1900 meters from the Little Ice Age moraine that is evident. Satopanth Glacier has retreated continuously during this period. The total recession of the terminus which is at 3870 meters ranges from 1160 meters to 880 meters depending where on the glacier front retreat is measured, the average rate is reported as 22 meters per year (Nainwal and others, 2008), , for a total average retreat of 970 meters. The image of the terminus below is from the work of Nainwal and colleagues at Garhwal University.(Nainwal and others, 2008) . The glacier has an equilibrium line altitude of 4800 meters, below 4700 meters the glacier is dominantly debris covered, the mean elevation of the glacier is, above the ELA, at 4900 meters. This debris cover is thick enough to retard ablation and also prevent black carbon from enhancing ablation on this section of the glacier. This glacier has a similar behavior, but a more limited accumulation zone than Gangotri Glacier or Khumbu Glacier. The transition zone where the glacier is not debris covered and there is significant melting comprises 20% of the glacier. The remaining 30% of the glacier is in the dry snow zone, where melting is limited and hence black carbon again has a limited role. The recession of this glacier is slowed by the debris cover. An alpine glacier needs a minimum of 50% of its area to be in the accumulation zone to be in equilibrium, this glacier has 40% of its area in the accumulation zone, hence retreat will continue. The debris covered area is illustrated in the first image below, the ELA in the second image and the accumulation zone in the third image. It is apparent that the zone of melting (ablation) is significantly larger than the accumulation zone.Run of river hydropower projects to yield 140 MW have been proposed for the upper Alaknanda River basin. Satopanth Glacier will be a key contributor to this project.
Gangotri Glacier Retreat Continues 2013 and Hydropower

In India the Gangotri Glacier is the largest glacier at the headwaters of the Bhagirathi River. The false-color image below provided by NASA shows the retreat of Gangotri Glacier, situated in the Uttarkashi District of Garhwal Himalaya. It is one of the larger glaciers in the Himalaya, and like all of the nearby Himalayan glaciers is retreating significantly. The Bharigrathi River has the Tehri Dam, a 2400 mw hydropower facility. With an area of 286 square kilometers Gangotri Glacier (Singh and others, 2006) provides up to 190 cubic meters per second of runoff for this river. Gangotri Glacier provides hydropower as it passes three hydropower plants generating 1430 MW, including the 1000 MW Tehri Dam and reservoir and maneri Bhali I and II, see map below. The Tehri also provides flood control, such as this past week of June 17, 2013. The Tehri Reservoir level rose 25 m within 48 hours which is a storage of approximately 1.3 billion cubic meters. Below is a view of the Tehri Reservoir, images of the dam and its operations are here. Bhagirathi 150411
Map from the Southeast Asian Network on Dams, Rivers and People
tehri dam map 2007Gangotri Glacier retreated 26.5 meters per year form 1935-1971. From 1968-2006 the glacier retreated 800 meters, close to 20 meters per year (Bhambri et al, 2012). Srivastava et al (2013) indicate the retreat rate of 21 m/ year from 2004-2010. The glacier continues to thin and tributary inflow decline, while the thick heavily insulated by debris terminus retreat is slow. Srivastava (2012) published a report with numerous terminus pictures though they do not have a common reference point beginning on page 90. Where the river exits the glacier is referred to as Gomukh.
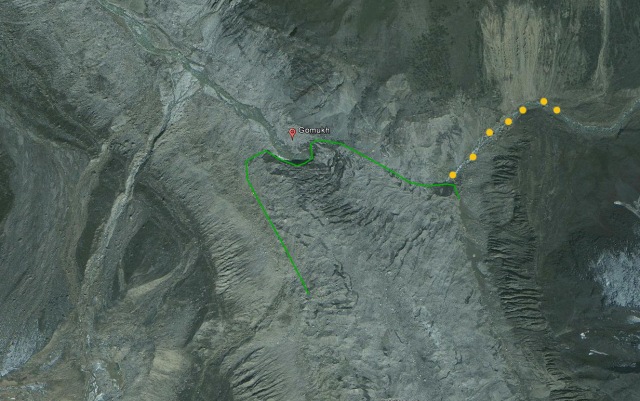
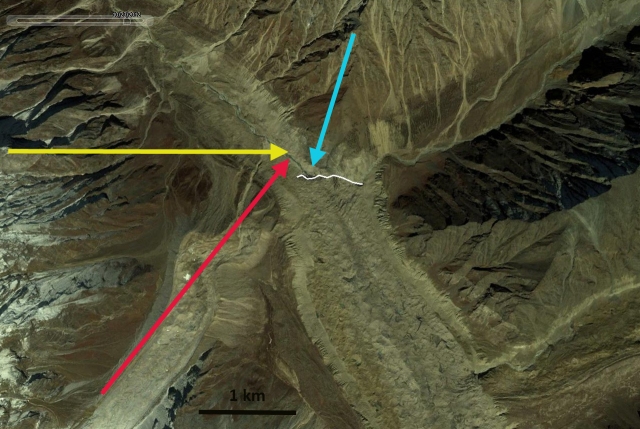
Here we compare both Landsat and Google Earth images during the 2000-2013 period. First the 2000 and 2013 Landsat images. A 2000 and 2013 landsat image pinpoint the terminus change, the yellow and red arrows converge on the 2000 location of Gomukh. The blue arrow indicates the mouth of a side valley from the east that is at the terminus in 2013 and actively cutting the face, which is not the case in 2000. The orange dots indicate the course of this stream. A 2006 Cartosat image from Bhambri et al (2012) can be compared to the 2010 and 2013 Google Earth images. In Google Earth the 2010 image gives a clear view of Gomukh which can be compared to the 2006 Cartosat image from Bhambri et al (2012). In 2000 and even 2006 this was not the case. A 2013 Google earth also indicates this point,with the glacier having retreated to the side valley from the east. The retreat from the location of Gomukh in 2000 to 2013 is 240-270 m, approximately 20 m per year as noted by Srivastava et al (2013) for a shorter interval.
gangotri Glacier 2000
2000 Landsat image

gangotri glacier 2013
2013 Landsat image

.
2006 Cartosat image

gangotri 2010
2010 Google Earth image

gangotri 2013 ge
2013 Google Earth image
Gangotri 2013
2013 Google Earth image

This glaciers remains over 30 km long, and is not in danger of disappearing anytime soon. The lower section of the glacier is heavily debris covered, which slows melting. The debris cover prevents black carbon-soot from enhancing melt over most of the ablation zone. The upper reaches of the glacier extends above 6000 meters and remains snow covered even during the summer melt season June-August, as this is also a main accumulation season due to the summer monsoon. This is different from other alpine regions, where the melt season is also the dry season, here it coincides with the wet season and the accumulation season on the upper glacier. Compare the differences in hydrographs from Thayyen and Gergen (2009) Figure 3 and 4. The new snowcover on the upper glacier also limits the impact of black carbon or soot on ablation. The glacier is fed from avalanches off of the even larger area of mountains above 6000 meters adjacent to it. This is one of many glacier in the Himalaya that is being tapped for hydropower. The retreat is slower than that of nearby Malana Glacier and Samudra Tupa Glacier but similar to Durung Drung Glacier.